Exhibit 13
Five-year Consolidated Financial Highlights | 6 |
Management Discussion and Analysis | 7 |
Consolidated Financial Statements | 28 |
Notes to Consolidated Financial Statements | 32 |
Report of Independent Registered Public Accounting Firm | 66 |
Other Financial Data | 67 |
Common Stock Information | 68 |
Selected Quarterly Financial Data | 69 |
Corporate and Shareholder Information | Inside Back Cover |
Directors and Officers | Inside Back Cover |
HMN Financial, Inc. and Home Federal Savings Bank are headquartered in Rochester, Minnesota. Home Federal Savings Bank operates twelve full service offices in Minnesota located in Albert Lea, Austin, Eagan, Kasson (2), La Crescent, Rochester (4), Spring Valley and Winona; one full service office in Marshalltown, Iowa; and three loan origination offices located in Sartell, Minnesota, Owatonna, Minnesota and Delafield, Wisconsin.
FIVE-YEAR CONSOLIDATED FINANCIAL HIGHLIGHTS
Selected Operations Data: | | Year Ended December 31, | |
(Dollars in thousands, except per share data) | | 2015 | | | 2014 | | | 2013 | | | 2012 | | | 2011 | |
Total interest income | | $ | 21,453 | | | | 20,613 | | | | 22,983 | | | | 30,816 | | | | 39,541 | |
Total interest expense | | | 1,507 | | | | 1,211 | | | | 3,289 | | | | 7,139 | | | | 11,135 | |
Net interest income | | | 19,946 | | | | 19,402 | | | | 19,694 | | | | 23,677 | | | | 28,406 | |
Provision for loan losses | | | (164 | ) | | | (6,998 | ) | | | (7,881 | ) | | | 2,544 | | | | 17,278 | |
Net interest income after provision for loan losses | | | 20,110 | | | | 26,400 | | | | 27,575 | | | | 21,133 | | | | 11,128 | |
Fees and service charges | | | 3,316 | | | | 3,458 | | | | 3,513 | | | | 3,325 | | | | 3,739 | |
Loan servicing fees | | | 1,046 | | | | 1,058 | | | | 1,029 | | | | 964 | | | | 987 | |
Gain on sales of loans | | | 1,964 | | | | 1,828 | | | | 2,102 | | | | 3,574 | | | | 1,656 | |
Gain on acquisition/sale of branch office | | | 289 | | | | 0 | | | | 0 | | | | 552 | | | | 0 | |
Other non-interest income | | | 1,038 | | | | 940 | | | | 668 | | | | 575 | | | | 487 | |
Total non-interest income | | | 7,653 | | | | 7,284 | | | | 7,312 | | | | 8,990 | | | | 6,869 | |
Total non-interest expense | | | 23,196 | | | | 21,403 | | | | 22,623 | | | | 24,670 | | | | 29,552 | |
Income (loss) before income tax expense (benefit) | | | 4,567 | | | | 12,281 | | | | 12,264 | | | | 5,453 | | | | (11,555 | ) |
Income tax expense (benefit) | | | 1,611 | | | | 4,902 | | | | (14,406 | )(1) | | | 132 | | | | 0 | |
Net income (loss) | | | 2,956 | | | | 7,379 | | | | 26,670 | | | | 5,321 | | | | (11,555 | ) |
Preferred stock dividends and discount | | | (108 | ) | | | (1,710 | ) | | | (2,068 | ) | | | (1,861 | ) | | | (1,821 | ) |
Net income (loss) available to common shareholders | | $ | 2,848 | | | | 5,669 | | | | 24,602 | | | | 3,460 | | | | (13,376 | ) |
| | | | | | | | | | | | | | | | | | | | | |
Basic earnings (loss) per common share | | $ | 0.69 | | | | 1.40 | | | | 6.15 | | | | 0.88 | | | | (3.47 | ) |
Diluted earnings (loss) per common share | | | 0.61 | | | | 1.23 | | | | 5.71 | | | | 0.86 | | | | (3.47 | ) |
(1) Relates to the elimination of the deferred tax asset valuation reserve at December 31, 2013. |
Selected Financial Condition Data: | | December 31, | |
(Dollars in thousands, except per share data) | | 2015 | | | 2014 | | | 2013 | | | 2012 | | | 2011 | |
Total assets | | $ | 643,161 | | | | 577,426 | | | | 648,622 | | | | 653,327 | | | | 790,155 | |
Securities available for sale | | | 111,974 | | | | 137,834 | | | | 107,956 | | | | 85,891 | | | | 126,114 | |
Loans held for sale | | | 3,779 | | | | 2,076 | | | | 1,502 | | | | 2,584 | | | | 3,709 | |
Loans receivable, net | | | 463,185 | | | | 365,113 | | | | 384,615 | | | | 454,045 | | | | 555,908 | |
Deposits | | | 559,387 | | | | 496,750 | | | | 553,930 | | | | 514,951 | | | | 656,176 | |
FHLB advances and other borrowings | | | 9,000 | | | | 0 | | | | 0 | | | | 70,000 | | | | 70,000 | |
Stockholders’ equity | | | 69,645 | | | | 76,013 | | | | 85,675 | | | | 60,834 | | | | 57,061 | |
Book value per common share | | | 15.54 | | | | 14.77 | | | | 13.49 | | | | 8.02 | | | | 7.36 | |
| | | | | | | | | | | | | | | | | | | | | |
Number of full service offices | | | 13 | | | | 11 | | | | 11 | | | | 12 | | | | 13 | |
Number of loan origination offices | | | 3 | | | | 2 | | | | 1 | | | | 1 | | | | 1 | |
| | | | | | | | | | | | | | | | | | | | | |
Key Ratios:(2) | | | | | | | | | | | | | | | | | | | | |
Stockholders’ equity to total assets at year end | | | 10.83 | % | | | 13.16 | % | | | 13.21 | % | | | 9.31 | % | | | 7.22 | % |
Average stockholders’ equity to average assets | | | 11.70 | | | | 13.25 | | | | 10.77 | | | | 8.81 | | | | 8.19 | |
Return (loss) on stockholders’ equity (ratio of net income (loss) to average equity) | | | 4.27 | | | | 9.12 | | | | 42.22 | | | | 8.94 | | | | (16.94 | ) |
Return (loss) on assets (ratio of net income (loss) to average assets) | | | 0.50 | | | | 1.21 | | | | 4.55 | | | | 0.79 | | | | (1.39 | ) |
(2)Average balances were calculated based upon amortized cost without the market value impact of ASC 320. |
MANAGEMENT DISCUSSION AND ANALYSIS
This Annual Report, other reports filed by the Company with the Securities and Exchange Commission, and the Company’s proxy statement may contain forward-looking statements within the meaning of the safe harbor provisions of the Private Securities Litigation Reform Act of 1995. These statements are often identified by such forward-looking terminology as “expect,” “intend,” “look,” “believe,” “anticipate,” “estimate,” “project,” “seek,” “may,” “will,” “would,” “could,” “should,” “trend,” “target,” and “goal” or similar statements or variations of such terms and include, but are not limited to, those relating to increasing our core deposit relationships, improving credit quality, reducing non-performing assets, growing earning assets, generating improved financial results (including profitability); the adequacy and amount of available liquidity and capital resources to the Bank; the Company’s liquidity and capital requirements; our expectations for core capital and our strategies and potential strategies for improvement thereof; improvements in loan production; changes in the size of the Bank’s loan portfolio; the amount of the Bank’s non-performing assets and the appropriateness of the allowance therefor; our ability to complete the acquisition of certain assets from Deerwood Bank and integrate its operations; anticipated future levels of the provision for loan losses; future losses on non-performing assets; the amount and mix of interest-earning assets; the amount and mix of interest-bearing liabilities; the availability of alternate funding sources; the payment of dividends by HMN; the future outlook for the Company; the amount of dividends paid by the Federal Home Loan Bank (FHLB) on its stock; the amount of deposits that will be withdrawn from checking and money market accounts and how the withdrawn deposits will be replaced; the projected changes in net interest income based on rate shocks; the range that interest rates may fluctuate over the next twelve months; the net market risk of interest rate shocks; the future outlook for the issuer trust preferred securities held by the Bank; the ability of the Bank to pay dividends to HMN; the ability of HMN to pay the principal and interest payments on its third party note payable; the ability to remain well capitalized; and compliance by the Bank with regulatory standards generally (including the Bank’s status as “well-capitalized”) and other supervisory directives or requirements to which the Company or the Bank are or may become expressly subject, specifically, and possible responses of the Office of the Comptroller of the Currency (OCC), Board of Governors of the Federal Reserve System (FRB), the Bank, and the Company to any failure to comply with any such regulatory standard, directive or requirement.
A number of factors could cause actual results to differ materially from the Company’s assumptions and expectations. These include but are not limited to the adequacy and marketability of real estate and other collateral securing loans to borrowers; federal and state regulation and enforcement; possible legislative and regulatory changes, including additional changes to regulatory capital rules; the ability of the Bank to comply with other applicable regulatory capital requirements; enforcement activity of the OCC and FRB in the event of our non-compliance with any applicable regulatory standard or requirement; adverse economic, business and competitive developments such as shrinking interest margins, reduced collateral values, deposit outflows, changes in credit or other risks posed by the Company’s loan and investment portfolios; changes in costs associated with alternate funding sources, including changes in collateral advance rates and policies of the FHLB; technological, computer-related or operational difficulties; results of litigation; reduced demand for financial services and loan products; changes in accounting policies and guidelines, or monetary and fiscal policies of the federal government or tax laws; international economic developments; the Company’s access to and adverse changes in securities markets; the market for credit related assets; the future operating results, financial condition, cash flow requirements and capital spending priorities of the Company and the Bank; the availability of internal and, as required, external sources of funding; acquisition integration costs; our ability to attract and retain employees; or other significant uncertainties. Additional factors that may cause actual results to differ from the Company’s assumptions and expectations include those set forth in the Company’s most recent filings on Forms 10-K and 10-Q with the Securities and Exchange Commission. All forward-looking statements are qualified by, and should be considered in conjunction with, such cautionary statements. For additional discussion of the risks and uncertainties applicable to the Company, see the “Risk Factors” sections of the Company’s Annual Report on Form 10-K for the year ended December 31, 2015.
All statements in this Annual Report, including forward-looking statements, speak only as of the date hereof, and we undertake no duty to update any of the forward-looking statements after the date of this Annual Report.
Overview
HMN Financial, Inc. (HMN or the Company) is the stock savings bank holding company for Home Federal Savings Bank (the Bank), which operates community banking and loan production offices in Minnesota, Iowa and Wisconsin. The earnings of the Company are primarily dependent on the Bank's net interest income, which is the difference between interest earned on loans and investments, and the interest paid on interest-bearing liabilities such as deposits and other borrowings. The difference between the average rate of interest earned on assets and the average rate paid on liabilities is the "interest rate spread". Net interest income is produced when interest-earning assets equal or exceed interest-bearing liabilities and there is a positive interest rate spread. Net interest income and net interest rate spread are affected by changes in interest rates, the volume and mix of interest-earning assets and interest-bearing liabilities, and the level of non-performing assets. The Company's net earnings are also affected by the generation of non-interest income, which consists primarily of gains from the sale of loans and real estate owned, fees for servicing loans, commissions on the sale of uninsured investment products, and service charges on deposit accounts. The Bank incurs expenses in addition to interest expense in the form of salaries and benefits, occupancy expenses, provisions for loan losses, deposit insurance, amortization expense on mortgage servicing assets, data processing costs and income taxes. The earnings of financial institutions, such as the Bank, are also significantly affected by prevailing economic and competitive conditions, particularly changes in interest rates, government monetary and fiscal policies, and regulations of various regulatory authorities. Lending activities are influenced by the demand for and supply of business credit, single-family and commercial properties, competition among lenders, the level of interest rates and the availability of funds. Deposit flows and costs of deposits are influenced by prevailing market rates of interest on competing investments, account maturities and the levels of personal income and savings.
MANAGEMENT DISCUSSION AND ANALYSIS
Critical Accounting Estimates
Critical accounting policies are those policies that the Company's management believes are the most important to understanding the Company’s financial condition and operating results. These critical accounting policies often involve estimates and assumptions that could have a material impact on the Company’s financial statements. The Company has identified the following critical accounting policies that management believes involve the most difficult, subjective, and/or complex judgments that are inherently uncertain. Therefore, actual financial results could differ significantly depending upon the estimates, assumptions and other factors used.
Allowance for Loan Losses and Related Provision
The allowance for loan losses is based on periodic analysis of the loan portfolio and is maintained at an amount considered to be appropriate by management to provide for probable losses inherent in the loan portfolio as of the balance sheet dates. In this analysis, management considers factors including, but not limited to, specific occurrences of loan impairment, actual and anticipated changes in the size of the portfolios, national and regional economic conditions such as unemployment data, loan delinquencies, local economic conditions, demand for single-family homes, demand for commercial real estate and building lots, loan portfolio composition and historical loss experience and observations made by the Company's ongoing internal audit and regulatory exam processes. Loans are charged off to the extent they are deemed to be uncollectible. The Company has established separate processes to determine the appropriateness of the loan loss allowance for its homogeneous single-family and consumer loan portfolios and its non-homogeneous loan portfolios. The determination of the allowance on the homogeneous single-family and consumer loan portfolios is calculated on a pooled basis with individual determination of the allowance for all non-performing loans. The determination of the allowance for the non-homogeneous commercial, commercial real estate and multi-family loan portfolios involves assigning standardized risk ratings and loss factors that are periodically reviewed. The loss factors are estimated based on the Company's own loss experience and are assigned to all loans without identified credit weaknesses. For each non-performing loan, the Company also performs an individual analysis of impairment that is based on the expected cash flows or the value of the assets collateralizing the loans and establishes any necessary reserves or charges off all loans, or portions thereof, that are deemed uncollectable.
The appropriateness of the allowance for loan losses is dependent upon management’s estimates of variables affecting valuation, appraisals of collateral, evaluations of performance and status, and the amounts and timing of future cash flows expected to be received on impaired loans. Such estimates, appraisals, evaluations and cash flows may be subject to adjustments due to changing economic prospects of borrowers or properties. The fair market value of collateral dependent loans are typically based on the appraised value of the property less estimated selling costs. The estimates are reviewed periodically and adjustments, if any, are recorded in the provision for loan losses in the periods in which the adjustments become known. Because of the size of some loans, changes in estimates can have a significant impact on the loan loss provision. The allowance is allocated to individual loan categories based upon the relative risk characteristics of the loan portfolios and the actual loss experience. The Company increases its allowance for loan losses by charging the provision for loan losses against income and decreases its allowance by crediting the provision for loan losses and recoveries of previously charged off loans. The activity in the allowance in 2015 resulted in a credit to the loan loss provision. The methodology for establishing the allowance for loan losses takes into consideration probable losses that have been identified in connection with specific loans as well as losses in the loan portfolio that have not been specifically identified. Although management believes that based on current conditions the allowance for loan losses is maintained at an appropriate amount to provide for probable loan losses inherent in the portfolio as of the balance sheet dates, future conditions may differ substantially from those anticipated in determining the allowance for loan losses and adjustments may be required in the future.
MANAGEMENT DISCUSSION AND ANALYSIS
Income Taxes
Deferred tax assets and liabilities are recognized for the future tax consequences attributable to temporary differences between the financial statement carrying amounts of existing assets and liabilities and their respective tax basis. Deferred tax assets and liabilities are measured using enacted tax rates expected to apply to taxable income in the years in which those temporary differences are expected to be recovered or settled. The effect on deferred tax assets and liabilities of a change in tax rates is recognized in income in the period that includes the enactment date. These calculations are based on many complex factors including estimates of the timing of reversals of temporary differences, the interpretation of federal and state income tax laws, and a determination of the differences between the tax and the financial reporting basis of assets and liabilities. Actual results could differ significantly from the estimates and interpretations used in determining the current and deferred income tax assets and liabilities.
The Company maintains significant net deferred tax assets for deductible temporary differences, the largest of which relates to the allowance for loan and real estate losses and net operating loss carryforwards. For income tax purposes, only net charge-offs are deductible, not the entire provision for loan losses. Under generally accepted accounting principles, a valuation allowance is required to be recognized if it is “more likely than not” that the deferred tax asset will not be realized. The determination of the realizability of the deferred tax assets is highly subjective and dependent upon management’s judgment and evaluation of both positive and negative evidence, including the forecasts of future income, tax planning strategies, and assessments of the current and future economic and business conditions. The Company considers both positive and negative evidence regarding the ultimate realizability of deferred tax assets. Positive evidence includes the Company’s cumulative net income in the prior three year period, the ability to implement tax planning strategies to accelerate taxable income recognition, and the probability that taxable income will be generated in future periods. It is possible that future conditions may differ substantially from those anticipated in determining that no valuation allowance was required on deferred tax assets and adjustments may be required in the future.
Determining the ultimate settlement of any tax position requires significant estimates and judgments in arriving at the amount of tax benefits to be recognized in the financial statements. It is possible that the tax benefits realized upon the ultimate resolution of a tax position may result in tax benefits that are significantly different from those estimated.
Accounting for Loans Acquired in a Business Combination
Loans acquired in a business combination are initially recorded at their acquisition date fair values. The fair values of the purchased loans are based on the present value of the expected cash flows, including principal, interest and prepayments. Periodic principal and interest cash flows are adjusted for expected losses and prepayments, then discounted to determine the present value and summed to arrive at the estimated fair value. Fair value estimates involve assumptions and judgments as to credit risk, interest rate risk, prepayment risk, liquidity risk, default rates, loss severity, payment speeds, collateral values and discount rate. Purchased loans are divided into loans with evidence of credit quality deterioration, which are accounted for under ASC topic 310-30 (purchased credit impaired (PCI)) and loans that do not meet this criteria, which are accounted for under ASC topic 310-20 (performing). PCI loans have experienced a deterioration of credit quality from origination to acquisition for which it is probable that the Bank will not be able to collect all principal and interest payments on the loan. In the assessment of credit quality, numerous assumptions, interpretations and judgments must be made, based on internal and third-party credit quality information and ultimately the determination as to the probability that all contractual cash flows will not be able to be collected. This is a point in time assessment and inherently subjective due to the nature of the available information and judgment involved.
Subsequent to the acquisition date, the Bank continues to estimate the amount and timing of cash flows expected to be collected on PCI loans. The present value of any decreases in expected cash flows after the acquisition date will generally result in an impairment charge recorded as a provision for loan losses, resulting in an increase to the allowance for loan losses. Increases in expected cash flows will generally result in a recovery of any previously recorded allowance for loan losses, to the extent applicable, and/or a reclassification from the nonaccretable difference to accretable yield, which will be recognized prospectively. For acquired performing loans, the difference between the acquisition date fair value and the contractual amounts due at the acquisition date represents the fair value adjustment. Fair value adjustments may be discounts or premiums to a loan's cost basis and are accreted or amortized into interest income over the loan's remaining life using the level yield method.
Subsequent to the acquisition date, the methods utilized to estimate the required allowance for loan losses for these loans is similar to originated loans. See“Note 2 Acquisitions” and“Note 6 Allowance for Loan Losses and Credit Quality Information” in the Notes to Consolidated Financial Statements for more information regarding acquired loan disclosures.
MANAGEMENT DISCUSSION AND ANALYSIS
Results of Operations
Comparison of 2015 with 2014
Net income was $3.0 million for 2015, a decrease of $4.4 million, from $7.4 million for 2014. Net income available to common shareholders was $2.8 million for the year ended December 31, 2015, a decrease of $2.9 million, from net income available to common shareholders of $5.7 million for 2014. Diluted earnings per common share for the year ended December 31, 2015 was $0.61, a decrease of $0.62 compared to the diluted earnings per common share of $1.23 for the year ended December 31, 2014. The decrease in net income in 2015 is due primarily to a $6.8 million decrease in the credit provision for loan losses between the periods. The decrease in the credit provision was primarily because there was more commercial loan growth and fewer recoveries of previously charged off loans in 2015 when compared to 2014. Net income also decreased $1.4 million due to the change in the losses recognized on real estate owned between the periods. The increased losses in 2015 were primarily due to a large gain realized on the sale of a commercial property in 2014. These decreases in net income were partially offset by a $0.5 million increase in net interest income due to increases in outstanding loan balances and a $3.3 million decrease in income tax expense as a result of the decreased pre-tax net income between the periods.
Net Interest Income
Net interest income was $19.9 million for 2015, an increase of $0.5 million, or 2.8%, from $19.4 million for 2014. Interest income was $21.5 million for 2015, an increase of $0.9 million, or 4.1%, from $20.6 million for 2014. Interest income increased between the periods primarily because of a change in the mix of average interest-earning assets held, which resulted in an increase in the average yields earned between the periods. While the average interest-earning assets decreased $14.5 million between the periods, the average interest-earning assets held in higher yielding loans increased $25.5 million and the amount held in lower yielding cash and investment decreased $40.0 million between the periods. The increase in the average outstanding loans between the periods was primarily the result of an increase in the commercial loan portfolio, which occurred primarily because of an increase in loan originations and a reduction in loan payoffs between the periods. The Company also acquired $24.1 million of loans through an acquisition that occurred in the third quarter of 2015. The average yield earned on interest-earning assets was 3.83% for 2015, an increase of 24 basis points from 3.59% for 2014.
Interest expense was $1.5 million for the year ended December 31, 2015, an increase of $0.3 million, or 24.4%, from $1.2 million for 2014. Interest expense increased primarily because of the change in the mix of the average interest-bearing liabilities held, which resulted in an increase in the average rate paid between the periods. While the average interest-bearing liabilities decreased $2.8 million between the periods, the average amount held in higher rate advances and other borrowings increased $9.3 million, the average amount held in higher rate certificates of deposit decreased $14.5 million, and the average amount held in other lower rate checking and money market deposits increased $2.4 million between the periods. The increase in the average rates paid was primarily due to the $10.0 million holding company note payable that was funded in the first quarter of 2015 in connection with the redemption of all of the remaining Fixed Rate Cumulative Perpetual Preferred Stock, Series A (“Preferred Stock”). Interest expense increases related to borrowing costs were partially offset by the lower interest rates paid on deposit accounts between the periods as a result of the low interest rate environment that continued to exist in 2015. The average interest rate paid on interest-bearing liabilities was 0.29% for 2015, an increase of 6 basis points from the 0.23% average interest rate paid in 2014. Net interest margin (net interest income divided by average interest-earning assets) for 2015 was 3.56%, an increase of 18 basis points, compared to 3.38% for 2014.
The following table presents the total dollar amount of interest income from average interest-earning assets and the resultant yields, as well as the interest expense on average interest-bearing liabilities, expressed both in dollars and rates. Non-accruing loans have been included in the average outstanding loan balance in the table as loans carrying a zero yield.
MANAGEMENT DISCUSSION AND ANALYSIS
| | | Year Ended December 31, | |
| | | 2015 | | | 2014 | | | 2013 | |
(Dollars in thousands) | | Average Outstanding Balance | | | Interest Earned/ Paid | | | Average Yield/ Rate | | | Average Outstanding Balance | | | Interest Earned/ Paid | | | Average Yield/ Rate | | | Average Outstanding Balance | | | Interest Earned/ Paid | | | Average Yield/ Rate | |
Interest-earning assets: | | | | | | | | | | | | | | | | | | | | | | | | | | | | | | | | | | | | |
Securities available for sale: | | | | | | | | | | | | | | | | | | | | | | | | | | | | | | | | | | | | |
Mortgage-backed and related securities | | $ | 3,274 | | | | 116 | | | | 3.54 | % | | $ | 3,726 | | | | 164 | | | | 4.40 | % | | $ | 6,968 | | | | 299 | | | | 4.30 | % |
Other marketable securities | | | 130,806 | | | | 1,881 | | | | 1.44 | | | | 119,484 | | | | 1,269 | | | | 1.06 | | | | 85,947 | | | | 614 | | | | 0.71 | |
Loans held for sale | | | 2,507 | | | | 87 | | | | 3.47 | | | | 1,557 | | | | 58 | | | | 3.73 | | | | 1,964 | | | | 72 | | | | 3.67 | |
Loans receivable, net(1) (2) | | | 394,086 | | | | 19,302 | | | | 4.90 | | | | 369,571 | | | | 18,929 | | | | 5.12 | | | | 408,383 | | | | 21,816 | | | | 5.34 | |
FHLB stock | | | 734 | | | | 4 | | | | 0.54 | | | | 778 | | | | 4 | | | | 0.51 | | | | 2,191 | | | | 53 | | | | 2.42 | |
Other, including cash equivalents | | | 28,544 | | | | 63 | | | | 0.22 | | | | 79,373 | | | | 189 | | | | 0.24 | | | | 55,909 | | | | 129 | | | | 0.23 | |
Total interest-earning assets | | $ | 559,951 | | | | 21,453 | | | | 3.83 | | | $ | 574,489 | | | | 20,613 | | | | 3.59 | | | $ | 561,362 | | | | 22,983 | | | | 4.09 | |
| | | | | | | | | | | | | | | | | | | | | | | | | | | | | | | | | | | | | |
Interest-bearing liabilities: | | | | | | | | | | | | | | | | | | | | | | | | | | | | | | | | | | | | |
NOW accounts | | $ | 76,136 | | | | 17 | | | | 0.02 | % | | $ | 71,666 | | | | 14 | | | | 0.02 | % | | $ | 69,675 | | | | 15 | | | | 0.02 | % |
Passbooks | | | 55,273 | | | | 42 | | | | 0.08 | | | | 47,200 | | | | 32 | | | | 0.07 | | | | 44,113 | | | | 34 | | | | 0.08 | |
Money market accounts | | | 153,441 | | | | 347 | | | | 0.23 | | | | 162,207 | | | | 414 | | | | 0.26 | | | | 120,782 | | | | 372 | | | | 0.31 | |
Certificate accounts | | | 96,600 | | | | 528 | | | | 0.55 | | | | 110,256 | | | | 739 | | | | 0.67 | | | | 140,254 | | | | 1,236 | | | | 0.88 | |
Brokered deposits | | | 0 | | | | 0 | | | | 0.00 | | | | 830 | | | | 12 | | | | 1.45 | | | | 10,647 | | | | 147 | | | | 1.38 | |
FHLB advances and other borrowings | | | 9,225 | | | | 573 | | | | 6.21 | | | | 0 | | | | 0 | | | | 0.00 | | | | 30,427 | | | | 1,485 | | | | 4.88 | |
Other interest-bearing liabilities | | | 985 | | | | 0 | | | | 0.00 | | | | 924 | | | | 0 | | | | 0.00 | | | | 963 | | | | 0 | | | | 0.00 | |
Total interest-bearing liabilities | | $ | 391,660 | | | | | | | | | | | $ | 393,083 | | | | | | | | | | | $ | 416,861 | | | | | | | | | |
Noninterest checking | | | 124,342 | | | | | | | | | | | | 125,767 | | | | | | | | | | | | 97,613 | | | | | | | | | |
Total interest-bearing liabilities and noninterest-bearing deposits | | $ | 516,002 | | | | 1,507 | | | | 0.29 | % | | $ | 518,850 | | | | 1,211 | | | | 0.23 | % | | $ | 514,474 | | | | 3,289 | | | | 0.64 | % |
Net interest income | | | | | | | 19,946 | | | | | | | | | | | | 19,402 | | | | | | | | | | | | 19,694 | | | | | |
Net interest rate spread | | | | | | | | | | | 3.54 | % | | | | | | | | | | | 3.35 | % | | | | | | | | | | | 3.45 | % |
Net earning assets | | $ | 43,949 | | | | | | | | | | | $ | 55,639 | | | | | | | | | | | $ | 46,888 | | | | | | | | | |
Net interest margin | | | | | | | | | | | 3.56 | % | | | | | | | | | | | 3.38 | % | | | | | | | | | | | 3.51 | % |
Average interest-earning assets to average interest-bearing liabilities and noninterest-bearing deposits | | | | | | | 108.52 | % | | | | | | | | | | | 110.72 | % | | | | | | | | | | | 109.11 | % | | | | |
(1) | Tax exempt income was not significant; therefore, the yield was not presented on a tax equivalent basis for any of the years presented. The tax-exempt income was $0.1 million for 2015, $0.1 million for 2014, and $0.2 million for 2013. |
(2) | Calculated net of deferred loan fees, loan discounts, loans in process and loss reserves. |
MANAGEMENT DISCUSSION AND ANALYSIS
Net interest margin increased to 3.56% in 2015 from 3.38% in 2014 primarily because of a change in the mix of average interest-earning assets held, which resulted in an increase in the average yields earned between the periods. The increases in the average yields earned due to having larger average balances of higher earning loans and smaller average balances of lower earning cash and investments was partially offset by an increase in the average rates paid on the average interest-bearing liabilities held between the periods. The increase in the average rates paid was primarily due to the $10.0 million holding company note payable that was funded in the first quarter of 2015 in connection with the redemption of all of the remaining Preferred Stock. Average net earning assets decreased $11.7 million to $43.9 million in 2015 compared to $55.6 million for 2014 primarily because the proceeds of the $10.0 million note payable that was funded in the first quarter of 2015 were used to redeem outstanding Preferred Stock.
The following table presents the dollar amount of changes in interest income and interest expense for major components of interest-earning assets and interest-bearing liabilities. It quantifies the changes in interest income and interest expense related to changes in the average outstanding balances (volume) and those changes caused by fluctuating interest rates. For each category of interest-earning assets and interest-bearing liabilities, information is provided on changes attributable to (i) changes in volume (i.e., changes in volume multiplied by old rate) and (ii) changes in rate (i.e., changes in rate multiplied by old volume).
| | | Year Ended December 31, | | | | | |
| | | 2015 vs. 2014 | | | | | | | 2014 vs. 2013 | | | | | |
| | | Increase (Decrease) Due to | | | | | | | Increase (Decrease) Due to | | | | | |
(Dollars in thousands) | | Volume(1) | | | Rate(1) | | | Total Increase (Decrease) | | | Volume(1) | | | Rate(1) | | | Total Increase (Decrease) | |
Interest-earning assets: | | | | | | | | | | | | | | | | | | | | | | | | |
Securities available for sale: | | | | | | | | | | | | | | | | | | | | | | | | |
Mortgage-backed and related securities | | $ | (20 | ) | | | (28 | ) | | | (48 | ) | | | (139 | ) | | | 4 | | | | (135 | ) |
Other marketable securities | | | 120 | | | | 492 | | | | 612 | | | | 240 | | | | 415 | | | | 655 | |
Loans held for sale | | | 36 | | | | (7 | ) | | | 29 | | | | (15 | ) | | | 1 | | | | (14 | ) |
Loans receivable, net | | | 1,175 | | | | (802 | ) | | | 373 | | | | (2,001 | ) | | | (886 | ) | | | (2,887 | ) |
Cash equivalents | | | (121 | ) | | | (5 | ) | | | (126 | ) | | | 54 | | | | 6 | | | | 60 | |
FHLB stock | | | 0 | | | | 0 | | | | 0 | | | | (34 | ) | | | (15 | ) | | | (49 | ) |
Total interest-earning assets | | $ | 1,190 | | | | (350 | ) | | | 840 | | | | (1,895 | ) | | | (475 | ) | | | (2,370 | ) |
Interest-bearing liabilities: | | | | | | | | | | | | | | | | | | | | | | | | |
NOW accounts | | $ | 1 | | | | 1 | | | | 2 | | | | 0 | | | | (1 | ) | | | (1 | ) |
Passbooks | | | 5 | | | | 5 | | | | 10 | | | | 2 | | | | (4 | ) | | | (2 | ) |
Money market accounts | | | 20 | | | | (86 | ) | | | (66 | ) | | | 89 | | | | (48 | ) | | | 41 | |
Certificates of deposit | | | (104 | ) | | | (107 | ) | | | (211 | ) | | | (300 | ) | | | (197 | ) | | | (497 | ) |
Brokered deposits | | | (12 | ) | | | 0 | | | | (12 | ) | | | (137 | ) | | | 2 | | | | (135 | ) |
FHLB advances and other borrowings | | | 0 | | | | 573 | | | | 573 | | | | (1,484 | ) | | | 0 | | | | (1,484 | ) |
Total interest-bearing liabilities | | | (90 | ) | | | 386 | | | | 296 | | | | (1,830 | ) | | | (248 | ) | | | (2,078 | ) |
Increase (decrease) in net interest income | | $ | 1,280 | | | | (736 | ) | | | 544 | | | | (65 | ) | | | (227 | ) | | | (292 | ) |
(1) | For purposes of this table, changes attributable to both rate and volume which cannot be segregated, have been allocated proportionately to the change due to volume and the change due to rate. |
MANAGEMENT DISCUSSION AND ANALYSIS
The following table sets forth the weighted average yields on the Company's interest-earning assets, the weighted average interest rates on interest-bearing liabilities and the interest rate spread between the weighted average yields and rates as of the date indicated. Non-accruing loans have been included in the average outstanding loan balances in the table as loans carrying a zero yield.
At December 31, 2015 | |
Weighted average yield on: | | | | | | Weighted average rate on: | | | | |
Securities available for sale: | | | | | | | | | | |
Mortgage-backed and related securities | | | 3.75 | % | | NOW accounts | | | 0.04 | % |
Other marketable securities | | | 1.49 | | | Passbooks | | | 0.09 | |
Loans held for sale | | | 4.36 | | | Money market accounts | | | 0.22 | |
Loans receivable, net | | | 4.96 | | | Certificates of deposit | | | 0.53 | |
Federal Home Loan Bank stock | | | 0.50 | | | Federal Home Loan Bank advances and other borrowings | | | 6.50 | |
Other interest-earnings assets | | | 0.48 | | | Combined weighted average rate on interest-bearing liabilities | | | 0.27 | |
Combined weighted average yield oninterest-earning assets | | | 4.06 | | | Interest rate spread | | | 3.79 | |
| | | | | | | | | | | |
Provision for Loan Losses
The provision for loan losses was ($0.2 million) for the year ended December 31, 2015, an increase of $6.8 million, from ($7.0 million) for the year ended December 31, 2014. The credit provision for loan losses decreased primarily because there was more commercial loan growth, fewer credit rating upgrades, and fewer recoveries of previously charged off loans in 2015 when compared to 2014. The non-performing loan and foreclosed and repossessed asset activity for 2015 and 2014 was as follows:
| Non-performing loans: | | December 31, | |
(Dollars in thousands) | | 2015 | | | 2014 | |
Balance at beginning of year | | $ | 10,920 | | | | 17,496 | |
Classified as non-performing | | | 4,422 | | | | 5,153 | |
Charge offs | | | (119 | ) | | | (1,215 | ) |
Principal payments received | | | (5,011 | ) | | | (7,211 | ) |
Classified as performing | | | (5,921 | ) | | | (3,189 | ) |
Transferred to real estate owned | | | (110 | ) | | | (114 | ) |
Balance at end of year | | $ | 4,181 | | | | 10,920 | |
| | | | | | | | | |
Foreclosed and repossessed assets: | | December 31, | |
(Dollars in thousands) | | 2015 | | | 2014 | |
Balance at beginning of year | | $ | 3,103 | | | | 6,898 | |
Transferred from non-performing loans | | | 110 | | | | 114 | |
Other foreclosures/repossessions | | | 239 | | | | 28 | |
Real estate sold | | | (1,165 | ) | | | (4,891 | ) |
Net gain on sale of assets | | | 165 | | | | 1,449 | |
Write downs | | | (407 | ) | | | (495 | ) |
Balance at end of year | | $ | 2,045 | | | | 3,103 | |
| | | | | | | | | |
The decrease in non-performing loans relates primarily to a commercial real estate development relationship that was upgraded to performing status during the year due to the improved financial performance of the project as a result of increased lot sales.
MANAGEMENT DISCUSSION AND ANALYSIS
A reconciliation of the allowance for loan losses for 2015 and 2014 is summarized as follows:
(Dollars in thousands) | | 2015 | | | 2014 | |
Balance at January 1 | | $ | 8,332 | | | | 11,401 | |
Provision | | | (164 | ) | | | (6,998 | ) |
Charge offs: | | | | | | | | |
Commercial | | | (69 | ) | | | (55 | ) |
Commercial real estate | | | 0 | | | | (936 | ) |
Consumer | | | (105 | ) | | | (131 | ) |
Single-family | | | (19 | ) | | | (92 | ) |
Recoveries | | | 1,734 | | | | 5,143 | |
Balance at December 31 | | $ | 9,709 | | | | 8,332 | |
| | | | | | | | | |
Specific allowance | | $ | 1,009 | | | | 1,074 | |
General allowance | | | 8,700 | | | | 7,258 | |
| | | $ | 9,709 | | | | 8,332 | |
| | | | | | | | | |
The allowance for loan losses increased in 2015 when compared to 2014 primarily because of the $99.3 million increase in the loan portfolio between the periods.
Non-Interest Income
Non-interest income was $7.7 million for the year ended December 31, 2015, an increase of $0.4 million, compared to $7.3 million for the year ended December 31, 2014.
The following table presents the components of non-interest income:
| | | Year ended December 31, | | | Percentage Increase (Decrease) | |
(Dollars in thousands) | | 2015 | | | 2014 | | | 2013 | | | 2015/2014 | | | 2014/2013 | |
Fees and service charges | | $ | 3,316 | | | | 3,458 | | | | 3,513 | | | | (4.1 | )% | | | (1.6 | )% |
Loan servicing fees | | | 1,046 | | | | 1,058 | | | | 1,029 | | | | (1.1 | ) | | | 2.8 | |
Gain on sales of loans | | | 1,964 | | | | 1,828 | | | | 2,102 | | | | 7.4 | | | | (13.0 | ) |
Gain on acquisition | | | 289 | | | | 0 | | | | 0 | | | | NM | | | | NM | |
Other non-interest income | | | 1,038 | | | | 940 | | | | 668 | | | | 9.8 | | | | 40.7 | |
Total non-interest income | | $ | 7,653 | | | | 7,284 | | | | 7,312 | | | | 5.1 | | | | (0.4 | ) |
| | | | | | | | | | | | | | | | | | | | | |
The increase is primarily related to a gain of $0.3 million that was recognized on an acquisition that occurred in the third quarter of 2015. Gain on sales of loans increased $0.1 million, or 7.4%, between the periods primarily because of an increase in single-family loan originations and sales. Other non-interest income increased $0.1 million primarily due to an increase in income related to the sale of non-insured investment products. These increases in non-interest income were partially offset by a $0.1 million decrease in fees and service charges primarily because of adecrease in retail and commercial overdraft fees between the periods.
MANAGEMENT DISCUSSION AND ANALYSIS
Non-Interest Expense
Non-interest expense was $23.2 million for the year ended December 31, 2015, an increase of $1.8 million, or 8.4%, from $21.4 million for the same period in 2014. The following table presents the components of non-interest expense:
| | | Year ended December 31, | | | Percentage Increase (Decrease) | |
(Dollars in thousands) | | 2015 | | | 2014 | | | 2013 | | | 2015/2014 | | | 2014/2013 | |
Compensation and benefits | | $ | 13,733 | | | | 13,332 | | | | 12,680 | | | | 3.0 | % | | | 5.1 | % |
Losses (gains) on real estate owned | | | 218 | | | | (1,194 | ) | | | (830 | ) | | | 118.3 | | | | (43.9 | ) |
Occupancy | | | 3,722 | | | | 3,691 | | | | 3,338 | | | | 0.8 | | | | 10.6 | |
Deposit insurance | | | 375 | | | | 435 | | | | 868 | | | | (13.8 | ) | | | (49.9 | ) |
Data processing | | | 1,020 | | | | 1,011 | | | | 1,289 | | | | 0.9 | | | | (21.6 | ) |
Other | | | 4,128 | | | | 4,128 | | | | 5,278 | | | | 0.0 | | | | (21.8 | ) |
Total non-interest expense | | $ | 23,196 | | | | 21,403 | | | | 22,623 | | | | 8.4 | | | | (5.4 | ) |
| | | | | | | | | | | | | | | | | | | | | |
Losses on real estate owned increased $1.4 million between the periods primarily because of a $1.0 million gain that was recognized on the sale of a single commercial property in 2014. Compensation expense increased $0.4 million between the periods primarily because of an increase in the expenses related to restricted stock awards and increased incentive accruals due to increased loan production. These increases in non-interest expense were partially offset by a decrease of $0.1 million in deposit insurance costs due primarily to a decrease in insurance rates between the periods.
Income Taxes
The Company considers the calculation of current and deferred income taxes to be a critical accounting policy that is subject to significant estimates. Actual results could differ significantly from the estimates and interpretations used in determining the current and deferred income tax assets and liabilities. Income tax expense was $1.6 million for the year ended December 31, 2015, a decrease of $3.3 million from $4.9 million for the same period in 2014. The decrease in income tax expense between the periods is primarily related to the decrease in pre-tax net income in 2015 when compared to 2014.
Net Income Available to Common Shareholders
Net income available to common shareholders was $2.8 million for 2015, a decrease of $2.9 million from the $5.7 million net income available to common shareholders in 2014. Basic earnings per common share for the year ended December 31, 2015 was $0.69, a decrease of $0.71 from the basic earnings per common share of $1.40 for the year ended December 31, 2014. Diluted earnings per common share for the year ended December 31, 2015 was $0.61, a decrease of $0.62 from diluted earnings per common share of $1.23 for the year ended December 31, 2014. The net income available to common shareholders and the basic and diluted earnings per common share decreased primarily because of the decrease in net income between the periods that was partially offset by a reduction in the dividends paid on the outstanding Preferred Stock. On February 17, 2015 the Company redeemed the final 10,000 shares of its outstanding Preferred Stock and, as a result, no dividends are required to be paid on the Preferred Stock after that date.
Comparison of 2014 with 2013
Net income was $7.4 million for 2014, a decrease of $19.3 million, from $26.7 million for 2013. Net income available to common shareholders was $5.7 million for the year ended December 31, 2014, a decrease of $18.9 million, from net income available to common shareholders of $24.6 million for 2013. Diluted earnings per common share for the year ended December 31, 2014 was $1.23, a decrease of $4.48 from $5.71 diluted earnings per common share for the year ended December 31, 2013. The decrease in net income in 2014 is due primarily to a $19.3 million increase in income tax expense between the periods as a result of eliminating the valuation reserve against the Company’s deferred tax asset in the fourth quarter of 2013 and recording regular income tax expense in 2014.
Net interest income was $19.4 million for 2014, a decrease of $0.3 million, or 1.5%, from $19.7 million for 2013. Interest income was $20.6 million for 2014, a decrease of $2.4 million, or 10.3%, from $23.0 million for 2013. Interest income decreased between the periods primarily because of a change in the mix of average interest-earning assets held and also because of a decrease in the average yields earned between the periods. While the average interest-earning assets increased $13.1 million between the periods, the average interest-earning assets held in lower yielding cash and investments increased $52.3 million and the amount of average interest-earning assets held in higher yielding loans decreased $39.2 million between the periods. The decrease in the average outstanding loans between the periods was primarily the result of a decrease in the commercial loan portfolio, which occurred primarily because of loan prepayments and non-renewals as a result of the Company’s continued focus on improving credit quality, decreasing loan concentration, and managing net interest margin. The average yield earned on interest-earning assets was 3.59% for the year ended December 31, 2014, a decrease of 50 basis points from 4.09% for the sameperiod of 2013. The decrease in average yield is due to the change in the mix of assets held and the continued low interest rate environment that existed during 2014.
MANAGEMENT DISCUSSION AND ANALYSIS
Interest expense was $1.2 million for the year ended December 31, 2014, a decrease of $2.1 million, or 63.2%, from $3.3 million for 2013. Interest expense decreased primarily because of the change in the mix of the average interest-bearing liabilities held between the periods and also because of a decrease in the average interest rate. While the average interest-bearing liabilities increased $4.4 million between the periods, the amount held in higher rate certificates of deposit and Federal Home Loan Bank advances decreased $70.2 million and the amount of interest-bearing liabilities held in other lower rate deposit accounts increased $74.6 million between the periods. The decrease in certificates of deposit between the periods was the result of using the proceeds from loan principal payments to fund maturing certificates of deposit. The decreased average rates paid were the result of the change in the mix of liabilities held and the low interest rate environment that continued to exist during 2014. The average interest rate paid on interest-bearing liabilities was 0.23% for the year ended December 31, 2014, a decrease of 41 basis points from the 0.64% average interest rate paid in 2013.
Net interest margin decreased to 3.38% in 2014 from 3.51% in 2013 primarily because the yield on interest-earning assets decreased at a faster rate than the cost of interest-bearing liabilities. Net interest margin was also negatively impacted by a change in the asset mix as a higher percentage of interest-earning assets were in lower yielding cash and investments in 2014 when compared to 2013. Average net earning assets increased $8.7 million to $55.6 million in 2014 compared to $46.9 million for 2013 primarily because the net income realized in 2014 was reinvested in interest-earning assets.
The provision for loan losses was ($7.0 million) for the year ended December 31, 2014, a decrease in the credit provision of $0.9 million, from ($7.9 million) for the year ended December 31, 2013. The decrease in the size of the commercial loan portfolio, the continued improvement in the credit quality of the loan portfolio, and the recoveries received on previously charged off loans in 2014 and 2013 resulted in lower reserves being required in the allowance for loan losses. The reduction in the allowance for loan losses was the primary reason for the large credits in the provision for loan losses for 2014 and 2013. Future loan loss provisions are anticipated to return to more normalized levels due to the decrease in non-performing assets and the recoveries already received on previously charged off loans.
Total non-performing assets were $14.0 million at December 31, 2014, a decrease of $10.4 million, or 42.5%, from $24.4 million at December 31, 2013. Non-performing loans decreased $6.6 million and foreclosed and repossessed assets decreased $3.8 million during 2014. The decrease in non-performing loans during 2014 relates primarily to principal payments received. Of the $7.2 million in principal payments received during the period, $2.5 million was received on a residential development loan as settlement of the outstanding debt, $1.7 million related to the payoff of non-performing single family construction loans as a result of the houses being sold, $1.2 million related to the payoff of two non-performing one-to-four family loans that were refinanced with other financial institutions, $0.6 million related to additional principal payments received from various developers as a result of land or lot sales, and $0.7 million related to the payoff of non-performing commercial and commercial real estate loans.
The allowance for loan losses and charge offs decreased in 2014 when compared to 2013 because of two factors. The first factor was there were less required specific reserves because some non-performing loans were paid or charged off during 2014. The second factor was that the loan portfolio decreased $22 million between the periods which reduced the amount of the required allowance. These decreases in the allowance were partially offset by an increase in the required reserve percentages for certain risk rated loan categories as a result of the periodic internal analysis of recent loan charge-off history that was performed in 2014.
Non-interest income was $7.3 million for the year ended December 31, 2014, the same as for the year ended December 31, 2013. Gain on sales of loans decreased $0.3 million, or 13.0%, between 2014 and 2013 primarily because of a decrease in single family loan originations and sales. Fees and service charges decreased $0.1 million primarily because of a decrease in retail overdraft fees and other charges between 2014 and 2013. Other non-interest income increased $0.3 million between the periods due to increases in the sale of non-insured investment products and rental income. Loan servicing fees increased $29,000 as a result of servicing more commercial loans.
Non-interest expense was $21.4 million for the year ended December 31, 2014, a decrease of $1.2 million, or 5.4%, from $22.6 million for 2013. Other non-interest expenses decreased $1.2 million between 2014 and 2013 primarily because of a decrease in legal and other costs associated with loans and real estate owned. Deposit insurance expense decreased $0.4 million because of a decrease in assets and insurance rates between the periods. Gains on real estate owned increased $0.4 million between the periods primarily because of the significant gain realized on a commercial real estate property that was sold in 2014. Data processing expense decreased $0.3 million due to a decrease in hardware and software depreciation expense in 2014. These decreases in non-interest expense were partially offset by a $0.7 million increase in compensation expense in 2014 primarily because of an increase in salaries and pension benefit costs. Occupancy expense increased $0.4 million between 2014 and 2013 due to an increase in software amortization expense and the purchase of more non-capitalized items in 2014.
MANAGEMENT DISCUSSION AND ANALYSIS
The Company considers the calculation of current and deferred income taxes to be a critical accounting policy that is subject to significant estimates. Actual results could differ significantly from the estimates and interpretations used in determining the current and deferred income tax assets and liabilities. Income tax expense was $4.9 million for the year ended December 31, 2014, an increase of $19.3 million from the $14.4 million income tax benefit for the same period in 2013. In the second quarter of 2010, the Company recorded a deferred tax asset valuation reserve against its entire deferred tax asset balance and the Company continued to maintain a valuation reserve against the entire deferred tax asset balance until the fourth quarter of 2013. In the fourth quarter of 2013, the valuation reserve against the deferred tax asset was eliminated which resulted in a $14.4 million income tax benefit for 2013. Regular income tax expense was recorded in 2014.
Net income available to common shareholders was $5.7 million for the year ended December 31, 2014, a decrease of $18.9 million from $24.6 million in net income available to common shareholders for the year ended December 31, 2013. Basic earnings per common share for the year ended December 31, 2014 was $1.40, a decrease of $4.75 from the basic earnings per common share of $6.15 for the year ended December 31, 2013. Diluted earnings per common share for the year ended December 31, 2014 was $1.23, a decrease of $4.48 from diluted earnings per common share of $5.71 for the year ended December 31, 2013. The net income available to common shareholders and the basic and diluted earnings per common share decreased primarily because of the decrease in net income between the periods as a result of the elimination of the deferred tax asset valuation reserve in the fourth quarter of 2013. The difference between basic and diluted earnings per common share is related primarily to the dilutive effect of the outstanding warrant held by the U.S. Treasury to purchase 833,333 shares of the Company’s common stock at an exercise price of $4.68.
On December 23, 2008, the Company sold 26,000 shares of Preferred Stock and a related warrant to the United States Department of Treasury (“Treasury”) for $26.0 million as part of the Treasury’s Capital Purchase Program. On February 8, 2013, Treasury sold the Preferred Stock to unaffiliated third party investors in a private transaction for $18.8 million. The shares of Preferred Stock were entitled to a 5% annual cumulative dividend for each of the first five years of the investment, which increased to 9% on February 15, 2014. The Company paid the following dividends on, and effected the following redemptions of, its Preferred Stock during 2014:
Date | Dividend | Redemption |
May 15, 2014 | $201.71 per share | 10,000 shares of Preferred Stock on a pro rata basis at$1,000 per share |
August 15, 2014 | $22.50 per share | None |
November 17, 2014 | $22.50 per share | 6,000 shares of Preferred Stock on a pro rata basis at $1,000 per share |
Following the redemption on November 17, 2014, 10,000 shares of Preferred Stock remained outstanding. The Company did not pay any dividends on the Preferred Stock or redeem any shares of Preferred Stock in 2013.
On February 17, 2015, the Company redeemed the remaining 10,000shares of outstanding Preferred Stock. After giving effect to a dividend of $22.50 per share on the Preferred Stock that was paid on the same date, the redemption price per share was $1,000. The Preferred Stock redemption was funded with a $10.0 million term loan to HMN from an unrelated third party that was evidenced by a promissory note. The principal balance of the note bears interest at a rate of 6.5% and is payable in consecutive annual installments of $1.0 million on each December 15, beginning December 15, 2015, with the balance due on December 15, 2021. The Preferred Stock dividend was funded by HMN through internally available funds.
MANAGEMENT DISCUSSION AND ANALYSIS
Financial Condition
Loans Receivable, Net
The following table sets forth the information on the Company's loan portfolio in dollar amounts and percentages before deductions for deferred fees and discounts and allowances for losses as of the dates indicated:
| | | December 31, | |
| | | 2015 | | | 2014 | | | 2013 | | | 2012 | | | 2011 | |
(Dollars in thousands) | | Amount | | | Percent | | | Amount | | | Percent | | | Amount | | | Percent | | | Amount | | | Percent | | | Amount | | | Percent | |
Real Estate Loans: | | | | | | | | | | | | | | | | | | | | | | | | | | | | | | | | | | | | | | | | |
One-to-four family | | $ | 90,945 | | | | 19.24 | % | | $ | 69,841 | | | | 18.70 | % | | $ | 76,467 | | | | 19.31 | % | | $ | 97,037 | | | | 20.40 | % | | $ | 119,066 | | | | 20.52 | % |
Multi-family | | | 12,324 | | | | 2.61 | | | | 15,700 | | | | 4.20 | | | | 8,113 | | | | 2.05 | | | | 11,756 | | | | 2.47 | | | | 35,517 | | | | 6.12 | |
Commercial | | | 196,926 | | | | 41.65 | | | | 163,365 | | | | 43.73 | | | | 178,486 | | | | 45.06 | | | | 220,721 | | | | 46.39 | | | | 243,475 | | | | 41.95 | |
Construction or development | | | 38,103 | | | | 8.05 | | | | 12,603 | | | | 3.37 | | | | 7,851 | | | | 1.98 | | | | 12,430 | | | | 2.61 | | | | 10,922 | | | | 1.88 | |
Total real estate loans | | | 338,298 | | | | 71.55 | | | | 261,509 | | | | 70.00 | | | | 270,917 | | | | 68.40 | | | | 341,944 | | | | 71.87 | | | | 408,980 | | | | 70.47 | |
Other Loans: | | | | | | | | | | | | | | | | | | | | | | | | | | | | | | | | | | | | | | | | |
Consumer Loans: | | | | | | | | | | | | | | | | | | | | | | | | | | | | | | | | | | | | | | | | |
Automobile | | | 2,885 | | | | 0.61 | | | | 1,124 | | | | 0.30 | | | | 971 | | | | 0.25 | | | | 623 | | | | 0.13 | | | | 404 | | | | 0.07 | |
Home equity line | | | 38,980 | | | | 8.24 | | | | 36,832 | | | | 9.86 | | | | 36,178 | | | | 9.13 | | | | 36,521 | | | | 7.68 | | | | 41,429 | | | | 7.14 | |
Home equity | | | 14,782 | | | | 3.13 | | | | 12,420 | | | | 3.33 | | | | 11,629 | | | | 2.94 | | | | 11,390 | | | | 2.39 | | | | 13,426 | | | | 2.31 | |
Recreational vehicles | | | 2,650 | | | | 0.56 | | | | 0 | | | | 0.00 | | | | 0 | | | | 0.00 | | | | 0 | | | | 0.00 | | | | 0 | | | | 0.00 | |
Other | | | 5,118 | | | | 1.08 | | | | 4,549 | | | | 1.22 | | | | 4,645 | | | | 1.17 | | | | 5,441 | | | | 1.15 | | | | 6,902 | | | | 1.19 | |
Total consumer loans | | | 64,415 | | | | 13.62 | | | | 54,925 | | | | 14.71 | | | | 53,423 | | | | 13.49 | | | | 53,975 | | | | 11.35 | | | | 62,161 | | | | 10.71 | |
Commercial business loans | | | 70,106 | | | | 14.83 | | | | 57,122 | | | | 15.29 | | | | 71,709 | | | | 18.11 | | | | 79,854 | | | | 16.78 | | | | 109,259 | | | | 18.82 | |
Total other loans | | | 134,521 | | | | 28.45 | | | | 112,047 | | | | 30.00 | | | | 125,132 | | | | 31.60 | | | | 133,829 | | | | 28.13 | | | | 171,420 | | | | 29.53 | |
Total loans | | | 472,819 | | | | 100.00 | % | | | 373,556 | | | | 100.00 | % | | | 396,049 | | | | 100.00 | % | | | 475,773 | | | | 100.00 | % | | | 580,400 | | | | 100.00 | % |
Less: | | | | | | | | | | | | | | | | | | | | | | | | | | | | | | | | | | | | | | | | |
Unamortized discounts | | | 16 | | | | | | | | 14 | | | | | | | | 33 | | | | | | | | 33 | | | | | | | | 93 | | | | | |
Net deferred loan (costs) fees | | | (91 | ) | | | | | | | 97 | | | | | | | | 0 | | | | | | | | 87 | | | | | | | | 511 | | | | | |
Allowance for losses | | | 9,709 | | | | | | | | 8,332 | | | | | | | | 11,401 | | | | | | | | 21,608 | | | | | | | | 23,888 | | | | | |
Total loans receivable, net | | $ | 463,185 | | | | | | | $ | 365,113 | | | | | | | $ | 384,615 | | | | | | | $ | 454,045 | | | | | | | $ | 555,908 | | | | | |
| | | | | | | | | | | | | | | | | | | | | | | | | | | | | | | | | | | | | | | | | |
In 2015, the Company’s loan portfolio increased because of an increase in the loan originations as a result of an increase in lending staff. The loan portfolio also increased $24.1 million as a result of the bank acquisition that occurred in the third quarter of 2015. Because of the enhanced lending staff and the previously announced branch acquisition that is scheduled to close in the second quarter of 2016, it is anticipated that the size of our overall loan portfolio will increase in 2016.
One-to-four family real estate loans were $90.9 million at December 31, 2015, an increase of $21.1 million, compared to $69.8 million at December 31, 2014. Mortgage loan originations increased in 2015 as a result of additional mortgage lending staff and an increased emphasis on originating shorter term and adjustable rate mortgage loans that were placed into the portfolio during 2015. The majority of the longer term mortgage loans that were originated during the year continued to be sold into the secondary market and were not placed in the loan portfolio in order to manage the Company’s interest rate risk position. The increased origination of loans placed into the loan portfolio was the primary reason for the increase in the one-to-four family loan portfolio during 2015.
Multi-family real estate loans were $12.3 million at December 31, 2015, a decrease of $3.4 million, compared to $15.7 million at December 31, 2014. The decrease in multi-family real estate loans in 2015 is primarily the result of a $3.9 million loan that was paid off during the year that was partially offset by new multi-family real estate originations.
Commercial real estate loans were $196.9 million at December 31, 2015, an increase of $33.5 million, compared to $163.4 million at December 31, 2014. Commercial business loans were $70.1 million at December 31, 2015, an increase of $13.0 million, compared to $57.1 million at December 31, 2014. Increased commercial loan demand and increased loan production resulted in an increase in the commercial business and commercial real estate loan portfolios in 2015.
Construction or development loans were $38.1 million at December 31, 2015, an increase of $25.4 million, compared to $12.7 million at December 31, 2014. The increase resulted primarily from $23.2 million in new construction loans, $13.0 million in advances on existing loans, $5.6 million in paid-off loans, and $5.2 million of projects that were completed and the related loans moved to a permanent classification.
Home equity lines of credit were $39.0 million at December 31, 2015, an increase of $2.2 million, compared to $36.8 million at December 31, 2014. The open-end home equity lines are generally written with an adjustable rate and a 10 year draw period which requires interest only payments followed by a 10 year repayment period which fully amortizes the outstanding balance. Closed-end home equity loans are written with fixed or adjustable rates with terms up to 15 years. Home equity loans were $14.8 million at December 31, 2015, an increase of $2.4 million, compared to $12.4 million at December 31, 2014. The increase in the open-end equity lines and closed-end equity loans is related primarily to an increase in originations between the periods.
MANAGEMENT DISCUSSION AND ANALYSIS
Allowance for Loan Losses
The determination of the allowance for loan losses and the related provision is a critical accounting policy of the Company that is subject to significant estimates, as previously discussed. The current level of the allowance for loan losses is a result of management’s assessment of the risks within the portfolio based on the information obtained through the credit evaluation process. The Company utilizes a risk-rating system on non-homogenous commercial real estate and commercial business loans that includes regular credit reviews to identify and quantify the risk in the commercial portfolio. Management conducts quarterly reviews of the entire loan portfolio and evaluates the need to adjust the allowance balance on the basis of these reviews.
Management actively monitors asset quality and, when appropriate, charges off loans against the allowance for loan losses. Although management believes it uses the best information available to make determinations with respect to the allowance for loan losses, future adjustments may be necessary if economic conditions differ substantially from the economic conditions in the assumptions used to determine the size of the allowance for loan losses.
The allowance for loan losses was $9.7 million, or 2.05% of gross loans at December 31, 2015, compared to $8.3 million, or 2.23% of gross loans at December 31, 2014. The allowance for loan losses increased primarily due to a $99.3 million increase in the loan portfolio between the periods. The increase in the allowance due to loan growth was partially offset by a decrease in the allowance due to lower reserve percentages being used for certain risk rated commercial loans between the periods as a result of an internal analysis of the most recent charge-off history that was performed during the year. The allowance also decreased due to a decrease in the allocated allowance for impaired loans. The decrease in the allowance as a percentage of outstanding loans, from 2.23% of gross loans at December 31, 2014 to 2.05% of gross loans at December 31, 2015, reflects the improved credit quality of the loan portfolio between the periods.
The following table reflects the activity in the allowance for loan losses and selected statistics:
| | | December 31, | |
(Dollars in thousands) | | 2015 | | | 2014 | | | 2013 | | | 2012 | | | 2011 | |
Balance at beginning of year | | $ | 8,332 | | | | 11,401 | | | | 21,608 | | | | 23,888 | | | | 42,828 | |
Provision for losses | | | (164 | ) | | | (6,998 | ) | | | (7,881 | ) | | | 2,544 | | | | 17,278 | |
Charge-offs: | | | | | | | | | | | | | | | | | | | | |
One-to-four family | | | (19 | ) | | | (92 | ) | | | (200 | ) | | | (63 | ) | | | (508 | ) |
Consumer | | | (105 | ) | | | (131 | ) | | | (484 | ) | | | (1,071 | ) | | | (270 | ) |
Commercial business | | | (69 | ) | | | (55 | ) | | | (651 | ) | | | (2,464 | ) | | | (15,512 | ) |
Commercial real estate | | | 0 | | | | (936 | ) | | | (3,711 | ) | | | (5,719 | ) | | | (23,012 | ) |
Recoveries | | | 1,734 | | | | 5,143 | | | | 2,720 | | | | 4,493 | | | | 3,084 | |
Net recoveries (charge-offs) | | | 1,541 | | | | 3,929 | | | | (2,326 | ) | | | (4,824 | ) | | | (36,218 | ) |
Balance at end of year | | $ | 9,709 | | | | 8,332 | | | | 11,401 | | | | 21,608 | | | | 23,888 | |
Year-end allowance for loan losses as a percent of year end gross loan balance | | | 2.05 | % | | | 2.23 | % | | | 2.88 | % | | | 4.54 | % | | | 4.12 | % |
Ratio of net loan (recoveries) charge-offs to average loans outstanding | | | (0.36 | ) | | | (1.02 | ) | | | 0.53 | | | | 0.91 | | | | 5.62 | |
MANAGEMENT DISCUSSION AND ANALYSIS
The following table reflects the allocation of the allowance for loan losses:
| | | December 31, | |
| | | 2015 | | | 2014 | | | 2013 | | | 2012 | | | 2011 | |
| | | Allocated Allowance as a % of Loan Category | | | Percent of Loans in Each Category to Total Loans | | | Allocated Allowance as a % of Loan Category | | | Percent of Loans in Each Category to Total Loans | | | Allocated Allowance as a % of Loan Category | | | Percent of Loans in Each Category to Total Loans | | | Allocated Allowance as a % of Loan Category | | | Percent of Loans in Each Category to Total Loans | | | Allocated Allowance as a % of Loan Category | | | Percent of Loans in Each Category to Total Loans | |
| | | | | | | | | | | | | | | | | | | | | | | | | | | | | | | | | | | | | | | | | |
One-to-four family | | | 1.09 | % | | | 19.24 | % | | | 1.57 | % | | | 18.70 | % | | | 2.13 | % | | | 19.31 | % | | | 2.91 | % | | | 20.40 | % | | | 3.12 | % | | | 20.52 | % |
Commercial real estate | | | 2.46 | | | | 52.31 | | | | 2.62 | | | | 51.30 | | | | 3.32 | | | | 49.09 | | | | 5.55 | | | | 51.47 | | | | 4.70 | | | | 49.95 | |
Consumer | | | 1.86 | | | | 13.62 | | | | 1.84 | | | | 14.71 | | | | 2.07 | | | | 13.49 | | | | 2.12 | | | | 11.35 | | | | 1.86 | | | | 10.71 | |
Commercial business | | | 2.05 | | | | 14.83 | | | | 2.11 | | | | 15.29 | | | | 3.08 | | | | 18.11 | | | | 5.08 | | | | 16.78 | | | | 4.93 | | | | 18.82 | |
Total | | | 2.05 | | | | 100.00 | % | | | 2.23 | | | | 100.00 | % | | | 2.88 | | | | 100.00 | % | | | 4.54 | | | | 100.00 | % | | | 4.12 | | | | 100.00 | % |
| | | | | | | | | | | | | | | | | | | | | | | | | | | | | | | | | | | | | | | | | |
The allocated reserve percentages for one-to-four family, commercial real estate, and commercial business loan categories decreased in 2015 due to the general improvements in credit quality of the portfolio. The allocation of the allowance for loan losses for consumer loans increased slightly due to an increase in the outstanding balances and types of consumer loans held between the periods.
Allowance for Real Estate Losses
Real estate properties acquired or expected to be acquired through loan foreclosures are initially recorded at fair value less estimated selling costs. Management periodically performs valuations and an allowance for losses is established if the carrying value of a property exceeds its fair value less estimated selling costs. The balance in the allowance for real estate losses was $0.8 million at December 31, 2015 and $1.7 million at December 31, 2014.
Non-performing Assets
Loans are reviewed at least quarterly and if the collectability of any loan is doubtful, it is placed on non-accrual status. Loans are placed on non-accrual status when either principal or interest is 90 days or more past due, unless, in the judgment of management, the loan is well collateralized and in the process of collection. Interest accrued and unpaid at the time a loan is placed on non-accrual status is charged against interest income. Subsequent payments are either applied to the outstanding principal balance or recorded as interest income, depending on the assessment of the ultimate collectability of the loan. Restructured loans include the Bank's troubled debt restructurings (TDRs) that involved forgiving a portion of interest or principal or making a loan at a rate materially less than the market rate to borrowers whose financial condition has deteriorated. Foreclosed and repossessed assets include assets acquired in settlement of loans. Total non-performing assets were $6.2 million at December 31, 2015, a decrease of $7.8 million, or 55.6%, from $14.0 million at December 31, 2014. Non-performing loans decreased $6.7 million and foreclosed and repossessed assets decreased $1.1 million during 2015. The decrease in non-performing loans relates primarily to a commercial real estate development relationship that was upgraded to performing status during the year due to the improved financial performance of the project as a result of increased lot sales. The following table sets forth the amounts and categories of non-performing assets (non-accrual loans and foreclosed and repossessed assets) in the Company’s portfolio:
MANAGEMENT DISCUSSION AND ANALYSIS
| | | December 31, | |
(Dollars in thousands) | | 2015 | | | 2014 | | | 2013 | | | 2012 | | | 2011 | |
Non-performing loans: | | | | | | | | | | | | | | | | | | | | |
One-to-four family | | $ | 1,655 | | | | 1,564 | | | | 1,602 | | | | 2,492 | | | | 4,435 | |
Commercial real estate | | | 1,694 | | | | 8,750 | | | | 14,549 | | | | 25,543 | | | | 22,658 | |
Consumer | | | 786 | | | | 486 | | | | 737 | | | | 300 | | | | 699 | |
Commercial business | | | 46 | | | | 120 | | | | 608 | | | | 1,640 | | | | 6,201 | |
Total | | | 4,181 | | | | 10,920 | | | | 17,496 | | | | 29,975 | | | | 33,993 | |
Foreclosed and repossessed assets: | | | | | | | | | | | | | | | | | | | | |
One-to-four family | | | 48 | | | | 50 | | | | 0 | | | | 1,595 | | | | 352 | |
Commercial real estate | | | 1,997 | | | | 3,053 | | | | 6,898 | | | | 9,000 | | | | 16,264 | |
Total | | | 2,045 | | | | 3,103 | | | | 6,898 | | | | 10,595 | | | | 16,616 | |
Total non-performing assets | | $ | 6,226 | | | $ | 14,023 | | | $ | 24,394 | | | $ | 40,570 | | | $ | 50,609 | |
Total as a percentage of total assets | | | 0.97 | % | | | 2.43 | % | | | 3.76 | % | | | 6.21 | % | | | 6.40 | % |
Total non-performing loans | | $ | 4,181 | | | $ | 10,920 | | | $ | 17,496 | | | $ | 29,975 | | | $ | 33,993 | |
Total as a percentage of total loans receivable, net | | | 0.90 | % | | | 2.99 | % | | | 4.55 | % | | | 6.60 | % | | | 6.10 | % |
Allowance for loan losses to non-performing loans | | | 232.22 | % | | | 76.30 | % | | | 65.17 | % | | | 72.09 | % | | | 70.27 | % |
| | | | | | | | | | | | | | | | | | | | | |
Gross interest income which would have been recorded had the non-accruing loans been current in accordance with their original terms amounted to $0.4 million for 2015, $0.9 million for 2014, and $1.8 million for 2013. The amounts that were included in interest income on a cash basis for these loans were $0.2 million, $0.2 million, and $0.1 million, respectively.
The following table summarizes the number and property type of commercial real estate loans that were non-performing (the largest category of non-performing loans) at December 31, 2015, 2014 and 2013.
(Dollars in thousands) | | | | | | Principal Amount of Loans at | | | | | | | Principal Amount of Loans at | | | | | | | Principal Amount of Loans at | |
Property Type | | # of Relationships | | | December 31, 2015 | | | # of Relationships | | | December 31, 2014 | | | # of Relationships | | | December 31, 2013 | |
Developments/land | | | 3 | | | $ | 1,694 | | | | 3 | | | $ | 8,750 | | | | 9 | | | $ | 14,549 | |
| | | | | | | | | | | | | | | | | | | | | | | | | |
The Company had allocated reserves established against the above commercial real estate loans of $0.2 million, $0.3 million, and $2.2 million, respectively, at December 31, 2015, 2014, and 2013.
At December 31, 2015, 2014 and 2013, there were loans included in loans receivable, net, with terms that had been modified in a TDR totaling $2.5 million, $9.4 million, and $17.4 million, respectively. Had the loans performed in accordance with their original terms throughout 2015, 2014, and 2013, the Company would have recorded gross interest income of $0.4 million, $0.9 million, and $1.8 million, respectively. During 2015, 2014 and 2013 the Company recorded gross interest income of $0.2 million, $0.3 million, and $0.5 million, respectively.
For the loans that were modified in 2015, $0.5 million were unclassified and performing, and $0.7 million were non-performing at December 31, 2015. The decrease in TDRs in 2015 relates primarily to a group of commercial development loans totaling $6.0 million that were upgraded to performing status and met the criteria to be removed from TDR classification during the year. Of the loans that were modified in 2015 and outstanding at December 31, 2015, $0.8 million related to loans secured by first or second mortgages on one-to-four family properties, and the remaining modifications related to other consumer or commercial loans.
For the loans that had been modified in 2014, $0.1 million were unclassified and performing and $0.1 million were non-performing at December 31, 2014. The decrease in TDRs in 2014 relates primarily to two related commercial development loans totaling $3.5 million that were charged down to $2.5 million and paid off during the year. TDRs also decreased during the year by $1.4 million due to the paydown of six loans in an unrelated commercial development, as well as $1.0 million due to the payoff of a loan for another unrelated commercial development. Of the loans that were modified in 2014 and outstanding at December 31, 2014, $0.2 million related to loans secured by first or second mortgages on one-to-four family properties, and the remaining modifications related to other consumer loans.
MANAGEMENT DISCUSSION AND ANALYSIS
For the loans that had been modified in 2013, $0.3 million were unclassified and performing and $0.8 million were non-performing at December 31, 2013. The decrease in TDRs in 2013 relates primarily to two commercial development loans for which $3.6 million in charge-offs were recorded during the year due to a decrease in the estimated value of the collateral supporting the loans. TDRs also decreased during the year by $4.0 million due to the paydown or payoff of four other unrelated commercial development loans, as well as $1.0 million due to the repossession and sale of collateral related to a consumer equity loan. The restructurings included reducing loan rates and restructuring repayment schedules to improve the borrower’s cash flow. Additional collateral was also obtained for some loans. Of the loans that were modified in 2013, $0.6 million related to loans secured by first or second mortgages on one-to-four family properties, and the remaining modifications related to other consumer, commercial real estate or commercial business loans.
The following table sets forth the amount of TDRs in the Company’s portfolio:
| | | December 31, | |
(Dollars in thousands) | | 2015 | | | 2014 | | | 2013 | | | 2012 | | | 2011 | |
One-to-four family | | $ | 647 | | | | 368 | | | | 840 | | | | 3,540 | | | | 3,752 | |
Commercial real estate | | | 725 | | | | 7,956 | | | | 14,781 | | | | 24,702 | | | | 19,524 | |
Consumer | | | 732 | | | | 571 | | | | 697 | | | | 1,814 | | | | 578 | |
Commercial business | | | 415 | | | | 555 | | | | 1,074 | | | | 1,614 | | | | 4,692 | |
Total TDRs | | | 2,519 | | | | 9,450 | | | | 17,392 | | | | 31,670 | | | | 28,546 | |
| | | | | | | | | | | | | | | | | | | | | |
TDRs on accrual status | | | 1,618 | | | | 7,414 | | | | 3,780 | | | | 7,125 | | | | 10,802 | |
TDRs on non-accrual status | | | 901 | | | | 2,036 | | | | 13,612 | | | | 24,545 | | | | 17,744 | |
Total | | $ | 2,519 | | | | 9,450 | | | | 17,392 | | | | 31,670 | | | | 28,546 | |
| | | | | | | | | | | | | | | | | | | | | |
In addition to the TDRs and the non-performing loans set forth in the table above of all non-performing assets, as of December 31, 2015, there were four other potential problem loan relationships totaling $6.5 million. Potential problem loans are loans that are not in non-performing status, however, there are circumstances present to create doubt as to the ability of the borrower to comply with present repayment terms. The decision of management to include performing loans in potential problem loans does not necessarily mean that the Company expects losses to occur but that management recognized a higher degree of risk associated with these loans. The level of potential problem loans is another predominant factor in determining the relative level of the allowance for loan losses. The four loan relationships that are reported as potential problem loans at December 31, 2015 were $6.0 million in loans to two unrelated trucking companies and $0.5 million in loans secured by agricultural assets to two unrelated individuals. The three loan relationships reported as potential problem loans at December 31, 2014 were a $3.8 million loan to an educational institution, a $0.6 million loan to a small manufacturing business, and three loans totaling $0.3 million to a golf course. The five loan relationships reported as potential problem loans at December 31, 2013 were a $0.7 million loan secured by an auto salvage business, and four other loans to unrelated borrowers totaling $0.9 million that are secured by restaurant business assets.
MANAGEMENT DISCUSSION AND ANALYSIS
Liquidity and Capital Resources
The Company attempts to manage its liquidity position so that the funding needs of borrowers and depositors are met timely and in a cost effective manner. Asset liquidity is the ability to convert assets to cash through the maturity or sale of the asset. Liability liquidity is the ability of the Bank to obtain retail, internet, or brokered deposits or to borrow funds from third parties such as the FHLB or the Federal Reserve Bank of Minneapolis.
The primary investing activities are the origination of loans and the purchase of securities. Principal and interest payments on loans and securities, along with the proceeds from the sale of loans held for sale, are the primary sources of cash for the Bank. Additional cash can be obtained by selling securities from the available for sale portfolio or by selling loans or mortgage servicing rights. Unpledged securities could also be pledged and used as collateral for additional borrowings with the FHLB or Federal Reserve Bank of Minneapolis to generate additional cash.
The primary financing activity is the attraction of retail and internet deposits. The Bank has the ability to borrow additional funds from the FHLB or Federal Reserve Bank of Minneapolis by pledging additional securities or loans, subject to applicable borrowing base and collateral requirements. See“Note 12 Federal Home Loan Bank (FHLB) Advances and Other Borrowings” in the Notes to Consolidated Financial Statements for more information on additional advances that could be drawn based upon existing collateral levels with the FHLB and the Federal Reserve Bank of Minneapolis.
The Bank's most liquid assets are cash and cash equivalents, which consist of short-term highly liquid investments with original maturities of less than three months that are readily convertible to known amounts of cash and interest-bearing deposits. The level of these assets is dependent on the operating, financing and investing activities during any given period.
Cash and cash equivalents at December 31, 2015 were $39.8 million, a decrease of $6.8 million, compared to $46.6 million at December 31, 2014. Net cash provided by operating activities during 2015 was $10.8 million. The Company conducted the following major investing activities during 2015: principal payments and maturity proceeds received on securities available for sale and FHLB stock were $190.0 million, purchases of securities available for sale and FHLB stock were $146.2 million, and the proceeds from the sale of premises and other real estate were $1.1 million. The Company also purchased premises and equipment of $0.8 million. Net loans receivable increased $80.5 million due primarily to increased loan originations. The Company recorded a gain on the acquisition of $0.3 million and received $4.8 million, net of cash, in connection with the transaction. Net cash used by investing activities during 2015 was $31.9 million. The Company conducted the following major financing activities during 2015: redemptions of preferred stock were $10.0 million, dividends paid to preferred stockholders totaled $0.2 million, deposits increased $15.4 million, received proceeds from borrowings of $65.0 million and repaid borrowings of $56.0 million. Net cash provided by financing activities was $14.2 million.
The Bank has certificates of deposits from customers with outstanding balances of $62.1 million that mature during 2016. Based upon past experience, management anticipates that the majority of the deposits will renew for another term. The Company believes that deposits that do not renew will be replaced with deposits from other customers or FHLB advances. Proceeds from the sale of securities could also be used to fund unanticipated outflows of deposits.
The Bank has deposits of $59.7 million in checking and money market accounts of four customers that have relationship balances greater than $5.0 million. These funds may be withdrawn at any time, however, management anticipates that the majority of these deposits will remain on deposit with the Bank over the next twelve months. If these deposits are withdrawn, it is anticipated that they would be funded with available cash or replaced with deposits from other customers or FHLB advances. Proceeds from the sale of securities could also be used to fund unanticipated outflows of deposits.
Dividends from the Bank have been the Company’s primary source of cash. The Bank is restricted under applicable federal banking law from paying dividends to the Company without prior notice to and non-objection of the applicable regulator. During 2015, the Bank paid dividends to the Company of $3.0 million and at December 31, 2015, the Company had $2.6 million in cash and other assets that could readily be turned into cash.
On February 17, 2015, the Company redeemed the final 10,000shares of outstanding Preferred Stock after redeeming 16,000 shares in 2014. After giving effect to a dividend of $22.50 per share on the Preferred Stock that was paid on the same date, the redemption price per share was $1,000. The Preferred Stock redemption was funded through a $10.0 million term loan to HMN from an unrelated third party that was evidenced by a promissory note. The interest payments on the note are due quarterly. The principal balance of the note bears interest at a rate of 6.5% and is payable in consecutive annual installments of $1.0 million on each December 15, beginning December 15, 2015, with the balance due on December 15, 2021. The Preferred Stock dividend was funded by HMN through internally available funds.
MANAGEMENT DISCUSSION AND ANALYSIS
The Company’s primary use of cash is the payment of principal and interest on the third party note payable, and holding company level expenses, including the payment of director and management fees as well as legal expenses and other regulatory costs. The Company does not anticipate that it will have on a stand-alone basis adequate liquid resources to make future interest and principal payments on its third party note payable and fund the Company-level expenses. The Company plans to continue to fund its liquidity needs through dividends from the Bank or external capital. Provided that no default or event of default has occurred and is continuing, the Company may also, at its option, elect to defer payment of one installment of principal of the third party note payable otherwise due prior to the maturity date, in which event such installment will become due and payable on the maturity date.
Contractual Obligations and Commercial Commitments
The Company has certain obligations and commitments to make future payments under existing contracts. At December 31, 2015, the aggregate contractual obligations (excluding bank deposits) and commercial commitments were as follows:
| | | Payments Due by Period | |
(Dollars in thousands) | | Total | | | Less than 1 Year | | | 1-3 Years | | | 4-5 Years | | | After 5 Years | |
Contractual Obligations: | | | | | | | | | | | | | | | | | | | | |
Total borrowings | | $ | 9,000 | | | | 1,000 | | | | 2,000 | | | | 2,000 | | | | 4,000 | |
Annual rental commitments under non-cancellable operating leases | | | 6,673 | | | | 830 | | | | 1,559 | | | | 1,418 | | | | 2,866 | |
Total contractual obligations | | $ | 15,673 | | | | 1,830 | | | | 3,559 | | | | 3,418 | | | | 6,866 | |
| | | Amount of Commitments Expiring by Period | |
Other Commercial Commitments: | | | | | | | | | | | | | | | | | | | | |
Commercial lines of credit | | $ | 45,513 | | | | 26,752 | | | | 5,408 | | | | 8,343 | | | | 5,010 | |
Commitments to lend | | | 39,450 | | | | 7,072 | | | | 9,612 | | | | 3,812 | | | | 18,954 | |
Standby letters of credit | | | 1,077 | | | | 1,072 | | | | 5 | | | | 0 | | | | 0 | |
Total other commitments | | $ | 86,040 | | | | 34,896 | | | | 15,025 | | | | 12,155 | | | | 23,964 | |
| | | | | | | | | | | | | | | | | | | | | |
Regulatory Capital Requirements
Effective January 1, 2015 the capital requirements of the Company and the Bank were changed to implement the regulatory requirements of the Basel III capital reforms. The new requirements, among other things, (i) apply a strengthened set of capital requirements to the Bank (the Company is exempt, pursuant to the Small Bank Holding Company Policy Statement (Policy Statement), described below), including new requirements relating to common equity as a component of core capital, (ii) implement a “capital conservation buffer” against risk and a higher minimum tier 1 capital requirement, and (iii) revise the rules for calculating risk-weighted assets for purposes of such requirements. The new rules made corresponding revisions to the prompt corrective action framework and include the new capital ratios and buffer requirements which will be phased in incrementally, with full implementation scheduled for January 1, 2019. Failure by the Bank to meet minimum capital requirements can initiate certain mandatory and possibly additional discretionary actions by regulators that, if undertaken, could have a direct material effect on the Company's financial statements. Under capital adequacy guidelines and the regulatory framework for prompt corrective action, both the Company and the Bank must meet specific capital guidelines that involve quantitative measures of their assets, liabilities and certain off-balance sheet items as calculated under regulatory accounting practices. The capital amounts and classification are also subject to qualitative judgments by the regulators about components, risk weightings and other factors. Management believes that, as of December 31, 2015, the Bank’s capital ratios were in excess of those quantitative capital ratio standards set forth under the prompt corrective action regulations. However, there can be no assurance that the Bank will continue to maintain such status in the future. The OCC has extensive discretion in its supervisory and enforcement activities, and can further adjust the requirement to be “well-capitalized” in the future. See“Note 17 Regulatory Capital” of the Notes to Consolidated Financial Statements for a table which reflects the Bank’s capital compared to these capital requirements.
In the second quarter of 2015, the FRB amended its Policy Statement, which exempted small bank holding companies from the above capital requirements, by raising the asset size threshold for determining applicability from $500 million to $1 billion. The Policy Statement was also expanded to include savings and loan holding companies that meet the Policy Statement’s qualitative requirements for exemption. The Company met the qualitative exemption requirements, and therefore, is exempt from the above capital requirements.
MANAGEMENT DISCUSSION AND ANALYSIS
The Company also serves as a source of capital, liquidity and financial support to the Bank. Depending upon the operating performance of the Bank and the Company’s other liquidity and capital needs, including potentially Company-level expenses and the payment of principal and interest payments on the third party note payable, the Company may find it prudent, subject to prevailing capital market conditions and other factors, to raise additional capital through issuance of its common stock or other equity securities. In addition, regulators have placed increasing emphasis on the amount of common equity as a component of core capital, and revised capital regulations incorporate specific levels of common equity capital. Additional capital would also potentially permit the Company to implement a strategy of growing Bank assets. Depending on the circumstances, if it were to raise capital, the Company may deploy it to the Bank for general banking purposes, or may retain some or all of it for use by the Company.
If the Company raises capital through the issuance of additional shares of common stock or other equity securities, it would dilute the ownership interests of existing stockholders and, if issued at less than the Company’s book value would dilute the per share book value of the Company’s common stock, dilute the Company’s earnings per share, and could result in a change of control of the Company and the Bank. New investors may also have rights, preferences and privileges senior to the Company’s current stockholders, which may adversely impact the Company’s current stockholders. The Company’s ability to raise additional capital through the issuance of equity securities, if deemed prudent, will depend on, among other factors, conditions in the capital markets at that time, which are outside of its control, and on the Company’s financial performance and plans. Accordingly, the Company may not be able to raise additional capital, if deemed prudent, on favorable economic terms, or other terms acceptable to it. If the Bank cannot satisfactorily address its capital needs as they arise, the Bank’s ability to maintain or expand its operations, maintain compliance with the regulatory capital requirements, to operate without additional regulatory or other restrictions, and its operating results, could be materially adversely affected.
Dividends
The declaration of dividends is subject to, among other things, the Company's financial condition and results of operations, the Bank's compliance with regulatory capital requirements and other regulatory restrictions, tax considerations, industry standards, economic conditions, general business practices and other factors. The Company has not made any dividend payments to common stockholders during the three year period ending December 31, 2015.
Under applicable federal banking laws and regulations, no dividends can be declared or paid by the Bank to the Company without notice to and non-objection from the applicable banking regulator. There is no assurance that the Bank and the Company would satisfy the applicable regulatory requirements necessary to effect any such dividends. The payment of dividends by the Company is dependent upon the Company having adequate cash or other assets that can be converted to cash to pay dividends to its stockholders. Further, any determination as to whether, when and in what amount to declare and pay any such dividends would be subject to the discretion of the boards of directors of the Bank and the Company and would depend on numerous factors including the results of operations, financial conditions, growth plans, and cash flow requirements of the Company and the Bank.
Impact of Inflation and Changing Prices
The impact of inflation is reflected in the increased cost of operations. Unlike most industrial companies, nearly all of the assets and liabilities of the Company are monetary in nature. As a result, interest rates have a greater impact on the Company's performance than do the effects of general levels of inflation. Interest rates do not necessarily move in the same direction or to the same extent as the prices of goods and services.
New Accounting Pronouncements
In January 2016, the FASB issued ASU 2016-01, Financial Instruments – Overall (Subtopic 825-10) Recognition and Measurement of Financial Assets and Financial Liabilities.The amendments in this ASU address certain aspects of recognition, measurement, presentation, and disclosure of financial instruments. It requires, among other things, equity investments to be measured at fair value with changes in fair value recognized in net income; public business entities to use the exit price notion when measuring the fair value of financial instruments for disclosure purposes; the separate presentation in other comprehensive income of the portion of the total change in the fair value of a liability resulting from a change in the instrument-specific credit risk when the entity has elected to measure the liability at fair value in accordance with the fair value option for financial instruments; separate presentation of financial assets and financial liabilities by measurement category and form of financial assets on the balance sheet or the accompanying notes to the financial statements. It also eliminates the requirement for public business entities to disclose the method(s) and significant assumptions used to estimate the fair value that is required to be disclosed for financial instruments measured at amortized cost on the balance sheet; simplifies the impairment assessment of equity investments without readily determinable fair values by requiring a qualitative assessment to identify impairment; and clarifies that an entity should evaluate the need for a valuation allowance on a deferred tax asset related to available-for-sale securities in combination with the entity’s other deferred tax assets. The ASU is intended to reduce diversity in practice and is effective for public business entities for fiscal years beginning after December 15, 2017, including interim periods within those fiscal years. The amendments should be applied by means of a cumulative-effect adjustment to the balance sheet as of the beginning of the fiscal year of adoption. The amendments related to equity securities without readily determinable fair values should be applied prospectively to equity investments that exist as of the date of adoption. The adoption of this ASU in the first quarter of 2018 is not anticipated to have a material impact on the Company’s consolidated financial statements.
MANAGEMENT DISCUSSION AND ANALYSIS
Market Risk
Market risk is the risk of loss from adverse changes in market prices and rates. The Company's market risk arises primarily from interest rate risk inherent in its investing, lending and deposit taking activities. Management actively monitors and manages its interest rate risk exposure.
The Company's profitability is affected by fluctuations in interest rates. A sudden and substantial change in interest rates may adversely impact the Company's earnings to the extent that the interest rates borne by assets and liabilities do not change at the same speed, to the same extent, or on the same basis. The Company monitors the projected changes in net interest income that occur if interest rates were to suddenly change up or down. TheRate Shock Tablelocated in the following Asset/Liability Management section of this Management’s Discussion and Analysis discloses the Company's projected changes in net interest income based upon immediate interest rate changes called rate shocks.
The Company utilizes a model that uses the discounted cash flows from its interest-earning assets and its interest-bearing liabilities to calculate the current market value of those assets and liabilities. The model also calculates the changes in market value of the interest-earning assets and interest-bearing liabilities under different interest rate changes.
The following table discloses the projected changes in market value to the Company’s interest-earning assets and interest-bearing liabilities based upon incremental 100 basis point changes in interest rates from interest rates in effect on December 31, 2015.
| | | Market Value | |
(Dollars in thousands) Basis point change in interest rates | | -100 | | | 0 | | | +100 | | | +200 | |
Total market-risk sensitive assets | | $ | 631,484 | | | | 620,803 | | | | 605,106 | | | | 591,510 | |
Total market-risk sensitive liabilities | | | 558,598 | | | | 524,172 | | | | 502,724 | | | | 472,877 | |
Off-balance sheet financial instruments | | | (351 | ) | | | 0 | | | | 79 | | | | 198 | |
Net market risk | | $ | 73,237 | | | | 96,631 | | | | 102,303 | | | | 118,435 | |
Percentage change from current market value | | | (24.21 | )% | | | 0.00 | % | | | 5.87 | % | | | 22.56 | % |
| | | | | | | | | | | | | | | | | |
The preceding table was prepared utilizing the following assumptions (the Model Assumptions) regarding prepayment and decay ratios that were determined by management based upon their review of historical prepayment speeds and future prepayment projections. Fixed rate loans were assumed to prepay at annual rates of between 5% and 58%, depending on the note rate and the period to maturity. Adjustable rate mortgages (ARMs) were assumed to prepay at annual rates of between 18% and 138%, depending on the note rate and the period to maturity. Mortgage-backed securities were projected to haveprepayments based upon the underlying collateral securing the instrument. Certificate accounts were assumed not to be withdrawn until maturity. Passbook and money market accounts were assumed to decay at annual rates of 6% and 8%, respectively. Non-interest checking and NOW accounts were both assumed to decay at an annual rate of 3%. Commercial non-interest checking and NOW accounts were assumed to decay at an annual rate of 7%. Commercial MMDA accounts were assumed to decay at annual rates of 12%.
Certain shortcomings are inherent in the method of analysis presented in the foregoing table. The interest rates on certain types of assets and liabilities may fluctuate in advance of changes in market interest rates, while interest rates on other types of assets and liabilities may lag behind changes in market interest rates. The model assumes that the difference between the current interest rate being earned or paid compared to a treasury instrument or other interest index with a similar term to maturity (the interest spread) will remain constant over the interest changes disclosed in the table. Changes in interest spread could impact projected market value changes. Certain assets, such as ARMs, have features that restrict changes in interest rates on a short-term basis and over the life of the assets. The market value of the interest-bearing assets that are approaching their lifetime interest rate caps or floors could be different from the values calculated in the table. Certain liabilities, such as certificates of deposit, have fixed rates that restrict interest rate changes until maturity. In the event of a change in interest rates, prepayment and early withdrawal levels may deviate significantly from those assumed in calculating the foregoing table. The ability of many borrowers to service their debt may also decrease in the event of a substantial sustained increase in interest rates.
MANAGEMENT DISCUSSION AND ANALYSIS
Asset/Liability Management
The Company's management reviews the impact that changing interest rates will have on the net interest income projected for the twelve months following December 31, 2015 to determine if its current level of interest rate risk is acceptable. The following table projects the estimated impact on net interest income during the 12 month period ending December 31, 2016 of immediate interest rate changes called rate shocks:
(Dollars in thousands) | |
Rate Shock in Basis Points | | | Net Interest Change | | | Percent Change | |
| +200 | | | $ | 2,710 | | | | 11.82 | % |
| +100 | | | | 1,330 | | | | 5.80 | |
| 0 | | | | 0 | | | | 0.00 | |
| -100 | | | | (1,919 | ) | | | (8.37 | ) |
| | | | | | | | | | |
The preceding table was prepared utilizing the Model Assumptions. Certain shortcomings are inherent in the method of analysis presented in the foregoing table. In the event of a change in interest rates, prepayment and early withdrawal levels would likely deviate significantly from those assumed in calculating the foregoing table. The ability of many borrowers to service their debt may decrease in the event of a substantial increase in interest rates and could impact net interest income. The increase in interest income in a rising rate environment is because there are more adjustable rate loans that would re-price to higher interest rates in the next twelve months than there are deposits that would re-price.
In an attempt to manage its exposure to changes in interest rates, management closely monitors interest rate risk. The Company has an Asset/Liability Committee that meets frequently to discuss changes in the interest rate risk position and projected profitability. The Committee makes adjustments to the asset-liability position of the Bank that are reviewed by the Board of Directors of the Bank. This Committee also reviews the Bank's portfolio, formulates investment strategies and oversees the timing and implementation of transactions as intended to assure attainment of the Bank's objectives in an effective manner. In addition, the Board reviews, on a quarterly basis, the Bank's asset/liability position, including simulations of the effect on the Bank's capital of various interest rate scenarios.
In managing its asset/liability mix, the Bank may, at times, depending on the relationship between long and short-term interest rates, market conditions and consumer preference, place more emphasis on managing net interest margin than on better matching the interest rate sensitivity of its assets and liabilities in an effort to enhance net interest income. Management believes that the increased net interest income resulting from a mismatch in the maturity of its asset and liability portfolios can, in certain situations, provide high enough returns to justify the increased exposure to sudden and unexpected changes in interest rates.
To the extent consistent with its interest rate spread objectives, the Bank attempts to manage its interest rate risk and has taken a number of steps to restructure its balance sheet in order to better match the maturities of its assets and liabilities. In the past, more long term fixed rate loans were placed into the single family loan portfolio. In recent years, the Bank has continued to focus its 30 year fixed rate single family residential lending program on loans that are saleable to third parties and generally places only adjustable rate or shorter term fixed rate loans that meet certain risk characteristics into its loan portfolio. A significant portion of the Bank’s commercial loan production continues to be in adjustable rate loans that re-price every one, two, or three years.
Off-Balance Sheet Arrangements
The Company has no off-balance sheet arrangements other than commitments to originate and sell loans in the ordinary course of business. See“Note 18 Financial Instruments with Off-Balance Sheet Risk” in the Notes to Consolidated Financial Statements for additional information. Management believes that the Company has sufficient liquidity to satisfy its off-balance sheet obligations.
CONSOLIDATED BALANCE SHEETS
December 31 (Dollars in thousands) | | 2015 | | | 2014 | |
| | | | | | | | | |
ASSETS | | | | | | | | |
Cash and cash equivalents | | $ | 39,782 | | | | 46,634 | |
Securities available for sale: | | | | | | | | |
Mortgage-backed and related securities(amortized cost $2,237 and $2,755) | | | 2,283 | | | | 2,909 | |
Other marketable securities(amortized cost $110,092 and $135,772) | | | 109,691 | | | | 134,925 | |
| | | | 111,974 | | | | 137,834 | |
| | | | | | | | | |
Loans held for sale | | | 3,779 | | | | 2,076 | |
Loans receivable, net | | | 463,185 | | | | 365,113 | |
Accrued interest receivable | | | 2,254 | | | | 1,713 | |
Real estate, net | | | 2,045 | | | | 3,103 | |
Federal Home Loan Bank stock, at cost | | | 691 | | | | 777 | |
Mortgage servicing rights, net | | | 1,499 | | | | 1,507 | |
Premises and equipment, net | | | 7,469 | | | | 6,982 | |
Core deposit intangible | | | 393 | | | | 0 | |
Prepaid expenses and other assets | | | 1,417 | | | | 1,157 | |
Deferred tax asset, net | | | 8,673 | | | | 10,530 | |
Total assets | | $ | 643,161 | | | | 577,426 | |
| | | | | | | | | |
| | | | | | | | | |
LIABILITIES AND STOCKHOLDERS’ EQUITY | | | | | | | | |
Deposits | | $ | 559,387 | | | | 496,750 | |
Other borrowings | | | 9,000 | | | | 0 | |
Accrued interest payable | | | 242 | | | | 93 | |
Customer escrows | | | 830 | | | | 788 | |
Accrued expenses and other liabilities | | | 4,057 | | | | 3,782 | |
Total liabilities | | | 573,516 | | | | 501,413 | |
| | | | | | | | | |
Commitments and contingencies | | | | | | | | |
Stockholders’ equity: | | | | | | | | |
Serial-preferred stock: ($.01 par value)authorized 500,000 shares; issued shares 0 and 10,000 | | | 0 | | | | 10,000 | |
Common stock ($.01 par value):authorized 16,000,000; issued shares 9,128,662 | | | 91 | | | | 91 | |
Additional paid-in capital | | | 50,388 | | | | 50,207 | |
Retained earnings, subject to certain restrictions | | | 80,536 | | | | 77,805 | |
Accumulated other comprehensive loss | | | (214 | ) | | | (418 | ) |
Unearned employee stock ownership plan shares | | | (2,417 | ) | | | (2,610 | ) |
Treasury stock, at cost 4,645,769 and 4,658,323 shares | | | (58,739 | ) | | | (59,062 | ) |
Total stockholders’ equity | | | 69,645 | | | | 76,013 | |
Total liabilities and stockholders’ equity | | $ | 643,161 | | | | 577,426 | |
See accompanying notes to consolidated financial statements.
Consolidated Statements of COMPREHENSIVE INCOME
Years ended December 31 (Dollars in thousands) | | 2015 | | | 2014 | | | 2013 | |
Interest income: | | | | | | | | | | | | |
Loans receivable | | $ | 19,389 | | | | 18,987 | | | | 21,887 | |
Securities available for sale: | | | | | | | | | | | | |
Mortgage-backed and related | | | 116 | | | | 164 | | | | 300 | |
Other marketable | | | 1,881 | | | | 1,269 | | | | 614 | |
Cash equivalents | | | 63 | | | | 189 | | | | 129 | |
Other | | | 4 | | | | 4 | | | | 53 | |
Total interest income | | | 21,453 | | | | 20,613 | | | | 22,983 | |
| | | | | | | | | | | | | |
Interest expense: | | | | | | | | | | | | |
Deposits | | | 934 | | | | 1,211 | | | | 1,804 | |
Federal Home Loan Bank advances and other borrowings | | | 573 | | | | 0 | | | | 1,485 | |
Total interest expense | | | 1,507 | | | | 1,211 | | | | 3,289 | |
Net interest income | | | 19,946 | | | | 19,402 | | | | 19,694 | |
Provision for loan losses | | | (164 | ) | | | (6,998 | ) | | | (7,881 | ) |
Net interest income after provision for loan losses | | | 20,110 | | | | 26,400 | | | | 27,575 | |
| | | | | | | | | | | | | |
Non-interest income: | | | | | | | | | | | | |
Fees and service charges | | | 3,316 | | | | 3,458 | | | | 3,513 | |
Loan servicing fees | | | 1,046 | | | | 1,058 | | | | 1,029 | |
Gain on sales of loans | | | 1,964 | | | | 1,828 | | | | 2,102 | |
Gain on acquisition | | | 289 | | | | 0 | | | | 0 | |
Other | | | 1,038 | | | | 940 | | | | 668 | |
Total non-interest income | | | 7,653 | | | | 7,284 | | | | 7,312 | |
| | | | | | | | | | | | | |
Non-interest expense: | | | | | | | | | | | | |
Compensation and benefits | | | 13,733 | | | | 13,332 | | | | 12,680 | |
Losses (gains) on real estate owned | | | 218 | | | | (1,194 | ) | | | (830 | ) |
Occupancy | | | 3,722 | | | | 3,691 | | | | 3,338 | |
Deposit insurance | | | 375 | | | | 435 | | | | 868 | |
Data processing | | | 1,020 | | | | 1,011 | | | | 1,289 | |
Other | | | 4,128 | | | | 4,128 | | | | 5,278 | |
Total non-interest expense | | | 23,196 | | | | 21,403 | | | | 22,623 | |
Income before income tax expense | | | 4,567 | | | | 12,281 | | | | 12,264 | |
Income tax expense (benefit) | | | 1,611 | | | | 4,902 | | | | (14,406 | ) |
Net income | | | 2,956 | | | | 7,379 | | | | 26,670 | |
Preferred stock dividends | | | (108 | ) | | | (1,710 | ) | | | (2,068 | ) |
Net income available to common shareholders | | $ | 2,848 | | | | 5,669 | | | | 24,602 | |
Other comprehensive income (loss), net of tax | | | 204 | | | | 256 | | | | (625 | ) |
Comprehensive income available to common shareholders | | $ | 3,052 | | | | 5,925 | | | | 23,977 | |
Basic earnings per common share | | $ | 0.69 | | | | 1.40 | | | | 6.15 | |
Diluted earnings per common share | | $ | 0.61 | | | | 1.23 | | | | 5.71 | |
See accompanying notes to consolidated financial statements.
Consolidated Statements of Stockholders’ Equity
| | | | | | | | | | | | | | | | | | | Accumulated | | | Unearned | | | | | | | | | |
| | | | | | | | | | | | | | | | | | | Other | | | Employee | | | | | | | Total | |
| | | | | | | | | | | Additional | | | | | | | Comprehensive | | | Stock | | | | | | | Stock- | |
| | | Preferred | | | Common | | | Paid-in | | | Retained | | | Income | | | Ownership | | | Treasury | | | holders’ | |
(Dollars in thousands) | | Stock | | | Stock | | | Capital | | | Earnings | | | (Loss) | | | Plan | | | Stock | | | Equity | |
Balance, December 31, 2012 | | $ | 25,336 | | | | 91 | | | | 51,795 | | | | 47,004 | | | | (49 | ) | | | (2,997 | ) | | | (60,346 | ) | | | 60,834 | |
Net income | | | | | | | | | | | | | | | 26,670 | | | | | | | | | | | | | | | | 26,670 | |
Other comprehensive loss | | | | | | | | | | | | | | | | | | | (625 | ) | | | | | | | | | | | (625 | ) |
Preferred stock discount amortization | | | 664 | | | | | | | | (664 | ) | | | | | | | | | | | | | | | | | | | 0 | |
Stock compensation expense | | | | | | | | | | | 4 | | | | | | | | | | | | | | | | | | | | 4 | |
Restricted stock awards | | | | | | | | | | | (349 | ) | | | | | | | | | | | | | | | 349 | | | | 0 | |
Restricted stock awards forfeited | | | | | | | | | | | 208 | | | | | | | | | | | | | | | | (327 | ) | | | (119 | ) |
Amortization of restricted stock awards | | | | | | | | | | | 202 | | | | | | | | | | | | | | | | | | | | 202 | |
Preferred stock dividends | | | | | | | | | | | | | | | (1,463 | ) | | | | | | | | | | | | | | | (1,463 | ) |
Earned employee stockownership plan shares | | | | | | | | | | | (21 | ) | | | | | | | | | | | 193 | | | | | | | | 172 | |
Balance, December 31, 2013 | | $ | 26,000 | | | | 91 | | | | 51,175 | | | | 72,211 | | | | (674 | ) | | | (2,804 | ) | | | (60,324 | ) | | | 85,675 | |
Net income | | | | | | | | | | | | | | | 7,379 | | | | | | | | | | | | | | | | 7,379 | |
Other comprehensive income | | | | | | | | | | | | | | | | | | | 256 | | | | | | | | | | | | 256 | |
Redemption of preferred stock | | | (16,000 | ) | | | | | | | | | | | | | | | | | | | | | | | | | | | (16,000 | ) |
Stock compensation tax benefits | | | | | | | | | | | 1 | | | | | | | | | | | | | | | | | | | | 1 | |
Restricted stock awards | | | | | | | | | | | (1,262 | ) | | | | | | | | | | | | | | | 1,262 | | | | 0 | |
Amortization of restricted stock awards | | | | | | | | | | | 240 | | | | | | | | | | | | | | | | | | | | 240 | |
Preferred stock dividends | | | | | | | | | | | | | | | (1,785 | ) | | | | | | | | | | | | | | | (1,785 | ) |
Earned employee stockownership plan shares | | | | | | | | | | | 53 | | | | | | | | | | | | 194 | | | | | | | | 247 | |
Balance, December 31, 2014 | | $ | 10,000 | | | | 91 | | | | 50,207 | | | | 77,805 | | | | (418 | ) | | | (2,610 | ) | | | (59,062 | ) | | | 76,013 | |
Net income | | | | | | | | | | | | | | | 2,956 | | | | | | | | | | | | | | | | 2,956 | |
Other comprehensive income | | | | | | | | | | | | | | | | | | | 204 | | | | | | | | | | | | 204 | |
Redemption of preferred stock | | | (10,000 | ) | | | | | | | | | | | | | | | | | | | | | | | | | | | (10,000 | ) |
Restricted stock awards | | | | | | | | | | | (332 | ) | | | | | | | | | | | | | | | 332 | | | | 0 | |
Restricted stock awards forfeiture | | | | | | | | | | | 9 | | | | | | | | | | | | | | | | (9 | ) | | | 0 | |
Amortization of restricted stock awards | | | | | | | | | | | 447 | | | | | | | | | | | | | | | | | | | | 447 | |
Preferred stock dividends | | | | | | | | | | | | | | | (225 | ) | | | | | | | | | | | | | | | (225 | ) |
Earned employee stockownership plan shares | | | | | | | | | | | 57 | | | | | | | | | | | | 193 | | | | | | | | 250 | |
Balance, December 31, 2015 | | $ | 0 | | | | 91 | | | | 50,388 | | | | 80,536 | | | | (214 | ) | | | (2,417 | ) | | | (58,739 | ) | | | 69,645 | |
| | | | | | | | | | | | | | | | | | | | | | | | | | | | | | | | | |
See accompanying notes to consolidated financial statements.
CONSOLIDATED STATEMENTS OF CASH FLOWS
Years ended December 31 (Dollars in thousands) | | 2015 | | | 2014 | | | 2013 | |
Cash flows from operating activities: | | | | | | | | | | | | |
Net income | | $ | 2,956 | | | | 7,379 | | | | 26,670 | |
Adjustments to reconcile net income to cash provided by operating activities: | | | | | | | | | | | | |
Provision for loan losses | | | (164 | ) | | | (6,998 | ) | | | (7,881 | ) |
Depreciation | | | 706 | | | | 576 | | | | 880 | |
Amortization of premiums (discounts), net | | | (3 | ) | | | 18 | | | | 80 | |
Amortization of deferred loan fees | | | (964 | ) | | | (340 | ) | | | (249 | ) |
Amortization of core deposit intangible | | | 28 | | | | 0 | | | | 0 | |
Amortization of purchased loan fair value adjustments | | | (657 | ) | | | 0 | | | | 0 | |
Amortization of mortgage servicing rights | | | 555 | | | | 517 | | | | 592 | |
Capitalized mortgage servicing rights | | | (547 | ) | | | (316 | ) | | | (568 | ) |
Deferred income tax expense (benefit) | | | 1,722 | | | | 4,566 | | | | (14,464 | ) |
Securities gains, net | | | (6 | ) | | | 0 | | | | 0 | |
(Gains) losses on sales of real estate and premises | | | 218 | | | | (1,194 | ) | | | (830 | ) |
Gain on sales of loans | | | (1,964 | ) | | | (1,828 | ) | | | (2,102 | ) |
Proceeds from sales of loans held for sale | | | 78,278 | | | | 56,040 | | | | 84,718 | |
Disbursements on loans held for sale | | | (69,941 | ) | | | (41,557 | ) | | | (69,347 | ) |
Amortization of restricted stock awards | | | 447 | | | | 240 | | | | 202 | |
Amortization of unearned ESOP shares | | | 193 | | | | 194 | | | | 193 | |
Cancellation of vested restricted stock awards | | | 0 | | | | 0 | | | | (119 | ) |
Earned ESOP shares priced above (below) original cost | | | 57 | | | | 53 | | | | (21 | ) |
Stock option compensation expense | | | 0 | | | | 1 | | | | 4 | |
(Increase) decrease in accrued interest receivable | | | (346 | ) | | | 240 | | | | 65 | |
Increase (decrease) in accrued interest payable | | | 137 | | | | (53 | ) | | | (101 | ) |
(Increase) decrease in other assets | | | (239 | ) | | | (444 | ) | | | 842 | |
Increase (decrease) in other liabilities | | | 302 | | | | (265 | ) | | | 364 | |
Other, net | | | 52 | | | | 515 | | | | 64 | |
Net cash provided by operating activities | | | 10,820 | | | | 17,344 | | | | 18,992 | |
Cash flows from investing activities: | | | | | | | | | | | | |
Proceeds from sales of securities available for sale | | | 10,951 | | | | 0 | | | | 0 | |
Principal collected on securities available for sale | | | 1,694 | | | | 2,148 | | | | 4,933 | |
Proceeds collected on maturity of securities available for sale | | | 175,070 | | | | 125,000 | | | | 21,000 | |
Purchases of securities available for sale | | | (144,069 | ) | | | (157,004 | ) | | | (49,090 | ) |
Purchase of Federal Home Loan Bank stock | | | (2,152 | ) | | | 0 | | | | (178 | ) |
Redemption of Federal Home Loan Bank stock | | | 2,238 | | | | 7 | | | | 3,457 | |
Proceeds from sales of real estate and premises | | | 1,127 | | | | 4,816 | | | | 5,786 | |
Net (increase) decrease in loans receivable | | | (80,447 | ) | | | 13,455 | | | | 63,814 | |
Gain on acquisition | | | (289 | ) | | | 0 | | | | 0 | |
Acquisition payment (net of cash acquired) | | | 4,816 | | | | 0 | | | | 0 | |
Purchases of premises and equipment | | | (803 | ) | | | (847 | ) | | | (425 | ) |
Net cash (used) provided by investing activities | | | (31,864 | ) | | | (12,425 | ) | | | 49,297 | |
Cash flows from financing activities: | | | | | | | | | | | | |
Increase (decrease) in deposits | | | 15,375 | | | | (57,182 | ) | | | 38,953 | |
Redemption of preferred stock | | | (10,000 | ) | | | (16,000 | ) | | | 0 | |
Dividends paid to preferred stockholders | | | (225 | ) | | | (5,964 | ) | | | 0 | |
Proceeds from borrowings | | | 65,000 | | | | 0 | | | | 12,000 | |
Repayment of borrowings | | | (56,000 | ) | | | 0 | | | | (82,000 | ) |
Increase (decrease) in customer escrows | | | 42 | | | | 175 | | | | (216 | ) |
Net cash provided (used) by financing activities | | | 14,192 | | | | (78,971 | ) | | | (31,263 | ) |
(Decrease) increase in cash and cash equivalents | | | (6,852 | ) | | | (74,052 | ) | | | 37,026 | |
Cash and cash equivalents, beginning of year | | | 46,634 | | | | 120,686 | | | | 83,660 | |
Cash and cash equivalents, end of year | | $ | 39,782 | | | | 46,634 | | | | 120,686 | |
Supplemental cash flow disclosures: | | | | | | | | | | | | |
Cash paid for interest | | $ | 1,358 | | | | 1,264 | | | | 3,390 | |
Cash paid for income taxes | | | 191 | | | | 0 | | | | 205 | |
Supplemental noncash flow disclosures: | | | | | | | | | | | | |
Loans transferred to loans held for sale | | | 8,125 | | | | 13,243 | | | | 12,183 | |
Transfer of loans to real estate | | | 110 | | | | 142 | | | | 1,563 | |
See accompanying notes to consolidated financial statements.
NOTES TO CONSOLIDATED FINANCIAL STATEMENTS
December 31, 2015, 2014 and 2013
NOTE 1 Description of the Business and Summary of Significant Accounting Policies
HMN Financial, Inc. (HMN or the Company) is a stock savings bank holding company that owns 100 percent of Home Federal Savings Bank (the Bank). The Bank has a community banking philosophy and operates retail banking and loan production facilities in Minnesota, Iowa, and Wisconsin. The Bank has two wholly owned subsidiaries, Osterud Insurance Agency, Inc. (OIA), which offers financial planning products and services, and HFSB Property Holdings, LLC (HPH), which was inactive in 2015, but has acted as an intermediary for the Bank in holding and operating certain foreclosed properties.
The consolidated financial statements included herein are for HMN, the Bank, OIA, and HPH. All significant intercompany accounts and transactions have been eliminated in consolidation.
The Company evaluated subsequent events through the filing date of our annual 10-K with the Securities and Exchange Commission on March 11, 2016.
Use of Estimates
In preparing the consolidated financial statements, management is required to make estimates and assumptions that affect the reported amounts of assets and liabilities as of the date of the balance sheet and revenues and expenses for the period. Actual results could differ from those estimates.
An estimate that is particularly susceptible to change relates to the determination of the allowance for loan losses. Management believes that the allowance for loan losses is appropriate to cover probable losses inherent in the portfolio at the date of the balance sheet. While management uses available information to recognize losses on loans, future additions to the allowance may be necessary based on changes in economic conditions and other factors. In addition, various regulatory agencies, as an integral part of their examination process, periodically review the allowance for loan losses. Such agencies may require changes to the allowance based on their judgment about information available to them at the time of their examination.
Cash and Cash Equivalents
The Company considers highly liquid investments with original maturities of three months or less to be cash equivalents.
Securities
Securities are accounted for according to their purpose and holding period. The Company classifies its debt and equity securities in one of three categories:
Trading Securities
Securities held principally for resale in the near term are classified as trading securities and are recorded at their fair values. Unrealized gains and losses on trading securities are included in other income.
Securities Held to Maturity
Securities that the Company has the positive intent and ability to hold to maturity are reported at cost and adjusted for premiums and discounts that are recognized in interest income using the interest method over the period to maturity. Unrealized losses on securities held to maturity reflecting a decline in value judged to be other than temporary are charged to income and a new cost basis is established.
Securities Available for Sale
Securities available for sale consist of securities not classified as trading securities or as securities held to maturity. They include securities that management intends to use as part of its asset/liability strategy or that may be sold in response to changes in interest rates, changes in prepayment risk, or similar factors. Unrealized gains and losses, net of income taxes, are reported as a separate component of stockholders’ equity until realized. Gains and losses on the sale of securities available for sale are determined using the specific identification method and recognized on the trade date. Premiums and discounts are recognized in interest income using the interest method over the period to maturity. Unrealized losses on securities available for sale reflecting a decline in value judged to be other than temporary are charged to income and a new cost basis is established.
Management monitors the investment security portfolio for impairment on an individual security basis and has a process in place to identify securities that could potentially have a credit impairment that is other than temporary. This process involves analyzing the length of time and extent to which the fair value has been less than the amortized cost basis, the market liquidity for the security, the financial condition and near-term prospects of the issuer, expected cash flows, and the Company's intent and ability to hold the investment for a period of time sufficient to recover the temporary loss, including determining whether it is more-likely-than-not that the Company will be required to sell the security prior to recovery. To the extent it is determined that a security is deemed to be other-than-temporarily impaired, an impairment loss is recognized.
NOTES TO CONSOLIDATED FINANCIAL STATEMENTS
Loans Held for Sale
Mortgage loans originated or purchased which are intended for sale in the secondary market are carried at the lower of cost or estimated market value in the aggregate. Net fees and costs associated with acquiring or originating loans held for sale are deferred and included in the basis of the loan in determining the gain or loss on the sale of the loans. Gains on the sale of loans are recognized on the settlement date. Net unrealized losses are recognized through a valuation allowance by charges to income.
Loans Receivable, net
Loans receivable, net, are carried at amortized cost. Loan origination fees received, net of certain loan origination costs, are deferred as an adjustment to the carrying value of the related loans, and are amortized into income using the interest method over the estimated life of the loans.
Premiums and discounts on purchased participation loans are amortized into interest income using the interest method over the period to contractual maturity, adjusted for estimated prepayments.
The allowance for loan losses is based on a periodic analysis of the loan portfolio and is maintained at an amount considered to be appropriate by management to provide for probable losses inherent in the loan portfolio as of the balance sheet dates. In this analysis, management considers factors including, but not limited to, specific occurrences of loan impairment, actual and anticipated changes in the size of the portfolios, national and regional economic conditions (such as unemployment data, loan delinquencies, local economic conditions, demand for single-family homes, demand for commercial real estate and building lots, loan portfolio composition and historical loss experience) and observations made by the Company's ongoing internal audit and regulatory exam processes. In connection with the determination of the allowance for loan losses, management obtains independent appraisals for significant properties or other collateral securing classified loans. Appraisals on collateral dependent commercial real estate and commercial business loans are obtained when it is determined that the borrower’s risk profile has deteriorated and the loan is classified as impaired. Subsequent new third party appraisals of properties securing impaired commercial real estate and commercial business loans are prepared at least every two years. For all land development loan types, a new third party appraisal is prepared on an annual basis where current activity is not consistent with the assumptions made in the most recent third party appraisal. Non-performing residential and consumer home equity loans and home equity lines may have a third party appraisal or an internal evaluation completed depending on the size of the loan and location of the property. These appraisals, or internal valuations, are generally completed when a residential or consumer home equity loan or home equity line of credit becomes 120 days past due and are typically updated after possession of the property is obtained. Valuations are reviewed on a quarterly basis and adjustments are made to the allowance for loan losses for temporary impairments and charge-offs are taken when the impairment is determined to be permanent. The fair market value of the properties for all loan types are adjusted for estimated selling costs in order to determine the net realizable value of the properties. The allowance for loan losses is established for known problem loans, as well as for loans which are not currently known to require an allowance. Loans are charged off to the extent they are deemed to be uncollectible. The appropriateness of the allowance for loan losses is dependent upon management’s estimates of variables affecting valuation, appraisals of collateral, evaluations of performance and status, and the amounts and timing of future cash flows expected to be received on impaired loans. Such estimates, appraisals, evaluations and cash flows may be subject to adjustments due to changing economic prospects of borrowers or properties. The fair market value of collateral dependent loans are typically based on the appraised value of the property less estimated selling costs. The estimates are reviewed periodically and adjustments, if any, are recorded in the provision for loan losses in the periods in which the adjustments become known. The allowance is allocated to individual loan categories based upon the relative risk characteristics of the loan portfolios and the actual loss experience. The Company increases its allowance for loan losses by charging the provision for loan losses against income and decreases its allowance by crediting the provision for loan losses. The methodology for establishing the allowance for loan losses takes into consideration probable losses that have been identified in connection with specific loans as well as losses in the loan portfolio that have not been specifically identified.
Interest income is recognized on an accrual basis except when collectability is in doubt. When loans are placed on a non-accrual basis, generally when the loan is 90 days past due, previously accrued but unpaid interest is reversed from income. If the ultimate collectability of a loan is in doubt and the loan is placed in nonaccrual status, the cost recovery method is used and cash collected is applied to first reduce the principal outstanding. Generally, the Company returns a loan to accrual status when all delinquent interest and principal becomes current under the terms of the loan agreement and collectability of remaining principal and interest is no longer doubtful. Previously collected interest payments that were applied to principal when the loan was classified as non-accrual are brought back into interest income using the effective yield method over the estimated life of the loan, including expected renewal terms.
NOTES TO CONSOLIDATED FINANCIAL STATEMENTS
All impaired loans are valued at the present value of expected future cash flows discounted at the loan's initial effective interest rate. The fair value of the collateral of an impaired collateral-dependent loan or an observable market price, if one exists, may be used as an alternative to discounting. If the value of the impaired loan is less than the recorded investment in the loan, the impaired amount is charged off. A loan is considered impaired when, based on current information and events, it is probable that the Company will be unable to collect all amounts due according to the contractual terms of the loan agreement. Impaired loans include all loans which are on non-accrual, delinquent as to principal and interest for 90 days or greater, or restructured in a troubled debt restructuring (TDR) involving a modification of terms. All non-accruing loans are reviewed for impairment on an individual basis.
Included in loans receivable, net, are certain loans that have been modified in order to maximize collection of the loan balances. The Company evaluates all loan modifications and if the Company, for legal or economic reasons related to the borrower's financial difficulties, grants a concession compared to the original terms and conditions of the loan that the Company would not otherwise consider, the modified loan is considered a TDR and is classified as an impaired loan. If the TDR loan was performing (accruing) prior to the modification, it typically will remain accruing after the modification as long as it continues to perform according to the modified terms. If the TDR loan was non-performing (non-accruing) prior to the modification, it will remain non-accruing after the modification for a minimum of six months. If the loan performs according to the modified terms for a minimum of six months, it typically will be returned to accruing status. In general, there are two conditions in which a TDR loan is no longer considered to be a TDR and potentially not classified as impaired. The first condition is whether the loan is refinanced with terms that reflect normal market terms for the type of credit involved. The second condition is whether the loan is repaid or charged off.
Purchased Loans Acquired Through Business Combinations
Purchased loans acquired in a business combination, including loans that have evidence of deterioration of credit quality since origination and for which it is probable, at acquisition, that the Company will be unable to collect all contractually required payments, are initially recorded at fair value as determined by the present value of expected future cash flows with no valuation allowance. The difference between the undiscounted cash flows expected at acquisition and the investment in the loan is an accretable yield adjustment and is recognized as interest income using the effective yield method over the life of the loan. Contractually required payments for principal and interest that exceed the undiscounted cash flows expected at acquisition is a nonaccretable difference and is not recognized as a yield adjustment or as a loss accrual or a valuation allowance. Increases in expected cash flows subsequent to the initial investment are recognized prospectively through adjustment of the yield on the loan over its remaining life. Decreases in expected cash flows after the loan is acquired are recognized as an impairment and charged to the provision for loan losses.
Transfers of Financial Assets and Participating Interests
Transfers of an entire financial asset or a participating interest in an entire financial asset are accounted for as sales when control over the assets has been surrendered. Control over transferred assets is deemed to be surrendered when (1) the assets have been isolated from the Company, (2) the transferee obtains the right (free of conditions that constrain it from taking advantage of that right) to pledge or exchange the transferred assets, and (3) the Company does not maintain effective control over the transferred assets through an agreement to repurchase them before their maturity.
The transfer of a participating interest in an entire financial asset must also meet the definition of a participating interest. A participating interest in a financial asset has all of the following characteristics: (1) from the date of transfer, it must represent a proportionate (pro rata) ownership interest in the financial asset, (2) from the date of transfer, all cash flows received, except any cash flows allocated as any compensation for servicing or other services performed, must be divided proportionately among participating interest holders in the amount equal to their share ownership, (3) the rights of each participating interest holder must have the same priority, (4) no party has the right to pledge or exchange the entire financial asset unless all participating interest holders agree to do so.
Mortgage Servicing Rights
Mortgage servicing rights are capitalized at fair value and amortized in proportion to, and over the period of, estimated net servicing income. The Company evaluates its capitalized mortgage servicing rights for impairment each quarter. Loan type and note rate are the predominant risk characteristics of the underlying loans used to stratify capitalized mortgage servicing rights for purposes of measuring impairment. Any impairment is recognized through a valuation allowance.
Real Estate, net
Real estate acquired through loan foreclosure or deed in lieu of foreclosure, is initially recorded at the fair value less estimated selling costs. Third party appraisals are obtained as soon as practical after obtaining possession of property. Valuations are reviewed quarterly by management and an allowance for losses is established if the carrying value of a property exceeds its fair value less estimated selling costs.
NOTES TO CONSOLIDATED FINANCIAL STATEMENTS
Premises and Equipment
Land is carried at cost. Office buildings, improvements, furniture and equipment are carried at cost less accumulated depreciation. Depreciation is computed on a straight-line basis over estimated useful lives of 5 to 40 years for office buildings and improvements and 3 to 10 years for furniture and equipment.
Core Deposit Intangible
The Company records the estimated fair value of the deposit base acquired in an acquisition as a core deposit intangible asset. The recorded amount is amortized on a straight line basis over the estimated life of the deposits acquired.
Impairment of Long-Lived Assets and for Long-Lived Assets to Be Disposed Of
The Company reviews long-lived assets and certain identifiable intangibles for impairment whenever events or changes in circumstances indicate that the carrying amount of an asset may not be recoverable.
Stock Based Compensation
The Company recognizes the grant-date fair value of stock option and restricted stock awards issued as compensation expense, amortized over the vesting period.
Employee Stock Ownership Plan (ESOP)
The Company has an ESOP that borrowed funds from the Company and purchased shares of HMN common stock. The Company makes quarterly principal and interest payments on the ESOP loan. As the debt is repaid, ESOP shares that were pledged as collateral for the debt are released from collateral based on the proportion of debt service paid in the year and then allocated to eligible employees. The Company accounts for its ESOP in accordance with ASC 718,Employers' Accounting for Employee Stock Ownership Plans. Accordingly, the shares pledged as collateral are reported as unearned ESOP shares in stockholders' equity. As shares are determined to be ratably released from collateral, the Company reports compensation expense equal to the current market price of the shares, and the shares become outstanding for earnings per share computations.
Income Taxes
Deferred tax assets and liabilities are recognized for future tax consequences attributable to temporary differences between the financial statement carrying amounts of existing assets and liabilities and their respective tax basis. Deferred tax assets and liabilities are measured using enacted tax rates expected to apply to taxable income in the years in which those temporary differences are expected to be recovered or settled. The effect on deferred tax assets and liabilities of a change in tax rates is recognized in income in the period that includes the enactment date. A valuation allowance is required to be recognized if it is “more likely than not” that the deferred tax asset will not be realized. The determination of the realizability of the deferred tax asset is subjective and dependent upon judgment concerning management’s evaluation of both positive and negative evidence regarding the ultimate realizability of deferred tax assets.
Preferred Stock Dividends and Discount
The proceeds received from the Company’s Fixed Rate Cumulative Perpetual Preferred Stock, Series A (Preferred Stock) and related warrant to purchase 833,333 shares of the Company’s common stock issued to the United States Department of Treasury (Treasury) were allocated between the Preferred Stock and the warrant based on their relative fair values at the time of issuance in accordance with the requirements of ASC 470,Accounting for Convertible Debt Issued with Stock Purchase Warrants. Because of the increasing rate dividend feature of the shares of Preferred Stock, the discount on the warrant was amortized using the effective yield method over the five year period preceding the scheduled rate increase on the Preferred Stock in accordance with the requirements of ASC 505.
Earnings per Common Share
Basic earnings per common share excludes dilution and is computed by dividing the income available to common stockholders by the weighted-average number of common shares outstanding for the period. Diluted earnings per common share reflects the potential dilution that could occur if securities or other contracts to issue common stock were exercised or converted into common stock or resulted in the issuance of common stock that shared in the earnings of the entity.
Comprehensive Income
Comprehensive income is defined as the change in equity during a period from transactions and other events from non-owner sources. Comprehensive income is the total of net income and other comprehensive income (loss), which for the Company is comprised of unrealized gains and losses on securities available for sale.
Segment Information
The amount of each segment item reported is the measure reported to the chief operating decision maker for purposes of making decisions about allocating resources to the segment and assessing its performance. Adjustments and eliminations made in preparing an enterprise’s general-purpose financial statements and allocations of revenues, expenses and gains or losses are included in determining reported segment profit or loss if they are included in the measure of the segment’s profit or loss that is used by the chief operating decision maker. Similarly, only those assets that are included in the measure of the segment’s assets that are used by the chief operating decision maker are reported for that segment.
NOTES TO CONSOLIDATED FINANCIAL STATEMENTS
New Accounting Pronouncements
In January 2016, the FASB issued ASU 2016-01, Financial Instruments – Overall (Subtopic 825-10) Recognition and Measurement of Financial Assets and Financial Liabilities.The amendments in this ASU address certain aspects of recognition, measurement, presentation, and disclosure of financial instruments. It requires, among other things, equity investments to be measured at fair value with changes in fair value recognized in net income; public business entities to use the exit price notion when measuring the fair value of financial instruments for disclosure purposes; the separate presentation in other comprehensive income of the portion of the total change in the fair value of a liability resulting from a change in the instrument-specific credit risk when the entity has elected to measure the liability at fair value in accordance with the fair value option for financial instruments; separate presentation of financial assets and financial liabilities by measurement category and form of financial assets on the balance sheet or the accompanying notes to the financial statements. It also eliminates the requirement for public business entities to disclose the method(s) and significant assumptions used to estimate the fair value that is required to be disclosed for financial instruments measured at amortized cost on the balance sheet; simplifies the impairment assessment of equity investments without readily determinable fair values by requiring a qualitative assessment to identify impairment; and clarifies that an entity should evaluate the need for a valuation allowance on a deferred tax asset related to available-for-sale securities in combination with the entity’s other deferred tax assets. The ASU is intended to reduce diversity in practice and is effective for public business entities for fiscal years beginning after December 15, 2017, including interim periods within those fiscal years. The amendments should be applied by means of a cumulative-effect adjustment to the balance sheet as of the beginning of the fiscal year of adoption. The amendments related to equity securities without readily determinable fair values should be applied prospectively to equity investments that exist as of the date of adoption. The adoption of this ASU in the first quarter of 2018 is not anticipated to have a material impact on the Company’s consolidated financial statements.
Derivative Financial Instruments
The Company uses derivative financial instruments in order to manage the interest rate risk on residential loans held for sale and its commitments to extend credit for residential loans. The Company may also from time to time use interest rate swaps to manage interest rate risk. Derivative financial instruments include commitments to extend credit and forward mortgage loan sales commitments.
NOTE 2 Acquisitions
The Company records purchased assets and liabilities at their fair market value at the time of purchase in accordance with the requirements of ASU 805 -Business Combinations. On August 14, 2015, the Bank completed the acquisition of certain assets and assumption of certain liabilities of Kasson State Bank. The transaction increased the Bank’s total assets $52.8 million including increases in loans of $24.1 million, investments of $17.5 million, cash of $10.0 million, core deposit intangible of $0.4 million and other assets of $0.8 million. The Bank also assumed liabilities of $49.3 million, including $47.3 million of deposits and $2.0 million in other liabilities. Consideration paid was $3.2 million and a gain on the transaction of $0.3 million was recorded during the quarter. The Bank continues to operate both of the Kasson State Bank locations in Kasson, Minnesota acquired in the transaction as branches of Home Federal Savings Bank.
On November 18, 2015, the Bank entered into an agreement to acquire certain assets and assume certain liabilities of Deerwood Bank’s Albert Lea, Minnesota branch. The transaction is anticipated to close in the second quarter of 2016. Once completed, Home Federal Savings Bank plans to service the acquired assets and assumed liabilities out of our existing branch location in Albert Lea, Minnesota.
Determining the estimated fair value of the acquired assets and assumed liabilities required the Bank to estimate cash flows expected to result from those assets and liabilities and to discount those cash flows at appropriate rates of interest. The most significant of those determinations related to the fair valuation of the loans acquired, which management considers to be a critical accounting estimate that involves significant estimates and assumptions. The fair value of the loans purchased was based on the present value of the expected cash flows. Periodic principal and interest cash flows were adjusted for expected losses and prepayments, then discounted to determine the present value and summed to arrive at the estimated fair value. For such loans, the excess of cash flows expected at acquisition over the estimated fair value is recognized as interest income over the remaining lives of the loans. The difference between contractually required payments at acquisition and the cash flows expected to be collected at acquisition reflects the impact of estimated credit losses and other factors, such as prepayments. In accordance with GAAP, there was no carry-over of Kasson State Bank’s previously established allowance for loan losses. As a result, standard industry coverage ratios with regard to the allowance for credit losses are less meaningful after the acquisition. The purchased loans were divided into loans with evidence of credit quality deterioration, which are accounted for under ASC topic 310-30 (purchased credit impaired (PCI)) and loans that do not meet this criteria, which are accounted for under ASC topic 310-20 (performing). PCI loans have experienced a deterioration of credit quality from origination to acquisition for which it is probable that the Bank will not be able to collect all contractually required principal and interest payments on the loan. Subsequent decreases in the expected cash flows require the Bank to evaluate the need for additions to the allowance for credit losses. Subsequent improvements in expected cash flows generally result in a reduction of previously established allowance for credit losses or the recognition of additional interest income over the remaining lives of the loans.
NOTES TO CONSOLIDATED FINANCIAL STATEMENTS
NOTE 3 Other Comprehensive Income (Loss)
The components of other comprehensive income (loss) and the related tax effects were as follows:
| | | For the years ended December 31, | |
| | | 2015 | | | 2014 | | | 2013 | |
(Dollars in thousands) | | Before Tax | | | Tax Effect | | | Net of Tax | | | Before Tax | | | Tax Effect | | | Net of Tax | | | Before Tax | | | Tax Effect | | | Net of Tax | |
| Securities available for sale: | | | | | | | | | | | | | | | | | | | | | | | | | | | | | | | | | | | | |
Gross unrealized gains (losses) arising during the period | | $ | 344 | | | | 137 | | | | 207 | | | | 38 | | | | (218 | ) | | | 256 | | | | (1,272 | ) | | | (647 | ) | | | (625 | ) |
Less reclassification of net gains included in net income | | | 6 | | | | 3 | | | | 3 | | | | 0 | | | | 0 | | | | 0 | | | | 0 | | | | 0 | | | | 0 | |
Net unrealized gains (losses) arising during the period | | | 338 | | | | 134 | | | | 204 | | | | 38 | | | | (218 | ) | | | 256 | | | | (1,272 | ) | | | (647 | ) | | | (625 | ) |
Other comprehensive income (loss) | | $ | 338 | | | | 134 | | | | 204 | | | | 38 | | | | (218 | ) | | | 256 | | | | (1,272 | ) | | | (647 | ) | | | (625 | ) |
The tax effect in 2014 includes the impact of the reversal of certain deferred tax asset valuation reserve components that reversed in 2014 as a result of the changes that occurred in the investment portfolio during the year.
NOTES TO CONSOLIDATED FINANCIAL STATEMENTS
NOTE 4 Securities Available for Sale
A summary of securities available for sale at December 31, 2015 and 2014 is as follows:
(Dollars in thousands) | | Amortized cost | | | Gross unrealized gains | | | Gross unrealized losses | | | Fair value | |
December 31, 2015 | | | | | | | | | | | | | | | | |
Mortgage-backed securities: | | | | | | | | | | | | | | | | |
Federal Home Loan Mortgage Corporation (FHLMC) | | $ | 728 | | | | 31 | | | | 0 | | | | 759 | |
Federal National Mortgage Association (FNMA) | | | 725 | | | | 22 | | | | 0 | | | | 747 | |
Collateralized mortgage obligations: | | | | | | | | | | | | | | | | |
FHLMC | | | 742 | | | | 2 | | | | (1 | ) | | | 743 | |
Other | | | 42 | | | | 0 | | | | (8 | ) | | | 34 | |
| | | | 2,237 | | | | 55 | | | | (9 | ) | | | 2,283 | |
Other marketable securities: | | | | | | | | | | | | | | | | |
U.S. Government agency obligations | | | 105,003 | | | | 68 | | | | (129 | ) | | | 104,942 | |
Municipal obligations | | | 3,991 | | | | 18 | | | | (7 | ) | | | 4,002 | |
Corporate obligations | | | 340 | | | | 0 | | | | (6 | ) | | | 334 | |
Corporate preferred stock | | | 700 | | | | 0 | | | | (350 | ) | | | 350 | |
Corporate equity | | | 58 | | | | 5 | | | | 0 | | | | 63 | |
| | | | 110,092 | | | | 91 | | | | (492 | ) | | | 109,691 | |
| | | $ | 112,329 | | | | 146 | | | | (501 | ) | | | 111,974 | |
December 31, 2014 | | | | | | | | | | | | | | | | |
Mortgage-backed securities: | | | | | | | | | | | | | | | | |
FHLMC | | $ | 1,418 | | | | 90 | | | | 0 | | | | 1,508 | |
FNMA | | | 1,337 | | | | 64 | | | | 0 | | | | 1,401 | |
| | | | 2,755 | | | | 154 | | | | 0 | | | | 2,909 | |
Other marketable securities: | | | | | | | | | | | | | | | | |
U.S. Government agency obligations | | | 135,014 | | | | 31 | | | | (601 | ) | | | 134,444 | |
Corporate preferred stock | | | 700 | | | | 0 | | | | (280 | ) | | | 420 | |
Corporate equity | | | 58 | | | | 3 | | | | 0 | | | | 61 | |
| | | | 135,772 | | | | 34 | | | | (881 | ) | | | 134,925 | |
| | | $ | 138,527 | | | | 188 | | | | (881 | ) | | | 137,834 | |
In 2015, the Company sold $11.0 million of available for sale securities and recognized a gain of $6,000 on the sales. The Company did not sell any available for sale securities and did not recognize any gains or losses on investments in 2014 or 2013.
The following table presents the amortized cost and estimated fair value of securities available for sale at December 31, 2015, based upon contractual maturity adjusted for scheduled repayments of principal and projected prepayments of principal based upon current economic conditions and interest rates. Actual maturities may differ from the maturities in the following table because obligors may have the right to call or prepay obligations with or without call or prepayment penalties:
(Dollars in thousands) | | Amortized Cost | | | Fair Value | |
Due one year or less | | $ | 6,989 | | | | 7,012 | |
Due after one year through five years | | | 103,190 | | | | 103,162 | |
Due after five years through ten years | | | 1,333 | | | | 1,329 | |
Due after ten years | | | 759 | | | | 408 | |
No stated maturity | | | 58 | | | | 63 | |
Total | | $ | 112,329 | | | | 111,974 | |
| | | | | | | | | |
The allocation of mortgage-backed securities in the table above is based upon the anticipated future cash flow of the securities using estimated mortgage prepayment speeds.
NOTES TO CONSOLIDATED FINANCIAL STATEMENTS
The following table shows the gross unrealized losses and fair values for the securities available for sale portfolio aggregated by investment category and length of time that individual securities have been in a continuous unrealized loss position at December 31, 2015 and 2014:
| | | Less Than Twelve Months | | | Twelve Months or More | | | Total | |
(Dollars in thousands) | | # of Investments | | | Fair Value | | | Unrealized Losses | | | # of Investments | | | Fair Value | | | Unrealized Losses | | | Fair Value | | | Unrealized Losses | |
December 31, 2015 | | | | | | | | | | | | | | | | | | | | | | | | | | | | | | | | |
Collateralized mortgage obligations: | | | | | | | | | | | | | | | | | | | | | | | | | | | | | | | | |
FNMA | | | 1 | | | $ | 346 | | | | (1 | ) | | | 0 | | | $ | 0 | | | | 0 | | | $ | 346 | | | | (1 | ) |
Other | | | 2 | | | | 34 | | | | (8 | ) | | | 0 | | | | 0 | | | | 0 | | | | 34 | | | | (8 | ) |
Other marketable securities: | | | | | | | | | | | | | | | | | | | | | | | | | | | | | | | | |
U.S. Government agency obligations | | | 9 | | | | 44,878 | | | | (129 | ) | | | 0 | | | | 0 | | | | 0 | | | | 44,878 | | | | (129 | ) |
Municipal obligations | | | 12 | | | | 2,010 | | | | (7 | ) | | | 0 | | | | 0 | | | | 0 | | | | 2,010 | | | | (7 | ) |
Corporate obligations | | | 1 | | | | 334 | | | | (6 | ) | | | 0 | | | | 0 | | | | 0 | | | | 334 | | | | (6 | ) |
Corporate preferred stock | | | 0 | | | | 0 | | | | 0 | | | | 1 | | | | 350 | | | | (350 | ) | | | 350 | | | | (350 | ) |
Total temporarily impaired securities | | | 25 | | | $ | 47,602 | | | | (151 | ) | | | 1 | | | $ | 350 | | | | (350 | ) | | $ | 47,952 | | | | (501 | ) |
| | | | | | | | | | | | | | | | | | | | | | | | | | | | | | | | | |
December 31, 2014 | | | | | | | | | | | | | | | | | | | | | | | | | | | | | | | | |
Other marketable securities: | | | | | | | | | | | | | | | | | | | | | | | | | | | | | | | | |
U.S. Government agency obligations | | | 22 | | | $ | 104,453 | | | | (551 | ) | | | 1 | | | $ | 4,970 | | | | (50 | ) | | $ | 109,423 | | | | (601 | ) |
Corporate preferred stock | | | 0 | | | | 0 | | | | 0 | | | | 1 | | | | 420 | | | | (280 | ) | | | 420 | | | | (280 | ) |
Total temporarily impaired securities | | | 22 | | | $ | 104,453 | | | | (551 | ) | | | 2 | | | $ | 5,390 | | | | (330 | ) | | $ | 109,843 | | | | (881 | ) |
| | | | | | | | | | | | | | | | | | | | | | | | | | | | | | | | | |
We review our investment portfolio on a quarterly basis for indications of impairment. This review includes analyzing the length of time and the extent to which the fair value has been lower than the cost, the market liquidity for the investment, the financial condition and near-term prospects of the issuer, including any specific events which may influence the operations of the issuer, and our intent and ability to hold the investment for a period of time sufficient to recover the temporary loss. The unrealized losses on U.S. Government agency obligations are the result of changes in interest rates. The unrealized losses reported for the corporate preferred stock at December 31, 2015 relates to a single trust preferred security that was issued by the holding company of a small community bank. Typical of most trust preferred issuances, the issuer has the ability to defer interest payments for up to five years with interest payable on the deferred balance. In September 2014, the issuer paid all deferred interest that was due and all payments were current as of September 30, 2014. Since January 2015, the issuer has deferred its scheduled interest payments as allowed by the terms of the security agreement. The issuer’s subsidiary bank has incurred operating losses over the past several years due to increased provisions for loan losses but still met the regulatory requirements to be considered “well capitalized” based on its most recent regulatory filing. Based on a review of the issuer, it was determined that the trust preferred security was not other-than-temporarily impaired at December 31, 2015. The Company does not intend to sell the preferred stock and has the intent and ability to hold it for a period of time sufficient to recover the temporary loss. Management believes that the Company will receive all principal and interest payments contractually due on the security and that the decrease in the market value is primarily due to a lack of liquidity in the market for trust preferred securities. Management will continue to monitor the credit risk of the issuer and may be required to recognize other-than-temporary impairment charges on this security in future periods.
NOTES TO CONSOLIDATED FINANCIAL STATEMENTS
NOTE 5 Loans Receivable, Net
A summary of loans receivable at December 31, 2015 and 2014, is as follows:
(Dollars in thousands) | | 2015 | | | 2014 | |
Residential real estate loans: | | | | | | | | |
1-4 family conventional | | $ | 90,587 | | | | 69,372 | |
1-4 family FHA | | | 206 | | | | 426 | |
1-4 family VA | | | 152 | | | | 43 | |
| | | | 90,945 | | | | 69,841 | |
Commercial real estate: | | | | | | | | |
Lodging | | | 27,428 | | | | 28,466 | |
Retail/office | | | 45,097 | | | | 40,279 | |
Nursing home/health care | | | 9,183 | | | | 7,032 | |
Land developments | | | 21,272 | | | | 17,766 | |
Golf courses | | | 4,163 | | | | 5,505 | |
Restaurant/bar/café | | | 5,854 | | | | 3,370 | |
Alternative fuel plants | | | 2,205 | | | | 5,377 | |
Warehouse | | | 18,337 | | | | 10,137 | |
Construction: | | | | | | | | |
1-4 family builder | | | 15,152 | | | | 6,454 | |
Multi-family | | | 18,865 | | | | 1,062 | |
Commercial real estate | | | 4,086 | | | | 5,087 | |
Manufacturing | | | 11,585 | | | | 8,022 | |
Churches/community service | | | 8,195 | | | | 8,385 | |
Multi-family | | | 12,324 | | | | 15,700 | |
Other | | | 43,607 | | | | 29,026 | |
| | | | 247,353 | | | | 191,668 | |
Consumer: | | | | | | | | |
Autos | | | 2,885 | | | | 1,124 | |
Home equity line | | | 38,980 | | | | 36,832 | |
Home equity | | | 14,782 | | | | 12,420 | |
Other – secured | | | 2,031 | | | | 1,559 | |
Recreational vehicles | | | 2,650 | | | | 0 | |
Land/lots | | | 1,144 | | | | 1,670 | |
Other – unsecured | | | 1,943 | | | | 1,320 | |
| | | | 64,415 | | | | 54,925 | |
| | | | | | | | | |
Commercial business | | | 70,106 | | | | 57,122 | |
Total loans | | | 472,819 | | | | 373,556 | |
Less: | | | | | | | | |
Unamortized discounts | | | 16 | | | | 14 | |
Net deferred loan (costs) fees | | | (91 | ) | | | 97 | |
Allowance for loan losses | | | 9,709 | | | | 8,332 | |
Total loans receivable, net | | $ | 463,185 | | | | 365,113 | |
Commitments to originate or purchase loans | | $ | 27,184 | | | | 29,635 | |
Commitments to deliver loans to secondary market | | $ | 8,071 | | | | 3,279 | |
Weighted average contractual rate of loans in portfolio | | | 4.54 | % | | | 4.52 | % |
| | | | | | | | | |
Included in total commitments to originate or purchase loans are fixed rate loans aggregating $22.3 million and $21.2 million as of December 31, 2015 and 2014, respectively. The interest rates on these loan commitments ranged from 3.00% to 5.49% at December 31, 2015 and from 3.00% to 6.00% at December 31, 2014.
The aggregate amount of loans to executive officers and directors of the Company was $2.7 million, $2.8 million and $3.1 million at December 31, 2015, 2014 and 2013, respectively. During 2015, repayments on loans to executive officers and directors were $0.1 million, new loans to executive officers and directors totaled $0.2 million, and loans closed or paid off were $0.2 million. During 2014, repayments on loans to executive officers and directors were $0.1 million, new loans to executive officers and directors totaled $0.2 million, sales of executive officer and director loans were $0.2 million, and loans reclassified were $0.2 million. All loans were made in the ordinary course of business on normal credit terms, including interest rates and collateral, as those prevailing at the time for comparable transactions with unrelated parties.
At December 31, 2015, 2014, and 2013, the Company was servicing loans for others with aggregate unpaid principal balances of approximately $391.9 million, $379.7 million and $411.8 million, respectively.
The Company originates residential, commercial real estate and other loans primarily in Minnesota, Iowa, and Wisconsin. At December 31, 2015 and 2014, the Company had in its portfolio single-family residential loans located in the following states:
| | | 2015 | | | 2014 | |
(Dollars in thousands) | | Amount | | | Percent of Total | | | Amount | | | Percent of Total | |
Iowa | | $ | 5,387 | | | | 5.9 | % | | $ | 3,145 | | | | 4.5 | % |
Minnesota | | | 75,417 | | | | 82.9 | | | | 62,219 | | | | 89.1 | |
Wisconsin | | | 7,956 | | | | 8.8 | | | | 3,160 | | | | 4.5 | |
Other states | | | 2,185 | | | | 2.4 | | | | 1,317 | | | | 1.9 | |
Total | | $ | 90,945 | | | | 100.0 | % | | $ | 69,841 | | | | 100.0 | % |
| Amounts under one million dollars in both years are included in “Other states”. | | | | | | | | | | | | | | | | |
NOTES TO CONSOLIDATED FINANCIAL STATEMENTS
At December 31, 2015 and 2014, the Company had in its portfolio commercial real estate loans located in the following states:
| | | 2015 | | | 2014 | |
(Dollars in thousands) | | Amount | | | Percent of Total | | | Amount | | | Percent of Total | |
Alabama | | $ | 2,056 | | | | 0.8 | % | | $ | 2,202 | | | | 1.2 | % |
Florida | | | 3,738 | | | | 1.5 | | | | 2,253 | | | | 1.2 | |
Idaho | | | 3,678 | | | | 1.5 | | | | 3,810 | | | | 2.0 | |
Indiana | | | 4,608 | | | | 1.9 | | | | 3,501 | | | | 1.8 | |
Iowa | | | 1,106 | | | | 0.4 | | | | 0 | | | | 0.0 | |
Michigan | | | 0 | | | | 0.0 | | | | 2,558 | | | | 1.3 | |
Minnesota | | | 184,670 | | | | 74.7 | | | | 145,341 | | | | 75.8 | |
North Carolina | | | 4,203 | | | | 1.7 | | | | 5,598 | | | | 2.9 | |
North Dakota | | | 7,979 | | | | 3.2 | | | | 1,572 | | | | 0.8 | |
Wisconsin | | | 31,918 | | | | 12.9 | | | | 22,354 | | | | 11.7 | |
Other states | | | 3,397 | | | | 1.4 | | | | 2,479 | | | | 1.3 | |
Total | | $ | 247,353 | | | | 100.0 | % | | $ | 191,668 | | | | 100.0 | % |
| Amounts under one million dollars in both years are included in “Other states”. | | | | | | | | | | | | | | | | |
NOTE 6 Allowance for Loan Losses and Credit Quality Information
The allowance for loan losses is summarized as follows:
(Dollars in thousands) | | 1-4 Family | | | Commercial Real Estate | | | Consumer | | | Commercial Business | | | Total | |
Balance, December 31, 2012 | | $ | 2,821 | | | | 13,588 | | | | 1,146 | | | | 4,053 | | | | 21,608 | |
| | | | | | | | | | | | | | | | | | | | | |
Provision for losses | | $ | (1,206 | ) | | | (5,190 | ) | | | 347 | | | | (1,832 | ) | | | (7,881 | ) |
Charge-offs | | | (200 | ) | | | (3,711 | ) | | | (484 | ) | | | (651 | ) | | | (5,046 | ) |
Recoveries | | | 213 | | | | 1,771 | | | | 97 | | | | 639 | | | | 2,720 | |
Balance, December 31, 2013 | | $ | 1,628 | | | | 6,458 | | | | 1,106 | | | | 2,209 | | | | 11,401 | |
| | | | | | | | | | | | | | | | | | | | | |
Provision for losses | | $ | (440 | ) | | | (3,518 | ) | | | (4 | ) | | | (3,036 | ) | | | (6,998 | ) |
Charge-offs | | | (92 | ) | | | (936 | ) | | | (131 | ) | | | (55 | ) | | | (1,214 | ) |
Recoveries | | | 0 | | | | 3,020 | | | | 38 | | | | 2,085 | | | | 5,143 | |
Balance, December 31, 2014 | | $ | 1,096 | | | | 5,024 | | | | 1,009 | | | | 1,203 | | | | 8,332 | |
| | | | | | | | | | | | | | | | | | | | | |
Provision for losses | | $ | (105 | ) | | | (427 | ) | | | 254 | | | | 114 | | | | (164 | ) |
Charge-offs | | | (19 | ) | | | 0 | | | | (105 | ) | | | (69 | ) | | | (193 | ) |
Recoveries | | | 18 | | | | 1,481 | | | | 42 | | | | 193 | | | | 1,734 | |
Balance, December 31, 2015 | | $ | 990 | | | | 6,078 | | | | 1,200 | | | | 1,441 | | | | 9,709 | |
| | | | | | | | | | | | | | | | | | | | | |
Allocated to: | | | | | | | | | | | | | | | | | | | | |
Specific reserves | | $ | 270 | | | | 370 | | | | 307 | | | | 127 | | | | 1,074 | |
General reserves | | | 826 | | | | 4,654 | | | | 702 | | | | 1,076 | | | | 7,258 | |
Balance, December 31, 2014 | | $ | 1,096 | | | | 5,024 | | | | 1,009 | | | | 1,203 | | | | 8,332 | |
| | | | | | | | | | | | | | | | | | | | | |
Allocated to: | | | | | | | | | | | | | | | | | | | | |
Specific reserves | | $ | 223 | | | | 296 | | | | 370 | | | | 120 | | | | 1,009 | |
General reserves | | | 767 | | | | 5,782 | | | | 830 | | | | 1,321 | | | | 8,700 | |
Balance, December 31, 2015 | | $ | 990 | | | | 6,078 | | | | 1,200 | | | | 1,441 | | | | 9,709 | |
| | | | | | | | | | | | | | | | | | | | | |
| | | | | | | | | | | | | | | | | | | | | |
Loans receivable at December 31, 2014: | | | | | | | | | | | | | | | | | | | | |
Individually reviewed for impairment | | $ | 1,867 | | | | 9,728 | | | | 806 | | | | 555 | | | | 12,956 | |
Collectively reviewed for impairment | | | 67,974 | | | | 181,940 | | | | 54,119 | | | | 56,567 | | | | 360,600 | |
Ending balance | | $ | 69,841 | | | | 191,668 | | | | 54,925 | | | | 57,122 | | | | 373,556 | |
| | | | | | | | | | | | | | | | | | | | | |
Loans receivable at December 31, 2015: | | | | | | | | | | | | | | | | | | | | |
Individually reviewed for impairment | | $ | 2,203 | | | | 2,204 | | | | 977 | | | | 415 | | | | 5,799 | |
Collectively reviewed for impairment | | | 88,742 | | | | 245,149 | | | | 63,438 | | | | 69,691 | | | | 467,020 | |
Ending balance | | $ | 90,945 | | | | 247,353 | | | | 64,415 | | | | 70,106 | | | | 472,819 | |
| | | | | | | | | | | | | | | | | | | | | |
NOTES TO CONSOLIDATED FINANCIAL STATEMENTS
The following table summarizes the amount of classified and unclassified loans at December 31, 2015 and 2014:
| | | December 31, 2015 | |
| | | Classified | | | Unclassified | | | | | |
(Dollars in thousands) | | Special Mention | | | Substandard | | | Doubtful | | | Loss | | | Total | | | Total | | | Total Loans | |
1-4 family | | $ | 189 | | | | 2,889 | | | | 55 | | | | 0 | | | | 3,133 | | | | 87,812 | | | | 90,945 | |
Commercial real estate: | | | | | | | | | | | | | | | | | | | | | | | | | | | | |
Residential developments | | | 0 | | | | 1,462 | | | | 0 | | | | 0 | | | | 1,462 | | | | 30,121 | | | | 31,583 | |
Other | | | 2,827 | | | | 12,838 | | | | 0 | | | | 0 | | | | 15,665 | | | | 200,105 | | | | 215,770 | |
| | | | | | | | | | | | | | | | | | | | | | | | | | | | | |
Consumer | | | 0 | | | | 639 | | | | 52 | | | | 286 | | | | 977 | | | | 63,438 | | | | 64,415 | |
Commercial business: | | | | | | | | | | | | | | | | | | | | | | | | | | | | |
Construction industry | | | 66 | | | | 45 | | | | 0 | | | | 0 | | | | 111 | | | | 9,115 | | | | 9,226 | |
Other | | | 4,857 | | | | 1,488 | | | | 0 | | | | 0 | | | | 6,345 | | | | 54,535 | | | | 60,880 | |
| | | $ | 7,939 | | | | 19,361 | | | | 107 | | | | 286 | | | | 27,693 | | | | 445,126 | | | | 472,819 | |
| | | | | | | | | | | | | | | | | | | | | | | | | | | | | |
| | | December 31, 2014 | |
| | | Classified | | | Unclassified | | | | | |
(Dollars in thousands) | | Special Mention | | | Substandard | | | Doubtful | | | Loss | | | Total | | | Total | | | Total Loans | |
1-4 family | | $ | 0 | | | | 2,493 | | | | 207 | | | | 0 | | | | 2,700 | | | | 67,141 | | | | 69,841 | |
Commercial real estate: | | | | | | | | | | | | | | | | | | | | | | | | | | | | |
Residential developments | | | 323 | | | | 9,960 | | | | 0 | | | | 0 | | | | 10,283 | | | | 9,677 | | | | 19,960 | |
Other | | | 7,376 | | | | 8,792 | | | | 0 | | | | 0 | | | | 16,168 | | | | 155,540 | | | | 171,708 | |
| | | | | | | | | | | | | | | | | | | | | | | | | | | | | |
Consumer | | | 0 | | | | 489 | | | | 55 | | | | 261 | | | | 805 | | | | 54,120 | | | | 54,925 | |
Commercial business: | | | | | | | | | | | | | | | | | | | | | | | | | | | | |
Construction industry | | | 0 | | | | 439 | | | | 0 | | | | 0 | | | | 439 | | | | 6,682 | | | | 7,121 | |
Other | | | 4,255 | | | | 1,156 | | | | 0 | | | | 0 | | | | 5,411 | | | | 44,590 | | | | 50,001 | |
| | | $ | 11,954 | | | | 23,329 | | | | 262 | | | | 261 | | | | 35,806 | | | | 337,750 | | | | 373,556 | |
| | | | | | | | | | | | | | | | | | | | | | | | | | | | | |
Classified loans represent special mention, performing substandard, and non-performing loans categorized as substandard, doubtful and loss. Loans classified as special mention are loans that have potential weaknesses that, if left uncorrected, may result in deterioration of the repayment prospects for the asset or in the Bank’s credit position at some future date. Loans classified as substandard are loans that are generally inadequately protected by the current net worth and paying capacity of the obligor, or by the collateral pledged, if any. Loans classified as substandard have a well-defined weakness or weaknesses that jeopardize the liquidation of the debt. Substandard loans are characterized by the distinct possibility that the Bank will sustain some loss if the deficiencies are not corrected. Loans classified as doubtful have the weaknesses of those classified as substandard, with additional characteristics that make collection in full on the basis of currently existing facts, conditions and values questionable, and there is a high possibility of loss. A loan classified as loss is considered uncollectible and of such little value that continuance as an asset on the balance sheet is not warranted. Loans classified as substandard or doubtful require the Bank to perform an analysis of the individual loan and charge off any loans, or portion thereof, that are deemed uncollectible.
NOTES TO CONSOLIDATED FINANCIAL STATEMENTS
The aging of past due loans at December 31, 2015 and 2014 is summarized as follows:
(Dollars in thousands) | | 30-59 Days Past Due | | | 60-89 Days Past Due | | | 90 Days or More Past Due | | | Total Past Due | | | Current Loans | | | Total Loans | | | Loans 90 Days or More Past Due and Still Accruing | |
2015 | | | | | | | | | | | | | | | | | | | | | | | | | | | | |
1-4 family | | $ | 490 | | | | 130 | | | | 799 | | | | 1,419 | | | | 89,526 | | | | 90,945 | | | | 0 | |
Commercial real estate: | | | | | | | | | | | | | | | | | | | | | | | | | | | | |
Residential developments | | | 0 | | | | 0 | | | | 0 | | | | 0 | | | | 31,583 | | | | 31,583 | | | | 0 | |
Other | | | 0 | | | | 289 | | | | 0 | | | | 289 | | | | 215,481 | | | | 215,770 | | | | 0 | |
| | | | | | | | | | | | | | | | | | | | | | | | | | | | | |
Consumer | | | 330 | | | | 262 | | | | 119 | | | | 711 | | | | 63,704 | | | | 64,415 | | | | 0 | |
Commercial business: | | | | | | | | | | | | | | | | | | | | | | | | | | | | |
Construction industry | | | 0 | | | | 0 | | | | 0 | | | | 0 | | | | 9,226 | | | | 9,226 | | | | 0 | |
Other | | | 45 | | | | 0 | | | | 0 | | | | 45 | | | | 60,835 | | | | 60,880 | | | | 0 | |
| | | $ | 865 | | | | 681 | | | | 918 | | | | 2,464 | | | | 470,355 | | | | 472,819 | | | | 0 | |
| | | | | | | | | | | | | | | | | | | | | | | | | | | | | |
2014 | | | | | | | | | | | | | | | | | | | | | | | | | | | | |
1-4 family | | $ | 413 | | | | 673 | | | | 841 | | | | 1,927 | | | | 67,914 | | | | 69,841 | | | | 0 | |
Commercial real estate: | | | | | | | | | | | | | | | | | | | | | | | | | | | | |
Residential developments | | | 0 | | | | 0 | | | | 0 | | | | 0 | | | | 19,960 | | | | 19,960 | | | | 0 | |
Other | | | 0 | | | | 0 | | | | 0 | | | | 0 | | | | 171,708 | | | | 171,708 | | | | 0 | |
| | | | | | | | | | | | | | | | | | | | | | | | | | | | | |
Consumer | | | 550 | | | | 176 | | | | 131 | | | | 857 | | | | 54,068 | | | | 54,925 | | | | 0 | |
Commercial business: | | | | | | | | | | | | | | | | | | | | | | | | | | | | |
Construction industry | | | 0 | | | | 0 | | | | 0 | | | | 0 | | | | 7,121 | | | | 7,121 | | | | 0 | |
Other | | | 136 | | | | 0 | | | | 0 | | | | 136 | | | | 49,865 | | | | 50,001 | | | | 0 | |
| | | $ | 1,099 | | | | 849 | | | | 972 | | | | 2,920 | | | | 370,636 | | | | 373,556 | | | | 0 | |
| | | | | | | | | | | | | | | | | | | | | | | | | | | | | |
NOTES TO CONSOLIDATED FINANCIAL STATEMENTS
Impaired loans include loans that are non-performing (non-accruing) and loans that have been modified in a TDR. The following table summarizes impaired loans and related allowances for the years ended December 31, 2015 and 2014:
| | | December 31, 2015 | |
(Dollars in thousands) | | Recorded Investment | | | Unpaid Principal Balance | | | Related Allowance | | | Average Recorded Investment | | | Interest Income Recognized | |
Loans with no related allowance recorded: | | | | | | | | | | | | | | | | | | | | |
1-4 family | | $ | 1,251 | | | | 1,251 | | | | 0 | | | | 943 | | | | 60 | |
Commercial real estate: | | | | | | | | | | | | | | | | | | | | |
Residential developments | | | 25 | | | | 1,706 | | | | 0 | | | | 5,189 | | | | 96 | |
Other | | | 44 | | | | 184 | | | | 0 | | | | 319 | | | | 7 | |
Consumer | | | 475 | | | | 476 | | | | 0 | | | | 387 | | | | 10 | |
Commercial business: | | | | | | | | | | | | | | | | | | | | |
Construction industry | | | 0 | | | | 79 | | | | 0 | | | | 28 | | | | 0 | |
Other | | | 0 | | | | 0 | | | | 0 | | | | 8 | | | | 0 | |
| | | | | | | | | | | | | | | | | | | | | |
Loans with an allowance recorded: | | | | | | | | | | | | | | | | | | | | |
1-4 family | | | 952 | | | | 952 | | | | 223 | | | | 1,045 | | | | 14 | |
Commercial real estate: | | | | | | | | | | | | | | | | | | | | |
Residential developments | | | 1,947 | | | | 1,947 | | | | 270 | | | | 1,621 | | | | 0 | |
Other | | | 188 | | | | 188 | | | | 26 | | | | 302 | | | | 32 | |
Consumer | | | 502 | | | | 519 | | | | 370 | | | | 448 | | | | 20 | |
Commercial business: | | | | | | | | | | | | | | | | | | | | |
Construction industry | | | 0 | | | | 0 | | | | 0 | | | | 0 | | | | 0 | |
Other | | | 415 | | | | 967 | | | | 120 | | | | 429 | | | | 20 | |
| | | | | | | | | | | | | | | | | | | | | |
Total: | | | | | | | | | | | | | | | | | | | | |
1-4 family | | | 2,203 | | | | 2,203 | | | | 223 | | | | 1,988 | | | | 74 | |
Commercial real estate: | | | | | | | | | | | | | | | | | | | | |
Residential developments | | | 1,972 | | | | 3,653 | | | | 270 | | | | 6,810 | | | | 96 | |
Other | | | 232 | | | | 372 | | | | 26 | | | | 621 | | | | 39 | |
Consumer | | | 977 | | | | 995 | | | | 370 | | | | 835 | | | | 30 | |
Commercial business: | | | | | | | | | | | | | | | | | | | | |
Construction industry | | | 0 | | | | 79 | | | | 0 | | | | 28 | | | | 0 | |
Other | | | 415 | | | | 967 | | | | 120 | | | | 437 | | | | 20 | |
| | | $ | 5,799 | | | | 8,269 | | | | 1,009 | | | | 10,719 | | | | 259 | |
| | | | | | | | | | | | | | | | | | | | | |
NOTES TO CONSOLIDATED FINANCIAL STATEMENTS
| | | December 31, 2014 | |
(Dollars in thousands) | | Recorded Investment | | | Unpaid Principal Balance | | | Related Allowance | | | Average Recorded Investment | | | Interest Income Recognized | |
Loans with no related allowance recorded: | | | | | | | | | | | | | | | | | | | | |
1-4 family | | $ | 755 | | | | 755 | | | | 0 | | | | 432 | | | | 32 | |
Commercial real estate: | | | | | | | | | | | | | | | | | | | | |
Residential developments | | | 7,416 | | | | 10,040 | | | | 0 | | | | 7,633 | | | | 219 | |
Other | | | 48 | | | | 216 | | | | 0 | | | | 50 | | | | 6 | |
Consumer | | | 463 | | | | 464 | | | | 0 | | | | 467 | | | | 15 | |
Commercial business: | | | | | | | | | | | | | | | | | | | | |
Construction industry | | | 80 | | | | 198 | | | | 0 | | | | 87 | | | | 0 | |
Other | | | 0 | | | | 0 | | | | 0 | | | | 0 | | | | 0 | |
| | | | | | | | | | | | | | | | | | | | | |
Loans with an allowance recorded: | | | | | | | | | | | | | | | | | | | | |
1-4 family | | | 1,112 | | | | 1,112 | | | | 270 | | | | 1,543 | | | | 14 | |
Commercial real estate: | | | | | | | | | | | | | | | | | | | | |
Residential developments | | | 1,522 | | | | 1,522 | | | | 240 | | | | 3,121 | | | | 0 | |
Other | | | 742 | | | | 743 | | | | 130 | | | | 847 | | | | 32 | |
Consumer | | | 343 | | | | 360 | | | | 307 | | | | 451 | | | | 9 | |
Commercial business: | | | | | | | | | | | | | | | | | | | | |
Construction industry | | | 0 | | | | 0 | | | | 0 | | | | 0 | | | | 0 | |
Other | | | 475 | | | | 1,026 | | | | 127 | | | | 887 | | | | 20 | |
| | | | | | | | | | | | | | | | | | | | | |
Total: | | | | | | | | | | | | | | | | | | | | |
1-4 family | | | 1,867 | | | | 1,867 | | | | 270 | | | | 1,975 | | | | 46 | |
Commercial real estate: | | | | | | | | | | | | | | | | | | | | |
Residential developments | | | 8,938 | | | | 11,562 | | | | 240 | | | | 10,754 | | | | 219 | |
Other | | | 790 | | | | 959 | | | | 130 | | | | 897 | | | | 38 | |
Consumer | | | 806 | | | | 824 | | | | 307 | | | | 918 | | | | 24 | |
Commercial business: | | | | | | | | | | | | | | | | | | | | |
Construction industry | | | 80 | | | | 198 | | | | 0 | | | | 87 | | | | 0 | |
Other | | | 475 | | | | 1,026 | | | | 127 | | | | 887 | | | | 20 | |
| | | $ | 12,956 | | | | 16,436 | | | | 1,074 | | | | 15,518 | | | | 347 | |
At December 31, 2015, 2014 and 2013, non-accruing loans totaled $4.2 million, $10.9 million, and $17.5 million, respectively, for which the related allowance for loan losses was $0.7 million, $0.8 million, and $3.4 million, respectively. Non-accruing loans for which no specific allowance has been recorded because management determined that the value of the collateral was sufficient to repay the loan totaled $1.4 million, $8.0 million, and $7.8 million, respectively. Had the loans performed in accordance with their original terms, the Company wouldhave recorded gross interest income on the loans of $0.5 million, $0.9 million, and $1.8 million in 2015, 2014, and 2013, respectively. For the years ended December 31, 2015, 2014, and 2013, the Company recognized interest income on these loans of $0.3 million, $0.2 million, and $0.1 million, respectively. All of the interest income that was recognized for non-accruing loans was recognized using the cash basis method of income recognition. Non-accrual loans also include some of the loans that have had terms modified in a TDR.
NOTES TO CONSOLIDATED FINANCIAL STATEMENTS
The following table summarizes non-accrual loans at December 31, 2015 and 2014:
(Dollars in thousands) | | 2015 | | | 2014 | |
| | | | | | | | | |
1-4 family | | $ | 1,655 | | | | 1,564 | |
Commercial real estate: | | | | | | | | |
Residential developments | | | 1,462 | | | | 8,483 | |
Other | | | 232 | | | | 267 | |
Consumer | | | 786 | | | | 486 | |
Commercial business: | | | | | | | | |
Construction industry | | | 0 | | | | 80 | |
Other | | | 46 | | | | 40 | |
| | | $ | 4,181 | | | | 10,920 | |
| | | | | | | | | |
Included in loans receivable, net, are certain loans that have been modified in order to maximize collection of loan balances. If the Company, for legal or economic reasons related to the borrower’s financial difficulties, grants a concession compared to the original terms and conditions of the loan, the modified loan is considered a troubled debt restructuring (TDR).
At December 31, 2015, 2014 and 2013, there were loans included in loans receivable, net, with terms that had been modified in a TDR totaling $2.5 million, $9.4 million, and $17.4 million, respectively. Had these loans been performing in accordance with their original terms throughout 2015, 2014, and 2013, the Company would have recorded gross interest income of $0.4 million, $0.9 million, and $1.8 million, respectively. During 2015, 2014 and 2013, the Company recognized interest income of $0.2 million, $0.3 million, and $0.5 million, respectively, on these loans. For the loans that were modified in 2015, $0.5 million were classified and performing, and $0.7 million were non-performing at December 31, 2015.
The following table summarizes TDRs at December 31, 2015 and 2014:
(Dollars in thousands) | | 2015 | | | 2014 | |
1-4 family | | $ | 647 | | | | 368 | |
Commercial real estate: | | | | | | | | |
Residential developments | | | 26 | | | | 7,432 | |
Other | | | 699 | | | | 524 | |
Consumer | | | 732 | | | | 571 | |
Commercial business: | | | | | | | | |
Construction industry | | | 0 | | | | 80 | |
Other | | | 415 | | | | 475 | |
| | | $ | 2,519 | | | | 9,450 | |
| | | | | | | | | |
As of December 31, 2015, the Bank had commitments to lend an additional $1.5 million to a borrower who has TDR and non-accrual loans. These additional funds are for the construction of one-to-four family homes with a maximum loan-to-value ratio of 75%. These loans are secured by the home under construction. There were no material commitments to lend additional funds to customers whose loans were restructured or classified at December 31, 2014.
TDR concessions can include reduction of interest rates, extension of maturity dates, forgiveness of principal and/or interest due, or acceptance of real estate or other assets in full or partial satisfaction of the debt. Loan modifications are not reported as TDRs after 12 months if the loan was modified at a market rate of interest for comparable risk loans, and the loan is performing in accordance with the terms of the restructured agreement. All loans classified as TDRs are considered to be impaired.
When a loan is modified as a TDR, there may be a direct, material impact on the loans within the Consolidated Balance Sheets, as principal balances may be partially forgiven. The financial effects of TDRs are presented in the following table and represent the difference between the outstanding recorded balance pre-modification and post-modification, for the periods ending December 31, 2015 and 2014:
| | | Year ended December 31, 2015 | | | Year ended December 31, 2014 | |
(Dollars in thousands) | | Number of Contracts | | | Pre- modification Outstanding Recorded Investment | | | Post- modification Outstanding Recorded Investment | | | Number of Contracts | | | Pre- modification Outstanding Recorded Investment | | | Post- modification Outstanding Recorded Investment | |
Troubled debt restructurings: | | | | | | | | | | | | | | | | | | | | | | | | |
1-4 family | | | 4 | | | $ | 476 | | | | 478 | | | | 2 | | | $ | 760 | | | | 760 | |
Commercial real estate: | | | | | | | | | | | | | | | | | | | | | | | | |
Other | | | 1 | | | | 209 | | | | 209 | | | | 1 | | | | 155 | | | | 155 | |
Consumer | | | 21 | | | | 527 | | | | 530 | | | | 4 | | | | 155 | | | | 140 | |
Commercial business: | | | | | | | | | | | | | | | | | | | | | | | | |
Other | | | 1 | | | | 44 | | | | 44 | | | | 1 | | | | 31 | | | | 25 | |
Total | | | 27 | | | $ | 1,256 | | | | 1,261 | | | | 8 | | | $ | 1,101 | | | | 1,080 | |
| | | | | | | | | | | | | | | | | | | | | | | | | |
NOTES TO CONSOLIDATED FINANCIAL STATEMENTS
Loans that were restructured within the 12 months preceding December 31, 2015 and 2014 and defaulted during the year are presented in the table below:
| | | Year ended December 31, 2015 | | | Year ended December 31, 2014 | |
(Dollars in thousands) | | Numberof Contracts | | | Outstanding Recorded Investment | | | Number of Contracts | | | Outstanding Recorded Investment | |
Troubled debt restructurings that subsequently defaulted: | | | | | | | | | | | | | | | | |
1-4 family | | | 0 | | | $ | 0 | | | | 1 | | | $ | 640 | |
Total | | | 0 | | | $ | 0 | | | | 1 | | | $ | 640 | |
| | | | | | | | | | | | | | | | | |
The Company considers a loan to have defaulted when it becomes 90 or more days past due under the modified terms, when it is placed in non-accrual status, when it becomes other real estate owned, or when it becomes non-compliant with some other material requirement of the modification agreement.
Loans that were non-accrual prior to modification remain non-accrual for at least six months following modification. Non-accrual TDR loans that have performed according to the modified terms for six months may be returned to accruing status. Loans that were accruing prior to modification remain on accrual status after the modification as long as the loan continues to perform under the new terms.
TDRs are reviewed for impairment following the same methodology as other impaired loans. For loans that are collateral dependent, the value of the collateral is reviewed and additional reserves may be added as needed. Loans that are not collateral dependent may have additional reserves established if deemed necessary. The allocated allowance for TDRs was $0.5 million, or 5.2%, of the total $9.7 million in allowance for loan losses at December 31, 2015, and $0.4 million, or 5.1%, of the total $8.3 million in allowance for loan losses at December 31, 2014.
Loans acquired in a business combination are segregated into two types: purchased performing loans with a discount attributable at least in part to credit quality and PCI loans with evidence of significant credit deterioration. Purchased performing loans are accounted for in accordance with ASC 310-20“Nonrefundable Fees and Other Costs” as these loans do not have evidence of credit deterioration since origination. PCI loans are accounted for in accordance with ASC 310-30“Receivables – Loans and Debt Securities Acquired with Deteriorated Credit Quality” as they display significant credit deterioration since origination. In accordance with ASC 310-30, for PCI loans, the difference between contractually required payments at acquisition and the cash flows expected to be collected is referred to as the non-accretable difference. This amount is not recognized as a yield adjustment or as a loss accrual or a valuation allowance. Furthermore, any excess of cash flows expected at acquisition over the estimated fair value is referred to as the accretable yield and is recognized into interest income over the remaining life of the loans when there is a reasonable expectation about the amount and timing of such cash flows. Increases in expected cash flows subsequent to the initial investment are recognized prospectively through an adjustment of the yield on the loan over its remaining estimated life. Decreases in expected cash flows are recognized immediately as an impairment through the provision for loan losses.
The following is additional information with respect to loans acquired through the Kasson State Bank acquisition:
(Dollars in thousands) | | Contractual Principal Receivable | | | Accretable Difference | | | Carrying Amount | |
Purchased Performing Loans: | | | | | | | | | | | | |
Balance at August 14, 2015 | | $ | 24,215 | | | | (793 | ) | | | 23,422 | |
Change due to payments/refinances | | | (5,676 | ) | | | 334 | | | | (5,342 | ) |
Transferred to foreclosed assets | | | 0 | | | | 0 | | | | 0 | |
Change due to loancharge-off | | | 0 | | | | 0 | | | | 0 | |
Balance at December 31, 2015 | | $ | 18,539 | | | | (459 | ) | | | 18,080 | |
| | | | | | | | | | | | | |
(Dollars in thousands) | | Contractual Principal Receivable | | | Non- Accretable Difference | | | Carrying Amount | |
Purchased Credit Impaired Loans: | | | | | | | | | | | | |
Balance at August 14, 2015 | | $ | 1,134 | | | | (497 | ) | | | 637 | |
Change due to payments/refinances | | | (260 | ) | | | 48 | | | | (212 | ) |
Transferred to foreclosed assets | | | 0 | | | | 0 | | | | 0 | |
Change due to loancharge-off | | | (319 | ) | | | 287 | | | | (32 | ) |
Balance at December 31, 2015 | | $ | 555 | | | | (162 | ) | | | 393 | |
| | | | | | | | | | | | | |
As a result of the Kasson State Bank acquisition, the Company has PCI loans for which there was, at acquisition, evidence of deterioration of credit quality since origination and for which it was probable at acquisition that all contractually required payments would not be collected. The carrying amount of those loans as of December 31, 2015 was $0.4 million.
No provision for loan losses was recognized during the period ended December 31, 2015 related to acquired loans as there was no significant change to the credit quality of those loans.
NOTES TO CONSOLIDATED FINANCIAL STATEMENTS
NOTE 7Accrued Interest Receivable
Accrued interest receivable at December 31 is summarized as follows:
(Dollars in thousands) | | 2015 | | | 2014 | |
Securities available for sale | | $ | 422 | | | | 348 | |
Loans receivable | | | 1,832 | | | | 1,365 | |
| | | $ | 2,254 | | | | 1,713 | |
| | | | | | | | | |
NOTE 8 Intangible Assets
The Company’s intangible assets consist of core deposit intangibles and mortgage servicing rights. A summary of mortgage servicing rights activity for 2015 and 2014 is as follows:
(Dollars in thousands) | | 2015 | | | 2014 | |
Mortgage servicing rights: | | | | | | | | |
Balance, beginning of year | | $ | 1,507 | | | | 1,708 | |
Originations | | | 547 | | | | 316 | |
Amortization | | | (555 | ) | | | (517 | ) |
Balance, end of year | | | 1,499 | | | | 1,507 | |
Valuation reserve | | | 0 | | | | 0 | |
Mortgage servicing rights, net | | $ | 1,499 | | | | 1,507 | |
Fair value of mortgage servicing rights | | $ | 2,590 | | | | 2,562 | |
| | | | | | | | | |
All of the single family loans sold where the Company continues to service the loans are serviced for Federal National Mortgage Association (FNMA) under the individual loan sale program. The following is a summary of the risk characteristics of the loans being serviced for FNMA at December 31, 2015:
(Dollars in thousands) | | Loan Principal Balance | | | Weighted Average Interest Rate | | | Weighted Average Remaining Term (months) | | | Number of Loans | |
Original term: | | | | | | | | | | | | | | | | |
30 year fixed rate | | $ | 218,688 | | | | 4.21 | % | | | 301 | | | | 1,854 | |
15 year fixed rate | | | 107,493 | | | | 3.23 | | | | 139 | | | | 1,192 | |
Adjustable rate | | | 59 | | | | 4.38 | | | | 305 | | | | 2 | |
The gross carrying amount of intangible assets and the associated accumulated amortization at December 31, 2015 and 2014 are presented in the following table. Amortization expense for intangible assets was $0.6 million, $0.5 million, and $0.6 million for the years ended December 31, 2015, 2014 and 2013, respectively.
NOTES TO CONSOLIDATED FINANCIAL STATEMENTS
| | | Gross | | | | | | | Unamortized | |
| | | Carrying | | | Accumulated | | | Intangible | |
(Dollars in thousands) | | Amount | | | Amortization | | | Assets | |
December 31, 2015 | | | | | | | | | | | | |
Mortgage servicing rights | | $ | 3,739 | | | | (2,240 | ) | | | 1,499 | |
Core deposit intangible | | | 421 | | | | (28 | ) | | | 393 | |
Total | | $ | 4,160 | | | | (2,268 | ) | | | 1,892 | |
| | | | | | | | | | | | | |
December 31, 2014 | | | | | | | | | | | | |
Mortgage servicing rights | | $ | 3,600 | | | | (2,093 | ) | | | 1,507 | |
| | | | | | | | | | | | | |
The following table indicates the estimated future amortization expense for intangible assets:
(Dollars in thousands) | | Mortgage Servicing Rights | | | Core Deposit Intangible | | | Total Intangible Assets | |
Year endedDecember 31, | | | | | | | | | | | | |
2016 | | $ | 440 | | | | 74 | | | | 514 | |
2017 | | | 357 | | | | 74 | | | | 431 | |
2018 | | | 268 | | | | 74 | | | | 342 | |
2019 | | | 208 | | | | 74 | | | | 282 | |
2020 | | | 119 | | | | 74 | | | | 193 | |
Thereafter | | | 107 | | | | 23 | | | | 130 | |
| | | $ | 1,499 | | | | 393 | | | | 1,892 | |
| | | | | | | | | | | | | |
Projections of amortization are based on asset balances and the interest rate environment that existed at December 31, 2015. The Company’s actual experience may be significantly different depending upon changes in mortgage interest rates and other market conditions.
NOTES TO CONSOLIDATED FINANCIAL STATEMENTS
NOTE 9 Real Estate
A summary of real estate at December 31, 2015 and 2014 is as follows:
| | | 2015 | | | 2014 | |
(Dollars in thousands) | | Residential | | | Commercial & Other | | | Total | | | Residential | | | Commercial & Other | | | Total | |
Real estate in judgment subject to redemption | | $ | 110 | | | | 0 | | | | 110 | | | | 30 | | | | 0 | | | | 30 | |
Real estate acquired through foreclosure | | | 0 | | | | 2,269 | | | | 2,269 | | | | 0 | | | | 3,648 | | | | 3,648 | |
Real estate acquired through deed in lieu of foreclosure | | | 0 | | | | 465 | | | | 465 | | | | 28 | | | | 1,126 | | | | 1,154 | |
| | | | 110 | | | | 2,734 | | | | 2,844 | | | | 58 | | | | 4,774 | | | | 4,832 | |
Allowance for losses | | | (62 | ) | | | (737 | ) | | | (799 | ) | | | (8 | ) | | | (1,721 | ) | | | (1,729 | ) |
| | | $ | 48 | | | | 1,997 | | | | 2,045 | | | | 50 | | | | 3,053 | | | | 3,103 | |
| | | | | | | | | | | | | | | | | | | | | | | | | |
NOTE 10 Premises and Equipment
A summary of premises and equipment at December 31, 2015 and 2014 is as follows:
(Dollars in thousands) | | 2015 | | | 2014 | |
Land | | $ | 2,021 | | | | 1,978 | |
Office buildings and improvements | | | 8,930 | | | | 8,526 | |
Furniture and equipment | | | 12,714 | | | | 12,049 | |
| | | | 23,665 | | | | 22,553 | |
Accumulated depreciation | | | (16,196 | ) | | | (15,571 | ) |
| | | $ | 7,469 | | | | 6,982 | |
| | | | | | | | | |
NOTES TO CONSOLIDATED FINANCIAL STATEMENTS
NOTE 11 Deposits
Deposits and their weighted average interest rates at December 31, 2015 and 2014 are summarized as follows:
| | | 2015 | | | 2014 | |
(Dollars in thousands) | | Weighted Average Rate | | | Amount | | | Percent of Total | | | Weighted Average Rate | | | Amount | | | Percent of Total | |
Noninterest checking | | | 0.00 | % | | $ | 151,737 | | | | 27.1 | % | | | 0.00 | % | | $ | 118,073 | | | | 23.8 | % |
NOW accounts | | | 0.04 | | | | 82,425 | | | | 14.7 | | | | 0.02 | | | | 75,553 | | | | 15.2 | |
Savings accounts | | | 0.09 | | | | 66,421 | | | | 11.9 | | | | 0.07 | | | | 46,672 | | | | 9.4 | |
Money market accounts | | | 0.22 | | | | 159,959 | | | | 28.6 | | | | 0.25 | | | | 158,798 | | | | 32.0 | |
| | | | | | | | 460,542 | | | | 82.3 | | | | | | | | 399,096 | | | | 80.4 | |
Certificates by rate: | | | | | | | | | | | | | | | | | | | | | | | | |
0-0.99% | | | | | | | 85,391 | | | | 15.3 | | | | | | | | 81,197 | | | | 16.3 | |
1-1.99% | | | | | | | 12,611 | | | | 2.3 | | | | | | | | 13,629 | | | | 2.7 | |
2-2.99% | | | | | | | 733 | | | | 0.1 | | | | | | | | 2,721 | | | | 0.6 | |
3-3.99% | | | | | | | 110 | | | | 0.0 | | | | | | | | 107 | | | | 0.0 | |
Total certificates | | | 0.53 | | | | 98,845 | | | | 17.7 | | | | 0.61 | | | | 97,654 | | | | 19.6 | |
Total deposits | | | 0.17 | | | $ | 559,387 | | | | 100.0 | % | | | 0.21 | | | $ | 496,750 | | | | 100.0 | % |
| | | | | | | | | | | | | | | | | | | | | | | | | |
At December 31, 2015 and 2014, the Company had $183.0 million and $166.9 million, respectively, of deposit accounts with balances of $250,000 or more. At December 31, 2015 and 2014, the Company had no certificate accounts that had been acquired through a broker.
Certificates had the following maturities at December 31, 2015 and 2014:
| | | 2015 | | | 2014 | |
(Dollars in thousands) | | Amount | | | Weighted Average Rate | | | Amount | | | Weighted Average Rate | |
Remaining term to maturity | | | | | | | | | | | | | | | | |
1-6 months | | $ | 36,040 | | | | 0.44 | % | | $ | 32,925 | | | | 0.52 | % |
7-12 months | | | 26,019 | | | | 0.37 | | | | 26,764 | | | | 0.49 | |
13-36 months | | | 28,706 | | | | 0.65 | | | | 29,929 | | | | 0.68 | |
Over 36 months | | | 8,080 | | | | 1.05 | | | | 8,036 | | | | 1.03 | |
| | | $ | 98,845 | | | | 0.53 | | | $ | 97,654 | | | | 0.61 | |
| | | | | | | | | | | | | | | | | |
NOTES TO CONSOLIDATED FINANCIAL STATEMENTS
At December 31, 2015 and 2014, the Company had pledged mortgage loans and mortgage-backed and related securities with an amortized cost of approximately $28.0 million and $19.4 million, respectively, as collateral for certaindeposits. An additional $1.0 million of letters of credit from the FHLB were pledged at December 31, 2015 and 2014 as collateral on certain Bank deposits.
Interest expense on deposits is summarized as follows for the years ended December 31, 2015, 2014 and 2013:
(Dollars in thousands) | | 2015 | | | 2014 | | | 2013 | |
NOW accounts | | $ | 17 | | | | 15 | | | | 15 | |
Savings accounts | | | 42 | | | | 31 | | | | 34 | |
Money market accounts | | | 347 | | | | 414 | | | | 372 | |
Certificates | | | 528 | | | | 751 | | | | 1,383 | |
| | | $ | 934 | | | | 1,211 | | | | 1,804 | |
| | | | | | | | | | | | | |
NOTE 12 Federal Home Loan Bank (FHLB) Advances and Other Borrowings
The Bank had no outstanding advances from the FHLB or borrowings from the Federal Reserve Bank of Minneapolis as of December 31, 2015 or December 31, 2014. At December 31, 2015 it had collateral pledged to the FHLB consisting of FHLB stock, mortgage loans, and investments with unamortized principal balances of approximately $96.3 million. The Bank has the ability to draw additional borrowings of $95.3 million from the FHLB, based upon the mortgage loans and securities that are currently pledged, subject to a requirement to purchase FHLB stock. The Bank also had the ability to draw additional borrowings of $73.5 million from the Federal Reserve Bank of Minneapolis, based upon the loans that were pledged to them as of December 31, 2015, subject to approval from the Board of Governors of the Federal Reserve System (FRB).
On December 15, 2014, the Company entered into a Loan Agreement with an unrelated third party, providing for a term loan of up to $10.0 million that was evidenced by a promissory note (the Note) with an interest rate of 6.5% per annum. The principal balance of the loan is payable in consecutive equal annual installments of $1.0 million on each anniversary of the date of the Loan Agreement, commencing on December 15, 2015, with the balance due on December 15, 2021. Provided that no default or event of default has occurred and is continuing, the Company may, at its option, elect to defer payment of one installment of principal on the Note otherwise due prior to the maturity date, in which event such installment will become due and payable on the maturity date. The Company may voluntarily prepay the Note in whole or in part without penalty. The outstanding loan balance was $9.0 million at December 31, 2015.
NOTE 13 Income Taxes
Income tax expense (benefit) for the years ended December 31, 2015, 2014 and 2013 is as follows:
(Dollars in thousands) | | 2015 | | | 2014 | | | 2013 | |
Current: | | | | | | | | | | | | |
Federal | | $ | (87 | ) | | | 262 | | | | 227 | |
State | | | (24 | ) | | | 74 | | | | 64 | |
Total current | | | (111 | ) | | | 336 | | | | 291 | |
Deferred: | | | | | | | | | | | | |
Federal | | | 1,393 | | | | 3,753 | | | | 3,554 | |
State | | | 329 | | | | 813 | | | | 1,351 | |
Total deferred | | | 1,722 | | | | 4,566 | | | | 4,905 | |
Change in valuation allowance | | | 0 | | | | 0 | | | | (19,602 | ) |
Income tax expense (benefit) | | $ | 1,611 | | | | 4,902 | | | | (14,406 | ) |
| | | | | | | | | | | | | |
The reasons for the difference between expected income tax expense utilizing the federal corporate tax rate of 34% and the actual income tax expense (benefit) are as follows:
(Dollars in thousands) | | 2015 | | | 2014 | | | 2013 | |
Expected federal income tax expense | | $ | 1,553 | | | | 4,176 | | | | 4,170 | |
Items affecting federal income tax: | | | | | | | | | | | | |
State income taxes, net of federal income tax expense | | | 259 | | | | 698 | | | | 706 | |
Tax exempt interest | | | (44 | ) | | | (45 | ) | | | (69 | ) |
Decrease in valuationallowance | | | 0 | | | | 0 | | | | (19,602 | ) |
Other, net | | | (157 | ) | | | 73 | | | | 389 | |
Income tax expense (benefit) | | $ | 1,611 | | | | 4,902 | | | | (14,406 | ) |
| | | | | | | | | | | | | |
NOTES TO CONSOLIDATED FINANCIAL STATEMENTS
The tax effects of temporary differences that give rise to the deferred tax assets and deferred tax liabilities are as follows at December 31:
(Dollars in thousands) | | 2015 | | | 2014 | |
Deferred tax assets: | | | | | | | | |
Allowances for loan and real estatelosses | | $ | 4,169 | | | | 3,984 | |
Deferred compensation costs | | | 235 | | | | 205 | |
Deferred ESOP loan asset | | | 710 | | | | 711 | |
Nonaccruing loan interest | | | 361 | | | | 627 | |
Federal net operating loss carryforward | | | 1,026 | | | | 1,730 | |
State net operating loss carryforward | | | 2,255 | | | | 2,448 | |
Alternative minimum tax credit carryforward | | | 500 | | | | 716 | |
Capitalized other real estate owned expenses | | | 530 | | | | 851 | |
Net unrealized loss on securities available for sale | | | 142 | | | | 276 | |
Other | | | 155 | | | | 237 | |
Total gross deferred tax assets | | | 10,083 | | | | 11,785 | |
| | | | | | | | | |
Deferred tax liabilities: | | | | | | | | |
Deferred loan fees and costs | | | 247 | | | | 250 | |
Premises and equipment basis difference | | | 139 | | | | 141 | |
Originated mortgage servicing rights | | | 594 | | | | 597 | |
Core deposit intangible | | | 105 | | | | 0 | |
Other | | | 325 | | | | 267 | |
Total gross deferred tax liabilities | | | 1,410 | | | | 1,255 | |
Net deferred tax assets | | $ | 8,673 | | | | 10,530 | |
The Company has cumulative federal net operating loss carryforwards of $5.0 million at December 31, 2015 that expire beginning in 2029. The Company also has state net operating loss carryforwards of $23.2 million at December 31, 2015 that expire beginning in 2023.
Retained earnings at December 31, 2015 included approximately $8.8 million for which no provision for income taxes was made. This amount represents allocations of income to bad debt deductions for tax purposes. Reduction of amounts so allocated for purposes other than absorbing losses will create income for tax purposes, which will be subject to the then-current corporate income tax rate.
The Company considers the determination of the deferred tax asset amount and the need for any valuation reserve to be a critical accounting policy that requires significant judgment. The Company has, in its judgment, made reasonable assumptions and considered both positive and negative evidence relating to the ultimate realization of deferred tax assets. Positive evidence includes the cumulative net income generated over the prior three year period and the probability that taxable income will be generated in future periods. Negative evidence includes the general business and economic environment. Based upon this evaluation, the Company determined that no valuation allowance was required with respect to the net deferred tax assets at December 31, 2015 and 2014.
NOTE 14 Employee Benefits
All eligible full-time employees of the Bank that were hired prior to 2002 were included in a noncontributory retirement plan sponsored by the Financial Institutions Retirement Fund (FIRF). The Home Federal Savings Bank (Employer #8006) plan participates in the Pentegra Defined Benefit Plan for Financial Institutions (the Pentegra DB Plan). The Pentegra DB Plan’s Employer Identification Number is 13-5645888 and the Plan number is 333. The Pentegra DB Plan operates as a multi-employer plan for accounting purposes and as a multi-employer plan under the Employee Retirement Income Security Act of 1974, as amended (ERISA) and the Internal Revenue Code. There are no collective bargaining agreements in place that require contributions to the Pentegra DB Plan.
The Pentegra DB Plan is a single plan under Internal Revenue Code Section 413(c) and, as a result, all of the assets stand behind all of the liabilities. Accordingly, under the Pentegra DB Plan, contributions made by the participating employer may be used to provide benefits to participants of other participating employers.
Effective September 1, 2002, the accrual of benefits for existing participants was frozen and no new enrollments were permitted into the plan. The actuarial present value of accumulated plan benefits and net assets available for benefits relating to the Bank's employees was not available at December 31, 2015 because such information is not accumulated for each participating institution. As of June 30, 2015, the Pentegra DB Plan valuation report reflected that the Bank was obligated to make a contribution totaling $0.2 million which was paid during 2015.
Funded status (market value of plan assets divided by funding target) as of July 1 for the 2015, 2014, and 2013 plan years were 96.01%, 97.98%, and 89.51%, respectively. Market value of plan assets reflects contributions received through June 30, 2015.
Total employer contributions made to the Pentegra DB Plan, as reported on Form 5500, equal $190.8 million, $136.5 million, and $196.5 million for the plan years ended June 30, 2014, 2013 and 2012, respectively. The Bank’s contributions to the Pentegra DB Plan are not more than 5% of the total contributions to the Pentegra DB Plan. There is no funding improvement plan or rehabilitation plan as part of this multi-employer plan.
NOTES TO CONSOLIDATED FINANCIAL STATEMENTS
The following contributions were paid by the Bank during the fiscal years ending December 31,
(Dollars in thousands) | | | | | | | | | | | |
2015 | | 2014 | | 2013 | |
Date Paid | | Amount | | Date Paid | | Amount | | Date Paid | | Amount | |
10/15/2015 | | $ | 42 | | 10/15/2014 | | $ | 46 | | 10/15/2013 | | $ | 42 | |
12/30/2015 | | | 151 | | 12/30/2014 | | | 164 | | 12/30/2013 | | | 215 | |
Total | | $ | 193 | | | | $ | 210 | | | | $ | 257 | |
| | | | | | | | | | | | | | | |
The Company has a qualified, tax-exempt savings plan with a deferred feature qualifying under Section 401(k) of the Internal Revenue Code (the 401(k) Plan). All employees who have attained 18 years of age are eligible to participate in the 401(k) Plan. Participants are permitted to make contributions to the 401(k) Plan equal to the lesser of 50% of the participant’s annual salary or the maximum allowed by law, which was $18,000 for 2015 and $17,500 for 2014 and 2013. The Company matches 25% of each participant’s contributions up to a maximum of 8% of the participant’s annual salary. Participant contributions and earnings are fully and immediately vested. The Company’s contributions are vested on a three year cliff basis, are expensed annually, and were $0.2 million, $0.1 million, and $0.2 million in 2015, 2014 and 2013, respectively.
The Company has adopted an Employee Stock Ownership Plan (the ESOP) that meets the requirements of Section 4975(e)(7) of the Internal Revenue Code and Section 407(d)(6) of ERISA and, as such, the ESOP is empowered to borrow in order to finance purchases of the common stock of HMN. The ESOP borrowed $6.1 million from the Company to purchase 912,866 shares of common stock in the initial public offering of HMN in 1994. As a result of a merger with Marshalltown Financial Corporation (MFC), the ESOP borrowed $1.5 million in 1998 to purchase an additional 76,933 shares of HMN common stock to account for the additional employees and avoid dilution of the benefit provided by the ESOP. The ESOP debt requires quarterly payments of principal plus interest at 7.52%. The Company has committed to make quarterly contributions to the ESOP necessary to repay the loans including interest. The Company contributed $0.5 million in 2015, 2014, and 2013.
As the debt is repaid, ESOP shares that were pledged as collateral for the debt are released from collateral based on the proportion of debt service paid in the year and then allocated to eligible employees. The Company accounts for its ESOP in accordance with ASU 718,Employers' Accounting for Employee Stock Ownership Plans. Accordingly, the shares pledged as collateral are reported as unearned ESOP shares in stockholders' equity. As shares are determined to be ratably released from collateral, the Company reports compensation expense equal to the current market price of the shares, and the shares become outstanding for earnings per share computations. ESOP compensation expense was $0.3 million, $0.3 million, and $0.2 million, respectively, for 2015, 2014 and 2013.
All employees of the Bank are eligible to participate in the ESOP after they attain age 18 and complete one year of service during which they worked at least 1,000 hours. A summary of the ESOP share allocation is as follows for the years ended:
| | | 2015 | | | 2014 | | | 2013 | |
Shares held by participants beginning of the year | | | 336,024 | | | | 347,887 | | | | 350,539 | |
Shares allocated to participants | | | 24,317 | | | | 24,317 | | | | 24,317 | |
Shares purchased | | | 0 | | | | 0 | | | | 9 | |
Shares distributed to participants | | | (26,064 | ) | | | (36,180 | ) | | | (26,978 | ) |
Shares held by participants end of year | | | 334,277 | | | | 336,024 | | | | 347,887 | |
| | | | | | | | | | | | | |
Unreleased shares beginning of the year | | | 328,440 | | | | 352,757 | | | | 377,074 | |
Shares released duringyear | | | (24,317 | ) | | | (24,317 | ) | | | (24,317 | ) |
Unreleased shares end of year | | | 304,123 | | | | 328,440 | | | | 352,757 | |
Total ESOP shares end of year | | | 638,400 | | | | 664,464 | | | | 700,644 | |
Fair value of unreleased shares at December 31 | | $ | 3,512,621 | | | | 4,072,656 | | | | 3,728,641 | |
| | | | | | | | | | | | | |
In March 2001, the HMN Financial, Inc. 2001 Omnibus Stock Plan (2001 Plan) was adopted by the Company. In April 2009, this plan was superseded by the HMN Financial, Inc. 2009 Equity and Incentive Plan (2009 Plan) and options or restricted shares may no longer be awarded from the 2001 Plan. As of December 31, 2015, all outstanding options issued under the 2001 Plan have expired.
NOTES TO CONSOLIDATED FINANCIAL STATEMENTS
The purpose of the 2009 Plan is to provide key personnel and advisors with an opportunity to acquire a proprietary interest in the Company. The opportunity to acquire a proprietary interest in the Company is intended to aid in attracting, motivating and retaining key personnel and advisors, including non-employee directors, and to align their interests with those of the Company’s stockholders. 350,000 shares of HMN common stock were initially available for distribution under the 2009 Plan in either restricted stock or stock options, subject to adjustment for future stock splits, stock dividends and similar changes to the capitalization of the Company. Additionally, shares of restricted stock that are awarded are counted as 1.2 shares for purposes of determining the total shares available for issuance under the 2009 Plan. As of December 31, 2015, there were vested options to purchase 15,000 shares under the 2009 Plan that remain unexercised. These options expire 10 years from the date of grant and have an exercise price of $4.77.
A summary of activities under all plans for the past three years is as follows:
| | | | | | | | | | | | | | | | | | | Unvested options | | | | | |
| | | Shares Available For Grant | | | Unvested Restricted Shares Outstanding | | | Options Outstanding | | | Award Value/ Weighted Average Exercise Price | | | Number | | | Weighted Average Grant Date Fair Value | | | Vesting Period (in years) | |
2001 Plan | | | | | | | | | | | | | | | | | | | | | | | | | | | | |
December 31, 2012 | | | 0 | | | | 0 | | | | 45,540 | | | $ | 28.21 | | | | 0 | | | | | | | | | |
December 31, 2013 | | | 0 | | | | 0 | | | | 45,540 | | | | 28.21 | | | | 0 | | | | | | | | | |
Forfeited/expired | | | 0 | | | | 0 | | | | (30,540 | ) | | | 27.33 | | | | 0 | | | | | | | | | |
December 31, 2014 | | | 0 | | | | 0 | | | | 15,000 | | | | 30.00 | | | | 0 | | | | | | | | | |
Forfeited/expired | | | 0 | | | | 0 | | | | (15,000 | ) | | | 30.00 | | | | 0 | | | | | | | | | |
December 31, 2015 | | | 0 | | | | 0 | | | | 0 | | | | 0.00 | | | | 0 | | | | | | | | | |
| | | | | | | | | | | | | | | | | | | | | | | | | | | | | |
2009 Plan | | | | | | | | | | | | | | | | | | | | | | | | | | | | |
December 31, 2012 | | | 121,965 | | | | 148,333 | | | | 15,000 | | | $ | 4.77 | | | | 6,000 | | | $ | 4.41 | | | | | |
Granted October 4, 2013 | | | (37,531 | ) | | | 31,276 | | | | 0 | | | | N/A | | | | 0 | | | | | | | | 3 | |
Forfeited | | | 5,400 | | | | (4,500 | ) | | | 0 | | | | | | | | 0 | | | | | | | | | |
Cancelled | | | 31,219 | | | | 0 | | | | 0 | | | | | | | | 0 | | | | | | | | | |
Vested | | | 0 | | | | (73,303 | ) | | | 0 | | | | | | | | (3,000 | ) | | | 4.41 | | | | | |
December 31, 2013 | | | 121,053 | | | | 101,806 | | | | 15,000 | | | | 4.77 | | | | 3,000 | | | | 4.41 | | | | | |
Granted January 7, 2014 | | | (28,627 | ) | | | 23,856 | | | | 0 | | | | N/A | | | | 0 | | | | | | | | 3 | |
Granted May 27, 2014 | | | (26,561 | ) | | | 22,134 | | | | 0 | | | | N/A | | | | 0 | | | | | | | | 3 | |
Forfeited/expired | | | 30,540 | | | | 0 | | | | 0 | | | | | | | | 0 | | | | | | | | | |
Vested | | | 0 | | | | (62,938 | ) | | | 0 | | | | | | | | (3,000 | ) | | | 4.41 | | | | | |
December 31, 2014 | | | 96,405 | | | | 84,858 | | | | 15,000 | | | | 4.77 | | | | 0 | | | | | | | | | |
Granted January 27, 2015 | | | (11,903 | ) | | | 9,919 | | | | 0 | | | | N/A | | | | 0 | | | | | | | | 3 | |
Granted April 28, 2015 | | | (3,158 | ) | | | 2,632 | | | | 0 | | | | N/A | | | | 0 | | | | | | | | 1 | |
Granted June 8, 2015 | | | (398 | ) | | | 332 | | | | 0 | | | | N/A | | | | 0 | | | | | | | | 1 | |
Forfeited/expired | | | 395 | | | | (329 | ) | | | 0 | | | | | | | | 0 | | | | | | | | | |
Forfeited/expired | | | 15,000 | | | | 0 | | | | 0 | | | | | | | | 0 | | | | | | | | | |
Vested | | | 0 | | | | (58,526 | ) | | | 0 | | | | | | | | 0 | | | | | | | | | |
December 31, 2015 | | | 96,341 | | | | 38,886 | | | | 15,000 | | | | 4.77 | | | | 0 | | | | | | | | | |
Total all plans | | | 96,341 | | | | 38,886 | | | | 15,000 | | | $ | 4.77 | | | | 0 | | | | | | | | | |
NOTES TO CONSOLIDATED FINANCIAL STATEMENTS
The following table summarizes information about stock options outstanding at December 31, 2015:
Exercise Price | | | Number Outstanding | | | Weighted Average Remaining Contractual Life in Years | | | Number Exercisable | | | Number Unexercisable | | | Unrecognized Compensation Expense | | | Weighted Average Years Over Which Unrecognized Compensation will be Recognized | |
| $ | 4.77 | | | | 15,000 | | | | 3.4 | | | | 15,000 | | | | 0 | | | | 0 | | | | N/A | |
| | | | | | | | | | | | | | | | | | | | | | | | | | | |
The Company will issue shares from treasury stock upon the exercise of outstanding options.
In accordance with ASC 718, the Company recognized no compensation expense in 2015, as all outstanding options became fully vested in 2014. Compensation expense was recognized in 2014 and 2013 as stock options were vested. The amount of the expense was determined under the fair value method. The fair value for each option grant is estimated on the date of the grant using a Black Scholes option valuation model. There were no options granted in 2015, 2014 or 2013.
NOTE 15 Earnings per Common Share
The following table reconciles the weighted average shares outstanding and net income for basic and diluted earnings per common share:
| | | Year ended December 31, | |
(Dollars in thousands, except per share data) | | 2015 | | | 2014 | | | 2013 | |
Weighted average number of common shares outstandingused in basic earnings per common share calculation | | | 4,127,453 | | | | 4,060,404 | | | | 4,001,288 | |
| | | | | | | | | | | | | |
Net dilutive effect of : | | | | | | | | | | | | |
Options and warrants | | | 513,505 | | | | 507,856 | | | | 266,391 | |
Restricted stock awards | | | 34,959 | | | | 55,783 | | | | 42,487 | |
Weighted average number of common shares outstandingadjusted for effect of dilutive securities | | | 4,675,917 | | | | 4,624,043 | | | | 4,310,166 | |
| | | | | | | | | | | | | |
Net income | | $ | 2,956 | | | | 7,379 | | | | 26,670 | |
Dividends on preferred stock | | | (108 | ) | | | (1,710 | ) | | | (2,068 | ) |
Net income available to common shareholders | | $ | 2,848 | | | | 5,669 | | | | 24,602 | |
Basic earnings per common share | | $ | 0.69 | | | | 1.40 | | | | 6.15 | |
Diluted earnings per common share | | $ | 0.61 | | | | 1.23 | | | | 5.71 | |
| | | | | | | | | | | | | |
NOTES TO CONSOLIDATED FINANCIAL STATEMENTS
NOTE 16 Stockholders' Equity
The Company did not repurchase any shares of its common stock in the open market during 2015, 2014 or 2013. The Company has not made any dividend payments on its common stock during 2015, 2014 or 2013.
The Company's certificate of incorporation authorizes the issuance of up to 500,000 shares of preferred stock, and on December 23, 2008, the Company completed the sale of 26,000 shares of Preferred Stock to the Treasury. The Preferred Stock had a liquidation value of $1,000 per share and a related warrant was also issued to purchase 833,333 shares of HMN common stock at an exercise price of $4.68 per share (the Warrant). The transaction was part of the Treasury’s Capital Purchase Program under the Emergency Economic Stabilization Act of 2008. Under the terms of the sale, the shares of Preferred Stock were entitled to a quarterly cumulative compounding dividend at a stated rate of 5% per annum for each of the first five years of the investment, which increased to 9% on February 15, 2014, until HMN redeemed the shares.
On February 8, 2013, the Treasury sold the Preferred Stock to unaffiliated third party investors in a private transaction for $18.8 million. The Company received no proceeds from the sale and it had no effect on the terms of the outstanding Preferred Stock. Further, the sale of the Preferred Stock had no effect on the Company’s capital, financial condition or results of operations. In 2014, the Company redeemed 16,000 shares of Preferred Stock and on February 17, 2015, the Company redeemed the final 10,000 shares of outstanding Preferred Stock.
On May 21, 2015, the Treasury sold the Warrant at an exercise price of $4.68 to three unaffiliated third party investors for an aggregate purchase price of $5.7 million. Two of the investors received a warrant to purchase 277,777.67 shares and one investor received a warrant to purchase 277,777.66 shares. All of the warrants may be exercised at any time prior to their expiration date of December 23, 2018. The Company received no proceeds from this transaction and it had no effect on the Company’s capital, financial condition or results of operations.
In order to grant a priority to eligible accountholders in the event of future liquidation, the Bank, at the time of conversion to a stock savings bank, established a liquidation account equal to its regulatory capital as of September 30, 1993. In the event of future liquidation of the Bank, an eligible accountholder who continues to maintain their deposit account shall be entitled to receive a distribution from the liquidation account. The total amount of the liquidation account will decrease as the balance of eligible accountholders is reduced subsequent to the conversion, based on an annual determination of such balance.
NOTE 17 Regulatory Capital
Effective January 1, 2015 the capital requirements of the Company and the Bank were changed to implement the regulatory requirements of the Basel III capital reforms. The new requirements, among other things, (i) apply a strengthened set of capital requirements to the Bank (the Company is exempt, pursuant to the Small Bank Holding Company Policy Statement (Policy Statement) described below), including new requirements relating to common equity as a component of core capital, (ii) implement a “capital conservation buffer” against risk and a higher minimum tier 1 capital requirement, and (iii) revise the rules for calculating risk-weighted assets for purposes of such requirements. The new rules made corresponding revisions to the prompt corrective action framework and include the new capital ratios and buffer requirements which will be phased in incrementally, with full implementation scheduled for January 1, 2019. Failure to meet minimum capital requirements can initiate certain mandatory and possibly additional discretionary actions by regulators that, if undertaken, could have a direct material effect on the Company's financial statements. Under capital adequacy guidelines and the regulatory framework for prompt corrective action, both the Company and the Bank must meet specific capital guidelines that involve quantitative measures of their assets, liabilities and certain off-balance sheet items as calculated under regulatory accounting practices. The capital amounts and classification are also subject to qualitative judgments by the regulators about components, risk weightings and other factors.
In the second quarter of 2015, the FRB amended its Policy Statement, which exempted small bank holding companies from the above capital requirements, by raising the asset size threshold for determining applicability from $500 million to $1 billion. The Policy Statement was also expanded to include savings and loan holding companies that meet the Policy Statement’s qualitative requirements for exemption. The Company met the qualitative exemption requirements, and therefore, is exempt from the above capital requirements.
Quantitative measures established by regulations to ensure capital adequacy require the Bank to maintain minimum amounts and ratios (set forth in the following table) of Tier I (Core) capital, and Risk-based capital (as defined in the regulations) to total assets (as defined).
NOTES TO CONSOLIDATED FINANCIAL STATEMENTS
At December 31, 2015 and 2014, the Bank's capital amounts and ratios are presented for actual capital, required capital and excess capital including amounts and ratios in order to qualify as being well capitalized under the prompt corrective action regulations:
| | | Actual | | | Required to be Adequately Capitalized | | | Excess Capital | | | To Be Well Capitalized Under Prompt Corrective Action Provisions(1) | |
(Dollars in thousands) | | Amount | | | Percent of Assets(2) | | | Amount | | | Percent of Assets(2) | | | Amount | | | Percent of Assets(2) | | | Amount | | | Percent of Assets(2) | |
December 31, 2015 | | | | | | | | | | | | | | | | | | | | | | | | | | | | | | | | |
Common equity tier 1 capital | | $ | 71,520 | | | | 14.08 | % | | $ | 22,854 | | | | 4.50 | % | | $ | 48,666 | | | | 9.58 | % | | $ | 33,012 | | | | 6.50 | % |
Tier I leverage | | | 71,520 | | | | 11.46 | | | | 24,971 | | | | 4.00 | | | | 46,549 | | | | 7.46 | | | | 31,213 | | | | 5.00 | |
Tier 1 risk-based capital | | | 71,520 | | | | 14.08 | | | | 30,473 | | | | 6.00 | | | | 41,047 | | | | 8.08 | | | | 40,630 | | | | 8.00 | |
Total risk-based capital | | | 77,934 | | | | 15.35 | | | | 40,630 | | | | 8.00 | | | | 37,304 | | | | 7.35 | | | | 50,788 | | | | 10.00 | |
| | | | | | | | | | | | | | | | | | | | | | | | | | | | | | | | | |
December 31, 2014 | | | | | | | | | | | | | | | | | | | | | | | | | | | | | | | | |
Tier I or core capital | | $ | 66,976 | | | | 11.76 | % | | $ | 22,775 | | | | 4.00 | % | | $ | 44,201 | | | | 7.76 | % | | $ | 28,469 | | | | 5.00 | % |
Tier I risk-based capital | | | 66,976 | | | | 17.21 | | | | 15,562 | | | | 4.00 | | | | 51,414 | | | | 13.21 | | | | 23,343 | | | | 6.00 | |
Risk-based capital to risk-weighted assets | | | 71,882 | | | | 18.48 | | | | 31,125 | | | | 8.00 | | | | 40,757 | | | | 10.48 | | | | 38,906 | | | | 10.00 | |
(1)Under the recently issued final rules, revised requirements began to be phased in on January 1, 2015, as described above. (2)Based upon the Bank’s adjusted total assets for the purpose of the Tier I or core capital ratios and risk-weighted assets for the purposeof the risk-based capital ratio. | |
Management believes that, as of December 31, 2015, the Bank’s capital ratios were in excess of those quantitative capital ratio standards applicable on that date, set forth under the prompt corrective action regulations referenced above. However, there can be no assurance that the Bankwill continue to maintain such status in the future. The OCC has extensive discretion in its supervisory and enforcement activities, and can further adjust the requirement to be “well-capitalized” in the future.
NOTES TO CONSOLIDATED FINANCIAL STATEMENTS
NOTE 18 Financial Instruments with Off-Balance Sheet Risk
The Company is a party to financial instruments with off-balance sheet risk in the normal course of business to meet the financing needs of its customers. These financial instruments include commitments to extend credit. These instruments involve, to varying degrees, elements of credit and interest rate risk in excess of the amounts recognized in the balance sheet. The contract amounts of these instruments reflect the extent of involvement by the Company.
The Company's exposure to credit loss in the event of nonperformance by the other party to the financial instrument for commitments to extend credit is represented by the contract amount of these commitments. The Company uses the same credit policies in making commitments as it does for on-balance sheet instruments.
| | | December 31, Contract Amount | |
(Dollars in thousands) | | 2015 | | | 2014 | |
Financial instruments whose contract amount represents credit risk: | | | | | | | | |
Commitments to originate, fund or purchase loans: | | | | | | | | |
1-4 family mortgages | | $ | 4,292 | | | | 1,204 | |
Commercial real estate mortgages | | | 18,834 | | | | 24,956 | |
Non-real estate commercial loans | | | 1,310 | | | | 1,288 | |
Undisbursed balance of loans closed | | | 44,082 | | | | 25,875 | |
Unused lines of credit | | | 96,354 | | | | 86,714 | |
Letters of credit | | | 1,077 | | | | 1,541 | |
Total commitments to extend credit | | $ | 165,949 | | | | 141,578 | |
Forward commitments | | $ | 8,071 | | | | 3,279 | |
| | | | | | | | | |
Commitments to extend credit are agreements to lend to a customer, at the customer’s request, as long as there is no violation of any condition established in the contract. Commitments generally have fixed expiration dates or other termination clauses and may require payment of a fee. Since a portion of the commitments are expected to expire without being drawn upon, the total commitment amounts do not necessarily represent future cash requirements. The Bank evaluates each customer's creditworthiness on a case-by-case basis. The amount of collateral obtained, if deemed necessary by the Bank upon extension of credit, is based on the loan type and on management's credit evaluation of the borrower. Collateral consists primarily of residential and commercial real estate and personal property.
Forward commitments represent commitments to sell loans to a third party following the closing of the loan and are entered into in the normal course of business by the Bank.
The Bank issued standby letters of credit which guarantee the performance of customers to third parties. The standby letters of credit outstanding expire over the next 15 months and totaled $1.0 million at December 31, 2015 and $1.5 million at December 31, 2014. The letters of credit are collateralized primarily with commercial real estate mortgages. Draws on standby letters of credit would be initiated by the secured party under the terms of the underlying obligation. Since the conditions under which the Bank is required to fund the standby letters of credit may not materialize, the cash requirements are expected to be less than the total outstanding commitments.
The Company has certain obligations and commitments to make future payments under existing contracts. At December 31, 2015, the aggregate contractual obligations (excluding bank deposits) and commercial commitments were as follows:
| | | Payments Due by Period | |
(Dollars in thousands) | | Total | | | Less than 1 Year | | | 1-3 Years | | | 4-5 Years | | | After 5 Years | |
Contractual Obligations: | | | | | | | | | | | | | | | | | | | | |
Total borrowings | | $ | 9,000 | | | | 1,000 | | | | 2,000 | | | | 2,000 | | | | 4,000 | |
Annual rental commitments under non-cancellable operating leases | | | 6,673 | | | | 830 | | | | 1,559 | | | | 1,418 | | | | 2,866 | |
| | | $ | 15,673 | | | | 1,830 | | | | 3,559 | | | | 3,418 | | | | 6,866 | |
| | | Amount of Commitments Expiring by Period | |
Other Commercial Commitments: | | | | | | | | | | | | | | | | | | | | |
Commercial lines of credit | | $ | 45,513 | | | | 26,752 | | | | 5,408 | | | | 8,343 | | | | 5,010 | |
Commitments to lend | | | 39,450 | | | | 7,072 | | | | 9,612 | | | | 3,812 | | | | 18,954 | |
Standby letters of credit | | | 1,077 | | | | 1,072 | | | | 5 | | | | 0 | | | | 0 | |
| | | $ | 86,040 | | | | 34,896 | | | | 15,025 | | | | 12,155 | | | | 23,964 | |
| | | | | | | | | | | | | | | | | | | | | |
NOTES TO CONSOLIDATED FINANCIAL STATEMENTS
NOTE 19 Derivative Instruments and Hedging Activities
The Company originates single-family residential loans for sale into the secondary market and enters into commitments to sell those loans in order to mitigate the interest rate risk associated with holding the loans until they are sold. The Company accounts for its commitments in accordance with ASC 815,Accounting for Derivative Instruments and Hedging Activities.
The Company had commitments outstanding to extend credit to future borrowers that had not closed prior to the end of the year, which is referred to as its mortgage pipeline. As commitments to originate loans enter the mortgage pipeline, the Company generally enters into commitments to sell the loans into the secondary market. The commitments to originate and sell loans are derivatives that are recorded at fair value. As a result of marking these derivatives to fair value for the period ended December 31, 2015, the Company recorded a decrease of other liabilities of $7,000, an increase of other assets of $20,000 and a net gain on the sale of loans of $27,000. As a result of marking these derivatives to fair value for the period ended December 31, 2014, the Company recorded an increase in other liabilities of $7,000, an increase in other assets of $15,000 and a net gain on the sale of loans of $8,000.As of December 31, 2015 and 2014, the current commitments to sell loans held for sale are derivatives that do not qualify for hedge accounting. The loans held for sale that are not hedged are recorded at the lower of cost or market. As a result of marking these loans for the period ended December 31, 2015, the Company recorded an increase in other liabilities of $3,000 and a net loss on the sale of loans of $3,000. As a result of marking these loans for the period ended December 31, 2014, the Company recorded an increase in other liabilities of $1,000, and a net loss on the sales of loans of $1,000.
NOTE 20 Fair Value Measurement
ASC 820,Fair Value Measurements, establishes a framework for measuring the fair value of assets and liabilities using a hierarchy system consisting of three levels, based on the markets in which the assets and liabilities are traded and the reliability of the assumptions used to determine fair value. These levels are:
Level 1- Valuation is based upon quoted prices for identical instruments traded in active markets that the Company has the ability to access.
Level 2- Valuation is based upon quoted prices for similar instruments in active markets, quoted prices for identical or similar instruments in markets that are not active, and model-based valuation techniques for which significant assumptions are observable in the market.
Level 3– Valuation is generated from model-based techniques that use significant assumptions not observable in the market and are used only to the extent that observable inputs are not available. These unobservable assumptions reflect our own estimates of assumptions that market participants would use in pricing the asset or liability. Valuation techniques include use of option pricing models, discounted cash flow models and similar techniques.
The following table summarizes the assets of the Company for which fair values are determined on a recurring basis as of December 31, 2015 and 2014.
| | | Carrying Value at December 31, 2015 | |
(Dollars in thousands) | | Total | | | Level 1 | | | Level 2 | | | Level 3 | |
Securities available for sale | | $ | 111,974 | | | | 0 | | | | 111,974 | | | | 0 | |
Mortgage loan commitments | | | 36 | | | | 0 | | | | 36 | | | | 0 | |
Total | | $ | 112,010 | | | | 0 | | | | 112,010 | | | | 0 | |
| | | | | | | | | | | | | | | | | |
| | | Carrying Value at December 31, 2014 | |
(Dollars in thousands) | | Total | | | Level 1 | | | Level 2 | | | Level 3 | |
Securities available for sale | | $ | 137,834 | | | | 0 | | | | 137,834 | | | | 0 | |
Mortgage loan commitments | | | 16 | | | | 0 | | | | 16 | | | | 0 | |
Total | | $ | 137,850 | | | | 0 | | | | 137,850 | | | | 0 | |
| | | | | | | | | | | | | | | | | |
NOTES TO CONSOLIDATED FINANCIAL STATEMENTS
The Company may also be required, from time to time, to measure certain other financial assets at fair value on a nonrecurring basis in accordance with generally accepted accounting principles. These adjustments to fair value usually result from the application of the lower-of-cost-or-market accounting or write-downs of individual assets. For assets measured at fair value on a nonrecurring basis in 2015 and 2014 that were still held at December 31, the following table provides the level of valuation assumptions used to determine each adjustment and the carrying value of the related individual assets or portfolios at December 31, 2015 and 2014.
| | | Carrying Value at December 31, 2015 | | | | | |
(Dollars in thousands) | | Total | | | Level 1 | | | Level 2 | | | Level 3 | | | Year Ended December 31, 2015 Total gains (losses) | |
Loans held for sale | | $ | 3,779 | | | | 0 | | | | 3,779 | | | | 0 | | | | 3 | |
Mortgage servicing rights | | | 1,499 | | | | 0 | | | | 1,499 | | | | 0 | | | | 0 | |
Loans(1) | | | 4,790 | | | | 0 | | | | 4,790 | | | | 0 | | | | (373 | ) |
Real estate, net (2) | | | 2,045 | | | | 0 | | | | 2,045 | | | | 0 | | | | (262 | ) |
Total | | $ | 12,113 | | | | 0 | | | | 12,113 | | | | 0 | | | | (632 | ) |
| | | Carrying Value at December 31, 2014 | | | | | |
(Dollars in thousands) | | Total | | | Level 1 | | | Level 2 | | | Level 3 | | | Year Ended December 31, 2014 Total gains (losses) | |
Loans held for sale | | $ | 2,076 | | | | 0 | | | | 2,076 | | | | 0 | | | | (1 | ) |
Mortgage servicing rights | | | 1,507 | | | | 0 | | | | 1,507 | | | | 0 | | | | 0 | |
Loans(1) | | | 11,882 | | | | 0 | | | | 11,882 | | | | 0 | | | | 532 | |
Real estate, net (2) | | | 3,103 | | | | 0 | | | | 3,103 | | | | 0 | | | | (134 | ) |
Total | | $ | 18,568 | | | | 0 | | | | 18,568 | | | | 0 | | | | 397 | |
| | | | | | | | | | | | | | | | | | | | | |
(1)Represents carrying value and related specific reserves on loans for which adjustments are based on the appraised value of the collateral. The carrying value of loans fully charged-off is zero. (2)Represents the fair value and related losses on foreclosed real estate and other collateral owned that were measured at fair value subsequent to their initial classification as foreclosed assets. |
NOTE 21 Fair Value of Financial Instruments
ASC 825,Disclosures about Fair Values of Financial Instruments, requires disclosure of estimated fair values of the Company's financial instruments, including assets, liabilities and off-balance sheet items for which it is practicable to estimate fair value. The fair value estimates are made as of December 31, 2015 and 2014 based upon relevant market information, if available, and upon the characteristics of the financial instruments themselves. Because no market exists for a significant portion of the Company's financial instruments, fair value estimates are based upon judgments regarding future expected loss experience, current economic conditions, risk characteristics of various financial instruments, and other factors. The estimates are subjective in nature and involve uncertainties and matters of significant judgment and therefore cannot be determined with precision. Changes in assumptions could significantly affect the estimates.
Fair value estimates are based only on existing financial instruments without attempting to estimate the value of anticipated future business or the value of assets and liabilities that are not considered financial instruments. In addition, the tax ramifications related to the realization of the unrealized gains and losses can have a significant effect on the fair value estimates and have not been considered in any of the estimates.
NOTES TO CONSOLIDATED FINANCIAL STATEMENTS
The estimated fair value of the Company's financial instruments are shown below. Following the table, there is an explanation of the methods and assumptions used to estimate the fair value of each class of financial instruments.
| | | December 31, 2015 | | | December 31, 2014 | |
| | | | | | | | | | | Fair value hierarchy | | | | | | | | | | | | | | | | | |
(Dollars in thousands) | | Carrying amount | | | Estimated fair value | | | Level 1 | | | Level 2 | | | Level 3 | | | Contract amount | | | Carrying amount | | | Estimated fair value | | | Contract amount | |
Financial assets: | | | | | | | | | | | | | | | | | | | | | | | | | | | | | | | | | | | | |
Cash and cash equivalents | | $ | 39,782 | | | | 39,782 | | | | 39,782 | | | | | | | | | | | | | | | | 46,634 | | | | 46,634 | | | | | |
Securities available for sale | | | 111,974 | | | | 111,974 | | | | | | | | 111,974 | | | | | | | | | | | | 137,834 | | | | 137,834 | | | | | |
Loans held for sale | | | 3,779 | | | | 3,779 | | | | | | | | 3,779 | | | | | | | | | | | | 2,076 | | | | 2,076 | | | | | |
Loans receivable, net | | | 463,185 | | | | 458,539 | | | | | | | | 458,539 | | | | | | | | | | | | 365,113 | | | | 364,509 | | | | | |
FHLB stock | | | 691 | | | | 691 | | | | | | | | 691 | | | | | | | | | | | | 777 | | | | 777 | | | | | |
Accrued interest receivable | | | 2,254 | | | | 2,254 | | | | | | | | 2,254 | | | | | | | | | | | | 1,713 | | | | 1,713 | | | | | |
Financial liabilities: | | | | | | | | | | | | | | | | | | | | | | | | | | | | | | | | | | | | |
Deposits | | | 559,387 | | | | 558,731 | | | | | | | | 558,731 | | | | | | | | | | | | 496,750 | | | | 496,494 | | | | | |
FHLB advances and other borrowings | | | 9,000 | | | | 9,000 | | | | | | | | 9,000 | | | | | | | | | | | | 0 | | | | 0 | | | | | |
Accrued interest payable | | | 242 | | | | 242 | | | | | | | | 242 | | | | | | | | | | | | 93 | | | | 93 | | | | | |
Off-balance sheet financial instruments: | | | | | | | | | | | | | | | | | | | | | | | | | | | | | | | | | | | | |
Commitments to extend credit | | | 36 | | | | 36 | | | | | | | | | | | | | | | | 165,949 | | | | 16 | | | | 16 | | | | 141,578 | |
Commitments to sell loans | | | (26 | ) | | | (26 | ) | | | | | | | | | | | | | | | 8,071 | | | | (30 | ) | | | (30 | ) | | | 3,279 | |
Cash and Cash Equivalents
The carrying amount of cash and cash equivalents approximates their fair value.
Securities Available for Sale
The fair values of securities were based upon quoted market prices.
Loans Held for Sale
The fair values of loans held for sale were based upon quoted market prices for loans with similar interest rates and terms to maturity.
Loans Receivable
The fair values of loans receivable were estimated for groups of loans with similar characteristics. The fair value of the loan portfolio, with the exception of the adjustable rate portfolio, was calculated by discounting the scheduled cash flows through the estimated maturity using anticipated prepayment speeds and using discount rates that reflect the credit and interest rate risk inherent in each loan portfolio. The fair value of the adjustable loan portfolio was estimated by grouping the loans with similar characteristics and comparing the characteristics of each group to the prices quoted for similar types of loans in the secondary market.
FHLB Stock
The carrying amount of FHLB stock approximates its fair value.
Accrued Interest Receivable
The carrying amount of accrued interest receivable approximates its fair value since it is short-term in nature and does not present unanticipated credit concerns.
Deposits
The fair value of demand deposits, savings accounts and certain money market account deposits is the amount payable on demand at the reporting date. The fair value of fixed maturity certificates of deposit is estimated using the rates currently offered for deposits of similar remaining maturities.
The fair value estimate for deposits does not include the benefit that results from the low cost funding provided by the Company's existing deposits and long-term customer relationships compared to the cost of obtaining different sources of funding. This benefit is commonly referred to as the core deposit intangible.
FHLB Advances and Other Borrowings
The fair values of advances and borrowings with fixed maturities are estimated based on discounted cash flow analysis using as discount rates the interest rates charged by the FHLB for borrowings of similar remaining maturities.
Accrued Interest Payable
The carrying amount of accrued interest payable approximates its fair value since it is short-term in nature.
Commitments to Extend Credit
The fair values of commitments to extend credit are estimated using the fees normally charged to enter into similar agreements, taking into account the remaining terms of the agreements and the present creditworthiness of the counter parties.
Commitments to Sell Loans
The fair values of commitments to sell loans are estimated using the quoted market prices for loans with similar interest rates and terms to maturity.
NOTES TO CONSOLIDATED FINANCIAL STATEMENTS
NOTE 22 HMN Financial, Inc. Financial Information (Parent Company Only)
The following are the condensed financial statements for the parent company only as of December 31, 2015 and 2014 and for the years ended December 31, 2015, 2014 and 2013.
(Dollars in thousands) | | 2015 | | | 2014 | | | 2013 | |
Condensed Balance Sheets | | | | | | | | | | | | |
Assets: | | | | | | | | | | | | |
Cash and cash equivalents | | $ | 2,564 | | | | 557 | | | | | |
Investment in subsidiaries | | | 74,565 | | | | 73,733 | | | | | |
Loans receivable, net | | | 0 | | | | 900 | | | | | |
Prepaid expenses and other assets | | | 33 | | | | 10 | | | | | |
Deferred tax asset, net | | | 1,000 | | | | 1,022 | | | | | |
Total assets | | $ | 78,162 | | | | 76,222 | | | | | |
Liabilities and Stockholders' Equity: | | | | | | | | | | | | |
Other borrowed money | | | 9,000 | | | | 0 | | | | | |
Accrued expenses and other liabilities | | $ | (483 | ) | | | 209 | | | | | |
Total liabilities | | | 8,517 | | | | 209 | | | | | |
Serial preferred stock | | | 0 | | | | 10,000 | | | | | |
Common stock | | | 91 | | | | 91 | | | | | |
Additional paid-in capital | | | 50,388 | | | | 50,207 | | | | | |
Retained earnings | | | 80,536 | | | | 77,805 | | | | | |
Net unrealized losses on securities available for sale | | | (214 | ) | | | (418 | ) | | | | |
Unearned employee stock ownership plan shares | | | (2,417 | ) | | | (2,610 | ) | | | | |
Treasury stock, at cost, 4,645,769 and 4,658,323 shares | | | (58,739 | ) | | | (59,062 | ) | | | | |
Total stockholders' equity | | | 69,645 | | | | 76,013 | | | | | |
Total liabilities and stockholders' equity | | $ | 78,162 | | | | 76,222 | | | | | |
Condensed Statements of Income | | | | | | | | | | | | |
Interest income | | $ | 1 | | | | 1 | | | | 1 | |
Interest expense | | | (571 | ) | | | 0 | | | | 0 | |
Equity income of subsidiaries | | | 3,629 | | | | 7,644 | | | | 26,792 | |
Compensation and benefits | | | (269 | ) | | | (233 | ) | | | (235 | ) |
Occupancy | | | (30 | ) | | | (24 | ) | | | (24 | ) |
Data processing | | | (6 | ) | | | (6 | ) | | | (6 | ) |
Other | | | (335 | ) | | | (539 | ) | | | (498 | ) |
Income before income tax benefit | | | 2,419 | | | | 6,843 | | | | 26,030 | |
Income tax benefit | | | (537 | ) | | | (536 | ) | | | (640 | ) |
Net income | | $ | 2,956 | | | | 7,379 | | | | 26,670 | |
Condensed Statements of Cash Flows | | | | | | | | | | | | |
Cash flows from operating activities: | | | | | | | | | | | | |
Net income | | $ | 2,956 | | | | 7,379 | | | | 26,670 | |
Adjustments to reconcile net income to cash used by operating activities: | | | | | | | | | | | | |
Equity income of subsidiaries | | | (3,629 | ) | | | (7,644 | ) | | | (26,792 | ) |
Deferred income tax benefit | | | (22 | ) | | | (92 | ) | | | (931 | ) |
Earned employee stock ownership shares priced above (below) original cost | | | 57 | | | | 53 | | | | (21 | ) |
Stock option compensation | | | 0 | | | | 1 | | | | 4 | |
Cancellation of restricted stock awards | | | 0 | | | | 0 | | | | (119 | ) |
Amortization of restricted stock awards | | | 447 | | | | 240 | | | | 202 | |
Decrease in unearned ESOP shares | | | 193 | | | | 194 | | | | 193 | |
(Decrease) increase in accrued expenses and other liabilities | | | (692 | ) | | | (420 | ) | | | 47 | |
Decrease (increase) in other assets | | | 23 | | | | 69 | | | | (65 | ) |
Other, net | | | (1 | ) | | | 0 | | | | (1 | ) |
Net cash used by operating activities | | | (668 | ) | | | (220 | ) | | | (813 | ) |
Cash flows from investing activities: | | | | | | | | | | | | |
Decrease (increase) in loans receivable, net | | | 900 | | | | 100 | | | | (200 | ) |
Net cash provided (used) by investing activities | | | 900 | | | | 100 | | | | (200 | ) |
Cash flows from financing activities: | | | | | | | | | | | | |
Redemption of preferred stock | | | (10,000 | ) | | | (16,000 | ) | | | 0 | |
Dividends to preferred stockholders | | | (225 | ) | | | (5,964 | ) | | | 0 | |
Proceeds from borrowings | | | 10,000 | | | | 0 | | | | 0 | |
Repayments of borrowings | | | (1,000 | ) | | | 0 | | | | 0 | |
Dividends received from Bank | | | 3,000 | | | | 22,500 | | | | 1,000 | |
Net cash provided by financing activities | | | 1,775 | | | | 536 | | | | 1,000 | |
Increase (decrease) in cash and cash equivalents | | | 2,007 | | | | 416 | | | | (13 | ) |
Cash and cash equivalents, beginning of year | | | 557 | | | | 141 | | | | 154 | |
Cash and cash equivalents, end of year | | $ | 2,564 | | | | 557 | | | | 141 | |
| | | | | | | | | | | | | |
NOTES TO CONSOLIDATED FINANCIAL STATEMENTS
NOTE 23 Business Segments
The Bank has been identified as a reportable operating segment in accordance with the provisions of ASC 280. HMN, the holding company, did not meet the quantitative thresholds for a reportable segment and therefore is included in the “Other” category. The Company evaluates performance and allocates resources based on the segment’s net income, return on average assets and return on average equity. Each corporation is managed separately with its own officers and board of directors.
The following table sets forth certain information about the reconciliations of reported net income and assets for each of the Company’s reportable segments.
(Dollars in thousands) | | Home Federal Savings Bank | | | Other | | | Eliminations | | | Consolidated Total | |
| | | | | | | | | | | | | | | | | |
At or for the year ended December 31, 2015: | | | | | | | | | | | | | | | | |
Interest income – external customers | | $ | 21,453 | | | | 0 | | | | 0 | | | | 21,453 | |
Non-interest income – external customers | | | 7,653 | | | | 0 | | | | 0 | | | | 7,653 | |
Intersegment interest income | | | 0 | | | | 1 | | | | (1 | ) | | | 0 | |
Intersegment non-interest income | | | 204 | | | | 3,629 | | | | (3,833 | ) | | | 0 | |
Interest expense | | | 937 | | | | 571 | | | | (1 | ) | | | 1,507 | |
Non-interest expense | | | 22,760 | | | | 640 | | | | (204 | ) | | | 23,196 | |
Income tax expense (benefit) | | | 2,148 | | | | (537 | ) | | | 0 | | | | 1,611 | |
Net income | | | 3,629 | | | | 2,956 | | | | (3,629 | ) | | | 2,956 | |
Total assets | | | 642,151 | | | | 78,162 | | | | (77,152 | ) | | | 643,161 | |
| | | | | | | | | | | | | | | | | |
At or for the year ended December 31, 2014: | | | | | | | | | | | | | | | | |
Interest income – external customers | | $ | 20,613 | | | | 0 | | | | 0 | | | | 20,613 | |
Non-interest income – external customers | | | 7,284 | | | | 0 | | | | 0 | | | | 7,284 | |
Intersegment interest income | | | 0 | | | | 2 | | | | (2 | ) | | | 0 | |
Intersegment non-interest income | | | 180 | | | | 7,644 | | | | (7,824 | ) | | | 0 | |
Interest expense | | | 1,213 | | | | 0 | | | | (2 | ) | | | 1,211 | |
Non-interest expense | | | 20,781 | | | | 802 | | | | (180 | ) | | | 21,403 | |
Income tax expense (benefit) | | | 5,438 | | | | (536 | ) | | | 0 | | | | 4,902 | |
Net income | | | 7,644 | | | | 7,379 | | | | (7,644 | ) | | | 7,379 | |
Total assets | | | 576,397 | | | | 76,221 | | | | (75,192 | ) | | | 577,426 | |
| | | | | | | | | | | | | | | | | |
At or for the year ended December 31, 2013: | | | | | | | | | | | | | | | | |
Interest income – external customers | | $ | 22,983 | | | | 0 | | | | 0 | | | | 22,983 | |
Non-interest income – external customers | | | 7,312 | | | | 0 | | | | 0 | | | | 7,312 | |
Intersegment interest income | | | 0 | | | | 1 | | | | (1 | ) | | | 0 | |
Intersegment non-interest income | | | 182 | | | | 26,792 | | | | (26,974 | ) | | | 0 | |
Interest expense | | | 3,290 | | | | 0 | | | | (1 | ) | | | 3,289 | |
Non-interest expense | | | 22,039 | | | | 766 | | | | (182 | ) | | | 22,623 | |
Income tax benefit | | | (13,766 | ) | | | (640 | ) | | | 0 | | | | (14,406 | ) |
Net income | | | 26,795 | | | | 26,667 | | | | (26,792 | ) | | | 26,670 | |
Total assets | | | 647,679 | | | | 90,483 | | | | (89,540 | ) | | | 648,622 | |
| | | | | | | | | | | | | | | | | |

REPORT OF INDEPENDENT REGISTERED PUBLIC ACCOUNTING FIRM
Board of Directors and Stockholders
HMN Financial, Inc. and Subsidiaries
Rochester, Minnesota
We have audited the accompanying consolidated balance sheets of HMN Financial, Inc. and Subsidiaries (the Company) as of December 31, 2015 and 2014, and the related consolidated statements of comprehensive income, stockholders’ equity, and cash flows for the years then ended. These consolidated financial statements are the responsibility of the Company’s management. Our responsibility is to express an opinion of these consolidated financial statements based on our audits. The consolidated statements of comprehensive income, stockholders’ equity, and cash flows of HMN Financial, Inc. and subsidiaries for the year ended December 31, 2013 were audited by other auditors whose report dated March 11, 2014, was unqualified.
We conducted our audits in accordance with the standards of the Public Company Accounting Oversight Board (United States). Those standards require that we plan and perform the audits to obtain reasonable assurance about whether the financial statements are free of material misstatement. An audit includes examining, on a test basis, evidence supporting the amounts and disclosures in the financial statements. An audit also includes assessing the accounting principles used and significant estimates made by management, as well as evaluating the overall financial statement presentation. We believe that our audits provide a reasonable basis for our opinion.
In our opinion, the consolidated financial statements referred to above present fairly, in all material respects, the financial position of HMN Financial, Inc. and subsidiaries as of December 31, 2015 and 2014, and the results of their operations and their cash flows for the years then ended in conformity with accounting principles generally accepted in the United States of America.

Minneapolis, Minnesota
March 11, 2016

OTHER FINANCIAL DATA
The following tables set forth certain information as to the Bank’s Federal Home Loan Bank (FHLB) advances.
| | | Year Ended December 31, | |
(Dollars in thousands) | | 2015 | | | 2014 | | | 2013 | |
Maximum Balance: | | | | | | | | | | | | |
FHLB advances | | $ | 16,000 | | | | 0 | | | | 70,000 | |
FHLB short-term advances | | | 16,000 | | | | 0 | | | | 70,000 | |
Average Balance: | | | | | | | | | | | | |
FHLB advances | | | 551 | | | | 0 | | | | 30,329 | |
FHLB short-term advances | | | 551 | | | | 0 | | | | 30,329 | |
| | | | | | | | | | | | | |
See“Note 12 Federal Home Loan Bank (FHLB) Advances and Other Borrowings” in the Notes to Consolidated Financial Statements for more information on the Bank’s FHLB advances and other borrowings.
COMMON STOCK INFORMATION
The common stock of the Company is listed on the Nasdaq Stock Market under the symbol HMNF. As of December 31, 2015, the Company had 9,128,662 shares of common stock issued and 4,645,769 shares in treasury stock. As of December 31, 2015, there were 598 stockholders of record and 1,048 estimated beneficial stockholders. The following table presents the stock price information for the Company as furnished by Nasdaq for each quarter for the last two fiscal years. On February 12, 2016, the last reported sale price of shares of our common stock on the Nasdaq Stock Market was $11.00 per share. The Company has not paid a dividend on its common stock during the three year period ending December 31, 2015 and no common stock dividends are anticipated to be paid in 2016. See “Liquidity and Capital Resources – Dividends” in the“Management Discussion and Analysis” section of this annual report for a description of restrictions on the ability of the Company and the Bank to pay dividends.
| | | December 31, 2015 | | | September 30, 2015 | | | June 30, 2015 | | | March 31, 2015 | | | December 31, 2014 | | | September 30, 2014 | | | June 30, 2014 | | | March 31, 2014 | |
HIGH | | $ | 12.06 | | | | 12.06 | | | | 12.61 | | | | 12.92 | | | | 13.95 | | | | 13.20 | | | | 11.98 | | | | 13.44 | |
LOW | | | 11.06 | | | | 10.88 | | | | 10.18 | | | | 11.46 | | | | 10.06 | | | | 10.95 | | | | 8.94 | | | | 9.82 | |
CLOSE | | | 11.55 | | | | 11.51 | | | | 11.79 | | | | 12.10 | | | | 12.40 | | | | 13.20 | | | | 11.00 | | | | 9.85 | |
The following graph and table compares the total cumulative stockholders’ return on the Company’s common stock to the NASDAQ U.S. Stock Index (“NASDAQ Composite”), which includes all NASDAQ traded stocks of U.S. companies, and the SNL Bank NASDAQ Index. The graph and table assume that $100 was invested on December 31, 2010 and that all dividends were reinvested.
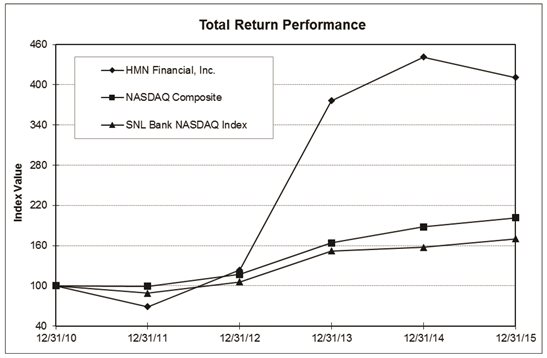
| | | | | | | Period Ending | | | | | |
Index | | 12/31/10 | | | 12/31/11 | | | 12/31/12 | | | 12/31/13 | | | 12/31/14 | | | 12/31/15 | |
HMN Financial, Inc. | | | 100.00 | | | | 68.90 | | | | 123.53 | | | | 376.16 | | | | 441.28 | | | | 411.03 | |
NASDAQ Composite | | | 100.00 | | | | 99.21 | | | | 116.82 | | | | 163.75 | | | | 188.03 | | | | 201.40 | |
SNL Bank NASDAQ Index | | | 100.00 | | | | 88.73 | | | | 105.75 | | | | 152.00 | | | | 157.42 | | | | 169.94 | |
SELECTED QUARTERLY FINANCIAL DATA
(Dollars in thousands, except per share data) | | December 31, 2015 | | | September 30, 2015 | | | June 30, 2015 | |
| Selected Operations Data(3 months ended): | | | | | | | | | | | | |
Interest income | | $ | 6,109 | | | | 5,390 | | | | 5,070 | |
Interest expense | | | 393 | | | | 397 | | | | 391 | |
Net interest income | | | 5,716 | | | | 4,993 | | | | 4,679 | |
Provision for loan losses | | | 75 | | | | (56 | ) | | | (183 | ) |
Net interest income after provision for loan losses | | | 5,641 | | | | 5,049 | | | | 4,862 | |
Non-interest income: | | | | | | | | | | | | |
Fees and service charges | | | 827 | | | | 863 | | | | 844 | |
Loan servicing fees | | | 268 | | | | 262 | | | | 257 | |
Gain on sales of loans | | | 536 | | | | 613 | | | | 530 | |
Gain on aquisition | | | 0 | | | | 289 | | | | 0 | |
Other | | | 330 | | | | 204 | | | | 236 | |
Total non-interest income | | | 1,961 | | | | 2,231 | | | | 1,867 | |
Non-interest expense: | | | | | | | | | | | | |
Compensation and benefits | | | 3,448 | | | | 3,299 | | | | 3,540 | |
(Gains) losses on real estate owned | | | 97 | | | | 168 | | | | 65 | |
Occupancy | | | 981 | | | | 936 | | | | 926 | |
Deposit insurance | | | 106 | | | | 125 | | | | 74 | |
Data processing | | | 267 | | | | 254 | | | | 268 | |
Other | | | 1,097 | | | | 1,187 | | | | 927 | |
Total non-interest expense | | | 5,996 | | | | 5,969 | | | | 5,800 | |
Income before income tax expense | | | 1,606 | | | | 1,311 | | | | 929 | |
Income tax expense | | | 516 | | | | 491 | | | | 344 | |
Net income | | | 1,090 | | | | 820 | | | | 585 | |
Preferred stock dividends | | | 0 | | | | 0 | | | | 0 | |
Net income available to common stockholders | | $ | 1,090 | | | | 820 | | | | 585 | |
Basic earnings per common share | | $ | 0.26 | | | | 0.20 | | | | 0.14 | |
Diluted earnings per common share | | $ | 0.23 | | | | 0.18 | | | | 0.13 | |
Financial Ratios: | | | | | | | | | | | | |
Return on average assets(1) | | | 0.69 | % | | | 0.53 | % | | | 0.42 | % |
Return on average common equity(1) | | | 6.19 | | | | 4.77 | | | | 3.50 | |
Average equity to average assets | | | 11.70 | | | | 11.91 | | | | 12.30 | |
Net interest margin(1)(2) | | | 3.80 | | | | 3.44 | | | | 3.56 | |
| | | | | | | | | | | | | |
(Dollars in thousands) | | | | | | | | | | | | |
Selected Financial Condition Data: | | | | | | | | | | | | |
Total assets | | $ | 643,161 | | | | 618,917 | | | | 564,001 | |
Securities available for sale: | | | | | | | | | | | | |
Mortgage-backed and related securities | | | 2,283 | | | | 7,080 | | | | 2,115 | |
Other marketable securities | | | 109,691 | | | | 138,258 | | | | 123,326 | |
Loans held for sale | | | 3,779 | | | | 5,153 | | | | 5,968 | |
Loans receivable, net | | | 463,185 | | | | 432,174 | | | | 368,110 | |
Deposits | | | 559,387 | | | | 531,586 | | | | 481,476 | |
Stockholders’ equity | | | 69,645 | | | | 68,710 | | | | 67,494 | |
(1) Annualized
(2) Net interest income divided by average interest-earning assets
March 31, 2015 | | | December 31, 2014 | | | September 30, 2014 | | | June 30, 2014 | | | March 31, 2014 | |
| | | | | | | | | | | | | | | | | | |
| 4,884 | | | | 5,035 | | | | 5,131 | | | | 5,020 | | | | 5,427 | |
| 326 | | | | 274 | | | | 297 | | | | 306 | | | | 334 | |
| 4,558 | | | | 4,761 | | | | 4,834 | | | | 4,714 | | | | 5,093 | |
| 0 | | | | (2,221 | ) | | | (989 | ) | | | (2,178 | ) | | | (1,610 | ) |
| 4,558 | | | | 6,982 | | | | 5,823 | | | | 6,892 | | | | 6,703 | |
| | | | | | | | | | | | | | | | | | |
| 782 | | | | 831 | | | | 903 | | | | 901 | | | | 823 | |
| 261 | | | | 271 | | | | 263 | | | | 263 | | | | 261 | |
| 285 | | | | 348 | | | | 804 | | | | 330 | | | | 346 | |
| 0 | | | | 0 | | | | 0 | | | | 0 | | | | 0 | |
| 268 | | | | 230 | | | | 224 | | | | 228 | | | | 258 | |
| 1,596 | | | | 1,680 | | | | 2,194 | | | | 1,722 | | | | 1,688 | |
| | | | | | | | | | | | | | | | | | |
| 3,448 | | | | 3,388 | | | | 3,193 | | | | 3,273 | | | | 3,478 | |
| (112 | ) | | | (64 | ) | | | (78 | ) | | | (1,120 | ) | | | 68 | |
| 879 | | | | 1,037 | | | | 896 | | | | 876 | | | | 882 | |
| 70 | | | | 107 | | | | 74 | | | | 97 | | | | 157 | |
| 231 | | | | 276 | | | | 240 | | | | 249 | | | | 246 | |
| 917 | | | | 1,073 | | | | 1,100 | | | | 1,089 | | | | 866 | |
| 5,433 | | | | 5,817 | | | | 5,425 | | | | 4,464 | | | | 5,697 | |
| 721 | | | | 2,845 | | | | 2,592 | | | | 4,150 | | | | 2,694 | |
| 260 | | | | 1,167 | | | | 1,054 | | | | 1,620 | | | | 1,062 | |
| 461 | | | | 1,678 | | | | 1,538 | | | | 2,530 | | | | 1,632 | |
| (108 | ) | | | (293 | ) | | | (360 | ) | | | (524 | ) | | | (532 | ) |
| 353 | | | | 1,385 | | | | 1,178 | | | | 2,006 | | | | 1,100 | |
| 0.09 | | | | 0.34 | | | | 0.29 | | | | 0.50 | | | | 0.27 | |
| 0.08 | | | | 0.30 | | | | 0.25 | | | | 0.44 | | | | 0.24 | |
| | | | | | | | | | | | | | | | | | |
| 0.33 | % | | | 1.13 | % | | | 1.01 | % | | | 1.62 | % | | | 1.08 | % |
| 2.60 | | | | 8.74 | | | | 7.89 | | | | 12.32 | | | | 7.61 | |
| 12.62 | | | | 13.25 | | | | 13.37 | | | | 13.68 | | | | 14.23 | |
| 3.42 | | | | 3.42 | | | | 3.31 | | | | 3.20 | | | | 3.59 | |
| | | | | | | | | | | | | | | | | | |
| | | | | | | | | | | | | | | | | | |
| | | | | | | | | | | | | | | | | | |
| 565,487 | | | | 577,426 | | | | 594,433 | | | | 609,882 | | | | 620,775 | |
| | | | | | | | | | | | | | | | | | |
| 2,471 | | | | 2,909 | | | | 3,361 | | | | 3,878 | | | | 4,462 | |
| 151,674 | | | | 134,925 | | | | 137,180 | | | | 123,369 | | | | 98,031 | |
| 2,663 | | | | 2,076 | | | | 1,235 | | | | 3,861 | | | | 1,425 | |
| 360,370 | | | | 365,113 | | | | 365,572 | | | | 367,667 | | | | 383,020 | |
| 483,323 | | | | 496,750 | | | | 504,908 | | | | 522,853 | | | | 522,383 | |
| 66,775 | | | | 76,013 | | | | 80,611 | | | | 79,376 | | | | 87,226 | |
HMN Financial, Inc.
1016 Civic Center Drive NW
Rochester, MN 55901
(507) 535-1200
Annual Meeting
The annual meeting of shareholders will be held on Tuesday, April 26, 2016 at 10:00 a.m. (Central Time) at the Rochester Golf and Country Club, 3100 West Country Club Road, Rochester, Minnesota.
Legal Counsel
Faegre Baker Daniels LLP
2200 Wells Fargo Center
90 South Seventh Street
Minneapolis, MN 55402-3901
Independent Registered Public Accounting Firm
CliftonLarsonAllen LLP
220 South Sixth Street, Suite 300
Minneapolis, MN 55402-1436
Investor Information and Form 10-K
HMN’s Form 10-K, filed with the Securities and Exchange Commission, is available without charge upon written request from:
HMN Financial, Inc.
Attn: Cindy Hamlin,
Investor Relations
1016 Civic Center Drive NW
Rochester, MN 55901
or atwww.hmnf.com
Transfer Agent and Registrar
Inquiries regarding change of address, transfer requirements, and lost certificates should be directed to HMN’s transfer agent:
Wells Fargo Bank, N.A.
Shareowner Services
1110 Centre Pointe Curve, Suite 101
MAC N9173-010
Mendota Heights, MN 55120
www.wellsfargo.com/
shareownerservices
(800) 468-9716
Directors
Dr.Hugh C. Smith
Chairman of the Board
HMN and Home Federal Savings Bank
Retired Professor of Medicine, Mayo Clinic College of Medicine and Consultant in Cardiovascular Division, Mayo Clinic
Allen J. Berning
Chief Executive Officer
Ambient Clinical Analytics
Michael J. Fogarty
RetiredVice President
C.O. Brown Agency, Inc.
Bradley C. Krehbiel
President and Chief Executive Officer
HMN and Home Federal Savings Bank
Malcolm W. McDonald
Retired Senior Vice President
Space Center, Inc.
Bernard R. Nigon
RetiredAudit Partner with
RSM US LLP
Wendy S. Shannon
Assistant Professor
Winona State University
Dr. Patricia S. Simmons
Retired Professor of Pediatric and Adolescent Medicine, Mayo Clinic College of Medicine
Mark E. Utz
Attorney at law, Wendland Utz, Ltd.
Executive Officers Who Are Not Directors
Jon J. Eberle
Senior Vice President,
Chief Financial Officer
and Treasurer of HMN and
Executive Vice President, Chief Financial Officer and Treasurer of
Home Federal Savings Bank
Susan K. Kolling
Senior Vice President
HMN and Home Federal Savings Bank
Lawrence D. McGraw
Executive Vice President and
ChiefOperating Officer
Home Federal Savings Bank
Branch Offices of Bank
Albert Lea
143 West Clark Street
Albert Lea, MN 56007
(507) 379-2551
Austin
201 Oakland Avenue West
Austin, MN 55912
(507) 434-2500
Eagan
2805 Dodd Road, Suite 160
Eagan, MN 55121
(651) 405-2000
Kasson
203 West Main
Kasson, MN 55944
(507) 634-7022
502 South Mantorville Avenue
Kasson, MN 55944
(507) 634-4141
LaCrescent
208 South Walnut
La Crescent, MN 55947
(507) 895-9200
Marshalltown
303 West Main Street
Marshalltown, IA 50158
(641) 754-6198
Rochester
1201 South Broadway
Rochester, MN 55901
(507) 536-2416
1016 Civic Center Drive NW
Rochester, MN 55901
(507) 535-1309
100 1st Avenue Bldg., Suite 200
Rochester, MN 55902
(507) 280-7256
2048 Superior Drive NW, Suite 400
Rochester, MN 55901
(507) 226-0800
Spring Valley
715 North Broadway
Spring Valley, MN 55975
(507) 346-9709
Winona
175 Center Street
Winona, MN 55987
(507) 453-6460
Loan Production Offices
Sartell
50 14th Ave E, Suite 100
Sartell, MN 56377
(320) 654-4020
Owatonna
1850 Austin Road, Suite 103
Owatonna, MN 55060
(507) 413-6420
Delafield
3960 Hillside Drive, Suite 206
Delafield, WI 53018
(262) 337-9511