UNITED STATES
SECURITIES AND EXCHANGE COMMISSION
Washington, D.C. 20549
FORM 10-Q
x QUARTERLY REPORT PURSUANT TO SECTION 13 OR 15(d) OF
THE SECURITIES EXCHANGE ACT OF 1934
For the quarterly period ended March 31, 2007
OR
o TRANSITION REPORT PURSUANT TO SECTION 13 OR 15(d) OF THE SECURITIES EXCHANGE ACT OF 1934
For the Transition Period from _______ to _______
Commission File No. 0-25020
HERITAGE OAKS BANCORP
(Exact name of registrant as specified in charter)
STATE OF CALIFORNIA | 77-0388249 |
(State or other jurisdiction of incorporation or organization) | (I.R.S. Employer Identification No.) |
545 12th STREET, PASO ROBLES, CA 93446
(Address of principal office)
(805) 239-5200
(Registrant's telephone number, including area code)
Indicate by check mark whether the registrant (1) has filed all reports required to be filed by Section 13 or 15(d) of the Securities Exchange Act of 1934 during the preceding twelve (12) months (or for such shorter period that the registrant was required to file such reports), and (2) has been subject to such filing requirements for the past ninety (90) days.
YES x NO o
Indicate by check mark whether the registrant is a large accelerated filer, an accelerated filer or is a non-accelerated filer. See definition of “accelerated filer and large accelerated filer” in Rule 12b-2 of the Exchange Act (check one.)
Large Accelerated filer o Accelerated filer x Non-accelerated filer o
Indicate by check mark whether the registrant is a shell company (as defined in Rule 12b-2 of the Act).
Yes o No x
Indicate the number of shares outstanding of each of the issuer's classes of common stock, as of the latest practicable date:
As of March 31, 2007 there were approximately 6,410,829 shares outstanding of the Registrant’s common stock.
TABLE OF CONTENTS
| Part 1. Financial Information | 3 |
| | |
| Item 1. Consolidated Financial Statements (Un-audited) | 3 |
| | |
| Consolidated Balance Sheets | 4 |
| Consolidated Statements of Income | 5 |
| Consolidated Statements of Operations | |
| Consolidated Statement of Changes in Stockholders’ Equity | 6 |
| Consolidated Statements of Comprehensive Income | 7 |
| Consolidated Statements of Cash Flows | 8 |
| Notes to Consolidated Financial Statements | 9 |
| | |
| Item 2. Management’s Discussion and Analysis of | |
| Financial Condition and Results of Operations | 16 |
| | |
| Item 3. Quantitative and Qualitative Disclosure about Market Risk | 35 |
| | |
| Item 4. Controls and Procedures | 36 |
| | |
| Part 2. Other Information | |
| | |
| Item 1. Legal Proceedings | 37 |
| Item 1. A. Risk Factors | 37 |
| Item 2. Unregistered Sales of Equity Securities and Use of Proceeds | 37 |
| Item 3. Defaults Upon Senior Securities | 38 |
| Item 4. Submission of Matters to a Vote of Security Holders | 38 |
| Item 5. Other Information | 38 |
| Item 6. Exhibits | 38 |
| | |
| Signatures | 39 |
| | |
| Certifications | |
| | |
| Exhibits | |
PART 1. FINANCIAL INFORMATION
Item 1. Financial Statements
The financial statements and notes begin on next page.
HERITAGE OAKS BANCORP |
CONSOLIDATED BALANCE SHEETS |
(dollars amounts in thousands) |
| | | | | | |
| | March 31, | | December 31, | |
| | 2007 | | 2006 | |
| | | (Unaudited) | | (1) | |
ASSETS | | | | | |
| Cash and due from banks | | $ | 26,501 | | $ | 19,164 | |
| Federal funds sold | | | 8,620 | | | 3,870 | |
| Total cash and cash equivalents | | | 35,121 | | | 23,034 | |
| Interest bearing deposits with other banks | | | 318 | | | 318 | |
| Securities available for sale | | | 37,620 | | | 38,445 | |
| Federal Home Loan Bank Stock, at cost | | | 3,085 | | | 2,350 | |
| Loans Held For Sale | | | 5,300 | | | 1,764 | |
| Loans, net (2) | | | 460,303 | | | 439,277 | |
| Property, premises and equipment, net | | | 14,551 | | | 14,581 | |
| Cash surrender value of life insurance | | | 9,528 | | | 9,435 | |
| Deferred tax assets | | | 3,218 | | | 2,414 | |
| Goodwill | | | 4,864 | | | 4,865 | |
| Core deposit intangible | | | 1,059 | | | 1,148 | |
| Other assets | | | 3,967 | | | 4,143 | |
TOTAL ASSETS | | $ | 578,934 | | $ | 541,774 | |
| | | | | | | | |
LIABILITIES | | | | | | | |
| Deposits: | | | | | | | |
| Demand, non-interest bearing | | $ | 146,406 | | $ | 153,005 | |
| Savings, NOW, and money market deposits | | | 169,860 | | | 146,110 | |
| Time deposits of $100 or more | | | 33,269 | | | 30,630 | |
| Time deposits under $100 | | | 95,476 | | | 90,776 | |
| Total deposits | | | 445,011 | | | 420,521 | |
| FHLB advances and other borrowed money | | | 60,000 | | | 50,000 | |
| Securities sold under agreement to repurchase | | | 1,387 | | | 1,364 | |
| Junior subordinated debentures | | | 16,496 | | | 16,496 | |
| Other liabilities | | | 4,875 | | | 3,921 | |
| Total liabilities | | | 527,769 | | | 492,302 | |
| Commitments and contingencies | | | - | | | - | |
STOCKHOLDERS' EQUITY | | | | | | | |
| Common stock, no par value; | | | | | | | |
| 20,000,000 shares authorized; issued and outstanding | | | | | | | |
| 6,410,829 and 6,345,639 as of March 31, 2007 | | | | | | | |
| and December 31, 2006, respectively. | | | 29,802 | | | 29,247 | |
| Additional paid in capital | | | 428 | | | 336 | |
| Retained earnings | | | 20,809 | | | 19,809 | |
| Accumulated other comprehensive income | | | 126 | | | 80 | |
| Total stockholders' equity | | | 51,165 | | | 49,472 | |
TOTAL LIABILITIES & STOCKHOLDERS' EQUITY | | $ | 578,934 | | $ | 541,774 | |
| (1) These numbers have been derived from the audited financial statements. |
| |
| (2) Loans net of deferred fees of $1,598 and $1,625 and allowance for loan loss of $4,312 and $4,081 at March 31, 2007 and December 31, 2006, respectively |
| |
| See notes to condensed consolidated financial statements |
HERITAGE OAKS BANCORP |
CONSOLIDATED STATEMENTS OF INCOME (UNAUDITED) |
(dollar amounts in thousands except per share date) |
| | | For the three months | |
| | | ended March 31, | |
| | | 2007 | | 2006 | |
| Interest Income: | | | | | |
| | | | | | |
| Interest and fees on loans | | $ | 9,816 | | $ | 7,489 | |
| Investment securities | | | 448 | | | 489 | |
| Federal funds sold and commercial paper | | | 31 | | | 226 | |
| Time certificates of deposit | | | 8 | | | 2 | |
| Total interest income | | | 10,303 | | | 8,206 | |
| | | | | | | | |
| Interest Expense: | | | | | | | |
| | | | | | | | |
| Now accounts | | | 28 | | | 21 | |
| MMDA accounts | | | 667 | | | 571 | |
| Savings accounts | | | 24 | | | 28 | |
| Time deposits of $100 or more | | | 209 | | | 138 | |
| Other time deposits | | | 1,212 | | | 694 | |
| Other borrowed funds | | | 1,129 | | | 307 | |
| Total interest expense | | | 3,269 | | | 1,759 | |
| | | | | | | | |
| Net interest income before provision for possible loan losses | | | 7,034 | | | 6,447 | |
| Provision for loan losses | | | 140 | | | 120 | |
| Net interest income after provision for loan losses | | | 6,894 | | | 6,327 | |
| | | | | | | | |
| Non-Interest Income: | | | | | | | |
| Service charges on deposit accounts | | | 613 | | | 568 | |
| Other income | | | 618 | | | 650 | |
| Total non-interest income | | | 1,231 | | | 1,218 | |
| | | | | | | | |
| Non-Interest Expense: | | | | | | | |
| Salaries and employee benefits | | | 3,250 | | | 2,783 | |
| Occupancy and equipment | | | 715 | | | 622 | |
| Other expenses | | | 1,729 | | | 1,579 | |
| Total non-interest expenses | | | 5,694 | | | 4,984 | |
| Income before provision for income taxes | | | 2,431 | | | 2,561 | |
| Provision for applicable income taxes | | | 921 | | | 955 | |
| Net Income | | $ | 1,510 | | $ | 1,606 | |
| | | | | | | | |
| Earnings per share: | | | | | | | |
| Basic | | $ | 0.24 | | $ | 0.26 | |
| Fully Diluted | | $ | 0.23 | | $ | 0.24 | |
| See notes to condensed consolidated financial statements |
HERITAGE OAKS BANCORP |
CONSOLIDATED STATEMENTS OF STOCKHOLDERS' EQUITY (UNAUDITED) |
March 31, 2007 and March 31, 2006 |
(dollar amounts in thousands except shares outstanding) |
| | | Common Stock | | | | | | | | Accumulated | | | |
| | | Number of | | | | | | Comprehensive | | Retained | | | | | |
| | Shares | | Amount | | Capital | | Income | | Earnings | | Income | | Equity | |
Balance, December 31, 2006 | | | 6,345,639 | | | 29,247 | | | 336 | | | | | | 19,809 | | | 80 | | | 49,472 | |
| Exercise of stock options | | | | | | | | | | | | | | | | | | | | | | |
| (including $338 tax benefit from exercise of stock options) | | | 64,190 | | | 555 | | | | | | | | | | | | | | | 555 | |
| Cash dividend of $0.08 per share paid on February 16, 2007 | | | | | | | | | | | | | | | (510 | ) | | | | | (510 | ) |
| Share-based compensation expense | | | | | | | | | 92 | | | | | | | | | | | | 92 | |
| Issuance of restricted stock awards | | | 1,000 | | | | | | | | | | | | | | | | | | | |
| Stock repurchased | | | | | | | | | | | | | | | | | | | | | | |
| Comprehensive income: | | | | | | | | | | | | | | | | | | | | | | |
| Net income | | | | | | | | | | | | 1,510 | | | 1,510 | | | | | | 1,510 | |
| Unrealized security holding gains (net of $31 tax) | | | | | | | | | | | | | | | | | | 46 | | | 46 | |
| Total comprehensive income | | | | | | | | | | | $ | 1,510 | | | | | | | | | | |
Balance, March 31, 2007 | | | 6,410,829 | | | 29,802 | | | 428 | | | | | | 20,809 | | | 126 | | | 51,165 | |
| | | | | | | | | | | | | | | | | | | | | | | |
Balance, December 31, 2005 | | | 6,231,982 | | | 29,255 | | | - | | | | | | 15,748 | | | (158 | ) | | 44,845 | |
| Exercise of stock options | | | | | | | | | | | | | | | | | | | | | | |
| (including $95 tax benefit from exercise of stock options) | | | 32,741 | | | 192 | | | - | | | | | | | | | | | | 192 | |
| Share-based compensation expense | | | | | | 74 | | | - | | | | | | | | | | | | 74 | |
| Issuance of restricted stock awards | | | 65,800 | | | - | | | - | | | | | | | | | | | | - | |
| Comprehensive income: | | | | | | | | | | | | | | | | | | | | | | |
| Net income | | | | | | | | | | | | 1,606 | | | 1,606 | | | | | | 1,606 | |
| Unrealized security holding gains (net of $8 tax) | | | | | | | | | | | | 12 | | | | | | 12 | | | 12 | |
| Total comprehensive income | | | | | | | | | | | $ | 1,618 | | | | | | | | | | |
Balance, March 31, 2006 | | | 6,330,523 | | | 29,521 | | | - | | | | | | 17,354 | | | (146 | ) | | 46,729 | |
HERITAGE OAKS BANCORP |
CONSOLIDATED STATEMENTS OF COMPREHENSIVE INCOME (UNAUDITED) |
(dollar amounts in thousands) |
| | | For the three months |
| | | ended March 31, |
| | | 2007 | | 2006 | |
Net Income | | $ | 1,510 | | $ | 1,606 | |
Other Comprehensive Income Before Taxes: | | | | | | | |
| Unrealized gains on securities available for sale: | | | | | | | |
| Unrealized holding gains arising during period | | | 77 | | | 20 | |
| Other comprehensive income before taxes | | | 77 | | | 20 | |
| Income tax expense related to items in comprehensive income | | | (31 | ) | | (8 | ) |
Other Comprehensive Income Net of Taxes | | | 46 | | | 12 | |
Comprehensive Income | | $ | 1,556 | | $ | 1,618 | |
| See notes to condensed consolidated financial statements |
HERITAGE OAKS BANCORP |
CONSOLIDATED STATEMENTS OF CASHFLOWS (UNAUDITED) |
(dollar amounts in thousands) |
| | | For the three month |
| | | periods ended March 31, |
| | | 2007 | | 2006 | |
Cash flows from operating activities: | | | | | |
| Net income | | | 1,510 | | | 1,606 | |
| Adjustments to reconcile net income to net cash provided by operating activities: | | | | | | | |
| Depreciation and amortization | | | 265 | | | 207 | |
| Provision for possible loan losses | | | 140 | | | 120 | |
| Amortization of premiums/discounts on investment securities, net | | | (21 | ) | | 2 | |
| FHLB stock dividends received | | | (30 | ) | | (22 | ) |
| Amortization of intangible assets | | | 89 | | | 75 | |
| Share-based compensation expense | | | 92 | | | 74 | |
| (Increase)/decrease in loans held for sale | | | (3,536 | ) | | 398 | |
| Net (increase) in cash surrender value of life insurance | | | (93 | ) | | (71 | ) |
| (Increase) in deferred tax asset | | | (835 | ) | | - | |
| (Increase)/decrease in other assets | | | 175 | | | 143 | |
| Excess tax benefit related to share-based compensation expense | | | (338 | ) | | (95 | ) |
| Increase in other liabilities | | | 1,292 | | | 132 | |
NET CASH (USED IN) / PROVIDED BY OPERATING ACTIVITIES | | | (1,290 | ) | | 2,569 | |
Cash flows from investing activities: | | | | | | | |
| Net Change in time deposits | | | - | | | (20 | ) |
| Purchase of available-for-sale securities | | | - | | | (1,190 | ) |
| Proceeds from principal reductions and maturities | | | | | | | |
| of available-for-sale mortgage backed securities | | | 923 | | | 1,765 | |
| Purchase of FHLB stock | | | (705 | ) | | - | |
| Increase in loans, net | | | (21,257 | ) | | (10,674 | ) |
| Allowance for loan and lease loss recoveries | | | 92 | | | - | |
| Purchase of property, premises and equipment, net | | | (235 | ) | | (1,357 | ) |
NET CASH USED IN INVESTING ACTIVITIES | | | (21,182 | ) | | (11,476 | ) |
Cash flows from financing activities: | | | | | | | |
| Increase in deposits, net | | | 24,491 | | | 3,922 | |
| Increase in FHLB borrowing | | | 10,000 | | | - | |
| Increase/(decrease) in repurchase agreements | | | 23 | | | (1,893 | ) |
| Excess tax benefit related to share-based compensation expense | | | 338 | | | 95 | |
| Proceeds from exercise of stock options | | | 217 | | | 97 | |
| Cash dividend paid | | | (510 | ) | | - | |
NET CASH PROVIDED BY FINANCING ACTIVITIES | | | 34,559 | | | 2,221 | |
Net increase/(decrease) in cash and cash equivalents | | | 12,087 | | | (6,686 | ) |
Cash and cash equivalents, beginning of period | | | 23,034 | | | 44,559 | |
Cash and cash equivalents, end of period | | | 35,121 | | | 37,873 | |
Supplemental Disclosures of Cash Flow Information | | | | | | | |
| Interest paid | | $ | 3,126 | | $ | 1,715 | |
| Income taxes paid | | $ | - | | $ | - | |
| See notes to condensed consolidated financial statements |
HERITAGE OAKS BANCORP
NOTES TO CONSOLIDATED FINANCIAL STATEMENTS (UNAUDITED)
MARCH 31, 2007
Note 1. CONSOLIDATED FINANCIAL STATEMENTS
The accompanying un-audited condensed consolidated financial statements of Heritage Oaks Bancorp and subsidiaries (the “Company”) have been prepared in accordance with the instructions to Form 10-Q and Article 10 of Regulation S-X. Accordingly, certain information and notes required by accounting principles generally accepted in the United States of America for annual financial statements are not included herein. In the opinion of Management, all adjustments (which consist solely of normal recurring accruals) considered necessary for a fair presentation of results for the interim periods presented have been included. These interim condensed consolidated financial statements should be read in conjunction with the financial statements and related notes contained in the Company’s 2006 Annual Report on Form 10-K.
The condensed consolidated financial statements include the accounts of the Company and its wholly-owned financial subsidiary, Heritage Oaks Bank (the “Bank”). All significant inter-company balances and transactions have been eliminated. Heritage Oaks Capital Trust I and Heritage Oaks Capital Trust II are unconsolidated subsidiaries formed solely for the purpose of issuing trust preferred securities. Operating results for the three months ended March 31, 2007 are not necessarily indicative of the results that may be expected for the year ending December 31, 2007. Certain amounts in the consolidated financial statements for the year ended December 31, 2006 and the three month period ended March 31, 2006 may have been reclassified to conform to the presentation of the consolidated financial statements in 2007.
The preparation of consolidated financial statements in conformity with the accounting principles generally accepted in the United States of America requires Management to make estimates and assumptions. These estimates and assumptions affect the reported amounts of assets and liabilities at the date of the consolidated financial statements and the reported amounts of revenues and expenses during the reporting period. Actual results could differ from these estimates.
Note 2. INVESTMENT SECURITIES
In accordance with Statement of Financial Accounting Standards (SFAS) No. 115 “Accounting for Certain Investments in Debt and Equity Securities”, which addresses the accounting for investments in equity securities that have readily determinable fair values and for investments in all debt securities, securities are classified in three categories and accounted for as follows: debt and equity securities that the Company has the positive intent and ability to hold to maturity are classified as held-to-maturity and are measured at amortized cost; debt and equity securities bought and held principally for the purpose of selling in the near term are classified as trading securities and are measured at fair value, with the unrealized gains and losses included in earnings; debt and equity securities not classified as either held-to-maturity or trading securities are deemed as available-for-sale and are measured at fair value, with the unrealized gains and losses, net of applicable taxes, reported in a separate component of stockholders’ equity. Any gains and losses on sales of investments are computed on a specific identification basis.
The following table sets forth the amortized cost and fair values of investment securities available for sale at March 31, 2007 and December 31, 2006:
(dollars in thousands) | | | | Gross | | Gross | | | |
| | | Amortized | | Unrealized | | Unrealized | | Fair | |
As of March 31, 2007 | | Cost | | Gains | | Losses | | Value | |
| | | | | | | | | | |
| Obligations of U.S. government agencies and corporations | | $ | 198 | | $ | - | | $ | (3 | ) | $ | 195 | |
| Mortgage-backed securities | | | 21,028 | | | 15 | | | (301 | ) | | 20,742 | |
| Obligations of state and political subdivisions | | | 16,175 | | | 535 | | | (36 | ) | | 16,674 | |
| Other Securities | | | 9 | | | - | | | - | | | 9 | |
| Total | | $ | 37,410 | | $ | 550 | | $ | (340 | ) | $ | 37,620 | |
| | | | | | Gross | | | Gross | | | | |
| | | Amortized | | | Unrealized | | | Unrealized | | | Fair | |
As of December 31, 2006 | | | Cost | | | Gains | | | Losses | | | Value | |
| | | | | | | | | | | | | | |
| Obligations of U.S. government agencies and corporations | | $ | 205 | | $ | - | | $ | (4 | ) | $ | 201 | |
| Mortgage-backed securities | | | 21,959 | | | 16 | | | (381 | ) | | 21,594 | |
| Obligations of state and political subdivisions | | | 16,139 | | | 540 | | | (38 | ) | | 16,641 | |
| Other securities | | | 9 | | | - | | | - | | | 9 | |
| Total | | $ | 38,312 | | $ | 556 | | $ | (423 | ) | $ | 38,445 | |
Note 3. LOANS AND ALLOWANCE FOR LOAN LOSSES
| | | March 31, | | December 31, | |
(dollars in thousands) | | 2007 | | 2006 | |
| Commercial, financial, and agricultural | | $ | 91,476 | | $ | 84,976 | |
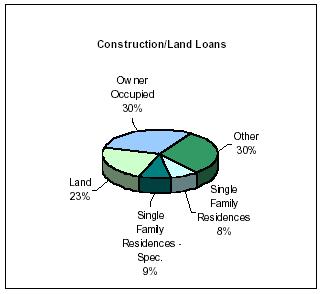
| Real estate-construction/land | | | 106,542 | | | 105,712 | |
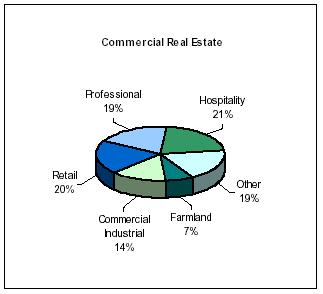
| Real estate - other | | | 252,080 | | | 237,401 | |
| Home equity lines of credit | | | 9,617 | | | 10,792 | |
| Installment loans to individuals | | | 5,705 | | | 5,598 | |
| All other loans (including overdrafts) | | | 793 | | | 504 | |
| Total loans, gross | | | 466,213 | | | 444,983 | |
| | | | | | | | |
| Less - deferred loan fees, net | | | (1,598 | ) | | (1,625 | ) |
| Less - reserve for possible loan losses | | | (4,312 | ) | | (4,081 | ) |
| | | | | | | | |
| Total loans, net | | $ | 460,303 | | $ | 439,277 | |
| | | | | | | | |
| Loans held for sale | | $ | 5,300 | | $ | 1,764 | |
Concentration of Credit Risk
At March 31, 2007, approximately $368.2 million of the Bank’s loan portfolio was collateralized by various forms of real estate. Such loans are generally made to borrowers located in San Luis Obispo and Santa Barbara Counties. The Bank attempts to reduce its concentration of credit risk by making loans which are diversified by project type. While Management believes that the collateral presently securing this portfolio is adequate, there can be no assurances that significant deterioration in the California real estate market would not expose the Bank to significantly greater credit risk.
At March 31, 2007, the Bank was contingently liable for letters of credit accommodations made to its customers totaling approximately $16.5 million and un-disbursed loan commitments in the approximate amount of $170 million. The Bank makes commitments to extend credit in the normal course of business to meet the financing needs of its customers. Commitments to extend credit are agreements to lend to a customer as long as there is no violation of any condition established in the contract. Commitments generally have fixed expiration dates or other termination clauses and may require payment of a fee. Since many of the commitments are expected to expire without being drawn upon, the total outstanding commitment amount does not necessarily represent future cash requirements. Standby letters of credit written are conditional commitments issued by the Bank to guarantee the performance of a customer to a third party. The credit risk involved in issuing letters of credit is essentially the same as those involved in extending loan facilities to customers.
Allowance for Loan Losses
An allowance for loan losses has been established by management to provide for those loans that may not be repaid in their entirety for a variety of reasons. The allowance is maintained at a level considered by management to be adequate to provide for probable incurred losses. The allowance is increased by provisions charged to earnings and is reduced by charge-offs, net of recoveries. The provision for loan losses is based upon past loan loss experience and management’s evaluation of the loan portfolio under current economic conditions. Loans are charged to the allowance for loan losses when, and to the extent, they are deemed by management to be un-collectible. The allowance for loan losses is composed of allocations for specific loans and a historical portion for all other loans.
An analysis of the changes in the reserve for possible loan losses for the periods indicated below is as follows:
| | | For the three months ended | | For the year ended | |
(dollars in thousands) | | March 31, 2007 | | March 31, 2006 | | December 31, 2006 | |
| | | | | | | | |
| Balance at beginning of period | | $ | 4,081 | | $ | 3,881 | | $ | 3,881 | |
| Additions charged to operating expense | | | 140 | | | 120 | | | 600 | |
| Loans charged off | | | (1 | ) | | - | | | (561 | ) |
| Recoveries of loans previously charged off | | | 92 | | | 4 | | | 161 | |
| Balance at end of period | | $ | 4,312 | | $ | 4,005 | | $ | 4,081 | |
The Bank recognizes that credit losses will be experienced and the risk of loss will vary with, among other things, general economic conditions; the type of loan being made; the creditworthiness of the borrower over the term of the loan and in the case of a collateralized loan, the quality of the collateral for such loan. The allowance for loan loss represents the Bank’s estimate of the allowance necessary to provide for probable incurred losses in the portfolio. In making this determination, the Bank analyzes the ultimate ability to collect the loans in its portfolio by incorporating feedback provided by internal loan staff, an independent loan review function, and information provided by examinations performed by regulatory agencies. The Bank makes monthly evaluations as to the adequacy of the allowance for loan losses.
The analysis of the allowance for loan losses is comprised of three components: specific credit allocation; general portfolio allocation; and subjectively by determined allocation. Effective January 1, 1995, the Bank adopted SFAS No.114, “Accounting by Creditors for Impairment of a Loan” (SFAS No. 114), as amended by SFAS No. 118, “Accounting by Creditors for Impairment of a Loan - Income Recognition and Disclosures.” These pronouncements provide that when it is probable that a creditor will be unable to collect all amounts due in accordance with the terms of the loan that such loan is deemed impaired. Impaired loans are accounted for differently in that the amount of the impairment is measured and reflected in the records of the creditor. The allowance for loan losses related to loans that are identified for evaluation in accordance with Statement No. 114 is based on discounted cash flows using the loan’s initial effective interest rate or the fair value of the collateral for certain collateral dependent loans. The general portfolio allocation consists of an assigned reserve percentage based on the credit rating of the loan. The subjective portion is determined based on loan history and the Bank’s evaluation of various factors including current economic conditions and trends in the portfolio including delinquencies and impairment, as well as changes in the composition of the portfolio.
The allowance for loan losses is based on estimates, and ultimate losses may 0vary from current estimates. These estimates are reviewed monthly, and as adjustments, either positive or negative, become necessary, a corresponding increase or decrease is made in the provision for loan losses. The methodology used to determine the adequacy of the allowance for possible loan losses for the three months ended March 31, 2007 is consistent with prior periods.
The allowance for loan losses as a percentage of total net loans was 0.94% as of March 31, 2007 and 0.93% as of December 31, 2006. Management believes that the allowance for loan losses at March 31, 2007 is prudent and warranted, based on information currently available.
Note 4. EARNINGS PER SHARE
Basic earnings per share are based on the weighted average number of shares outstanding before any dilution from common stock equivalents. Diluted earnings per share reflects the potential dilution that could occur if securities or other contracts to issue common stock were exercised or converted into common stock or resulted in the issuance of common stock that then share in the earnings of the entity.
The following table shows the number of shares used to calculate earnings per share for the three months ending
March 31, 2007:
| | | For the three months ending | |
| | | March 31, | |
| | | 2007 | | 2006 | |
| Net Income | | $ | 1,510,333 | | $ | 1,606,256 | |
| Basic | | $ | 0.24 | | $ | 0.26 | |
| Diluted | | $ | 0.23 | | $ | 0.24 | |
| Shares: | | | | | | | |
| Basic | | | 6,384,150 | | | 6,283,890 | |
| Diluted | | | 6,605,942 | | | 6,643,432 | |
Note 5. RECENT ACCOUNTING PRONOUNCEMENTS
ACCOUNTING FOR UNCERTAINTY IN INCOME TAXES: In July 2006, the Financial Accounting Standards Board (FASB) issued FASB Interpretation No. 48, ”Accounting for Uncertainty in Income Taxes - an interpretation of FASB Statement No. 109” (FIN 48) which clarifies the accounting and disclosure for uncertainty in tax positions, as defined. FIN 48 seeks to reduce the diversity in practice associated with certain aspects of the recognition and measurement related to accounting for income taxes. This interpretation is effective for fiscal years beginning after December 15, 2006. The Company adopted FIN 48 on January 1, 2007 and as part of the analysis of the impact of FIN 48 the company’s Chief Financial Officer and tax accounting firm engaged in discussions surrounding a potential disclosure issue related to FASB Interpretation No. 48, Accounting for Uncertainty in Income Taxes—an interpretation of FASB Statement No. 109 (FIN 48). It was concluded that a previous position taken on the Company’s 2004 and 2005 tax returns in regard to deferred loan fees can not be supported and that amended returns will be filed for those periods. For income tax purposes, both Federal and Franchise, this is a “timing” issue and does not flow through the Income Statement. The Balance Sheet is impacted to the extent that current taxes payable is increased and offset by a deferred tax asset in the same amount.
ACCOUNTING FOR CERTAIN HYBRID FINANCIAL INSTRUMENTS: In February 2006, the FASB issued SFAS No. 155, "Accounting for Certain Hybrid Financial Instruments - an amendment of FASB Statements No. 133 and 140." SFAS No. 155 simplifies accounting for certain hybrid instruments currently governed by SFAS No. 133, "Accounting for Derivative Instruments and Hedging Activities," by allowing fair value re-measurement of hybrid instruments that contain an embedded derivative that otherwise would require bifurcation. SFAS No. 155 also eliminates the guidance in SFAS No.133 Implementation Issue No. D1, "Application of Statement 133 to Beneficial Interests in Securitized Financial Assets," which provides such beneficial interests are not subject to SFAS No.133. SFAS No. 155 amends SFAS No. 140, "Accounting for Transfers and Servicing of Financial Assets and Extinguishments of Liabilities - a Replacement of FASB Statement No. 125," by eliminating the restriction on passive derivative instruments that a qualifying special-purpose entity may hold. This statement is effective for financial instruments acquired or issued after the beginning of the Company’s fiscal year 2007. The adoption of this statement has not had a material impact on the Company’s financial condition, results of operations and cash flows.
ACCOUNTING FOR SERVICING OF FINANCIAL ASSETS: In March 2006, the Financial Accounting Standards Board (FASB) issued SFAS No. 156, "Accounting for Servicing of Financial Assets - an amendment of FASB Statement No. 140." SFAS No.156 requires an entity to recognize a servicing asset or servicing liability each time it undertakes an obligation to service a financial asset by entering into a servicing contract in specific situations. Additionally, the servicing asset or servicing liability shall be initially measured at fair value; however, an entity may elect the "amortization method" or "fair value method" for subsequent balance sheet reporting periods. SFAS No.156 is effective as of an entity's first fiscal year beginning after September 15, 2006. The adoption of this statement has not had a material impact on the Company’s statement of condition, results of operations and cash flows.
FAIR VALUE MEASUREMENTS: In September 2006, the FASB issued Statement of Financial Accounting Standards No. 157, Fair Value Measurements (SFAS No. 157). SFAS No. 157 enhances existing guidance for measuring assets and liabilities using fair value. Prior to the issuance of SFAS 157, guidance for applying fair value was incorporated in several accounting pronouncements. SFAS No. 157 provides a single definition of fair value, together with a framework for measuring it, and requires additional disclosure about the use of fair value to measure assets and liabilities. SFAS No. 157 also emphasizes that fair value is a market-based measurement, not an entity-specific measurement, and sets out a fair value hierarchy with the highest priority being quoted prices in active markets. Under SFAS No. 157, fair value measurements are disclosed by level within that hierarchy. While SFAS No. 157 does not add any new fair value measurements, it does change current practice. Changes to practice include: (1) a requirement for an entity to include its own credit standing in the measurement of its liabilities; (2) a modification of the transaction price presumption; (3) a prohibition on the use of block discounts when valuing large blocks of securities for broker-dealers and investment companies; and (4) a requirement to adjust the value of restricted stock for the effect of the restriction even if the restriction lapses within one year. SFAS No. 157 is effective for financial statements issued for fiscal years beginning after November 15, 2007, and interim periods within those fiscal years. The Company has not determined the impact of adopting SFAS No. 157 on its financial statements.
EMPLOYERS’ ACCOUNTING FOR DEFINED BENEFIT PENSION AND OTHER POSTRETIREMENT PLANS: In September 2006, the FASB issued Statement of Financial Accounting Standards No. 158, Employers’ Accounting for Defined Benefit Pension and Other Postretirement Plans (an amendment of FASB Statements No. 87, 88, 106, and 132R) (SFAS No. 158), requires an employer to: (a) Recognize in its statement of financial position an asset for a plan’s over funded status or a liability for a plan’s under funded status; (b) measure a plan’s assets and its obligations that determine its funded status as of the end of the employer’s fiscal year (with limited exceptions); and (c) recognize changes in the funded status of a defined benefit postretirement plan in the year in which the changes occur. Those changes will be reported in comprehensive income of a business entity and in changes in net assets of a not-for-profit organization. The requirement by SFAS No. 158 to recognize the funded status of a benefit plan and the disclosure requirements of SFAS No. 158 are effective as of the end of the fiscal year ending after December 15, 2006 for entities with publicly traded equity securities. The requirement to measure plan assets and benefit obligations as of the date of the employer’s fiscal year-end statement of financial position is effective for fiscal years ending after December 15, 2008. The Company does not expect the adoption of SFAS No. 158 to have a material effect on the financial position of the company at March 31, 2007.
ESTABLISHING THE FAIR VALUE OPTION FOR FINANCIAL ASSETS AND LIABILITIES: In February of 2007, the FASB Issued SFAS No. 159, Establishing the Fair Value Option for Financial Assets and Liabilities. The Financial Accounting Standards Board has issued SFAS 159 to permit all entities to choose to elect, at specified election dates, to measure eligible financial instruments at fair value. An entity shall report unrealized gains and losses on items for which the fair value option has been elected in earnings at each subsequent reporting date, and recognize upfront costs and fees related to those items in earnings as incurred and not deferred. SFAS No. 159 applies to fiscal years beginning after November 15, 2007, with early adoption permitted for an entity that has also elected to apply the provisions of SFAS No. 157, Fair Value Measurements. An entity is prohibited from retrospectively applying SFAS No. 159, unless it chooses early adoption. SFAS No. 159 also applies to eligible items existing at November 15, 2007 (or early adoption date). The Company does not expect to adopt SFAS No. 159 prior to the required period and does not anticipate that the adoption of SFAS 159 will have a material effect on the Company's financial condition.
Note 6. SHARE-BASED COMPENSATION
As of March 31, 2007, the Company had three share-based employee compensation plans, which are more fully described in Note 14 of the Consolidated Financial Statements in the Company's Annual Report on Form 10-K for the year ended December 31, 2006. These plans include two stock option plans and the 2005 Equity Based Compensation Plan.
Effective January 1, 2006, the Company adopted the fair value recognition provisions of SFAS No. 123(R), using the modified prospective transition method and, therefore, have not restated results for prior periods.
Prior to January 1, 2006, the Company accounted for share-based compensation under the recognition, measurement and pro forma disclosure provisions of APB No. 25, the original provisions of SFAS No. 123, and SFAS No. 148, "Accounting for Stock-Based Compensation-Transition and Disclosure" (SFAS No. 148). No share-based compensation expense was reflected in net income as all options are required by the plan to be granted with an exercise price equal to the estimated fair value of the underlying common stock on the date of grant.
Share-based compensation expense for all share-based compensation awards granted after January 1, 2006, is based on the grant-date fair value. For all awards except stock option awards, the grant date fair value is either the fair market value per share or book value per share (corresponding to the type of stock awarded) as of the grant date. For stock option awards, the grant date fair value is estimated using the Black-Scholes option pricing model. For all awards the Company recognizes these compensation costs only for those shares expected to vest on a straight-line basis over the requisite service period of the award, for which we use the related vesting term. The Company estimates forfeiture rates based on historical employee option exercise and employee termination experience.
As a result of the Company’s January 1, 2006 adoption of SFAS No.123(R), the impact to the Consolidated Financial Statements on income before income taxes and on net income related to stock options expense were reductions of $28 thousand and $17 thousand, respectively for the three months ended March 31, 2007. The change had no significant impact on basic or diluted earnings per share for the three months ended March 31, 2007. During the same period last year, the Company reported reductions of $74 thousand in income before income taxes and $47 thousand in net income related to the expensing of stock options. There was no impact on basic earnings per share and a $0.01 impact on diluted earnings per share for the period ended March 31, 2006. Additionally, prior to the adoption of SFAS No. 123(R), the Company presented the tax benefit of stock option exercises as operating cash flows, upon the adoption of SFAS No. 123(R), tax benefits resulting from tax deductions in excess of the compensation cost recognized for those options are classified as financing cash flows.
The share-based compensation expense related to stock options recognized in the condensed consolidated statement of operations for the three months ended March 31, 2007 and 2006 is based on awards ultimately expected to vest, and accordingly has been adjusted by the amount of estimated forfeitures. SFAS No. 123(R) requires forfeitures to be estimated at the time of grant and revised, if necessary, in subsequent periods if actual forfeitures differ from those estimates. Forfeitures were estimated based partially on historical experience.
The aggregate intrinsic value in the table below represents the total pretax intrinsic value for options outstanding and options exercisable as of March 31, 2007 and 2006 respectively. Intrinsic value is calculated by taking the difference between the Company’s closing stock price on the last trading day for the first quarters of 2007 and 2006 and the exercise price, multiplied by the number of in-the-money options that would have been received by the option holders had all option holders exercised their options on March 31, 2007 and 2006 respectively.
| | | | | | | Average | | | |
| | | | | Weighted | | Remaining | | Total | |
| | | | Average | | Contractual | | Intrinsic | |
| | Number of | | Exercise | | Term | | Value | |
| | Shares | | Price | | (in years) | | (in 000's) | |
| Options outstanding, January 1, 2007 | | | 433,432 | | $ | 5.45 | | | | | | | |
| Granted | | | - | | | - | | | | | | | |
| Exercised | | | (64,190 | ) | | 3.39 | | | | | | | |
| Forfeited | | | (995 | ) | | 10.78 | | | | | | | |
| | | | | | | | | | | | | | |
| Options outstanding, March 31, 2007 | | | 368,247 | | $ | 5.79 | | | 3.78 | | $ | 4,439 | |
| | | | | | | | | | | | | | |
| Exercisable at March 31, 2007 | | | 318,222 | | $ | 5.00 | | | 3.27 | | $ | 4,088 | |
| | | | | | | | | | | | | | |
| Options outstanding, January 1, 2006 | | | 525,692 | | $ | 5.19 | | | | | | | |
| Granted | | | - | | | - | | | | | | | |
| Exercised | | | (32,742 | ) | | 2.97 | | | | | | | |
| Forfeited | | | - | | | - | | | | | | | |
| | | | | | | | | | | | | | |
| Options outstanding, March 31, 2006 | | | 492,950 | | $ | 5.33 | | | 4.40 | | $ | 6,983 | |
| | | | | | | | | | | | | | |
| Exercisable at March 31, 2006 | | | 415,616 | | $ | 4.37 | | | 3.70 | | $ | 6,281 | |
The aggregate pretax intrinsic value is subject to change based on the fair market value of the Company's stock. The total intrinsic value of options exercised for the three months ended March 31, 2007 and 2006 was $821 thousand and $520 thousand respectively. The total fair value of options vested and expensed, net of tax, for the first quarter of 2007 and 2006 was $17 thousand and $47 thousand respectively. No options were granted during the three months ended March 31, 2007 or in the entirety of 2006.
The total unrecognized compensation cost related to non-vested stock options as of March 31, 2007 and 2006, was $198,776 and $552,804 respectively. The total remaining cost as of March 31, 2007 is expected to be recognized over a weighted-average period of 1.25 years.
The Company grants restricted share awards periodically for the benefit of employees. These restricted shares generally “cliff vest” after five years of issuance. Recipients of restricted shares have the right to vote all shares subject to such grant, and receive all dividends with respect to such shares, whether or not the shares have vested. Recipients do not pay any cash consideration for the shares. The Company records compensation expense relating to restricted share awards. For the three and months ended March 31, 2007 and 2006 the Company recorded compensation expense, net of tax, of $37 thousand and $25 thousand respectively The total unrecognized compensation cost related to restricted stock awards as of March 31, 2007 and 2006, was $984,940 and $1,225,815 respectively. The majority of remaining compensation cost related to restricted stock awards at March 31, 2007 is expected to be recognized over the next 3.75 years.
Note 7. RECLASSIFICATIONS
Certain amounts in the 2006 financial statements have been reclassified to conform to the 2007 presentation.
Forward Looking Statements
Certain statements contained in this Quarterly Report on Form 10-Q (“Quarterly Report”), including, without limitation, statements containing the words “believes”, “anticipates”, “intends”, “expects”, and words of similar impact, constitute “forward-looking statements” within the meaning of Section 27A of the Securities Act of 1933 and Section 21E of the Securities and Exchange Act of 1934. Such forward-looking statements involve known and unknown risks, uncertainties and other factors that may cause the actual results, performance or achievements of the Company to be materially different from any future results, performance or achievements expressed or implied by such forward-looking statements. Such factors include, among others, the following: general economic and business conditions in those areas in which the Company operates, demographic changes, competition, fluctuations in interest rates, changes in business strategy or development plans, changes in governmental regulation, credit quality, the availability of capital to fund the expansion of the Company’s business, as well as economic, political and global changes arising from the war on terrorism. (Refer to the Company’s December 31, 2006 10-K, ITEM 1A. Risk Factors.) The Company disclaims any obligation to update any such factors or to publicly announce the results of any revisions to any of the forward-looking statements contained herein to reflect future events or developments.
ITEM 2. MANAGEMENT’S DISCUSSION AND ANALYSIS OF FINANCIAL CONDITION AND RESULTS OF OPERATIONS
The following is an analysis of the results of operations and financial condition of the Company for the periods ending March 31, 2007 and 2006. The analysis should be read in connection with the consolidated financial statements and notes thereto appearing elsewhere in this report.
THE COMPANY
Heritage Oaks Bancorp (the "Company") is a California corporation organized in 1994 to act as a holding company of Heritage Oaks Bank ("Bank"), a 12 branch bank serving San Luis Obispo and northern Santa Barbara Counties. In 1994, the Company acquired all of the outstanding common stock of the Bank in a holding company formation transaction.
In April 2002, the Company formed Heritage Oaks Capital Trust I (the “Trust”). The Trust is a statutory business trust formed under the laws of the State of Delaware. The Trust is a wholly-owned, non-financial, non-consolidated subsidiary of the Company.
On April 23, 2007 the Company redeemed all of the Floating Rate Junior Subordinated Debt Securities it held associated with Heritage Oaks Capital Trust I. Heritage Oaks Capital Trust I was formed for the sole purpose of issuing junior subordinated debt securities. As a result of the redemption of all the junior subordinated debt securities the Company held associated with Heritage Oaks Capital Trust I, the trust is tentatively scheduled to be dissolved within the second quarter of 2007.
In October 2006, the Company formed Heritage Oaks Capital Trust II (the “Trust”). The Trust is a statutory business trust formed under the laws of the State of Delaware. The Trust is a wholly-owned, non-financial, non-consolidated subsidiary of the Company.
Other than holding the shares of the Bank, the Company conducts no significant activities, although it is authorized, with the prior approval of the Board of Governors of the Federal Reserve System (the "Federal Reserve Board"), the Company's principal regulator, to engage in a variety of activities which are deemed closely related to the business of banking. The Company has also caused to be incorporated a subsidiary, CCMS Systems, Inc. which is currently inactive and has not been capitalized. The Company has no present plans to activate the proposed subsidiary.
Where You Can Find More Information
Under the Securities Exchange Act of 1934 Sections 13 and 15(d), periodic and current reports must be filed with the SEC. The Company electronically files the following reports with the SEC: Form 10-K (Annual Report), Form 10-Q (Quarterly Report), Form 8-K (Current Report), and Form DEF 14A (Proxy Statement). The Company may file additional forms. The SEC maintains an Internet site, www.sec.gov, in which all forms filed electronically may be accessed. Additionally, all forms filed with the SEC and additional shareholder information is available free of charge on the Company’s website: www.heritageoaksbancorp.com
The Company posts these reports to its website as soon as reasonably practicable after filing them with the SEC. None of the information on or hyperlinked from the Company’s website is incorporated into this Quarterly Report on Form 10-Q.
EXECUTIVE SUMMARY AND RECENT DEVELOPMENTS
Earnings and Financial Condition Overview
For the three months ended March 31, 2007, the Company earned $1.5 million or $0.23 per diluted share. This, when compared to the $1.6 million or $0.24 per diluted share the Company earned in the year ago period, represents an approximate 6.0% decline. The decline in earnings is primarily attributable to higher interest and non-interest expenses. Interest income for the three months ended March 31, 2007 rose 25.6% to $10.3 million over the same period last year. The increase is mainly due to the continued strength the company has seen in its loan portfolio, with the balance of total gross loans increasing by $87.5 million or 23.1% over the year ago period. As mentioned, the increase in interest income was slightly offset by an increase in interest expense of approximately $1.5 million or 85.8% over the year ago period. This has been the result of increased competition in our local markets to attract lower cost core deposits in addition to some customers moving deposit balances from lower interest bearing accounts to higher interest bearing accounts. Year-to-date, non-interest expense increased to $5.7 million, compared to $5.0 million in the same period a year ago. At the end of 2005 the Company began a branding initiative which included an extensive assessment, both internally and externally of all bank delivery channels. Recommended actions were incorporated into a comprehensive Marketing Strategic Plan which is currently in process of implementation. The increase in non-interest expense has been primarily the result of expenses related to the branding project, the addition of staff including the EVP / Human Resources and EVP/ Product Delivery and full service branch expansion within the bank’s existing footprint in the town of Templeton. The Company has invested significant resources in these new initiatives throughout 2006 in an effort to improve our service delivery and image and expect to continue the investment in 2007 with the expectation of returns on these investments adding to shareholder value.
As a result of the increase in operating expenses, the efficiency ratio was 68.89% for the first quarter of 2007 compared to 65.02% for the same period in 2006. On a linked quarter basis, the efficiency ratio was 67.10% and 65.31%for the fourth and third quarters of 2006, respectively. The efficiency ratio measures non-interest expenses as a percent of revenues. Although the company’s efficiency ratio has risen over the last three periods, we believe the significant investments the Company has mentioned above are necessary to position the company for future growth.
As of March 31, 2007, total assets were $578.9 million. This represents a 6.9% increase over the prior period ended December 31, 2006. The growth in assets is mainly due to the strength in the loan portfolio, with net loans increasing $21.0 million or 4.8% during the first quarter. Growth in the loan portfolio is attributable to the balance of commercial real estate loans increasing by $14.7 million or 6.2% during the first three months of 2007. Asset quality also remained strong with non-performing loans representing only 0.03% of total loans at March 31, 2007. The company’s limited exposure to mortgage lending has helped to isolate us from some of the recent problems experienced within that segment of the market. Total deposits also increased by $24.5 million or 5.8% over the prior period ended December 31, 2006. The growth in deposit balances is mainly due to a $17.2 million or 22.2% increase in money market accounts associated with current promotions the Company rolled out during the first quarter to attract lower cost core deposits. We believe these promotions will continue to help the Company obtain lower cost sources of funding as we move through the remainder of 2007.
Recent Developments
On April 23, 2007 the Company redeemed all of the Floating Rate Junior Subordinated Debt Securities it held associated with Heritage Oaks Capital Trust I, a wholly-owned subsidiary of Heritage Oaks Bancorp. The redemption price was 100% of the principal amount redeemed plus any accrued and unpaid interest as of the Redemption Date. The Company paid $379,011 for the standard interest payment due April 22, 2007, plus a payment of $8,248,000 for the principal amount that was redeemed. These amounts were funded from the Company’s general corporate reserves. Heritage Oaks Capital Trust I was formed for the sole purpose of issuing junior subordinated debt securities. As a result of the redemption of all the junior subordinated debt securities the Company held associated with Heritage Oaks Capital Trust I, the trust is tentatively scheduled to be dissolved within the second quarter of 2007.
On April 20, 2007 the Board of Directors declared a quarterly cash dividend of $0.08 per share to be paid on May 18, 2007 to shareholders of record on May 4, 2007.
On April 19, 2007, The Bank’s Board of Directors gave the approval for management to pursue the sale and lease-back of four of the bank’s properties to an unaffiliated party. The bank has agreed to the initial terms to sell the four properties and to subsequently lease them from the unaffiliated party. The initial terms related to this transaction provide for a forty-five (45) day due diligence period in which the unaffiliated party will perform a thorough review of all the terms associated with this transaction. Pending the due diligence period and approval of all terms and conditions by both parties, the transaction is tentatively scheduled to close in June of 2007.The Bank has pursued this transaction in an effort to convert non-earning assets to earning assets, while retaining the use of these properties.
On January 23, 2007, the Board of Directors declared a quarterly cash dividend of $0.08 per share to be paid on February 17, 2007 to shareholders of record on February 2, 2007.
Selected Financial Data
The table below provides selected financial data that highlights the Company’s quarterly performance results:
(dollars in thousands except share data) | | | |
| | | For the quarters ended | |
| | | 03/31/07 | | 12/31/06 | | 09/30/06 | | 06/30/06 | | 03/31/06 | | 12/31/05 | | 09/30/05 | | 06/30/05 | |
| Return on average assets | | | 1.10 | % | | 1.24 | % | | 1.35 | % | | 1.37 | % | | 1.33 | % | | 1.47 | % | | 1.44 | % | | 1.37 | % |
| Return on average equity | | | 12.10 | % | | 13.64 | % | | 14.54 | % | | 14.33 | % | | 13.92 | % | | 16.38 | % | | 17.03 | % | | 15.94 | % |
| Average equity to average assets | | | 9.07 | % | | 9.11 | % | | 9.25 | % | | 9.59 | % | | 9.58 | % | | 8.97 | % | | 8.47 | % | | 8.60 | % |
| | | | | | | | | | | | | | | | | | | | | | | | | | |
| Net interest margin | | | 5.66 | % | | 5.77 | % | | 6.07 | % | | 6.04 | % | | 5.98 | % | | 6.06 | % | | 5.80 | % | | 5.68 | % |
| Efficiency ratio* | | | 68.89 | % | | 67.12 | % | | 65.31 | % | | 64.34 | % | | 65.02 | % | | 60.65 | % | | 61.08 | % | | 62.66 | % |
| Average loans to average deposits | | | 108.23 | % | | 105.03 | % | | 97.15 | % | | 94.37 | % | | 90.15 | % | | 89.84 | % | | 89.60 | % | | 91.91 | % |
| Net Income | | $ | 1,510 | | | 1,649 | | $ | 1,733 | | $ | 1,673 | | $ | 1,606 | | $ | 1,808 | | $ | 1,805 | | $ | 1,606 | |
| | | | | | | | | | | | | | | | | | | | | | | | | | |
| Earnings Per Share: | | | | | | | | | | | | | | | | | | | | | | | | | |
| Basic | | $ | 0.24 | | | 0.26 | | $ | 0.27 | | $ | 0.26 | | $ | 0.26 | | $ | 0.29 | | $ | 0.29 | | $ | 0.26 | |
| Diluted | | $ | 0.23 | | | 0.25 | | $ | 0.26 | | $ | 0.25 | | $ | 0.24 | | $ | 0.27 | | $ | 0.28 | | $ | 0.25 | |
| Outstanding Shares: | | | | | | | | | | | | | | | | | | | | | | | | | |
| Basic | | | 6,384,150 | | | 6,355,466 | | | 6,350,727 | | | 6,337,712 | | | 6,283,890 | | | 6,223,500 | | | 6,186,045 | | | 6,167,571 | |
| Diluted | | | 6,605,942 | | | 6,598,355 | | | 6,594,626 | | | 6,670,942 | | | 6,643,432 | | | 6,592,000 | | | 6,499,178 | | | 6,524,849 | |
* The efficiency ratio is defined as total non-interest expense as a percent of the combined net interest income plus non-interest income.
The Company’s earnings are highly influenced by changes in short term interest rates. The nature of the Company’s balance sheet can be summarily described as of short duration and asset sensitive. The balance sheet is of short duration because a large percentage of its interest sensitive assets and liabilities re-price immediately with changes in the Federal Funds and Prime interest rates. The Company is asset sensitive, primarily due to its large volume of non-interest bearing demand deposit accounts which effectively never re-price. Therefore, an upward movement in short term interest rates will generally result in higher net interest margin and, conversely, a reduction in short term interest rates will result in reduced net interest margin.
Historically, the largest and most variable source of income for the Company is net interest income. The results of operations for the three months ended March 31, 2007 and March 31, 2006 reflect the impact of increases in short term rates as well as growth in the volume of both interest earning assets and interest bearing liabilities during these periods.
Local Economy
The economy in the Company’s service area is based primarily on agriculture, tourism, light industry, oil and retail trade. Services supporting these industries have also developed in the areas of medical, financial and educational services. The population of San Luis Obispo County and the City of Santa Maria (in Northern Santa Barbara County) in 2005 totaled approximately 260,000 and 90,000, respectively, according to economic data provided by local county and title company sources. The moderate climate allows a year round growing season for numerous vegetables and fruits. Vineyards and cattle ranches also contribute largely to the local economy. The Central Coast’s leading agricultural industry is the production of high quality wine grapes and production of premium quality wines. Vineyards in production have grown significantly over the past several years throughout the Company’s service area. Access to numerous recreational activities, including lakes, mountains and beaches, provide a relatively stable tourist industry from many areas including the Los Angeles/Orange County basin, the San Francisco Bay area and the San Joaquin Valley. Principally due to the diversity of the various industries in the Company’s service area, the area, while not immune from economic fluctuations, does tend to enjoy a more stable level of economic activity than many other areas of California.
Critical Accounting Policies
The Company’s significant accounting policies are set forth in the 2006 Annual Report, Note 1 of the NOTES TO CONSOLIDATED FINANCIAL STATEMENTS, which was filed on Form 10-K.
The following is a brief description of the Company’s current accounting policies involving significant management valuation judgments.
Allowance for Loan and Lease Losses
The Company considers its policy regarding the allowance for loan and lease losses to be its most critical accounting policy, because it requires management's most subjective and complex judgments. In addition, changes in economic conditions can have a significant impact on the allowance for loan and lease losses and therefore the provision for loan losses and results of operations. The Company has developed appropriate policies and procedures for assessing the adequacy of the allowance for loan losses, recognizing that this process requires a number of assumptions and estimates with respect to its loan portfolio. The Company's assessments may be impacted in future periods by changes in economic conditions, the impact of regulatory examinations, and the discovery of information with respect to borrowers, which is not known to management at the time of the issuance of the consolidated financial statements.
The allowance for loan and lease losses represents management’s best estimate of losses inherent in the existing loan portfolio. The allowance for loan and lease losses is increased by the provision for loan and lease losses charged to expense and reduced by loans charged-off, net of recoveries. The allowance for loan and lease losses is determined based on management’s assessment of several factors: reviews and evaluation of individual loans, changes in the nature and volume of the loan portfolio, current economic conditions and the related impact on specific borrowers and industry groups, historical loan loss experiences and the level of classified and nonperforming loans.
Loans are considered impaired if, based on current information and events, it is probable that we will be unable to collect the scheduled payments of principal or interest when due according to the contractual terms of the loan agreement. The measurement of impaired loans is generally based on the present value of expected future cash flows discounted at the historical effective interest rate stipulated in the loan agreement, except that all collateral-dependent loans are measured for impairment based on the fair value of the collateral. In measuring the fair value of the collateral, management uses assumptions and methodologies consistent with those that would be utilized by unrelated third parties.
Changes in the financial condition of individual borrowers, economic conditions, historical loss experience and the condition of the various markets in which collateral may be sold may all affect the required level of the allowance for loan and lease losses and the associated provision for loan and lease losses.
See Note 3 to the Consolidated Financial Statements for further discussion on allowance for loan and lease losses.
Securities Available for Sale
The fair values of most securities that are designated available for sale are based on quoted market prices. If quoted market prices are not available, fair values are extrapolated from the quoted prices of similar instruments.
Goodwill and Other Intangible Assets
As discussed in the 2006 Annual Report, Note 6 of the NOTES TO CONSOLIDATED FINANCIAL STATEMENTS, which was filed on form 10-k, we assess goodwill and other intangible assets each year for impairment. This assessment involves estimating cash flows for future periods. If the future cash flows were materially less than the recorded goodwill and other intangible assets balances, the Company would be required to take a charge against earnings to write down the assets to the lower value. The Company determined that there was no impairment at December 31, 2006.
RESULTS OF OPERATIONS
Net Interest Income and Interest Margin
Net interest income, the primary component of the net earnings of a financial institution, refers to the difference between the interest paid on deposits and borrowings, and the interest earned on loans and investments. The net interest margin is the amount of net interest income expressed as a percentage of average earning assets. Factors considered in the analysis of net interest income are the composition and volume of earning assets and interest-bearing liabilities, the amount of non-interest bearing liabilities and non-accrual loans, and changes in market interest rates.
The table below sets forth changes for the three months ended March 31, 2007 and March 31, 2006 the dollar difference in interest earned and paid for each major category of interest-earning assets and interest-bearing liabilities, and the amount of such change attributable to changes in average balances or changes in average rates.
| | | For the three months ended | |
(dollars in thousands) | | March 31, 2007 over 2006 | |
| | Volume | | Rate | | Total | |
Interest income: | | | | | | | |
| Loans (1) | | $ | 1,916 | | $ | 411 | | $ | 2,327 | |
| Investment securities taxable | | | (71 | ) | | 27 | | | (44 | ) |
| Investment securities non-taxable (2): | | | 16 | | | (2 | ) | | 14 | |
| Taxable equivalent adjustment (2): | | | (5 | ) | | 1 | | | (5 | ) |
| Interest-bearing deposits | | | - | | | - | | | - | |
| Federal funds sold | | | (243 | ) | | 48 | | | (195 | ) |
| Net increase (decrease) | | | 1,612 | | | 485 | | | 2,097 | |
Interest expense: | | | | | | | | | | |
| Savings, now, money market | | | (44 | ) | | 144 | | | 100 | |
| Time deposits | | | 380 | | | 209 | | | 589 | |
| Other borrowings | | | 623 | | | 33 | | | 656 | |
| Long term borrowings | | | 166 | | | (1 | ) | | 165 | |
| Net increase (decrease) | | | 1,126 | | | 384 | | | 1,510 | |
| Total net increase (decrease) | | $ | 487 | | $ | 100 | | $ | 587 | |
| | (1) | Loan fees of $288 and $350 for the three months ending March 31, 2007 and 2006, respectively have been included in interest income computation. |
| | (2) | Adjusted to a fully taxable equivalent basis using a tax rate of 34%. |
The table below sets forth for each major category on the balance sheet the average balance, interest income or expense associated with each category, average yields and rates, and net interest income and margin for the three months ended March 31, 2007 and March 31, 2006. The average balance of non-accruing loans has been included in loan totals.
(dollars in thousands) | | For the three months ending March 31, 2007 | | For the three months ending March 31, 2006 | |
| | | | | | | Income/ | | | | Income/ | |
| | Balance | | Rate (4) | | Expense | | Balance | | Rate (4) | | Expense | |
| Interest Earning Assets: | | | | | | | | | | | | | |
| Investments with other banks | | $ | 318 | | | 3.83 | % | $ | 3 | | $ | 306 | | | 3.98 | % | $ | 3 | |
| Investment securities taxable | | | 24,216 | | | 4.61 | % | | 275 | | | 30,200 | | | 4.28 | % | | 319 | |
| Investment securities non-taxable | | | 16,652 | | | 4.34 | % | | 178 | | | 15,706 | | | 4.36 | % | | 169 | |
| Federal funds sold | | | 2,411 | | | 5.21 | % | | 31 | | | 20,640 | | | 4.44 | % | | 226 | |
| Loans (1) (2) | | | 460,825 | | | 8.64 | % | | 9,816 | | | 370,083 | | | 8.21 | % | | 7,489 | |
| Total interest earning assets | | | 504,422 | | | 8.28 | % | | 10,303 | | | 436,935 | | | 7.62 | % | | 8,206 | |
| | | | | | | | | | | | | | | | | | | | |
| Allowance for possible loan losses | | | (4,180 | ) | | | | | | | | (3,948 | ) | | | | | | |
| Other assets | | | 57,629 | | | | | | | | | 48,802 | | | | | | | |
| TOTAL ASSETS | | $ | 557,871 | | | | | | | | $ | 481,789 | | | | | | | |
| | | | | | | | | | | | | | | | | | | | |
| Interest Bearing Liabilities: | | | | | | | | | | | | | | | | | | | |
| Savings/NOW/money market | | | 158,745 | | | 1.84 | % | | 720 | | | 172,543 | | | 1.46 | % | | 620 | |
| Time deposits | | | 125,973 | | | 4.57 | % | | 1,421 | | | 89,973 | | | 3.75 | % | | 832 | |
| Other borrowings | | | 57,241 | | | 5.32 | % | | 751 | | | 12,670 | | | 4.45 | % | | 139 | |
| Federal funds purchased | | | 3,128 | | | 5.70 | % | | 44 | | | - | | | - | | | - | |
| Long Term Debt | | | 16,496 | | | 8.19 | % | | 333 | | | 8,248 | | | 8.26 | % | | 168 | |
| Total interest-bearing liabilities | | | 361,583 | | | 3.67 | % | | 3,269 | | | 283,434 | | | 2.52 | % | | 1,759 | |
| Demand deposits | | | 141,073 | | | | | | | | | 148,020 | | | | | | | |
| Other liabilities | | | 4,612 | | | | | | | | | 4,201 | | | | | | | |
| Stockholders' equity | | | | | | | | | | | | | | | | | | | |
| Common stock | | | 29,338 | | | | | | | | | 29,352 | | | | | | | |
| Additional paid in capital | | | 371 | | | | | | | | | - | | | | | | | |
| Retained earnings | | | 20,825 | | | | | | | | | 16,884 | | | | | | | |
| Valuation allowance investments | | | 69 | | | | | | | | | (102 | ) | | | | | | |
| Total stockholders' equity | | | 50,603 | | | | | | | | | 46,134 | | | | | | | |
| | | | | | | | | | | | | | | | | | | | |
| TOTAL LIABILITIES AND STOCKHOLDERS' EQUITY | | $ | 557,871 | | | | | | | | $ | 481,789 | | | | | | | |
| | | | | | | | | | | | | | | | | | | | |
| Net Interest Income | | | | | | | | $ | 7,034 | | | | | | | | $ | 6,447 | |
| Net Interest Margin (3) | | | | | | 5.66 | % | | | | | | | | 5.98 | % | | | |
| | (1) | Nonaccrual loans have been included in total loans. |
| | (2) | Loan fees of $288 and $350 for the three months ending March 31, 2007 and 2006, respectively. |
| | (3) | Net interest margin has been calculated by dividing the net interest income by total average earning assets. |
| | (4) | Annualized Rate using actual number of days in period. |
The table below sets forth changes in average balances on interest earning assets and their respective yields for the period ended March 31, 2007 compared to the period ended March 31, 2006.
| | | Average Balance for the three months ending | | | | Average Yield for the three months ending | | | |
(dollars in thousands) | | March 31, | | Variance | | March 31, | | | |
| Interest Earning Assets: | | 2007 | | 2006 | | dollar | | percentage | | 2007 | | 2006 | | Variance | |
| Time deposits with other banks | | $ | 318 | | $ | 306 | | $ | 12 | | | 3.92 | % | | 3.83 | % | | 3.98 | % | | -0.15 | % |
| Investment securities taxable | | | 24,216 | | | 30,200 | | | (5,984 | ) | | -19.81 | % | | 4.61 | % | | 4.28 | % | | 0.32 | % |
| Investment securities non-taxable | | | 16,652 | | | 15,706 | | | 946 | | | 6.02 | % | | 4.34 | % | | 4.36 | % | | -0.03 | % |
| Federal funds sold | | | 2,411 | | | 20,640 | | | (18,229 | ) | | -88.32 | % | | 5.21 | % | | 4.44 | % | | 0.77 | % |
| Loans (1) (2) | | | 460,825 | | | 370,083 | | | 90,742 | | | 24.52 | % | | 8.64 | % | | 8.21 | % | | 0.43 | % |
| | | | | | | | | | | | | | | | | | | | | | | |
| Total interest earning assets | | $ | 504,422 | | $ | 436,935 | | $ | 67,487 | | | 15.45 | % | | 8.28 | % | | 7.62 | % | | 0.67 | % |
| (1) Nonaccrual loans have been included in total loans. |
| |
| (2) Loan fees of $288 and $350 for the three months ending March 31, 2007 and 2006, respectively. |
The Company has been able to increase the loan portfolio with continued market penetration by a team of seasoned loan officers who are compensated for production. Additions to the loan portfolio for the three months ending March 31, 2007 were achieved under the Company’s established Loan Policy.
For the three months ending March 31, 2007 compared to the same period in 2006, the average yield on loans improved by 43 basis points. This has been primarily due to action by the Federal Reserve Bank of raising rates by 225 basis points from June 2005 through June 2006. See “Item 3. Quantitative and Qualitative Disclosure about Market Risk” for further discussion.
The taxable investment portfolio gained in average yield due to extension of average life as the result of rising rates. Taxable investment securities decreased due to regular principal reductions on Mortgage Backed Securities (MBS).
While the Company’s balance sheet remains asset sensitive a competitive local market has caused deposit costs to outpace loan yields, applying pressure on the net interest margin. The Company continues to remain committed to aggressively pursuing core deposits to provide an inexpensive source of funding to fuel the continued growth in the loan portfolio. Additionally the re-branding initiative is expected to contribute to the acquisition of new low cost deposits.
The table below sets forth changes in average balances on interest bearing liabilities and the respective rates paid for the period ended March 31, 2007 compared to the period ended March 31, 2006.
| | | Average Balance for the three months ending | | | | Average Rate for the three months ending | | | |
(dollars in thousands) | | March 31, | | Variance | | March 31, | | | |
| Interest Bearing Liabilities: | | 2007 | | 2006 | | dollar | | percentage | | 2007 | | 2006 | | Variance | |
| Savings/NOW/money market | | $ | 158,745 | | $ | 172,543 | | $ | (13,798 | ) | | -8.00 | % | | 1.84 | % | | 1.46 | % | | 0.38 | % |
| Time deposits | | | 125,973 | | | 89,973 | | | 36,000 | | | 40.01 | % | | 4.57 | % | | 3.75 | % | | 0.82 | % |
| Other borrowings | | | 57,241 | | | 12,670 | | | 44,571 | | | 351.78 | % | | 5.32 | % | | 4.45 | % | | 0.87 | % |
| Federal funds purchased | | | 3,128 | | | - | | | 3,128 | | | 100.00 | % | | 5.70 | % | | - | | | 5.70 | % |
| Long term debt | | | 16,496 | | | 8,248 | | | 8,248 | | | 100.00 | % | | 8.19 | % | | 8.26 | % | | -0.07 | % |
| | | | | | | | | | | | | | | | | | | | | | | |
| Total interest-bearing liabilities | | $ | 361,583 | | $ | 283,434 | | $ | 78,149 | | | 27.57 | % | | 3.67 | % | | 2.52 | % | | 1.15 | % |
For the three months ending March 31, 2007 compared to the same period in 2006, the Company’s average rate paid on average interest bearing liabilities increased by 115 basis points.
Non-Interest Income
The table below sets forth changes in non interest income for the three months ending March 31, 2007 compared to the same period in 2006.
| | For three months ended March 31, | | Variance | |
(dollars in thousands) | | 2007 | | 2006 | | dollar | | percentage | |
| Service charges on deposit accounts | | $ | 611 | | $ | 568 | | $ | 43 | | | 7.6 | % |
| ATM/Debit Card Transaction/Interchange fees | | | 176 | | | 175 | | | 1 | | | 0.6 | % |
| Bancard | | | 58 | | | 25 | | | 33 | | | 132.0 | % |
| Mortgage origination fees | | | 149 | | | 143 | | | 6 | | | 4.2 | % |
| Earnings on cash surrender value life insurance | | | 106 | | | 84 | | | 22 | | | 26.2 | % |
| Gain on sale of SBA loans | | | - | | | 19 | | | (19 | ) | | -100.0 | % |
| Other | | | 131 | | | 204 | | | (73 | ) | | -35.8 | % |
| Total | | $ | 1,231 | | $ | 1,218 | | $ | 13 | | | 1.1 | % |
For the three months ending March 31, 2007 as compared to the same period in 2006, non-interest income has remained relatively unchanged. The Company has experienced a modest increase in service charges on deposits as well as an increase in Bancard revenues.
Mortgage Origination Fees have remained relatively unchanged compared to March 31, 2006 seeing a slight 4.2% increase. Home sales have slowed with builders beginning to offer additional buyer incentives and lower prices. The area still remains desirable with prices considerably lower than the major metropolitan areas to the Company’s North and South. Reasonable mortgage rates and financing options such as interest only mortgages and 40 year loans have kept many in the market. The table below illustrates the decline in number of loans originated but an increase in dollar volume. Historically the first quarter of the year is one of the slowest for mortgage originations. The Company expects mortgage origination volume to continue to rise throughout the year as rates have begun to stabilize.
| | | For the three months ended March 31, | |
(dollars in thousands) | | 2007 | | 2006 | | Variance | |
| Dollar volume | | $ | 15,143 | | $ | 13,708 | | | 10.5 | % |
| | | | | | | | | | | |
| Number of loans | | | 41 | | | 54 | | | -24.1 | % |
Non-Interest Expenses
The table below sets forth changes in non interest expense for the three months ending March 31, 2007 compared to the same period in 2006.
| | For three months ended March 31, | | Variance | |
(dollars in thousands) | | 2007 | | 2006 | | dollar | | percentage | |
| Salaries and employee benefits | | $ | 3,250 | | $ | 2,783 | | $ | 467 | | | 16.8 | % |
| Occupany and equipment | | | 715 | | | 622 | | | 93 | | | 15.0 | % |
| Data processing | | | 533 | | | 528 | | | 5 | | | 0.9 | % |
| Advertising and promotional | | | 214 | | | 185 | | | 29 | | | 15.7 | % |
| Regulatory fees | | | 28 | | | 29 | | | (1 | ) | | -3.4 | % |
| Other professional fees and outside services | | | 334 | | | 240 | | | 94 | | | 39.2 | % |
| Legal fees and other litigation expense | | | 28 | | | 17 | | | 11 | | | 64.7 | % |
| Loan department costs | | | 42 | | | 33 | | | 9 | | | 27.3 | % |
| Stationery and supplies | | | 94 | | | 69 | | | 25 | | | 36.2 | % |
| Director fees | | | 74 | | | 76 | | | (2 | ) | | -2.6 | % |
| Core deposit intangible amortization | | | 88 | | | 75 | | | 13 | | | 17.3 | % |
| Other | | | 294 | | | 327 | | | (33 | ) | | -10.1 | % |
| Total | | $ | 5,694 | | $ | 4,984 | | $ | 710 | | | 14.2 | % |
Salary and Employee Benefits
Salaries and employee related expense incurred the greatest dollar increase of any non-interest expense category for the three months ending March 31, 2007 when compared to the same period in 2006. The increase was primarily a result of increased expenses related to the expansion of our Executive Management team contributing to higher officer salaries as well as additional staff to enhance relationship management. The addition of a full service branch within the bank’s existing footprint in the town of Templeton has resulted in an increase in salary and employee benefits as well as occupancy expenses.
Other Professional Fees and Outside Services
Other professional fees and outside services expenses increased for the quarter as a result of increases in a number of sub-categories including executive search expenses, consulting fees, audit fees, compliance and insurance costs. As competition within the primary market area has intensified, the Company has found it necessary to use the service of executive search firms when looking to either replace or add staff. The Company incurred additional expenses within this category related the appraisal of four properties that are being evaluated for a possible sale.
Advertising and Promotional
Late in 2006 one of the largest community banks in our market was acquired by a major multi-national financial institution. The Company feels that as a result of this acquisition it presents an opportunity for us to acquire new customer relationships, as we are now the largest independently owned community bank in our market. The Company feels the potential to acquire new relationships, and in turn lower cost core deposits, warrants additional advertising and marketing efforts which are beginning to be reflected in this expense category.
Provision for Income Taxes
The provision for income taxes was 37.9% and 37.3% of net pre-tax income for the three months ending March 31, 2007, and 2006, respectively.
FINANCIAL CONDITION ANALYSIS
Total assets of the Company were $578.9 million at March 31, 2007 compared to $541.8 million at December 31, 2006. This represents an increase of $37.1 million or approximately 6.8%.
Loans
Total gross loans as of March 31, 2007, increased by $21.2 million over the prior period ended December 31, 2006. The growth in the loan portfolio was primarily attributable to a $14.7 million or 6.2% increase in commercial real estate loan balances as during the first quarter of 2007.
The table below sets forth changes from December 31, 2006 to March 31, 2007 in the composition of the loan portfolio and provides a summary of non-performing assets.
(dollars in thousands) | | March 31, | | December 31, | | Variance | |
| | | 2007 | | 2006 | | dollar | | percentage | |
Loan Classifications: | | | | | | | | | |
| Commercial, financial, and agricultural | | $ | 91,476 | | $ | 84,976 | | $ | 6,500 | | | 7.65 | % |
| Real estate-construction/land | | | 106,542 | | | 105,712 | | | 830 | | | 0.79 | % |
| Real estate - other | | | 252,080 | | | 237,401 | | | 14,679 | | | 6.18 | % |
| Home equity lines of credit | | | 9,617 | | | 10,792 | | | (1,175 | ) | | -10.89 | % |
| Installment loans to individuals | | | 5,705 | | | 5,598 | | | 107 | | | 1.91 | % |
| All other loans (including overdrafts) | | | 793 | | | 504 | | | 289 | | | 57.44 | % |
| Total loans, gross | | | 466,213 | | | 444,983 | | | 21,230 | | | 4.77 | % |
| Less - deferred loan fees, net | | | 1,598 | | | 1,625 | | | (27 | ) | | -1.67 | % |
| Less - reserve for possible loan losses | | | 4,312 | | | 4,081 | | | 231 | | | 5.66 | % |
| | | | | | | | | | | | | | |
| Total loans, net | | $ | 460,303 | | $ | 439,277 | | $ | 21,026 | | | 4.79 | % |
| | | | | | | | | | | | | | |
| Loans held for sale | | $ | 5,300 | | $ | 1,764 | | $ | 3,536 | | | 200.43 | % |
| | | | | | | | | | | | | | |
Asset Quality: | | | | | | | | | | | | | |
| | | | | | | | | | | | | | |
| Loans delinquent 90 days or more | | $ | 2 | | $ | - | | | | | | | |
| Non-accruing loans | | | 143 | | | 55 | | | | | | | |
| Total non-performing loans | | $ | 145 | | $ | 55 | | | | | | | |
| Foreclosed collateral | | | - | | | - | | | | | | | |
| Total non-performing assets | | $ | 145 | | $ | 55 | | | | | | | |
| Ratio of allowance for credit losses to total gross | | | 0.92 | % | | 0.92 | % | | | | | | |
| Ratio of allowance for credit losses to total non- | | | | | | | | | | | | | |
| performing loans | | | 2974 | % | | 7420 | % | | | | | | |
| Ratio of non-performing loans to total gross loans | | | 0.03 | % | | 0.01 | % | | | | | | |
| Ratio of non-performing loans to total assets | | | 0.03 | % | | 0.01 | % | | | | | | |
The increase in commercial, financial and agricultural loans is attributed primarily to a $2.5 million loan to acquire a chain of hair salons, a $1.5 million loan to a winery, a $1.2 million agricultural property loan, $1.2 million to an accounting firm and numerous other new $0.5 to $1.0 million business lines of credit to medical groups, contractors and others.
The small increase in real estate-construction loans can be attributed to new construction projects and the funding of existing construction projects. New loans include: a hotel project for $1.2 million, an addition to a strip center for $1.5 million, a spec residence for $1.4 million and numerous other smaller projects. Construction loans are typically granted for a one year period and then, with income properties, are amortized over not more than 30 years with 10 to 15 year maturities.
The increase in commercial real estate loans is attributed to several of the construction loans moving into amortizing loans and to new commercial property loans. During the period, numerous loans were also refinanced and paid off through out of area lenders and mortgage brokers. New loans include an airport fuel/service facility for $4.3 million, a medical office for $1.3 million, an auto dealership for $1.5 million, a metal fabrication building for $1.0 million and several smaller real estate loans.
The Bank presently has a concentration of loans in construction/land in the amount of $106.4 million which represents 198% of the Company’s Tier I Capital. Of this, 58% are owner occupied thus the concentration is 140% net of owner occupied. Un-disbursed commitments total $31.7 million which combined with disbursed represent 257% of the Bank’s Tier I Capital with 66% owner occupied. At March 31, 2007 there were 74 construction loans with outstanding balances and remaining commitments of approximately $81.4 million and $29.0 million, respectively. The single largest construction loan has an original commitment amount of approximately $12.6 million with a balance of approximately $7.4 million at March 31, 2007. The loan is for an office complex in San Luis Obispo, Ca. At March 31, 2007, there were 56 land loans with an aggregate balance of approximately $24.9 million. The single largest land loan is for a residential tract development with a commitment of $4.8 million and balance of $2.3 million. While these loans may be considered somewhat riskier than certain other real estate loans, the construction/land loans are spread throughout our market area and have consistently performed in a satisfactory manner.
Single family residence construction loans represent 20.3% of the total construction and land loan commitments. Land loans account for 20.8%, multiple family income properties for 9.6%, owner-occupied commercial properties for 27.7% and non-owner-occupied commercial properties for 21.7%. At March 31, 2007, there were no tract loans within this category.
Hotel loans disbursed are not considered to be a concentration with balances of $49.1 million which represents 91% of the Bank’s Tier I Capital. There are several hotel construction loans that increase total commitments to $66.3 million which represents a concentration at 123% of the Bank’s Tier I Capital. At March 31, 2007, there were 33 motel loans. The single largest loan is a construction loan for $9.2 million with $6.8 million disbursed, for luxury suite/spa facility located in Paso Robles, Ca. The hotel loans are also made to clients throughout our market. These loans have historically paid as agreed.
In September 2004, the Bank issued an $11.7 million irrevocable standby letter of credit to guarantee the payment of Taxable Variable Rate Demand Bonds. The primary purpose of the bond issue was to refinance existing debt and provide funds for capital improvements and expansion of an assisted living facility in San Luis Obispo. The project is 100% complete with lease up in process. The letter of credit will expire in September 2008.
Construction loan demand for both single family and commercial real estate moderated during the first quarter of 2007 caused primarily by an increase in interest rates and construction costs. Slowing home sales have caused some builders to begin offering buyer incentives, competitive mortgage rates, and creative financing options to help spur sales. As rates and cost of construction have risen the continued availability of affordable land for subdivision has allowed some builders to move to more rural communities within our market area in order to construct more affordable homes. Additionally, the market area continues to remain attractive with prices considerably lower than the major metropolitan areas to the Company’s North and South. Although a portion of the loan portfolio has seen a smaller amount of growth in the first quarter of 2007, indirectly related to the slow down in single family residential sales, the company believes, in the real estate market, that the desirability of the area and the diversity of the portfolio will provide some insulation against a significant slowing in growth overall in the Company’s market area.
Business properties are also in demand with relatively low vacancies and competitive loan rates. Commercial property values and rental rates increased during 2006. Lease absorption rates appear to have slowed during the first quarter of this year. Investors, many seeking exchange properties, continue to seek properties in our market area. Capitalization rates have steadily decreased with increased demand. Capitalization rate (the rate at which a stream of future cash flows is discounted to find their present value) ranges over the last three years are: 6.5% to 7.5% in 2004, 5.5% to 6.5% in 2005, and 5.0% to 6.5% in 2006. Low capitalization rate properties typically require larger down payments in order to satisfy bank debt coverage requirements. The Bank has, thus far, experienced continued growth in commercial real estate loans this year. Interest rate margins are expected to decrease somewhat due to competitive pressures and increasing cost of funds.
The following charts give a breakdown of types of Construction/Land Loans and types of Commercial Real Estate loans as of March 31, 2007:
Loans held for sale consist of mortgage originations that have already been sold pursuant to correspondent mortgage loan agreements. There is no interest rate risk associated with these loans as the commitments are in place at the time that the Bank funds them. Settlement from the correspondents is typically within 30 to 45 days.
At March 31, 2007, the Bank had no foreign loans outstanding. The Bank did not have any concentrations of loans except as disclosed above.
The Bank’s management is responsible for monitoring loan performance, which is done through various methods, including a review of loan delinquencies and personal knowledge of customers. Additionally, the Bank maintains both a “watch” list of loans that, for a variety of reasons, management believes requires regular review as well as an internal loan classification process. Annually, the loan portfolio is also reviewed by an experienced, outside loan reviewer not affiliated with the Bank. A list of delinquencies, the watch list, loan grades and the outside loan review are reviewed regularly by the Bank’s Board of Directors.
The Bank has a non-accrual policy that requires a loan greater than 90 days past due to be placed on non-accrual status unless such loan is well-collateralized and in the process of collection. When loans are placed on non-accrual status, all uncollected interest accrued is reversed from earnings. Once on non-accrual status, interest on a loan is only recognized on a cash basis. Loans may be returned to accrual status if management believes that all remaining principal and interest is fully collectible and there has been at least six months of sustained repayment performance since the loan was placed on non-accrual. At March 31, 2007 non-accrual loans were $143 thousand.
If a loan’s credit quality deteriorates to the point that collection of principal is believed by management to be doubtful and the value of collateral securing the obligation is sufficient the Bank generally takes steps to protect and liquidate the collateral. Any loss resulting from the difference between the loan balance and the fair market value of the property is recognized by a charge to the reserve for loan losses. When the property is held for sale after foreclosure, it is subject to a periodic appraisal. If the appraisal indicates that the property will sell for less than its recorded value, the Bank recognizes the loss by a charge to non-interest expense.
Total Cash and Due from Banks
Total cash and due from banks were $26.5 million and $19.2 million at March 31, 2007 and December 31, 2006, respectively. This line item will vary depending on cash letters from the previous night and actual cash on hand in the branches.
Investment Securities and Other Earning Assets
Other earning assets are comprised of Federal Home Loan Bank, Federal Funds sold (funds the bank lends on a short-term basis to other banks), investments in securities and short-term interest bearing deposits at other financial institutions. These assets are maintained for liquidity needs of the Bank, collateralization of public deposits, and diversification of the earning asset mix.
The table below sets forth changes from December 31, 2006 to March 31, 2007 in the composition of other earning assets.
| | | March 31, | | December 31, | | Variance | |
(dollars in thousands) | | 2007 | | 2006 | | dollar | | percentage | |
| Federal Home Loan Bank stock | | $ | 3,085 | | $ | 2,350 | | $ | 735 | | | 31.28 | % |
| | | | | | | | | | | | | | |
| Available-for-sale securities | | | 37,620 | | | 38,445 | | $ | (825 | ) | | -2.15 | % |
| | | | | | | | | | | | | | |
| Federal funds sold | | | 8,620 | | | 3,870 | | $ | 4,750 | | | 122.74 | % |
| | | | | | | | | | | | | | |
| Interest bearing deposits other financial institutions | | | 318 | | | 318 | | | - | | | 0.00 | % |
| | | | | | | | | | | | | | |
| Total other earning assets | | $ | 49,643 | | $ | 44,983 | | $ | 4,660 | | | 10.36 | % |
Investments available-for-sale decreased due to prepayments on Mortgage Backed Securities (MBS) and Collateralized Mortgage Obligations (CMO).
Fed funds sold increased 122.74% when comparing March 31, 2007 to December 31, 2006. The amount of Fed funds sold can vary widely on a daily basis depending on the cash position of the bank which is affected by numerous variables such as cash letters, incoming and outgoing wire activity, and loan funding needs.
The Company manages its securities portfolio to provide a source of both liquidity and earnings. The Bank has an asset/liability committee that develops current investment policies based upon its operating needs and market circumstance. The Bank’s investment policy is formally reviewed and approved annually by the board of directors. The asset/liability committee of the Bank is responsible for reporting and monitoring compliance with the investment policy. Reports are provided to the Bank’s boards of directors on a regular basis.
Securities available-for-sale are carried at fair value, with related unrealized net gains or losses, net of deferred income taxes, recorded as an adjustment to equity capital. As of December 31, 2006, net unrealized gains in the portfolio were $133 thousand compared to a net unrealized gain of $76 thousand at March 31, 2007. This change in market value was driven by the slope of the yield curve remaining inverted with long-term 30-Year Treasury Bond rates yielding slightly less than the short-term 6- month T-Bill. The portfolio decreased in size due to principle reductions on MBS and CMOs.
At March 31, 2007, available-for-sale securities in the portfolio included obligations of state and political subdivisions, obligations of U.S. government agencies and corporations and mortgage backed securities issued by various agencies.
All fixed and adjustable rate mortgage pools contain a certain amount of risk related to the uncertainty of prepayments of the underlying mortgages. Interest rate changes have a direct impact upon prepayment rates. The Bank uses computer simulation models to test the average life, duration, market volatility and yield volatility of adjustable rate mortgage pools under various interest rate assumptions to monitor volatility. Stress tests are performed quarterly.
Deposits and Borrowed Funds
The table below sets forth changes from December 31, 2006 to March 31, 2007 in the composition of deposit categories.
| | | | | | | | | | | % of Total | |
(dollars in thousands) | | March 31, | | December 31, | | Variance | | Deposits | |
| Deposits: | | 2007 | | 2006 | | dollar | | percentage | | 3/31/07 | |
| Non-interest bearing demand | | $ | 146,406 | | $ | 153,005 | | $ | (6,599 | ) | | -4.31 | % | | 32.9 | % |
| Interest bearing demand | | | 51,304 | | | 45,164 | | | 6,140 | | | 13.59 | % | | 11.5 | % |
| Savings | | | 23,829 | | | 23,406 | | | 423 | | | 1.81 | % | | 5.4 | % |
| Money market | | | 94,727 | | | 77,540 | | | 17,187 | | | 22.17 | % | | 21.3 | % |
| Time deposits of $100K or more | | | 33,269 | | | 30,630 | | | 2,639 | | | 8.62 | % | | 7.5 | % |
| Time deposits under $100K | | | 95,476 | | | 90,776 | | | 4,700 | | | 5.18 | % | | 21.5 | % |
| Total deposits | | $ | 445,011 | | $ | 420,521 | | $ | 24,490 | | | 5.82 | % | | 100 | % |
Acquisition of core, low cost deposits has become the single biggest challenge facing the Company. Still, the Company has been able to increase deposits due to a well planned marketing strategy and incentive based compensation that has been in place for several years. Like all good strategies, this one is fluid and is subject to the changing dynamics within the Company’s balance sheet and staffing along with changes in its primary market area. A shift to higher balances in time deposits is the result of fierce competition for deposits driving up short term CD rates coupled with funding requirements for loans. Additionally, the rise in money market balances is in part the result of current promotions designed to attract additional lower cost core deposits.
At March 31, 2007, non-interest bearing demand deposits provide 32.9% of total deposits compared to 36.4% at December 31, 2006. At March 31, 2007 and December 31, 2006, the Bank had three deposit relationships that it considers to be volatile. These deposits are held by three customers of the Bank that engage in mortgage related activities. As a percentage of total deposits, these accounts represented 9.2% or $41.1 million at March 31, 2007 compared to 10.5% or $44.1 million at December 31, 2006. These volatile account relationships are included in the volatile liability dependency report that the Bank produces on a monthly basis. Typically, a material increase in balances held by these three customers is reflected in Federal Funds Sold and is recognized by Management to potentially be short term in nature. Therefore, any material increase in these balances is not considered to be a funding source for any form of long-term investment. Management and the Board of Directors of the Bank are keenly aware that as the mortgage market conditions change, these relationships will be impacted.
Core deposits (time deposits less than $100 thousand, demand, and savings) gathered in the local communities served by the Company continue to be the primary source of funds for loans and investments. Core deposits of $412.2 million represented 92.6% of total deposits at March 31, 2007. The Company has the ability to purchase funds through deposit brokers, but has no immediate plans to do so.
In October 2005, the Company renewed a Promissory Note with Pacific Coast Bankers Bank (PCBB) for a revolving line of credit in the amount of $3.5 million. At March 31, 2007, the Company had a zero balance outstanding on this note. The Company pledged 646,598 shares (51%) of the Bank’s stock as collateral for the loan. The note is revolving in nature for the first two years. The terms of the note call for quarterly interest only payments for the first two years with subsequent principal and interest payments for eight years on a fully amortized basis. At March 31, 2007, the interest rate on the note was 8.25% and is variable and moves with prime. Under the terms of the agreement, the Company will not incur any additional debt over $2 million exclusive of inter-company debt and existing debt without the prior written consent of PCBB. In addition, the Bank must be “well” capitalized on an on-going basis as defined by bank regulators.
The Bank has established borrowing lines with the Federal Home Loan Bank (FHLB). At March 31, 2007, the Bank had borrowings with the FHLB of $60.0 million collateralized by loans. The weighted average interest rate associated with these borrowings as of March 31, 2007 was 5.43%.
The table below sets forth the various advances the bank has obtained from the FHLB as of March 31, 2007:
| | (dollars in thousands) | | | | | | | |
| | | | | | | | | |
| | Amount | | | | Maturity | |
| | Borrowed | | Rate | | Variable/Fixed | | Date | |
| $ | 10,000 | | | 5.50 | % | | Fixed | | | 7/25/07 | |
| | 10,000 | | | 5.39 | % | | Fixed | | | 5/29/07 | |
| | 10,000 | | | 5.53 | % | | Variable- Daily | | | Open-Ended | |
| | 10,000 | | | 5.39 | % | | Variable- Daily | | | 9/28/07 | |
| | 10,000 | | | 5.37 | % | | Variable- Daily | | | 11/26/07 | |
| | 10,000 | | | 5.37 | % | | Variable- Daily | | | 12/12/07 | |
| $ | 60,000 | | | 5.43 | % | | | | | | |
At maturity, Management will assess balance sheet needs and determine how much if any and at what term it will borrow from the FHLB.
On September 17, 2004, the Bank issued a Letter of Credit in the amount of approximately $11.7 million to a customer in regard to a senior care facility. The Letter of Credit was issued pursuant to a Letter of Credit Reimbursement Agreement between the Bank and the FHLB. It is collateralized by a blanket lien with the FHLB that includes all qualifying loans on the Bank’s balance sheet.
At March 31, 2007, the Bank has a remaining borrowing capacity with existing collateral of approximately $45.5 million and $8.8 million secured by loans and securities, respectively.
The Bank utilizes securities sold under repurchase agreements as a source of funds. The Bank had $1.4 million in securities sold under repurchase agreements at March 31, 2007 compared to $1.4 million at December 31, 2006.
Capital
The Company's total stockholders’ equity was $51.2 million at March 31, 2007 compared to $49.5 million at December 31, 2006. The increase in capital was due to net income of $1.5 million, stock options exercised in the amount of $555 thousand, the capital impact of share-based compensation expense of $92 thousand, $510 thousand paid for a quarterly cash dividend, and an increase in accumulated other comprehensive income of $46 thousand.
Dividends
On April 20, 2007 the Board of Directors declared a quarterly cash dividend of $0.08 per share to be paid on May 18, 2007 to shareholders of record on May 4, 2007.
On January 23, 2007, the Board of Directors declared a quarterly cash dividend of $0.08 per share to be paid on February 17, 2007 to shareholders of record on February 2, 2007.
On October 20, 2006, the Board of Directors declared a quarterly cash dividend of $0.08 per share to be paid on November 17, 2006 to shareholders of record on November 3, 2006
On July 21, 2006, the Board of Directors declared a quarterly cash dividend of $0.08 per share to be paid on August 25, 2006 to shareholders of record on August 11, 2006.
On April 21, 2006 the Company declared a $0.25 per share special cash dividend to be paid on May 19, 2006 to shareholders of record on May 8, 2006. The special dividend was declared in lieu of recent annual stock dividends the Company has declared.
Stock Repurchases
On July 21, 2006, the Board of Directors adopted a resolution authorizing the repurchase of up to 40,000 shares of the Company’s common stock. Purchases are to be made, as conditions warrant, from time to time in the open market. The duration of the program is one year and the timing of purchases will depend on market conditions.
On October 20, 2006, the Board of Directors adopted a resolution to increase the number of shares available for repurchase to 100,000 for the repurchase plan that was adopted in July 2006.
Trust Preferred Securities
On April 10, 2002, the Company issued $8,248,000 of Floating Rate Junior Subordinated Deferrable Interest Debentures (the “debt securities”) to Heritage Oaks Capital Trust I, a statutory trust created under the laws of the State of Delaware. These debt securities are subordinated to effectively all borrowings of the Company and are due and payable on April 22, 2032. Interest is payable semi-annually on these debt securities at 6-Month LIBOR plus 3.7% for an effective rate of 9.09% as of March 31, 2007. The debt securities can be called at any time commencing on April 22, 2007, at par. The debt securities can also be redeemed at par if certain events occur that impact the tax treatment, regulatory treatment or the capital treatment of the issuance. The Company also purchased a 3% minority interest totaling $248 thousand in Heritage Oaks Capital Trust I. The balance of the equity of Heritage Oaks Capital Trust I is comprised of mandatorily redeemable preferred securities and is included in other assets. The Company used the proceeds from the sale of the securities for general corporate purposes, including the repayment of outstanding indebtedness of $1.9 million on April 11, 2002 and capital contributions to the Bank for future growth.
On April 23, 2007 the Company redeemed all of the Floating Rate Junior Subordinated Debt Securities it held associated with Heritage Oaks Capital Trust I, a wholly-owned subsidiary of Heritage Oaks Bancorp. The redemption price was 100% of the principal amount redeemed plus any accrued and unpaid interest as of the Redemption Date. The Company paid $379,011 for the standard interest payment due April 22, 2007, plus a payment of $8,248,000 for the principal amount that was redeemed on that date. These amounts were funded from the Company’s general corporate reserves. Heritage Oaks Capital Trust I was formed for the sole purpose of issuing junior subordinated debt securities. As a result of the redemption of all the junior subordinated debt securities the Company held associated with Heritage Oaks Capital Trust I, the trust is tentatively scheduled to be dissolved within the second quarter of 2007.
On October 27, 2006, the Company issued $8,248,000 of Floating Rate Junior Subordinated Deferrable Interest Debentures (the “debt securities”) to Heritage Oaks Capital Trust II, a statutory trust created under the laws of the State of Delaware. These debt securities are subordinated to effectively all borrowings of the Company and are due and payable on October 27, 2036. Interest is payable quarterly on these debt securities at 3-Month LIBOR plus 1.71% for an effective rate of 7.08% as of March 31, 2007. The debt securities can be called at any time commencing on October 27, 2011, at par. The debt securities can also be redeemed at par if certain events occur that impact the tax treatment or the capital treatment of the issuance. The Company also purchased a 3% minority interest totaling $248,000 in Heritage Oaks Capital Trust II. The balance of the equity of Heritage Oaks Capital Trust II is comprised of mandatory redeemable preferred securities and is included in other assets.
The Company intends to use the proceeds of the sale of the Trust Preferred Securities issued to Heritage Oaks Capital Trust II for general corporate purposes which may include investment in the Bank, acquisitions, investments, payment of dividends and repurchases of our outstanding common stock.
Under FASB Interpretation (FIN) No. 46, “Consolidation of Variable Interest Entities, an interpretation of ARB No. 51,” the Company is not allowed to consolidate Heritage Oaks Capital Trust I and II into the Company’s financial statements. Prior to the issuance of FIN No. 46, Bank holding companies typically consolidated these entities. On February 28, 2005, the Federal Reserve Board issued a new rule which provides that, notwithstanding the deconsolidation of such trusts, junior subordinated debentures, such as those issued by the Company, may continue to constitute up to 25% of a bank holding company's Tier 1 capital, subject to certain new limitations which will not become effective until March 31, 2009 and which, in any event, are not expected to affect the treatment of the Company's Junior Subordinated Debentures as Tier 1 capital for regulatory purposes. As of March 31, 2007, the Company has included $14.9 million of the net junior subordinated debt associated with both Heritage Oaks Capital Trust I and Heritage Oaks Capital Trust II in its Tier1 Capital for regulatory capital purposes.”
If the Company elects to defer interest payments pursuant to terms of the agreement, then the Company may not (i) declare or pay any dividends or distributions on, or redeem, purchase, acquire or make a liquidation payment with respect to any of the Company’s capital stock, or (ii) make any payment of principal of or premium, if any, or interest on or repay, repurchase or redeem any debt securities of the Company that rank pari passu with or junior in interest to the Debt Securities, other than, among other items, a dividend in the form of stock, warrants, options or other rights in the same stock as that on which the dividend is being paid or ranks pari passu with or junior to such stock. The prohibition on payment of dividends and payments on pari passu or junior debt also applies in the case of an event of default under the agreements.
At March 31, 2007, the Company had sufficient cash to service the existing $16.5 million in junior subordinated debenture interest payments for approximately six years without dividends from subsidiaries. The Bank’s capacity to provide cash to the Company, while remaining “well-capitalized”, was $5.8 million at March 31, 2007.
Regulatory Capital Requirements
Capital ratios for commercial banks in the United States are generally calculated using three different formulas. These calculations are referred to as the “Leverage Ratio” and two “risk-based” calculations known as: “Tier One Risk Based Capital Ratio” and the “Total Risk Based Capital Ratio.” These standards were developed through joint efforts of banking authorities from 12 different countries around the world. The standards essentially take into account that different types of assets have different levels of risk associated with them. Furthermore, they take into account the off-balance sheet exposures of banks when assessing capital adequacy.
The Leverage Ratio calculation simply divides common stockholders’ equity (reduced by any goodwill a bank may have) by the total assets. In the Tier One Risk Based Capital Ratio, the numerator is the same as the leverage ratio, but the denominator is the total “risk-weighted assets”. Risk weighted assets are determined by segregating all the assets and off balance sheet exposures into different risk categories and weighting them by a percentage ranging from 0% (lowest risk) to 100% (highest risk). The Total Risk Based Capital Ratio again uses “risk-weighted assets” in the denominator, but expands the numerator to include other capital items besides equity such as a limited amount of the loan loss reserve, long-term capital debt, preferred stock and other instruments.
Summarized below are the Company’s and the Bank’s capital ratios at March 31, 2007.
| | | Regulatory Standard | | Heritage | | Heritage | |
| | Adequately | | Well | | Oaks | | Oaks | |
| | Capitalized | | Capitalized | | Bancorp | | Bank | |
| Leverage Ratio | | | 4.00 | % | | 5.00 | % | | 10.87 | % | | 9.77 | % |
| | | | | | | | | | | | | | |
| Tier I Risk Based Captial Ratio | | | 4.00 | % | | 6.00 | % | | 11.42 | % | | 10.26 | % |
| | | | | | | | | | | | | | |
| Total Risk Based Captial Ratio | | | 8.00 | % | | 10.00 | % | | 12.28 | % | | 11.11 | % |
Liquidity
The objective of liquidity management is to ensure the continuous availability of funds to meet the demands of depositors, investors and borrowers. Asset liquidity is primarily derived from loan payments and the maturity of other earning assets. Liquidity from liabilities is obtained primarily from the receipt of new deposits. The Bank’s Asset Liability Committee (ALCO) is responsible for managing the on and off-balance sheet commitments to meet the needs of customers while achieving the Bank’s financial objectives. ALCO meets regularly to assess the projected funding requirements by reviewing historical funding patterns, current and forecasted economic conditions and individual customer funding needs. Deposits generated from Bank customers serve as the primary source of liquidity. The Bank has credit arrangements with correspondent banks that serve as a secondary liquidity source in the amount of $13.5 million. As of March 31, 2007, the Bank had no borrowings against credit arrangements with these correspondent banks. The Bank is a member of the FHLB and has a collateralized borrowing capacity remaining of approximately $54 million.
The Bank manages liquidity by maintaining a majority of the investment portfolio in federal funds sold and other liquid investments. At March 31, 2007, the ratio of liquid assets not pledged for collateral and other purposes to deposits and other liabilities was 11.93% compared to 9.31% at December 31, 2006. The ratio of net loans to deposits (LTD), another key liquidity ratio, was 103.4% at March 31, 2007 compared to 104.5% at December 31, 2006 both of which remain within the Bank’s policy guidelines. While the Bank still provides the majority of loan funding with core deposits, due to the highly competitive nature of deposit gathering the Bank has found it necessary to rely on borrowed funds. With the banking industry’s common use of alternative funding sources, i.e. FHLB borrowing, in 2006 the Bank implemented a tracking ratio of Loan-to-Funding (LTF). This ratio is calculated by dividing gross loans by the sum of total deposits and alternative funding sources both available and used. At March 31, 2007 the LTF ratio was 81.75% compared to 82.93% at December 31, 2006 both of which remain within the Bank’s policy guidelines as well. The Bank’s key focus remains to increase core deposits and minimize alternative funding sources.
Inflation
The assets and liabilities of a financial institution are primarily monetary in nature. As such they represent obligations to pay or receive fixed and determinable amounts of money that are not affected by future changes in prices. Generally, the impact of inflation on a financial institution is reflected by fluctuations in interest rates, the ability of customers to repay debt and upward pressure on operating expenses. The effect of inflation over the past four-year period has been significant to the Company’s financial position and results of operations in regard to fluctuation in interest rates creating in the decreasing rate environment a narrowing of the net interest margin and in the increasing rate environment for the past two years, a widening of the net interest margin. Rates have recently begun to level off and the Company’s net interest margin has seen a small amount of contraction over the past quarter narrowing by 11 basis points. There has been a great deal of news in the national media related to the rising rate environment leading to the inability of some borrowers in the single family residential sub-prime and alt- a markets to repay their debt. However, the Company’s primary focus is commercial lending and the strong underwriting requirements of the Company has continued to lend itself to outstanding asset quality as evidenced by a 0.03% non-performing loan to total net loan ratio as of March 31, 2007.
Off-Balance Sheet Arrangements
Off-balance sheet arrangements are any contractual arrangement to which an unconsolidated entity is a party, under which the Company has: (1) any obligation under a guarantee contract; (2) a retained or contingent interest in assets transferred to an unconsolidated entity or similar arrangement that serves as credit, liquidity or market risk support to that entity for such assets; (3) any obligation under certain derivative instruments; or (4) any obligation under a material variable interest held by the Company in an unconsolidated entity that provides financing, liquidity, market risk or credit risk support to the Company, or engages in leasing, hedging or research and development services with the Company.
In the ordinary course of business, the Company has entered into off-balance sheet financial instruments consisting of commitments to extend credit, commercial letter of credit, and standby letter of credit. Such financial instruments are recorded in the financial statement when they are funded or related fees are incurred or received. For a fuller discussion of these financial instruments, refer to Note 10 of the Company’s consolidated financial statements contained in Item 8 of Part II of the Company’s December 31, 2006 10-K.
In the ordinary course of business, the Bank is a party to various operating leases. For a fuller discussion of these financial instruments, refer to Note 5 of the Company’s consolidated financial statements contained in Item 8 of Part II of the Company’s December 31, 2006 10-K.
In connection with the $16.5 million in debt securities discussed in “Capital,” the Company issued the full and unconditional payment guarantee of certain accrued distributions.
Item 3. Quantitative and Qualitative Disclosure about Market Risk
As a financial institution, the Company’s primary component of market risk is interest rate volatility. Fluctuations in interest rates will ultimately impact both the level of interest income and interest expense recorded on a large portion of the Company’s assets and liabilities, and the market value of all interest earning assets and interest bearing liabilities, other than those which possess a short term to maturity. Virtually all of the Company’s interest earning assets and interest bearing liabilities are located at the banking subsidiary level. Thus, virtually all of the Company’s interest rate risk exposure lies at the banking subsidiary level other than $16.5 million, as of March 31, 2007, in subordinated debentures issued by the Company’s subsidiary grantor trusts. As a result, all significant interest rate risk procedures are performed at the banking subsidiary level. The subsidiary bank’s real estate loan portfolio, concentrated primarily within Northern Santa Barbara County and San Luis Obispo County, California, are subject to risks associated with the local economy.
The fundamental objective of the Company’s management of its assets and liabilities is to maximize the Company’s economic value while maintaining adequate liquidity and an exposure to interest rate risk deemed by Management to be acceptable. Management believes an acceptable degree of exposure to interest rate risk results from the management of assets and liabilities through maturities, pricing and mix to attempt to neutralize the potential impact of changes in market interest rates. The Company’s profitability is dependent to a large extent upon its net interest income, which is the difference between its interest income on interest-earning assets, such as loans and investments, and its interest expense on interest-bearing liabilities, such as deposits and borrowings. The Company is subject to interest rate risk to the degree that its interest-earning assets re-price differently than its interest-bearing liabilities. The Company manages its mix of assets and liabilities with the goals of limiting its exposure to interest rate risk, ensuring adequate liquidity, and coordinating its sources and uses of funds.
The Company seeks to control interest rate risk exposure in a manner that will allow for adequate levels of earnings and capital over a range of possible interest rate environments. The Company has adopted formal policies and practices to monitor and manage interest rate risk exposure. Management believes historically it has effectively managed the effect of changes in interest rates on its operating results. Management believes that it can continue to manage the short-term effect of interest rate changes under various interest rate scenarios.
Management employs the use of an Asset and Liability Management software that is used to measure the Bank’s exposure to future changes in interest rates. This model measures the expected cash flows and re-pricing of each financial asset/liability separately in measuring the Bank’s interest sensitivity. Based on the results of this model, management believes the Bank’s balance sheet is “asset sensitive”. This means the Company expects (all other things being equal) to expand its net interest income if rates rise and expects it conversely to contract if rates fall. The level of potential or expected contraction indicated by the tables below is considered acceptable by management and is compliant with the Bank’s ALCO policies. Management will continue to perform this analysis each quarter to further validate the expected results against actual data.
The hypothetical impacts of sudden interest rate movements applied to the Company’s asset and liability balances are modeled monthly. The results of this movement indicate how much of the Company’s net interest income is “at risk” from various rate changes over a one year horizon. This exercise is valuable in identifying risk exposures. Management believes the results for the Company’s March 31, 2007 balances indicate that the net interest income at risk over a one year time horizon for a 1% and 2% rate increase and decrease is acceptable at this time.
| | | Shock Rate Scenarios | |
(dollars in thousands) | | -200bp | | -100bp | | Base | | +100bp | | +200bp | |
| | | | | | | | | | | | |
| Net interest income (NII) | | $ | 25,192 | | $ | 26,121 | | $ | 27,194 | | $ | 28,100 | | $ | 29,012 | |
| | | | | | | | | | | | | | | | | |
| $ Change from base | | $ | (2,002 | ) | $ | (1,073 | ) | $ | - | | $ | 906 | | $ | 1,817 | |
| | | | | | | | | | | | | | | | | |
| % Change from base | | | -7.36 | % | | -3.95 | % | | 0.00 | % | | 3.33 | % | | 6.68 | % |
It is important to note that the above table is a summary of several forecasts and actual results may vary. The forecasts are based on estimates and assumptions of management that may turn out to be different and may change over time. Factors affecting these estimates and assumptions include, but are not limited to 1) competitor behavior, 2) economic conditions both locally and nationally, 3) actions taken by the Federal Reserve Board, 4) customer behavior and 5) management’s responses. Changes that vary significantly from the assumptions and estimates may have significant effects on the Company’s net interest income; therefore, the results of this analysis should not be relied upon as indicative of actual future results.
The following tables show Management’s estimates of how the loan portfolio is broken out between variable-daily, variable at various time lines, fixed rate loans and estimates of re-pricing opportunities for the entire loan portfolio.
(dollars in thousands) | | | | | |
| | | | | | |
Total Gross Loans | | Percent of | |
Rate Type | | Balance | | Total | |
| Variable - daily | | $ | 191,495 | | | 41 | % |
| Variable other than daily | | | 203,881 | | | 44 | % |
| Fixed rate | | | 70,837 | | | 15 | % |
| Total gross loans | | $ | 466,213 | | | 100 | % |
The table above identifies approximately 41% of the loan portfolio that will re-price immediately in a changing rate environment.
(dollars in thousands) | | | | | |
| | | | | | |
Total Gross Loans | | Percent of | |
Re-Pricing | | Balance | | Total | |
| < 1 Year | | $ | 267,541 | | | 57 | % |
| 1-3 Years | | | 116,352 | | | 25 | % |
| 3-5 Years | | | 51,893 | | | 11 | % |
| > 5 Years | | | 30,428 | | | 7 | % |
| Total gross loans | | $ | 466,213 | | | 100 | % |
Item 4. Controls and Procedures
Evaluation of Disclosure Controls and Procedures
As of the end of the period covered by this report, the Company carried out an evaluation, under the supervision and with the participation of its management, including the Company’s Chief Executive Officer and Chief Financial Officer, of the effectiveness of the design and operation of the Company’s disclosure controls and procedures pursuant to Exchange Act Rules 13a-15 and 15d-15. Based upon that evaluation, the Chief Executive Officer and Chief Financial Officer concluded that the Company’s disclosure controls and procedures are effective to provide reasonable assurances that information required to be disclosed in the reports the Company files or submits under the Securities Exchange Act of 1934 is recorded, processed, summarized and reported within the time periods specified in the SEC’s rules and forms.
There was no change in the Company’s internal controls over financial reporting during the quarter ended March 31, 2007 that has materially affected, or is reasonably likely to materially affect, the Company’s internal controls over financial reporting.
In designing and evaluating disclosure controls and procedures, the Company’s management recognized that any controls and procedures, no matter how well designed and operated, can provide only reasonable, not absolute, assurances of achieving the desired control objectives and management necessarily was required to apply its judgment in evaluating the cost-benefit relationship of possible controls and procedures.
PART 2. OTHER INFORMATION
Item 1. Legal Proceedings
The Company is not a party to any material legal proceeding.
Item 1A.Risk Factors
During the period covered by this report there were no material changes from risk factors as previously disclosed in the Company’s December 31, 2006 10k in response to Item A to Part I of Form 10k.
Item 2. Changes in Securities, Use of Proceeds and Issuer Purchases of Equity Securities
Unregistered Sale of Equity Securities
None.
Purchases of Equity Securities
On July 21, 2006, the Board of Directors adopted a one year stock repurchase plan in the initial amount of 40,000 shares. In October 2006, the Board of Directors adopted a resolution to increase the total number of shares available for repurchase under the plan to 100,000.
As of December 31, 2006, the Company had repurchased 40,000 shares of its common stock under the repurchase plan at an average market price of $17.95 per share. As of March 31, 2007, there were 60,000 shares of common stock available for purchase under the repurchase plan. During the three months ending March 31, 2007, the company made no additional purchases of its common stock under the repurchase plan.
The table below summarizes our Quarterly repurchases of our common equity securities:
Period | | Total number of shares purchased | | Average price paid per share | | Total number of shares that may yet be purchased under the publicly announced plan | |
| Q3 2006 | | | 15,000 | | $ | 16.56 | | | 25,000 | |
| Q4 2006 (1) | | | 25,000 | | $ | 18.79 | | | 60,000 | |
| Q1 2007 | | | - | | | - | | | 60,000 | |
| Total | | | 40,000 | | $ | 17.95 | | | 60,000 | |
(1) Includes the additional 60,000 shares added to the plan in October 2006
Item 3. Defaults Upon Senior Securities
N/A
Item 4. Submission of Matters to a Vote of Security Holders
N/A
Item 5. Other Information
N/A
Item 6. Exhibits
(a) Exhibits:
Exhibit (31.1) Certification of Chief Executive Officer pursuant to Section 302 of the Sarbanes-Oxley Act of 2002
Exhibit (31.2) Certification of Chief Financial Officer pursuant to Section 302 of the Sarbanes-Oxley Act of 2002
Exhibit (32.1) Certification of Chief Executive Officer pursuant to Section 906 of the Sarbanes-Oxley Act of 2002
Exhibit (32.2) Certification of Chief Financial Officer pursuant to Section 906 of the Sarbanes-Oxley Act of 2002
SIGNATURES
Pursuant to the requirements of the Securities Exchange Act of 1934, the registrant has duly caused this report to be signed on its behalf by the undersigned thereunto duly authorized.
HERITAGE OAKS BANCORP
DATE: May 9, 2007
Lawrence P. Ward
President
Chief Executive Officer
Margaret A. Torres
Executive Vice President
Chief Financial Officer
(Principal Financial and Accounting Officer)