Exhibit 99.2

Safe Harbor During the course of this presentation, we will be providing you with a discussion of some of the factors we currently anticipate may influence the future results of Republic Bancorp, Inc. (“Republic” or the “Company”), as well as certain financial projections. We want to emphasize that these forward-looking statements involve judgment, and that individual judgments may vary. Moreover, these statements are based on limited information available to us now, which is subject to change. Actual results may differ substantially from what we say today and no one should assume later that the comments we provide today are still valid. They speak only as of today. Specific risk factors that could change causing our projections not to be achieved are discussed in the “Risk Factors” section of our Form 10-K filed with the Securities and Exchange Commission (“SEC”) on March 13, 2015, and other reports filed with the SEC from time to time.

Steve Trager Chairman and Chief Executive Officer
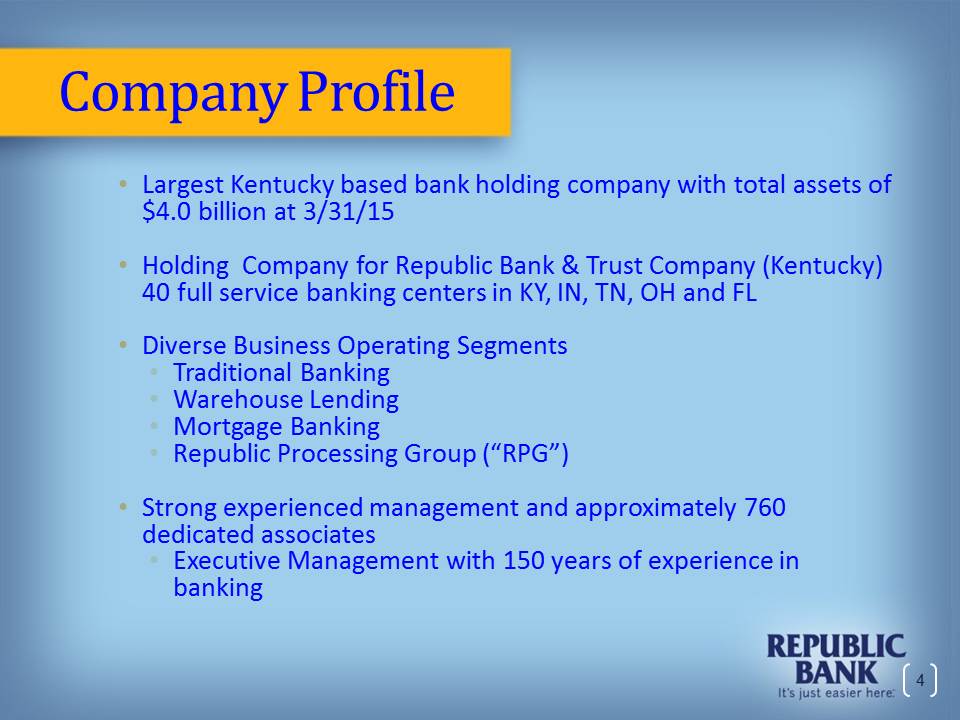
Company Profile Largest Kentucky based bank holding company with total assets of $4.0 billion at 3/31/15 Holding Company for Republic Bank & Trust Company (Kentucky) 40 full service banking centers in KY, IN, TN, OH and FLDiverse Business Operating SegmentsTraditional BankingWarehouse LendingMortgage BankingRepublic Processing Group (“RPG”)Strong experienced management and approximately 760 dedicated associatesExecutive Management with 150 years of experience in banking
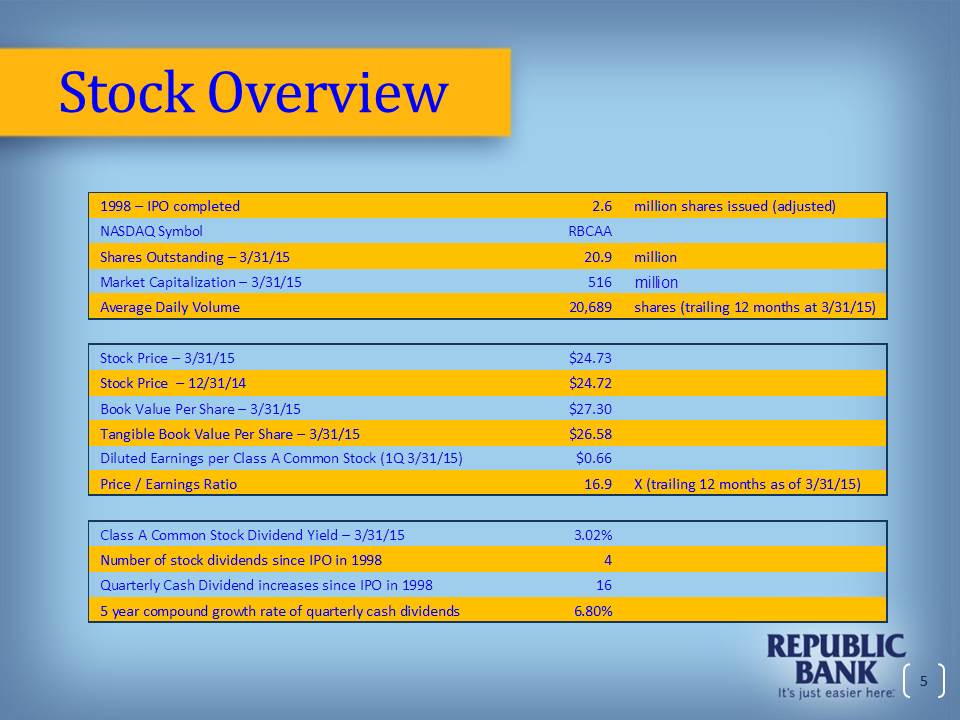
1998 – IPO completed NASDAQ Symbol Shares Outstanding – 3/31/15 Market Capitalization – 3/31/15 Average Daily Volume 2.6 million shares issued (adjusted) RBCAA 20.9 million 516 million 20,689 shares (trailing 12 months at 3/31/15 Stock Price – 3/31/15 Stock Price – 12/31/14 Book Value Per Share – 3/31/15 Tangible Book Value Per Share – 3/31/15 Diluted Earnings per Class A Common Stock (1Q 3/31/15) Price / Earnings Ratio $24.73 $24.72 $27.30 $26.58 $0.66 16.9 X (trailing 12 months as of 3/31/15) Class A Common Stock Dividend Yield – 3/31/15 Number of stock dividends since IPO in 1998 Quarterly Cash Dividend increases since IPO in 1998 5 year compound growth rate of quarterly cash dividends 3.02% 4 16 6.80
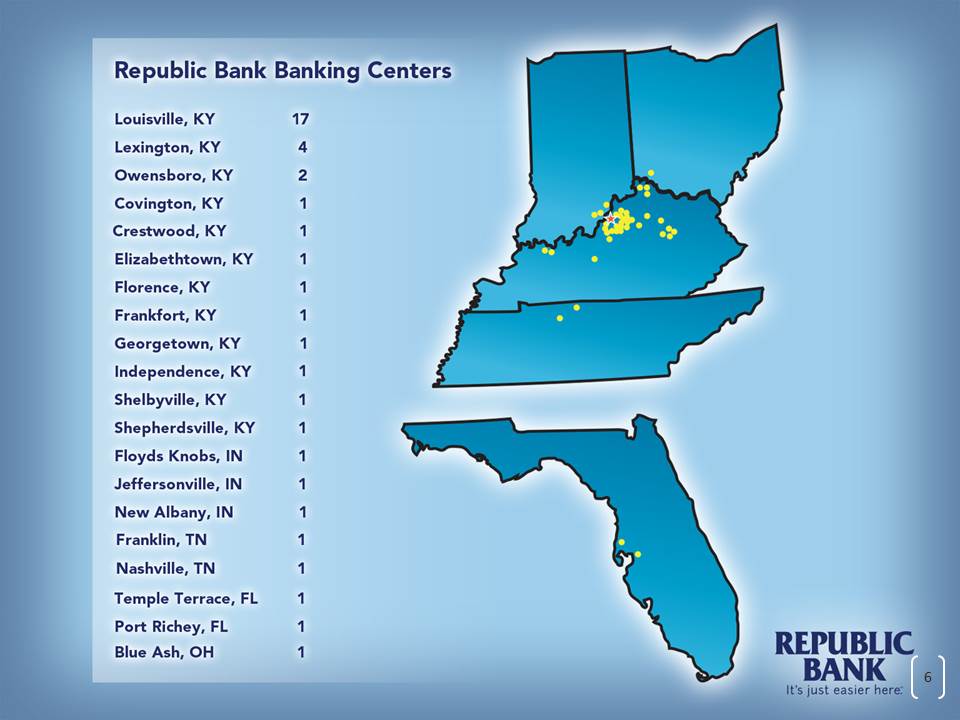
Republic Bank Banking Centers Louisville, KY 17 Lexington, KY 4 Owensboro, KY 2 Covington, KY 1 Elizabethtown, KY 1 Florence, KY 1 Frankfort, KY 1 Georgetown, KY 1 Independence, KY 1 Shelbyville, KY 1 Floyds Knobs, IN 1 Jeffersonville, IN 1 New Albany, IN 1 Franklin, TN 1 Nashville, TN Temple Terrace, FL 1 Port Richey, FL 1 Blue Ash, OH 1

Highlights Year ended December 31, 2014
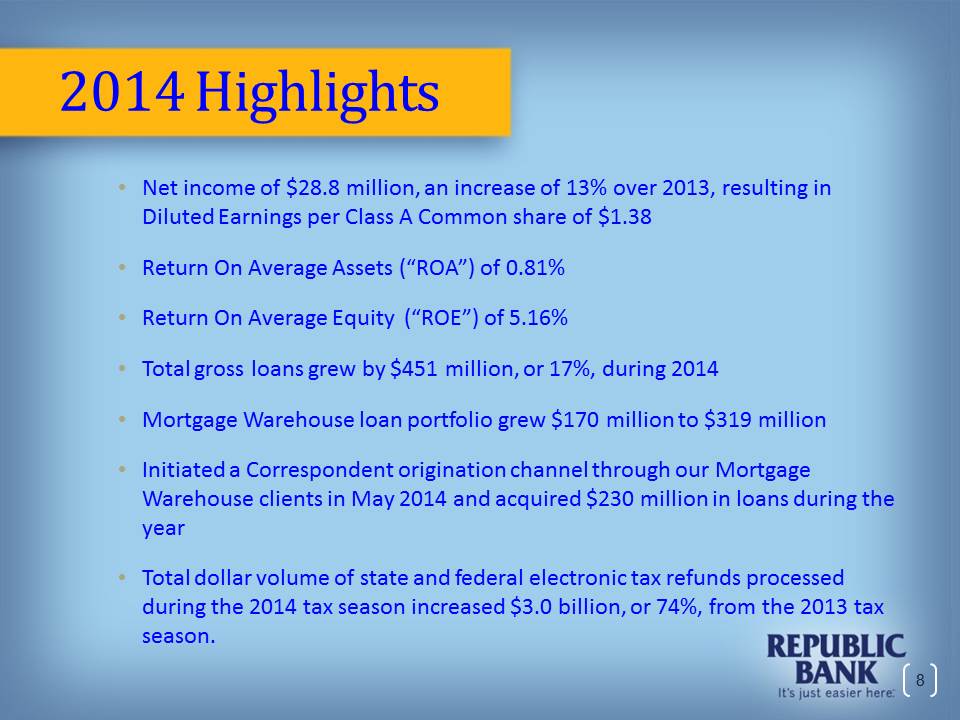
2014 Highlights Net income of $28.8 million, an increase of 13% over 2013, resulting in Diluted Earnings per Class A Common share of $1.38 Return On Average Assets (“ROA”) of 0.81% Return On Average Equity (“ROE”) of 5.16% Total gross loans grew by $451 million, or 17%, during 2014 Mortgage Warehouse loan portfolio grew $170 million to $319 million Initiated a Correspondent origination channel through our Mortgage Warehouse clients in May 2014 and acquired $230 million in loans during the year Total dollar volume of state and federal electronic tax refunds processed during the 2014 tax season increased $3.0 billion, or 74%, from the 2013 tax season.
2014 Highlights (continued) Capital ratios continued to exceed “well capitalized” with a total risk based capital ratio of 22.17% at year end Traditional Banking credit metrics continued to outperform peers Grew core deposit balances $60M, or 4% Increased quarterly cash dividend by 6%
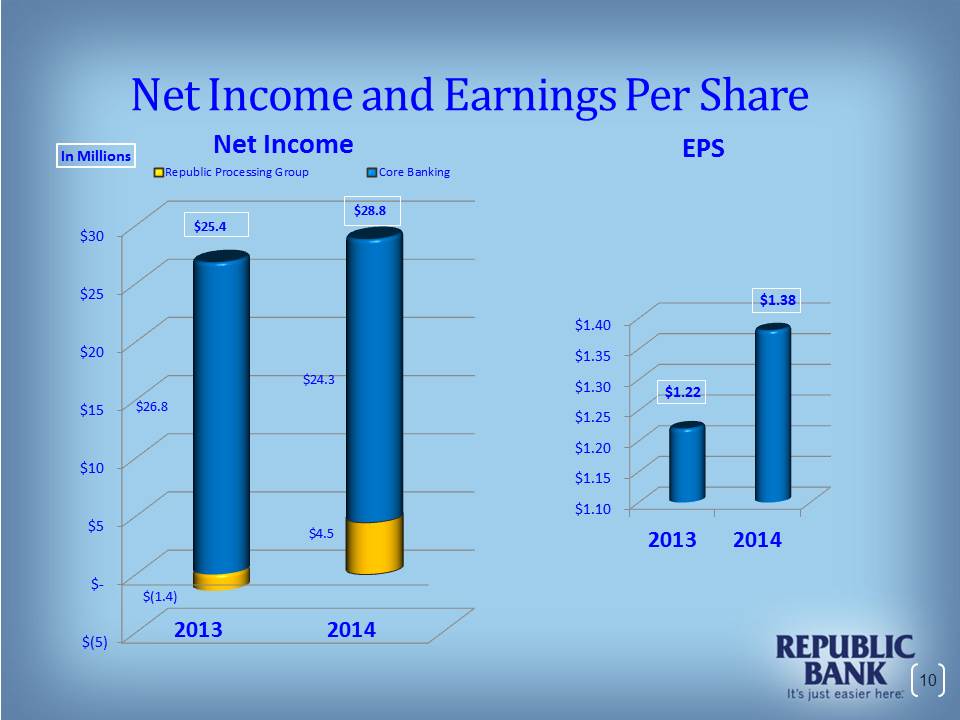
Net Income and Earnings Per Share In Millions Net Income Republic Processing Group Core Banking EPS $30 $25 $20 $15 $10 $5 $- $(5) $25.4 $28.8 $26.8 $24.3 $(1.4) $4.5 2013 2014 $1.40 $1.35 $1.30 $1.25 $1.20 $1.15 $1.10 $1.22 $1.38 2013 2014
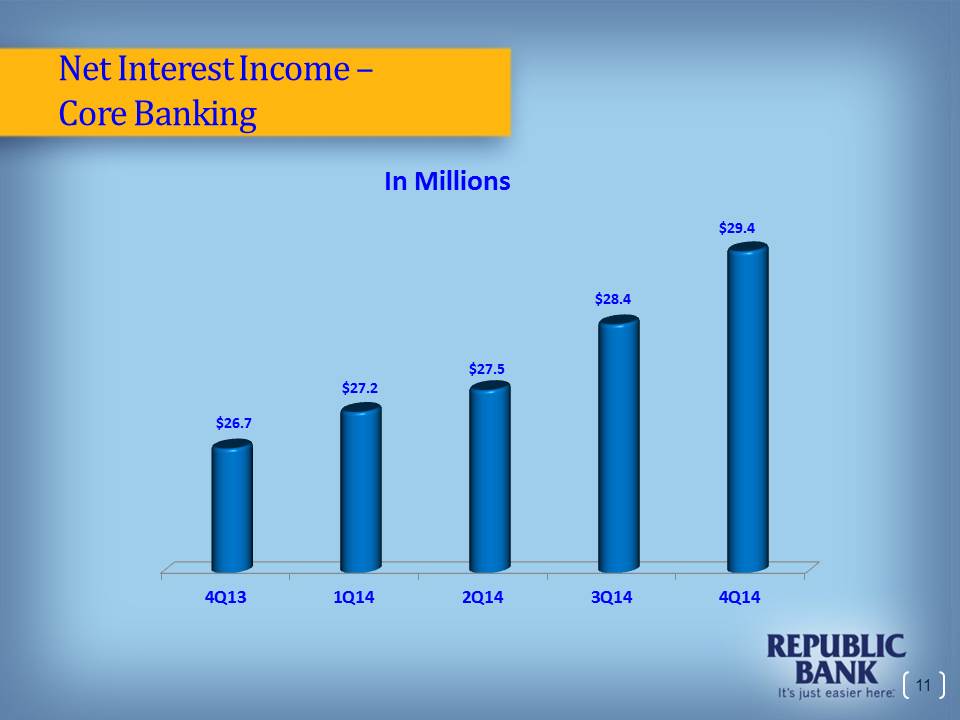
Net Interest Income – Core Banking In Millions $26.7 $27.2 $27.5 $28.4 $29.4 4Q13 1Q14 2Q14 3Q14 4Q14
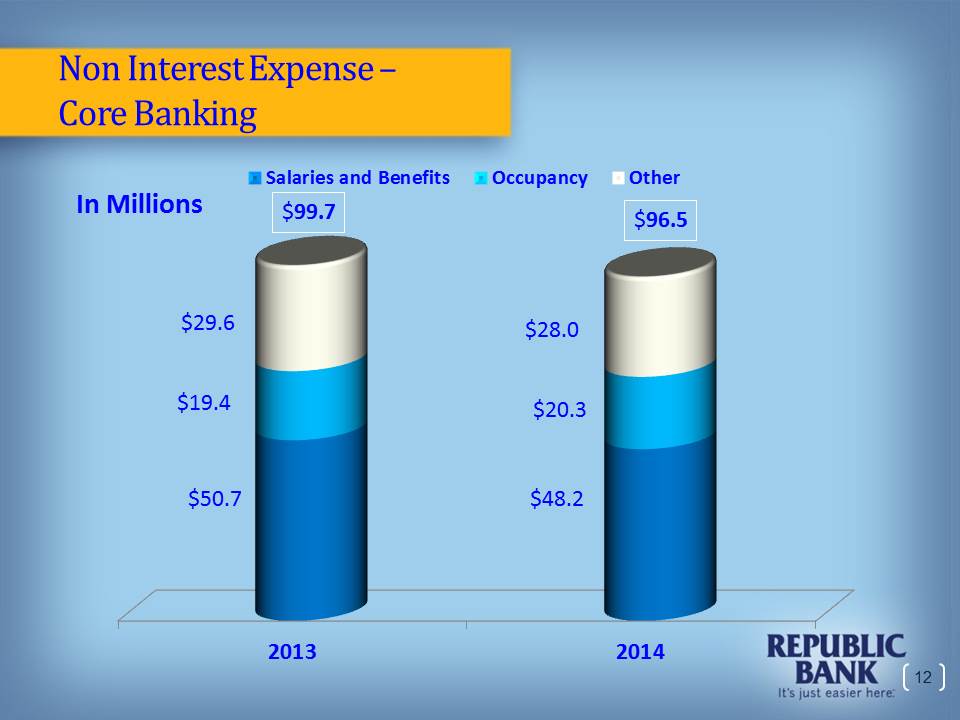
Non Interest Expense – Core Banking In Millions Salaries and Benefits Occupancy Other $99.7 $96.5 $29.6 $19.4 $50.7 $28.0 $20.3 $48.2 2013 2014

2015 Highlights
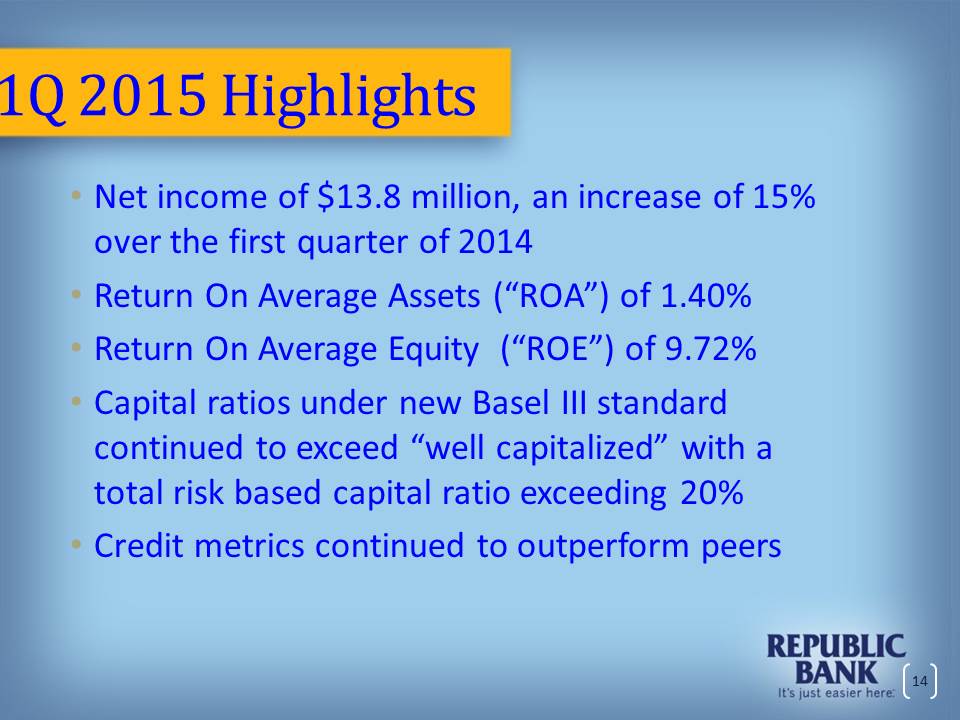
1Q 2015 Highlights Net income of $13.8 million, an increase of 15% over the first quarter of 2014 Return On Average Assets (“ROA”) of 1.40% Return On Average Equity (“ROE”) of 9.72% Capital ratios under new Basel III standard continued to exceed “well capitalized” with a total risk based capital ratio exceeding 20% Credit metrics continued to outperform peers
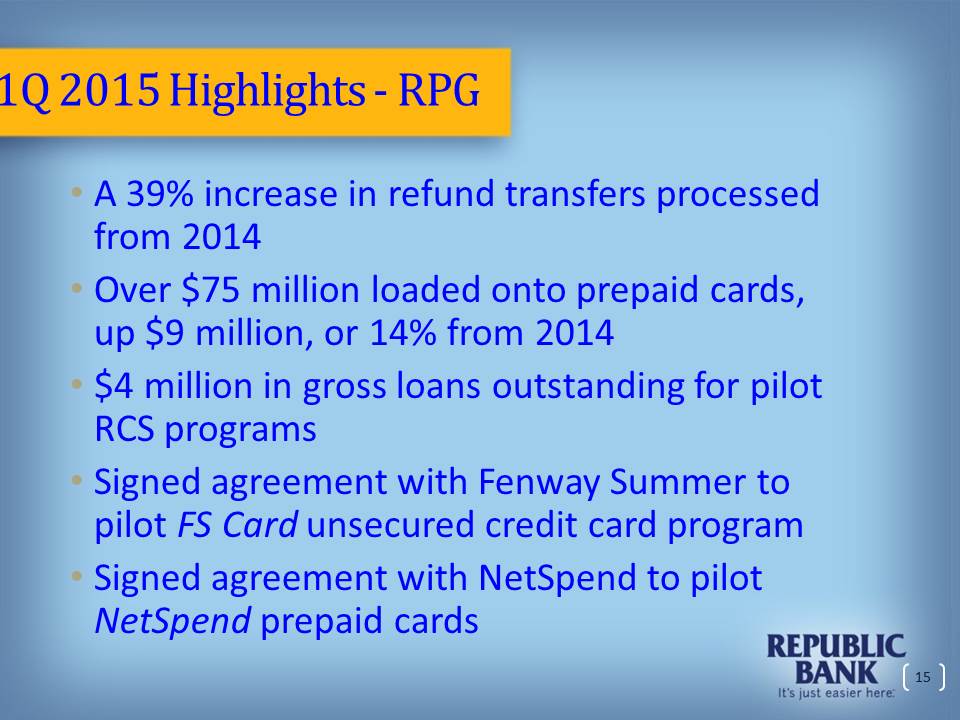
1Q 2015 Highlights - RPG A 39% increase in refund transfers processed from 2014 Over $75 million loaded onto prepaid cards, up $9 million, or 14% from 2014 $4 million in gross loans outstanding for pilot RCS programs Signed agreement with Fenway Summer to pilot FS Card unsecured credit card program Signed agreement with NetSpend to pilot NetSpend prepaid cards
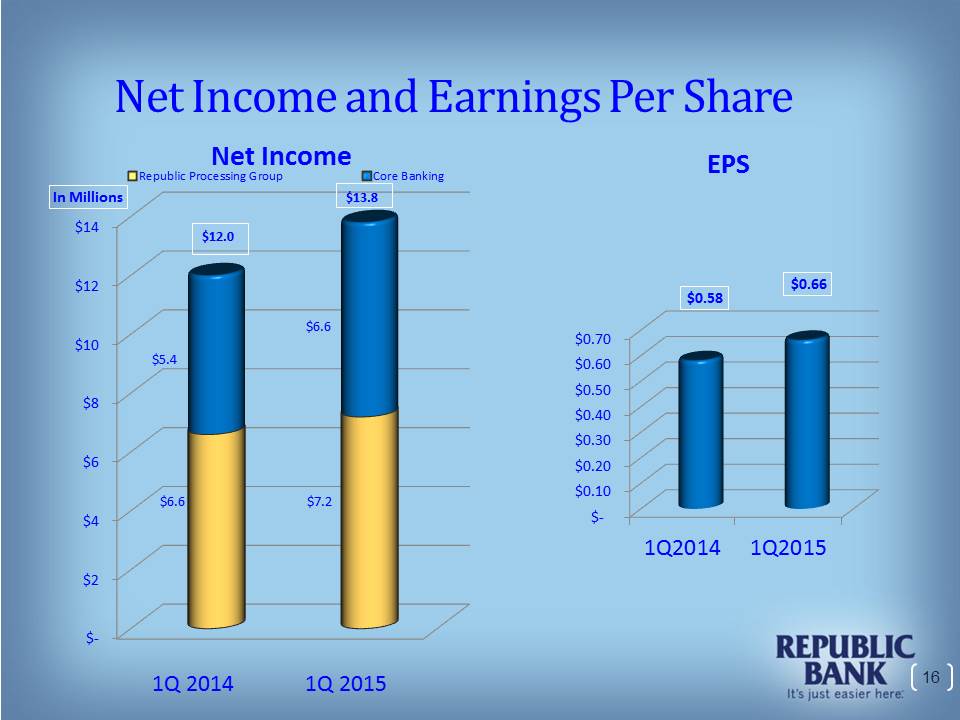
Net Income and Earnings Per Share Net Income Republic Processing Group Core Banking EPS In Millions $14 $12 $10 $8 $6 $4 $2 $- $12.0 $13.8 $5.4 $6.6 $6.6 $7.2 1Q 2014 1Q 2015 $0.70 $0.60 $0.50 $0.40 $0.30 $0.20 $0.10 $- $0.58 $0.66 1Q2014 1Q2015

Balance Sheet
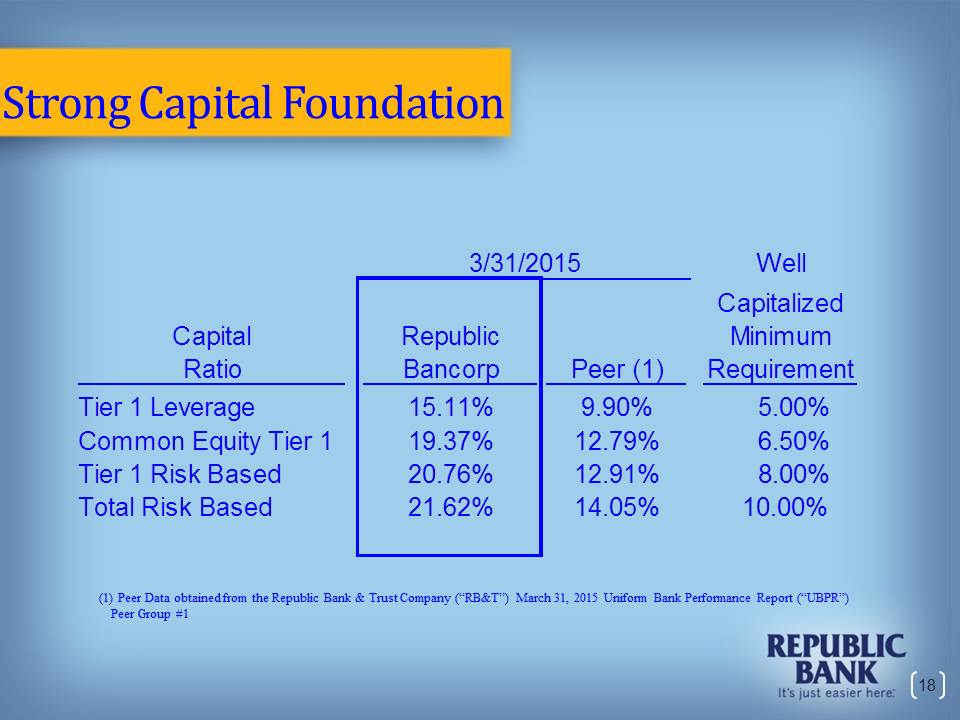
Strong Capital Foundation 3/31/2015 Capital Ratio Tier 1 Leverage Common Equity Tier 1 Tier 1 Risk Based Total Risk Based Republic Bancorp 15.11% 19.37% 20.76% 21.62% Peer (1) 9.90% 12.79% 12.91% 14.05% Well Capitalized Minimum Requirement 5.00% 6.50% 8.00% 10.00% (1) Peer Data obtained from the Republic Bank & Trust Company (“RB&T”) March 31, 2015 Uniform Bank Performance Report (“UBPR”) Peer Group #1
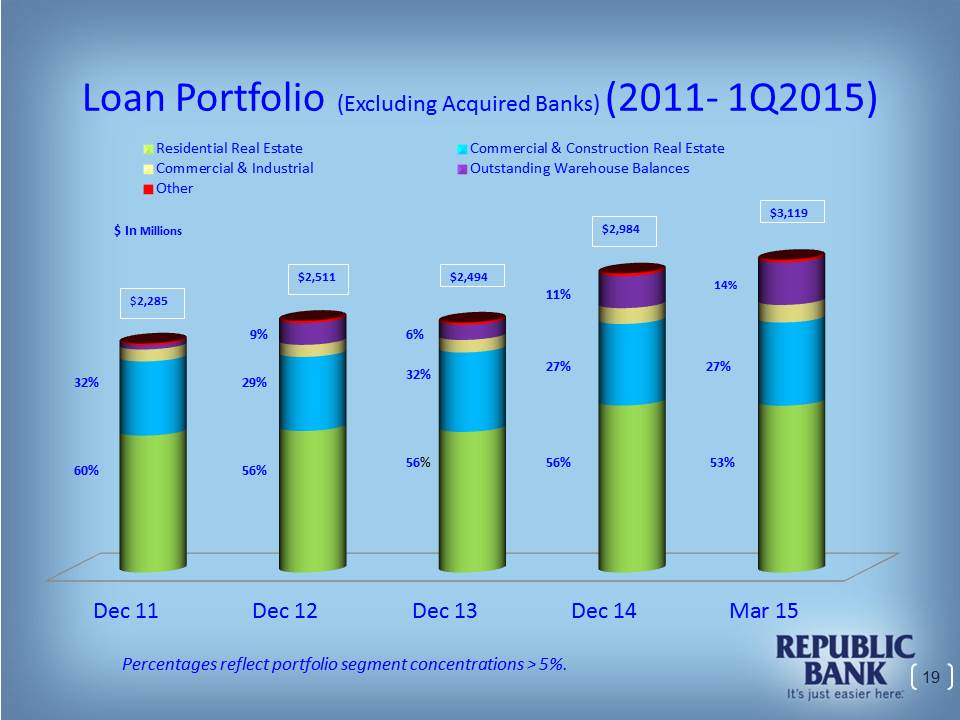
Loan Portfolio (Excluding Acquired Banks) (2011- 1Q2015) Residential Real Estate Commercial & Industrial Other Commercial & Construction Real Estate Outstanding Warehouse Balances $ In Millions $2,285 $2,511 $2,494 $2,984 $3,119 32% 60% 9% 29% 56% 6% 32% 56% 11% 27% 56% 14% 27% 53% Dec 11 Dec 12 Dec 13 Dec 14 Mar 15 Percentages reflect portfolio segment concentrations > 5%.
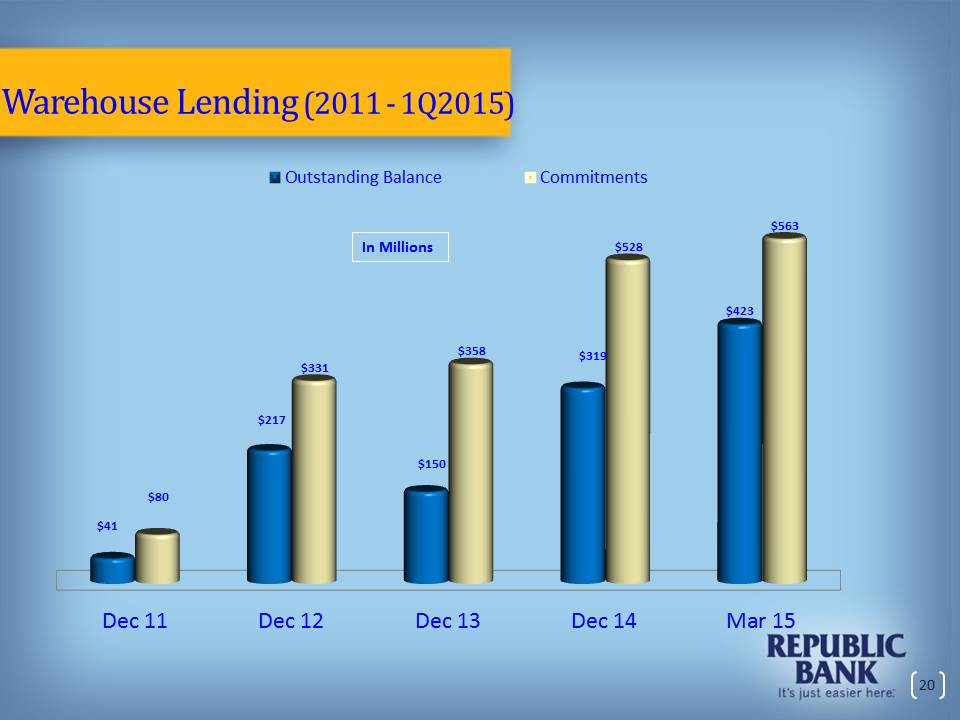
Warehouse Lending (2011 - 1Q2015) Outstanding Balance Commitments In Millions $41 $80 $217 $331 $150 $358 $319 $528 $423 $563 Dec 11 Dec 12 Dec 13 Dec 14 Mar 15
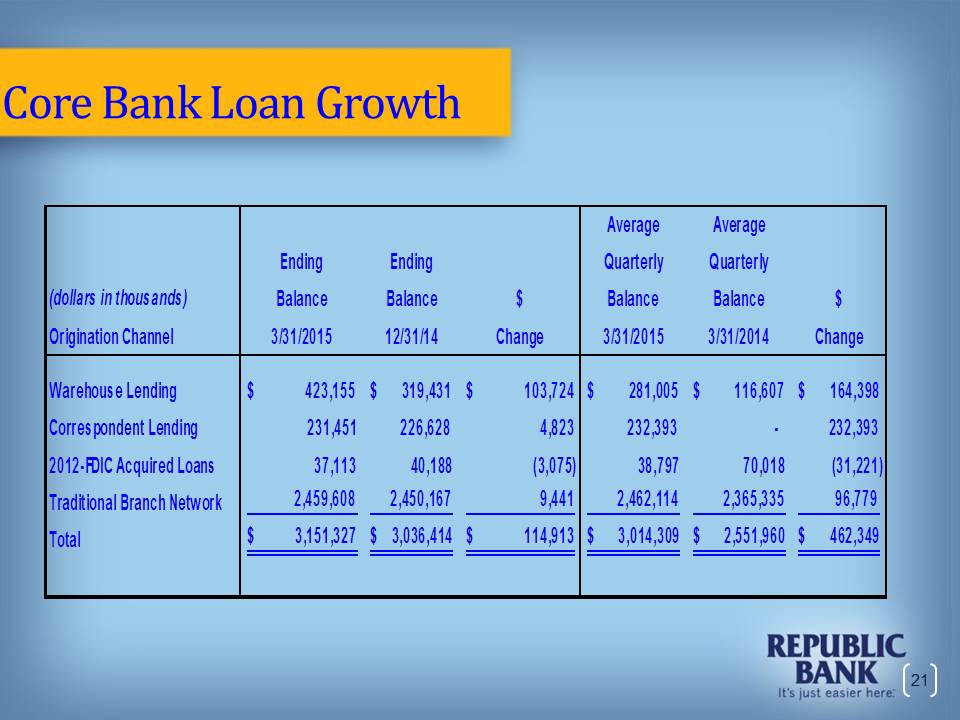
Core Bank Loan Growth (dollars in thousands) Origination Channel Ending Balance 3/31/2015 Ending Balance 12/31/14 $ Change Average Quarterly Balance 3/31/2015 Average Quarterly Balance 3/31/2014 $ Change Warehouse Lending Correspondent Lending 2012-FDIC Acquired Loans Traditional Branch Network Total $ 423,155 $ 319,431 $ 103,724 $ 281,005 $ 116,607 $ 164,398 231,451 226,628 4,823 232,393 232,393 - 232,393 37,113 40,188 (3,075) 38,797 70,018 (31,221) 2,459,608 2,450,167 9,441 2,462,114 2,365,335 96,779 $ 3,151,327 $ 3,036,414 $ 114,913 $ 3,014,309 $ 2,551,960 $ 462,349

Industry Strong Credit Quality
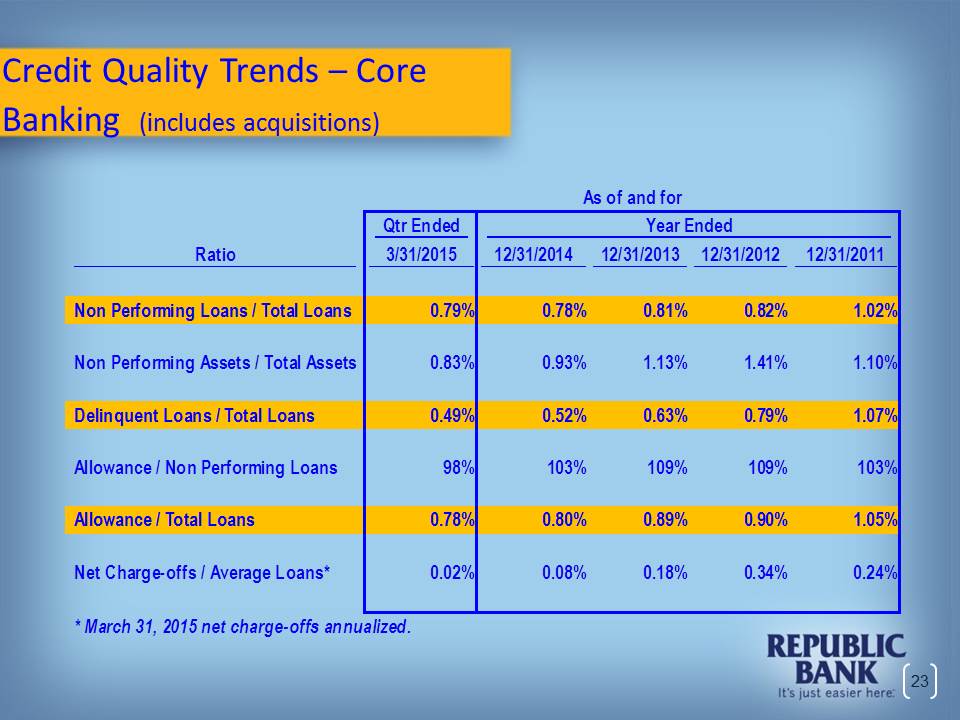
Credit Quality Trends – Core Banking (includes acquisitions) Ratio Qtr Ended 3/31/2015 As of and for Year Ended 12/31/2014 12/31/2013 12/31/2012 12/31/2011 Non Performing Loans / Total Loans 0.79% 0.78% 0.81% 0.82% 1.02% Non Performing Assets / Total Assets 0.83% 0.93% 1.13% 1.41% 1.10% Delinquent Loans / Total Loans 0.49% 0.52% 0.63% 0.79% 1.07% Allowance / Non Performing Loans 98% 103% 109% 109% 103% Allowance / Total Loans 0.78% 0.80% 0.89% 0.90% 1.05% Net Charge-offs / Average Loans* 0.02% 0.08% 0.18% 0.34% 0.24% *March 31, 2015 net charge-offs annualized.
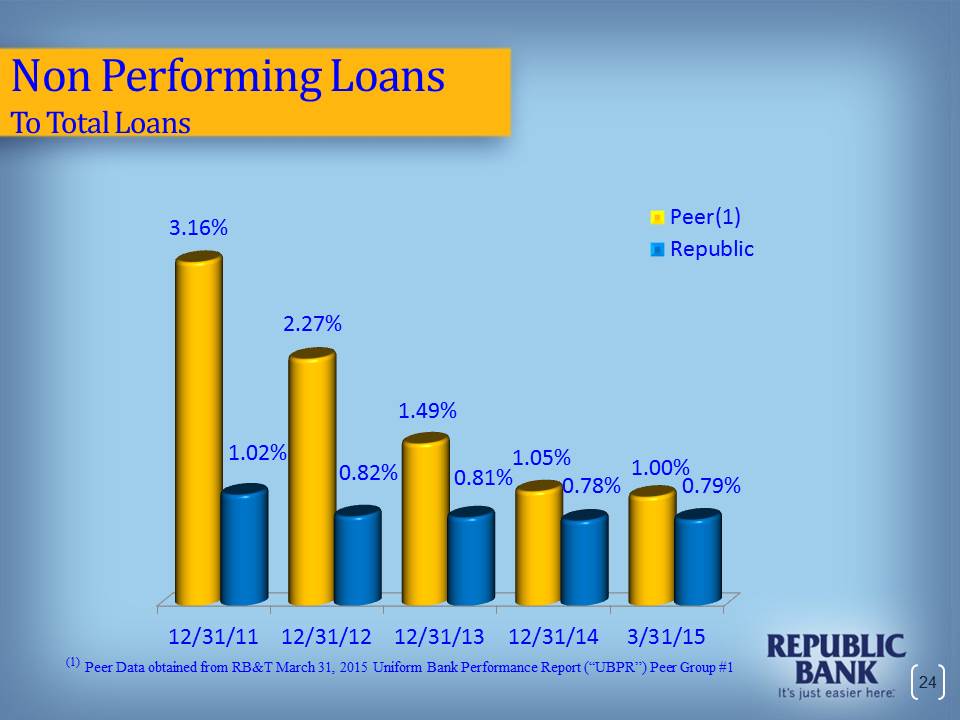
Non Performing Loans To Total Loans Peer(1) Republic 3.16% 1.02% 2.27% 0.82% 1.49% 0.81% 1.05% 0.78% 1.00% 0.79% 12/31/11 12/31/12 12/31/13 12/31/14 3/31/15 (1) Peer Data obtained from RB&T March 31, 2015 Uniform Bank Performance Report (“UBPR”) Peer Group #1
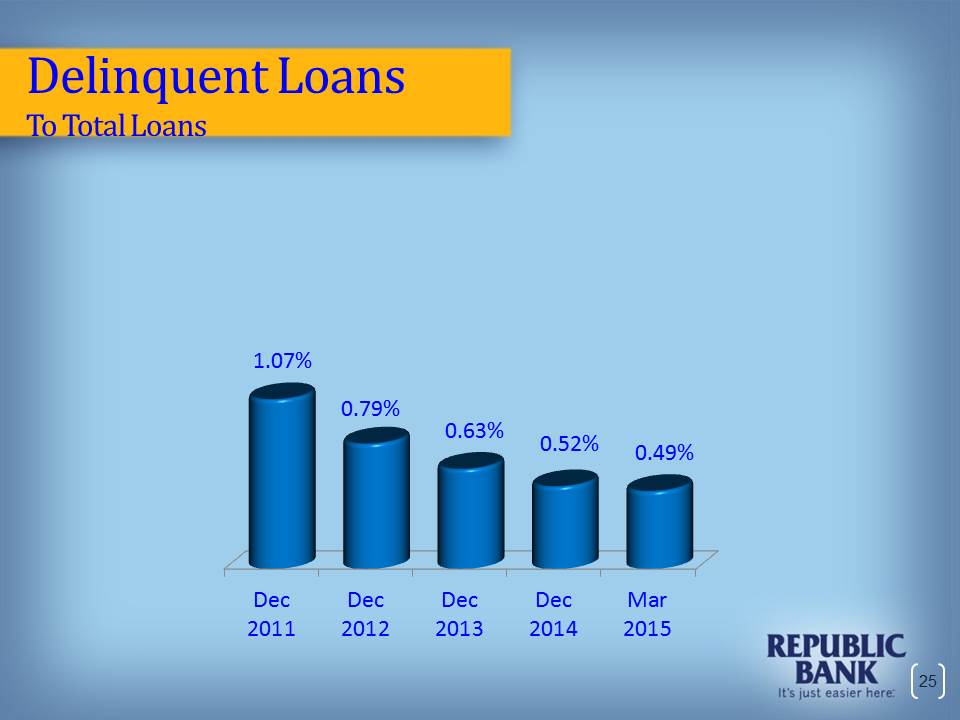
Delinquent Loans To Total Loans 1.07% 0.79% 0.63% 0.52% 0.49% Dec 2011 Dec 2012 Dec 2013 Dec 2014 Mar 2015
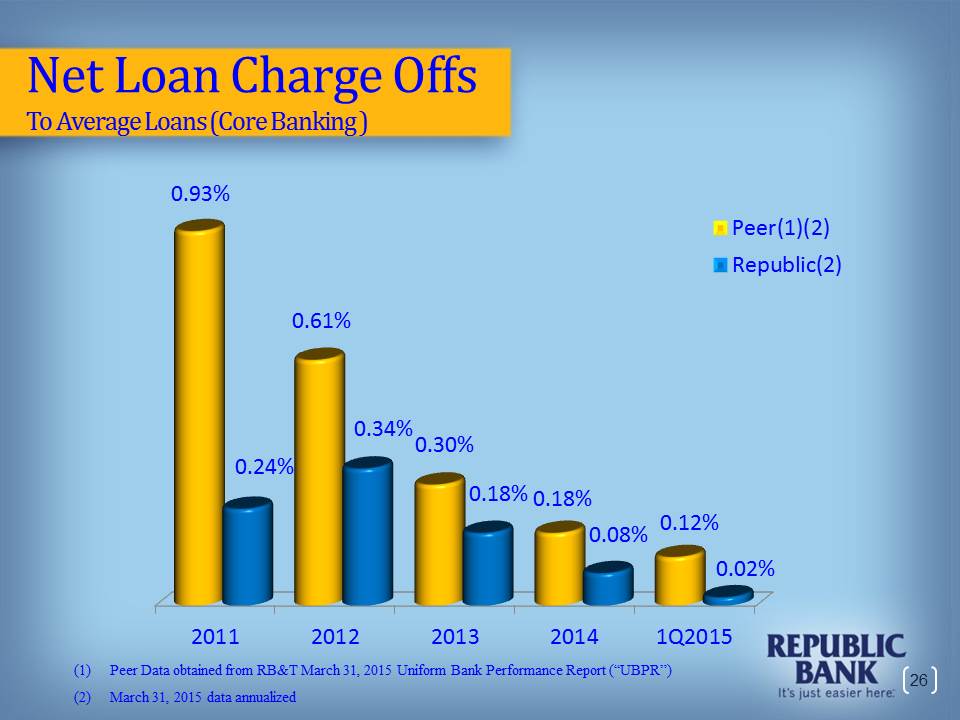
Net Loan Charge Offs To Average Loans (Core Banking ) Peer(1)(2) Republic(2) 0.93% 0.24% 0.61% 0.34% 0.30% 0.18% 0.18% 0.08% 0.12% 0.02% 2011 2012 2013 2014 1Q2015 (1) Peer Data obtained from RB&T March 31, 2015 Uniform Bank Performance Report (“UBPR”) (2) March 31, 2015 data annualized
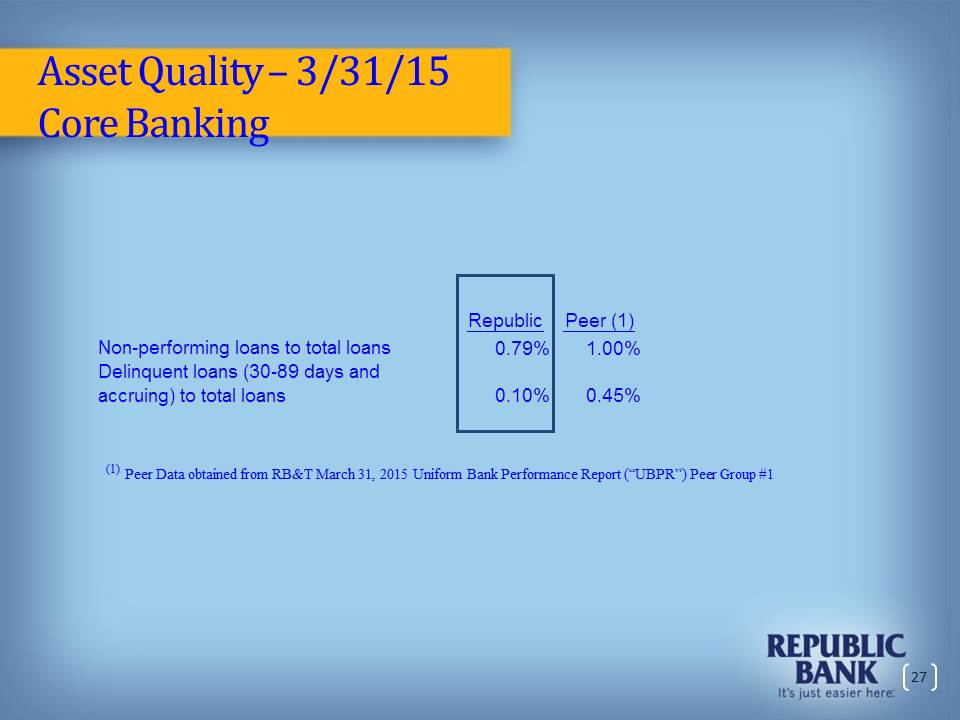
Asset Quality – 3/31/15 Core Banking Non-performing loans to total loans Delinquent loans (30-89 days and accruing) to total loans Republic 0.79% 0.10% Peer (1) 1.00% 0.45% (1) Peer Data obtained from RB&T March 31, 2015 Uniform Bank Performance Report (“UBPR”) Peer Group #1
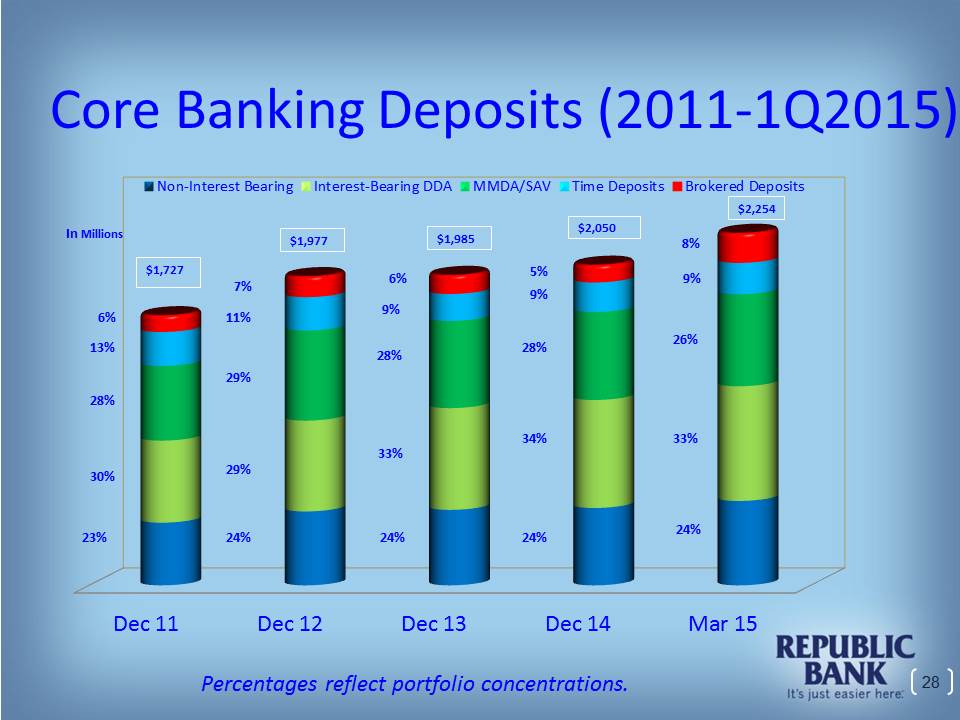
Core Banking Deposits (2011-1Q2015) Non-Interest Bearing Interest-Bearing DDA MMDA/SAV Time Deposits Brokered Deposits In Millions 6% 13% 28% 30% 23% $1,727 $1,977 $1,985 $2,050 $2,254 7% 11% 29% 29% 24% 6% 9% 28% 33% 24% 5% 9% 28% 34% 24% 8% 9% 26% 33% 24% Dec 11 Dec 12 Dec 13 Dec 14 Mar 15 Percentages reflect portfolio concentrations.
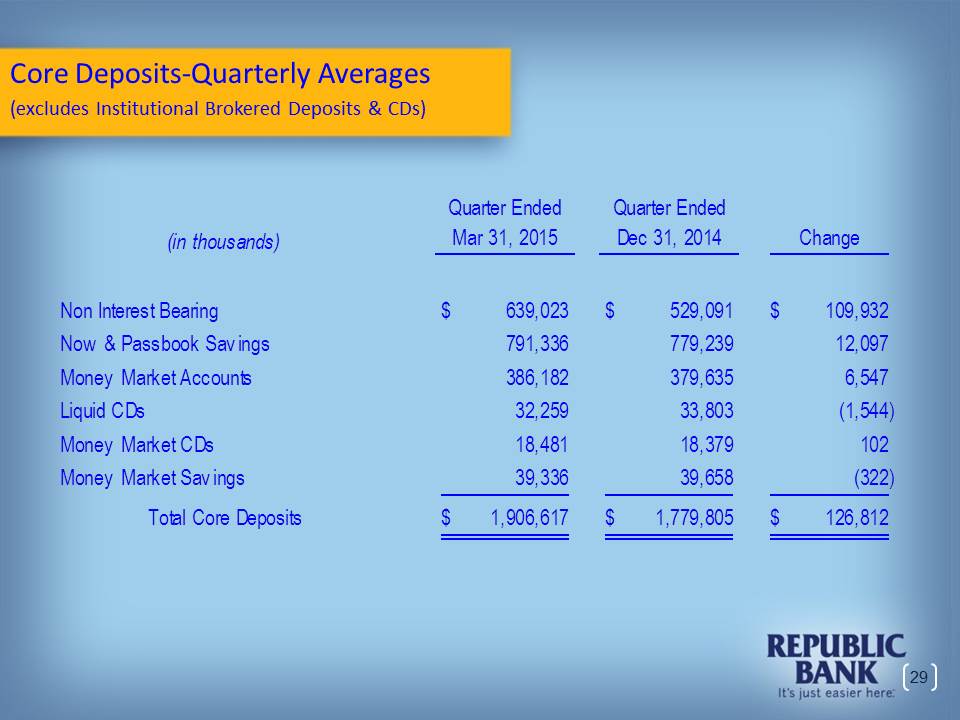
Core Deposits-Quarterly Averages (excludes Institutional Brokered Deposits & CDs) (in thousands) Quarter Ended Mar 31, 2015 Quarter Ended Dec 31, 2014 Change Non Interest Bearing $ 639,023 $ 529,091 $ 109,932 Now & Passbook Savings 791,336 779,239 12,097 Money Market Accounts 386,182 379,635 6,547 Liquid CDs 32,259 33,803 (1,544) Money Market CDs 18,481 18,379 102 Money Market Savings 39,336 39,658 (322) Total Core Deposits $ 1,906,617 $ 1,779,805 $ 126,812
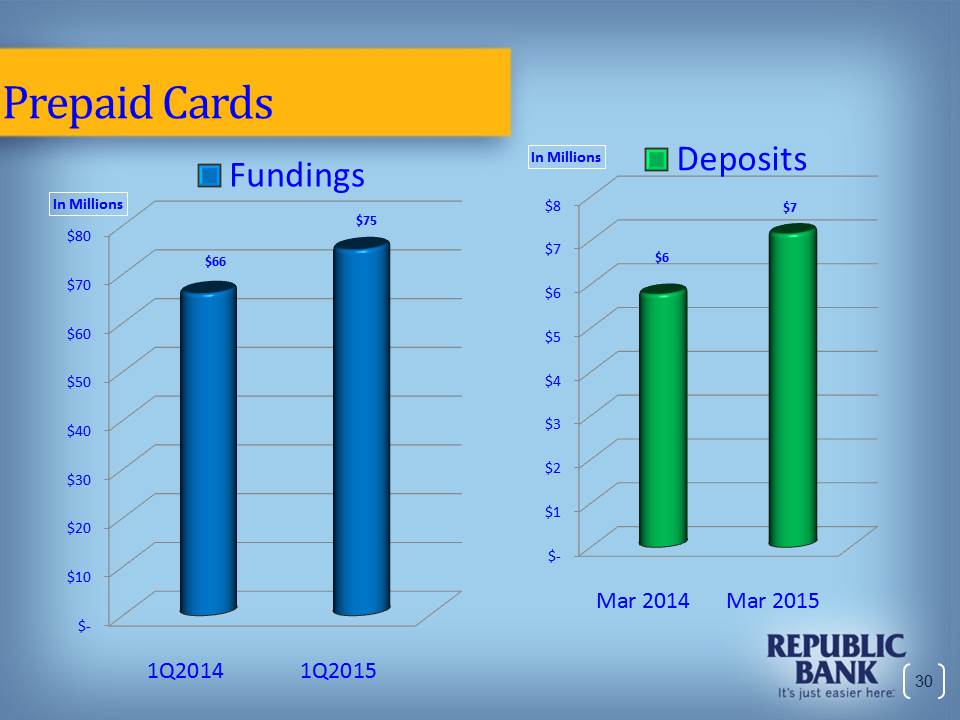
Prepaid Cards In Millions Fundings In Millions Deposits $80 $70 $60 $50 $40 $30 $20 $10 $- $66 $75 1Q2014 1Q2015 $8 $7 $6 $5 $4 $3 $2 $1 $- $6 $7 Mar 2014 Mar 2015
Interest Rate Management Strategy
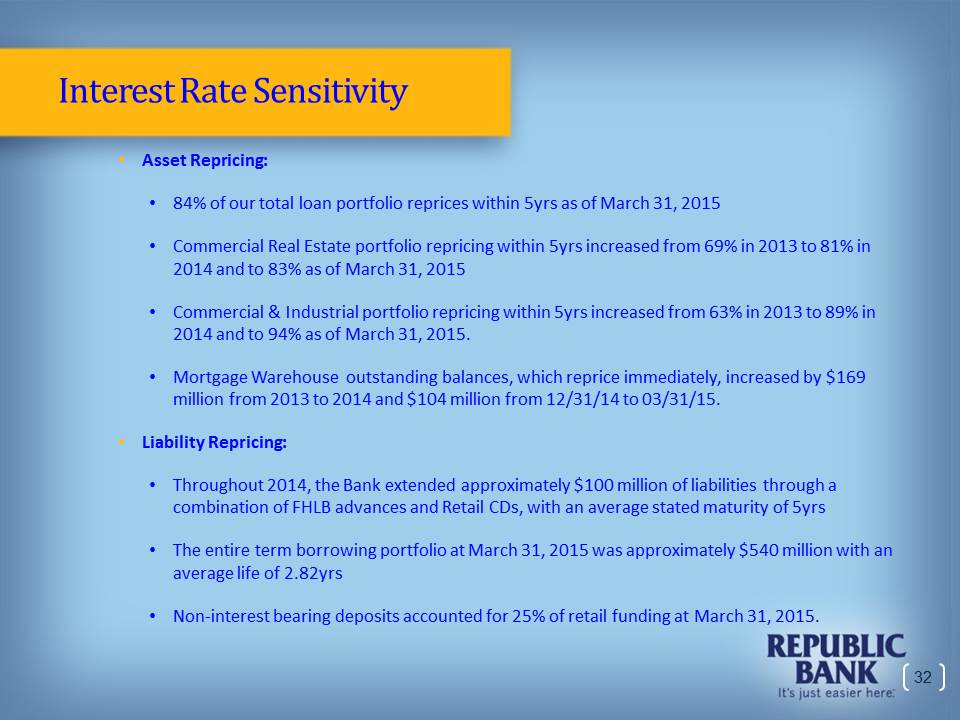
Interest Rate Sensitivity Asset Repricing: 84% of our total loan portfolio reprices within 5yrs as of March 31, 2015 Commercial Real Estate portfolio repricing within 5yrs increased from 69% in 2013 to 81% in 2014 and to 83% as of March 31, 2015 Commercial & Industrial portfolio repricing within 5yrs increased from 63% in 2013 to 89% in 2014 and to 94% as of March 31, 2015. Mortgage Warehouse outstanding balances, which reprice immediately, increased by $169 million from 2013 to 2014 and $104 million from 12/31/14 to 03/31/15. Liability Repricing: Throughout 2014, the Bank extended approximately $100 million of liabilities through a combination of FHLB advances and Retail CDs, with an average stated maturity of 5yrs The entire term borrowing portfolio at March 31, 2015 was approximately $540 million with an average life of 2.82yrs Non-interest bearing deposits accounted for 25% of retail funding at March 31, 2015.
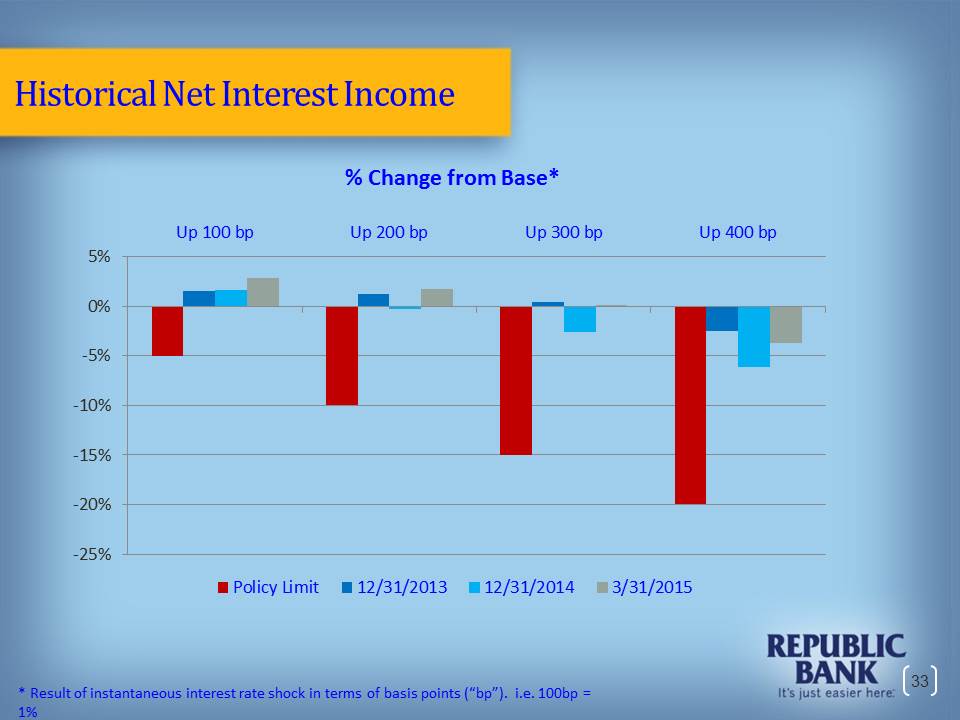
Historical Net Interest Income % Change from Base* Up 100 bp Up 200 bp Up 300 bp Up 400 bp 5% 0% -5% -10% -15% -20% -25% Policy Limit 12/31/2013 12/31/2014 3/31/2015 *Result of instantaneous interest rate shock in terms of basis points (“bp”). i.e. 100bp = 1%
Initiatives Bank acquisitions; either purchase or FDIC-assisted Grow traditional loan portfolios – commercial and retail loans Grow product lines – Warehouse Lending, Dealer Services, Equipment Lease Financing Expand new lines of business – Prepaid Cards, Short-term credit products Focus on core deposit growth initiatives

It’s just easier here. (SM)

THANK YOU