Exhibit 99.1
| Annual Meeting of Shareholders April 24, 2019 |

| During the course of this presentation, we will be providing you with a discussion of some of the factors we currently anticipate may influence the future results of Republic Bancorp, Inc. (“Republic” or the “Company”), as well as certain financial projections. We want to emphasize that these forward-looking statements involve judgment, and that individual judgments may vary. Moreover, these statements are based on limited information available to us now, which is subject to change. Actual results may differ substantially from what we say today and no one should assume later that the comments we provide today are still valid. They speak only as of today. Specific risk factors that could change causing our projections not to be achieved are discussed in the “Risk Factors” section of our Form 10-K filed with the Securities and Exchange Commission (“SEC”) on March 15, 2019, and other reports filed with the SEC from time to time. 2 Safe Harbor |
| STEVE TRAGER Chairman and Chief Executive Officer 3 |
| Market Presence 4 |

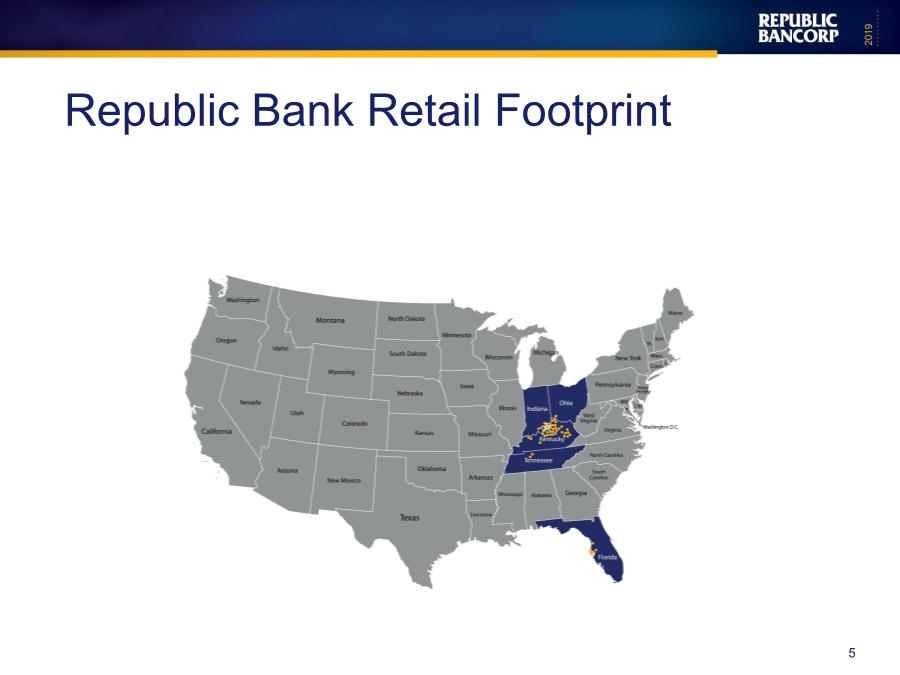
| Republic Bank Retail Footprint 5 |
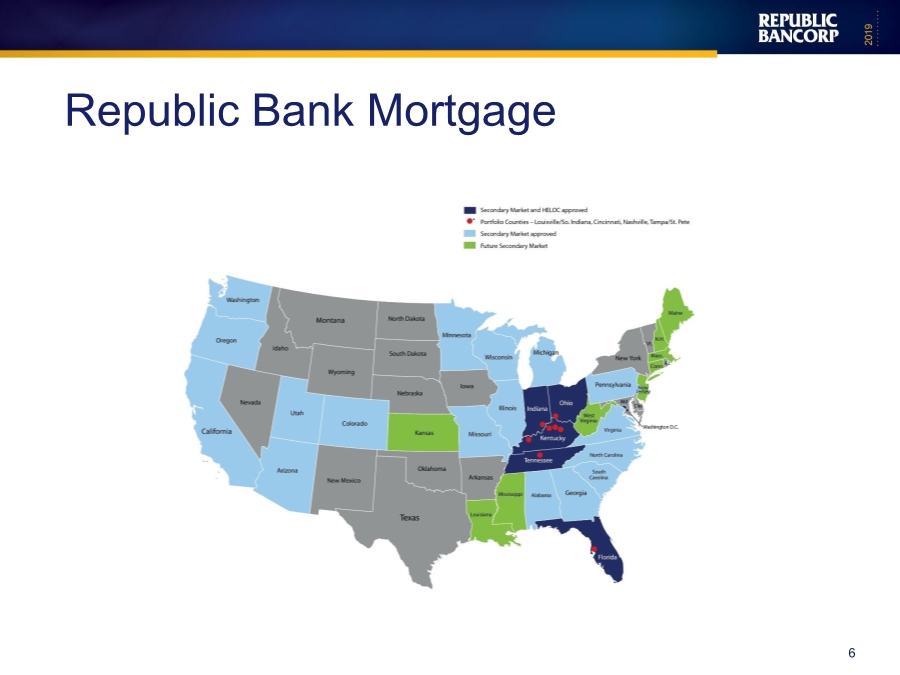
| Republic Bank Mortgage 6 |
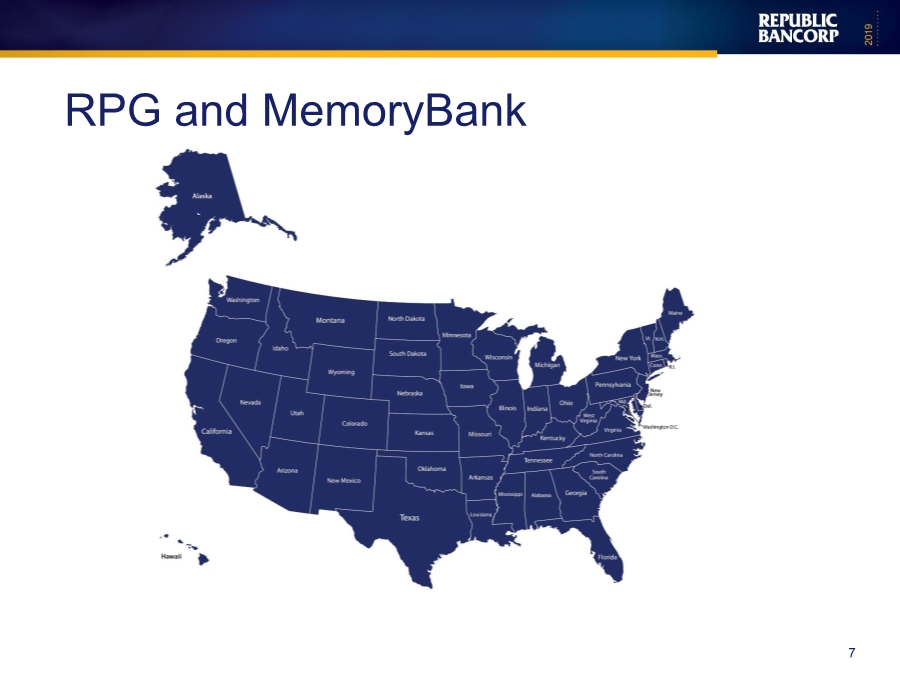
| RPG and MemoryBank 7 |
| Stock Information 8 |
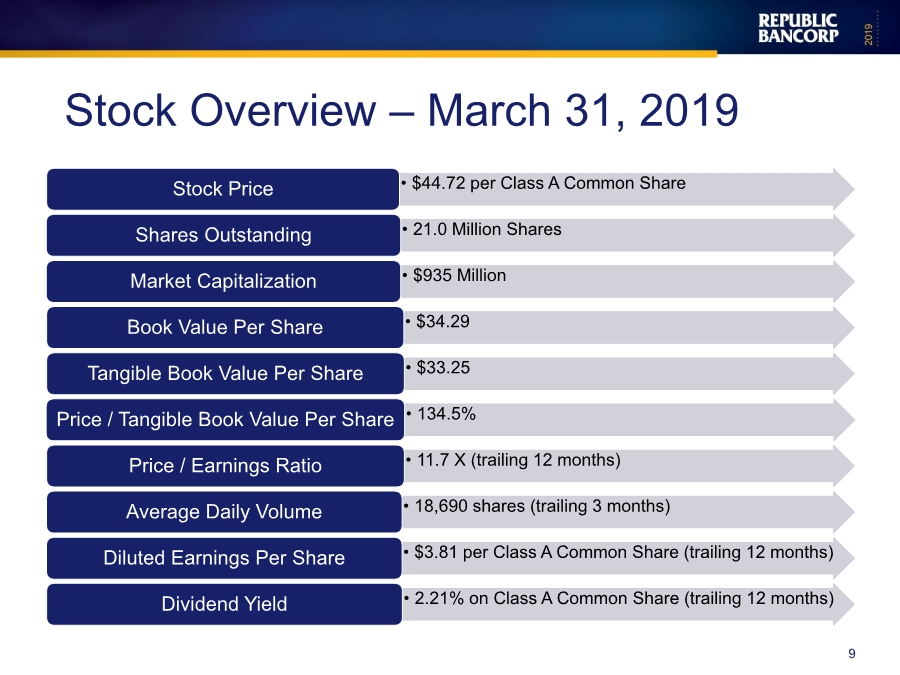
| • $44.72 per Class A Common ShareStock Price • 21.0 Million SharesShares Outstanding • $935 MillionMarket Capitalization • $34.29Book Value Per Share • $33.25Tangible Book Value Per Share • 134.5%Price / Tangible Book Value Per Share • 11.7 X (trailing 12 months)Price / Earnings Ratio • 18,690 shares (trailing 3 months)Average Daily Volume • $3.81 per Class A Common Share (trailing 12 months)Diluted Earnings Per Share • 2.21% on Class A Common Share (trailing 12 months)Dividend Yield 9 Stock Overview – March 31, 2019 |
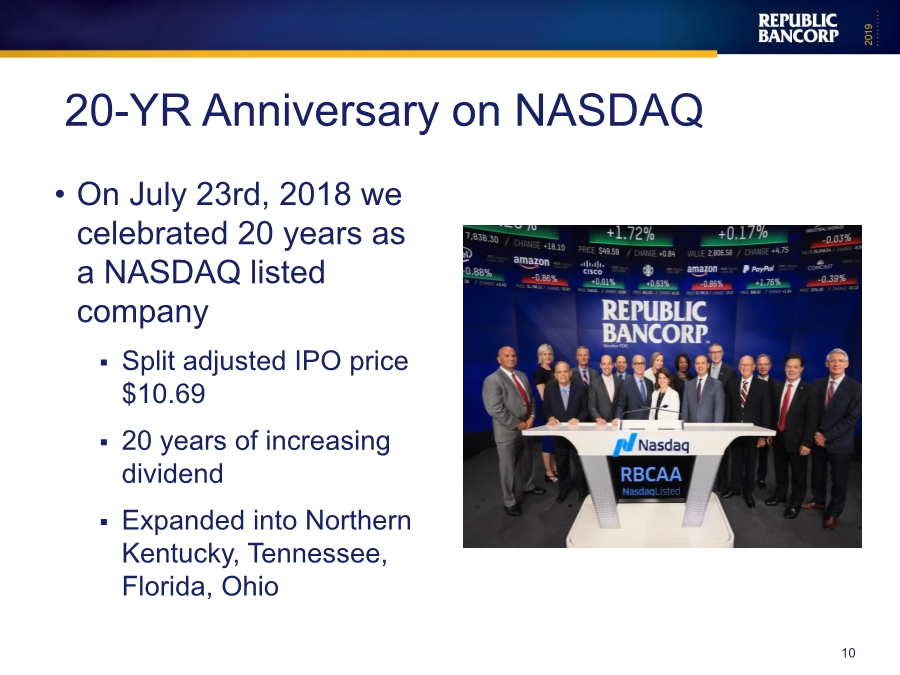
| 20-YR Anniversary on NASDAQ • On July 23rd, 2018 we celebrated 20 years as a NASDAQ listed company ▪ Split adjusted IPO price $10.69 ▪ 20 years of increasing dividend ▪ Expanded into Northern Kentucky, Tennessee, Florida, Ohio 10 |
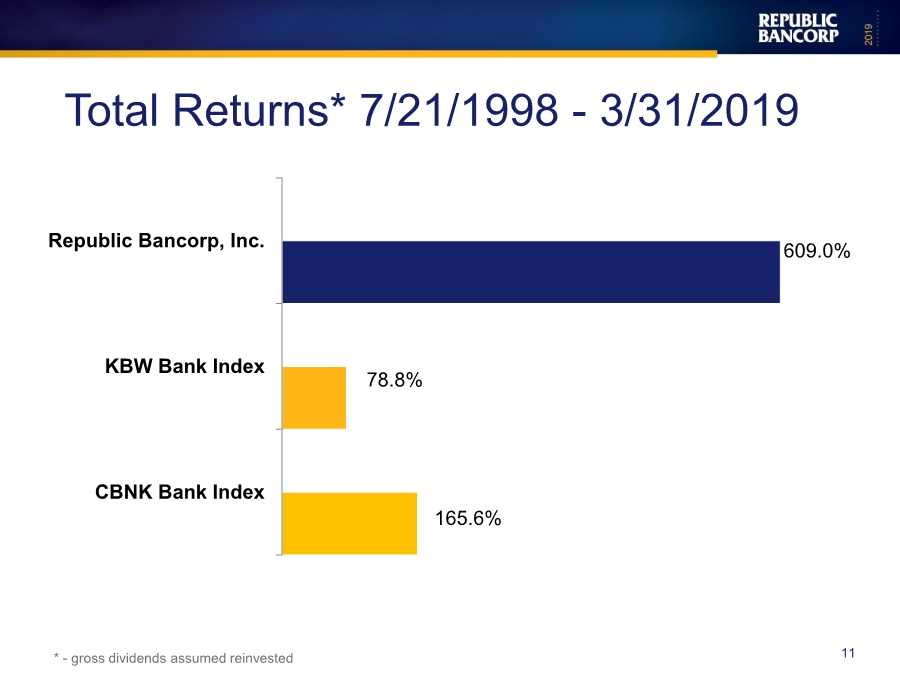
| 165.6% 78.8% 609.0% CBNK Bank Index KBW Bank Index Republic Bancorp, Inc. Total Returns* 7/21/1998 - 3/31/2019 * - gross dividends assumed reinvested 11 |
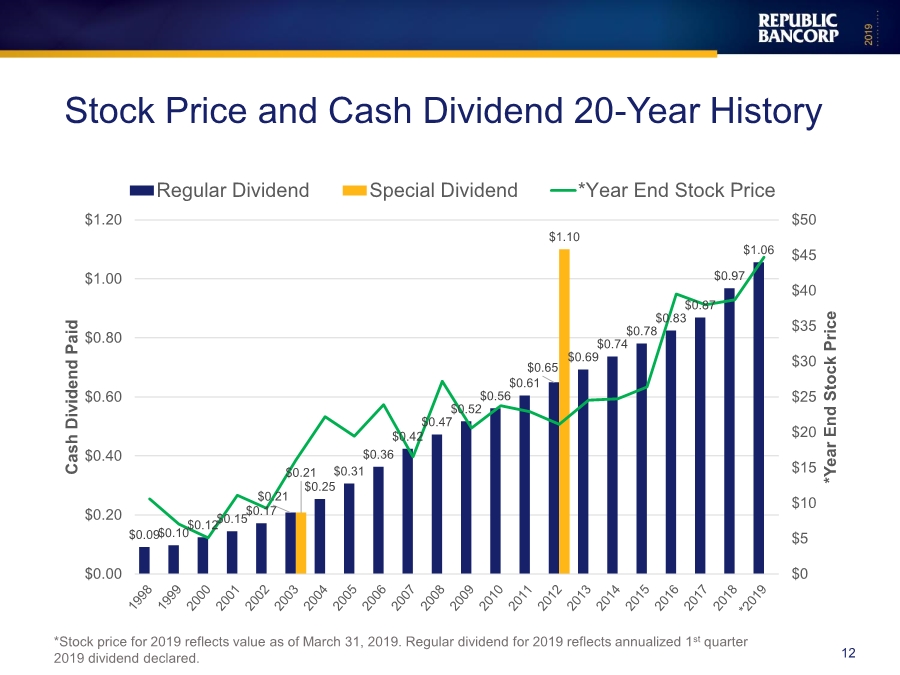
| Stock Price and Cash Dividend 20-Year History *Stock price for 2019 reflects value as of March 31, 2019. Regular dividend for 2019 reflects annualized 1st quarter 2019 dividend declared. 12 $0.09$0.10$0.12$0.15$0.17 $0.21 $0.25 $0.31 $0.36 $0.42 $0.47 $0.52 $0.56 $0.61 $0.65 $0.69 $0.74 $0.78 $0.83 $0.87 $0.97 $1.06 $0.21 $1.10 $0 $5 $10 $15 $20 $25 $30 $35 $40 $45 $50 $0.00 $0.20 $0.40 $0.60 $0.80 $1.00 $1.20 *Year End Stock Price Cash Dividend Paid Regular Dividend Special Dividend *Year End Stock Price |
| Highlights Year ended December 31, 2018 13 |
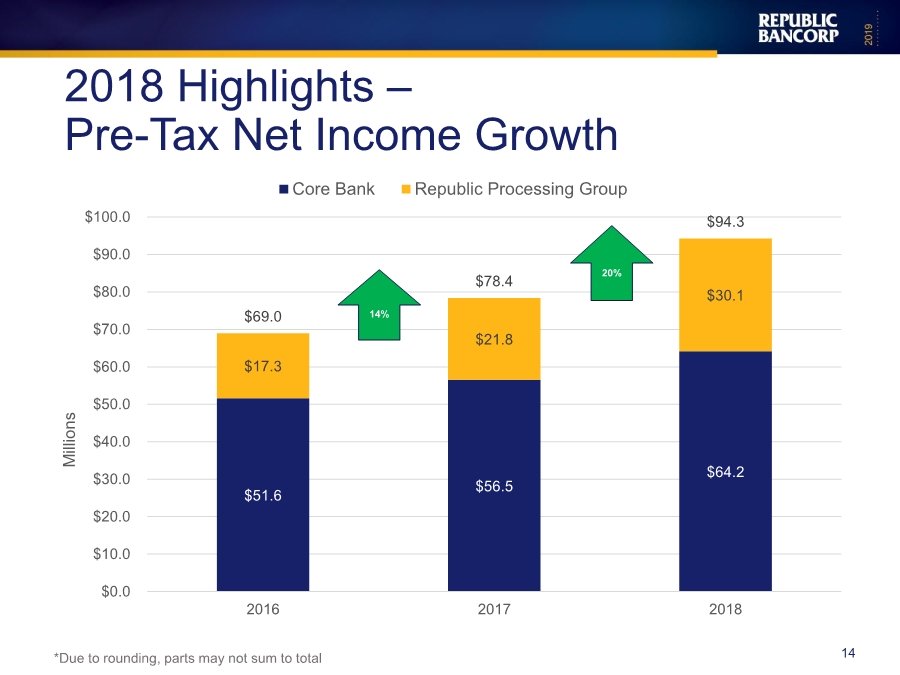
| $51.6 $56.5 $64.2 $17.3 $21.8 $30.1 $69.0 $78.4 $94.3 $0.0 $10.0 $20.0 $30.0 $40.0 $50.0 $60.0 $70.0 $80.0 $90.0 $100.0 2016 2017 2018 Millions Core Bank Republic Processing Group 2018 Highlights – Pre-Tax Net Income Growth *Due to rounding, parts may not sum to total 14 14% 20% |
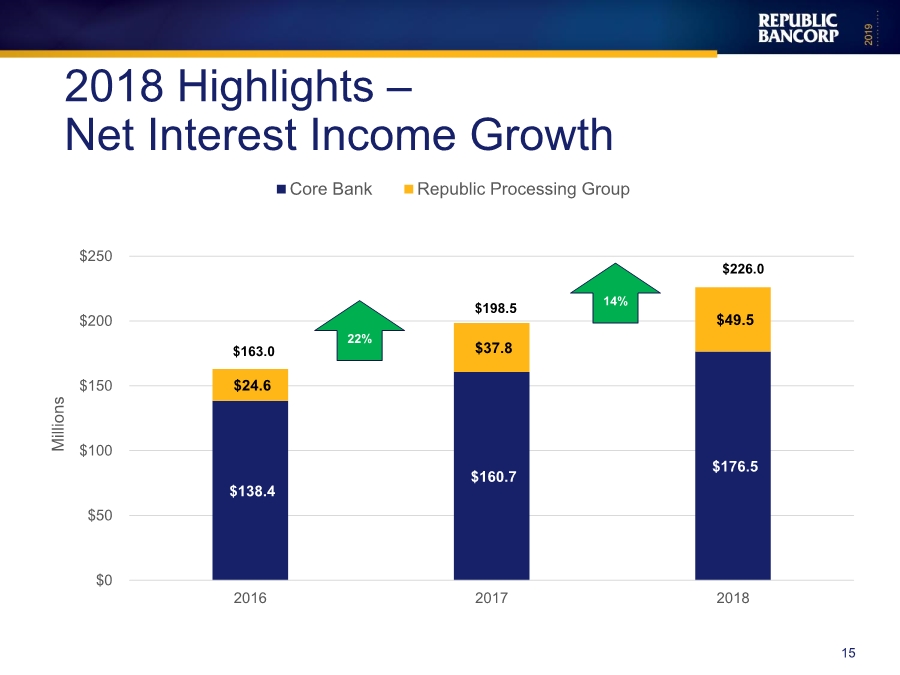
| $138.4 $160.7 $176.5 $24.6 $37.8 $49.5 $0 $50 $100 $150 $200 $250 2016 2017 2018 Millions Core Bank Republic Processing Group $163.0 $198.5 $226.0 2018 Highlights – Net Interest Income Growth 15 22% 14% |
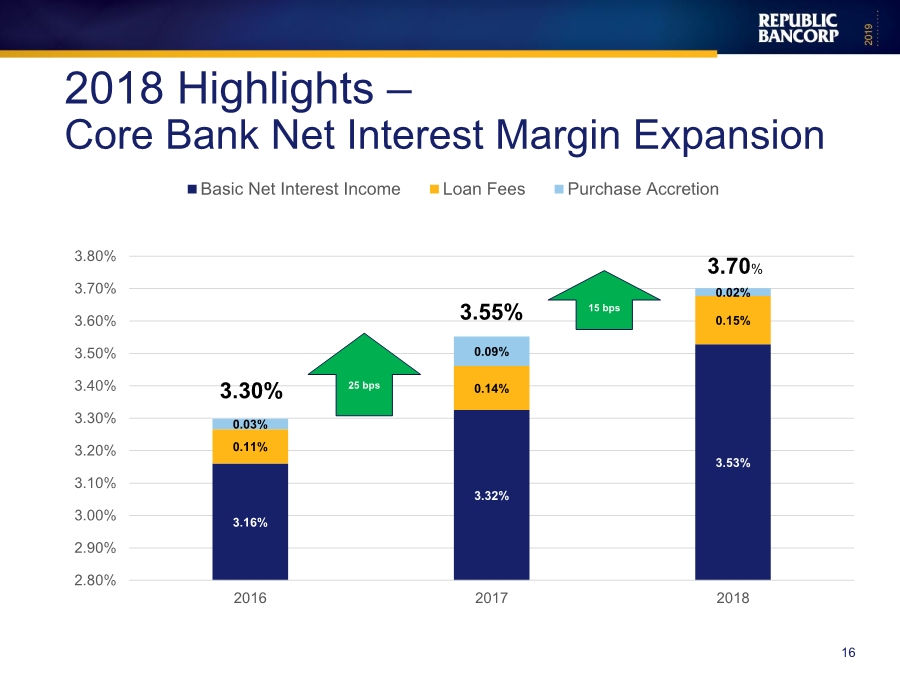
| 3.16% 3.32% 3.53% 0.11% 0.14% 0.15% 0.03% 0.09% 0.02% 2.80% 2.90% 3.00% 3.10% 3.20% 3.30% 3.40% 3.50% 3.60% 3.70% 3.80% 2016 2017 2018 Basic Net Interest Income Loan Fees Purchase Accretion 3.70% 15 bps 2018 Highlights – Core Bank Net Interest Margin Expansion 16 3.30% 3.55% 25 bps |
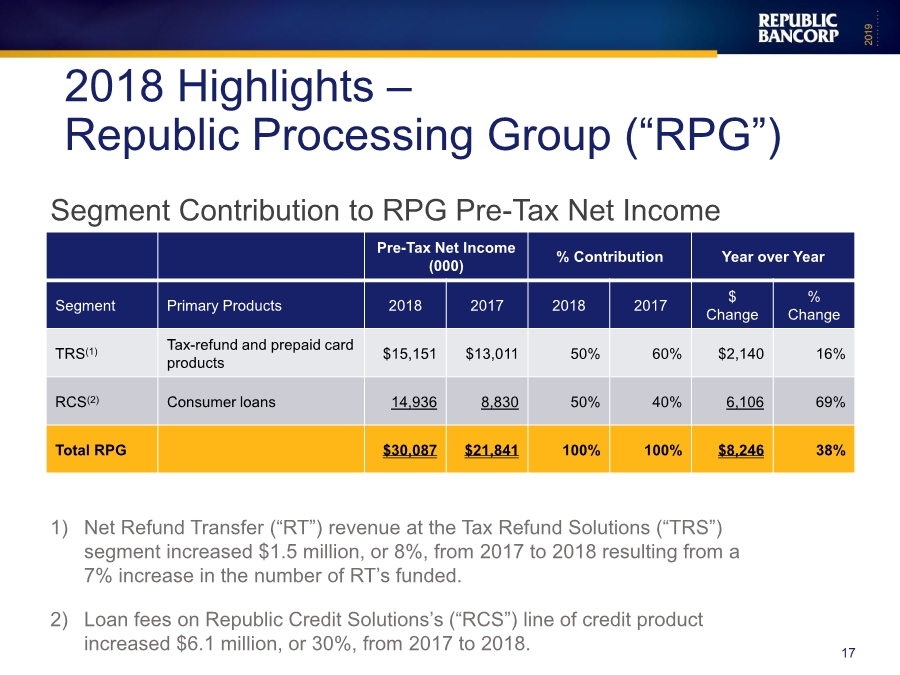
| Pre-Tax Net Income (000) % Contribution Year over Year Segment Primary Products 2018 2017 2018 2017 $ Change % Change TRS(1) Tax-refund and prepaid card products $15,151 $13,011 50% 60% $2,140 16% RCS(2) Consumer loans 14,936 8,830 50% 40% 6,106 69% Total RPG $30,087 $21,841 100% 100% $8,246 38% 2018 Highlights – Republic Processing Group (“RPG”) 1) Net Refund Transfer (“RT”) revenue at the Tax Refund Solutions (“TRS”) segment increased $1.5 million, or 8%, from 2017 to 2018 resulting from a 7% increase in the number of RT’s funded. 2) Loan fees on Republic Credit Solutions’s (“RCS”) line of credit product increased $6.1 million, or 30%, from 2017 to 2018. 17 Segment Contribution to RPG Pre-Tax Net Income |
| Balance Sheet 18 |

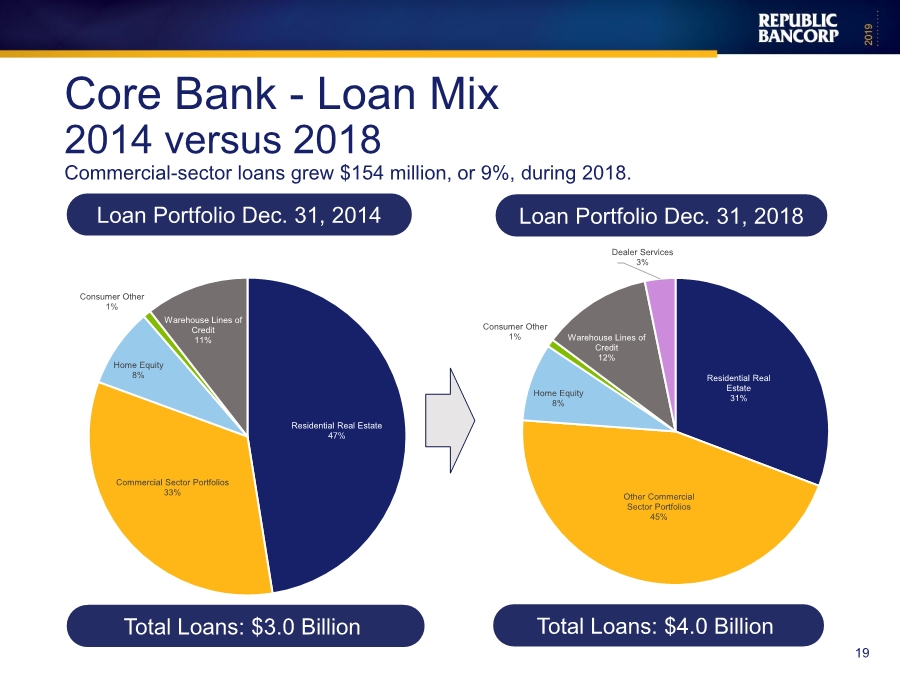
| Residential Real Estate 31% Other Commercial Sector Portfolios 45% Home Equity 8% Consumer Other 1% Warehouse Lines of Credit 12% Dealer Services 3% Core Bank - Loan Mix 2014 versus 2018 Commercial-sector loans grew $154 million, or 9%, during 2018. Residential Real Estate 47% Commercial Sector Portfolios 33% Home Equity 8% Consumer Other 1% Warehouse Lines of Credit 11% 19 Loan Portfolio Dec. 31, 2014 Total Loans: $3.0 Billion Loan Portfolio Dec. 31, 2018 Total Loans: $4.0 Billion |
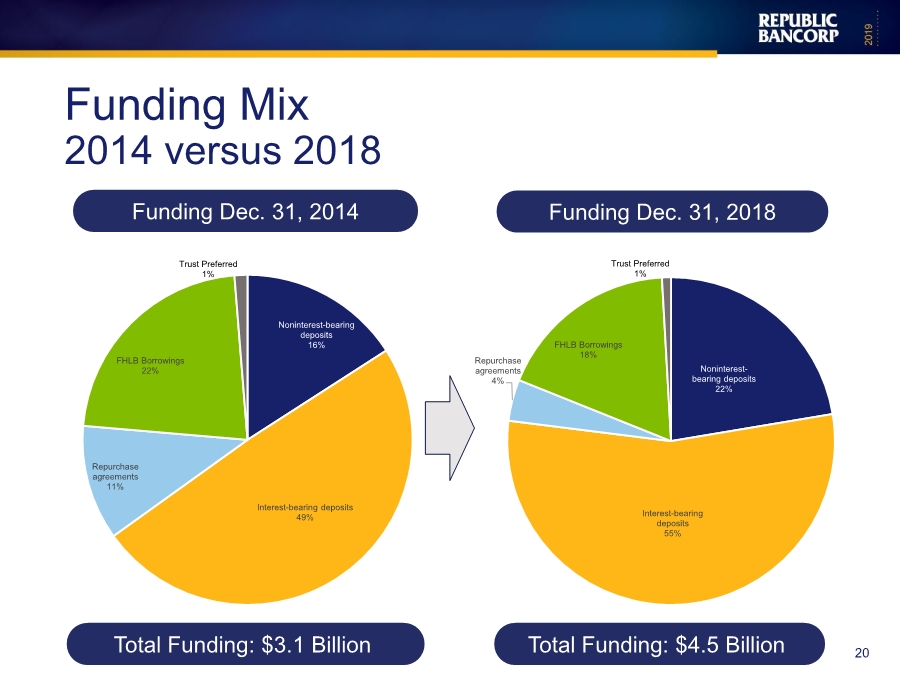
| Noninterest- bearing deposits 22% Interest-bearing deposits 55% Repurchase agreements 4% FHLB Borrowings 18% Trust Preferred 1% Funding Mix 2014 versus 2018 Noninterest-bearing deposits 16% Interest-bearing deposits 49% Repurchase agreements 11% FHLB Borrowings 22% Trust Preferred 1% 20 Funding Dec. 31, 2014 Total Funding: $3.1 Billion Funding Dec. 31, 2018 Total Funding: $4.5 Billion |
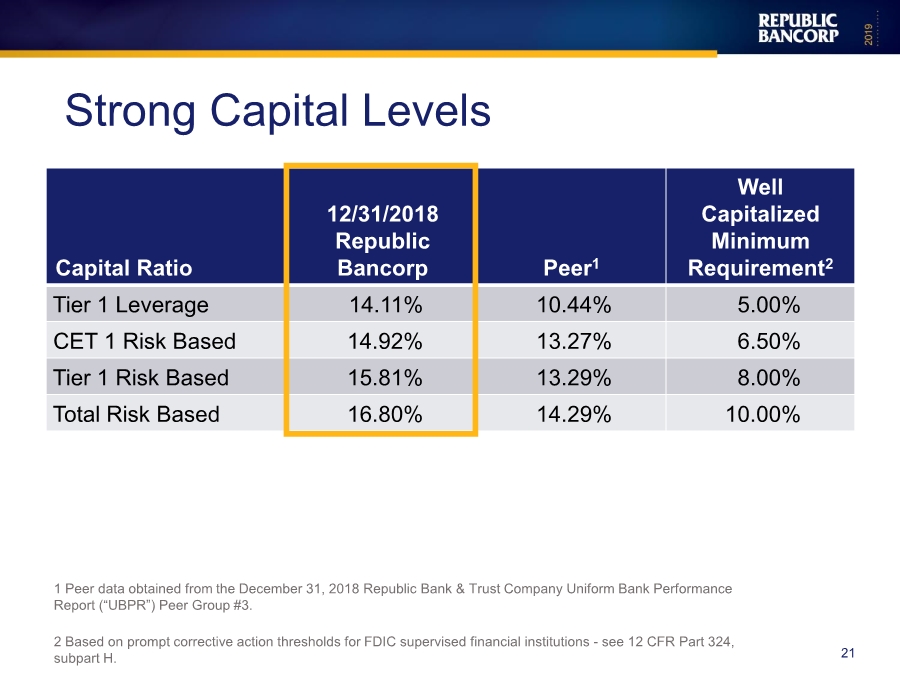
| Capital Ratio 12/31/2018 Republic Bancorp Peer1 Well Capitalized Minimum Requirement2 Tier 1 Leverage 14.11% 10.44% 5.00% CET 1 Risk Based 14.92% 13.27% 6.50% Tier 1 Risk Based 15.81% 13.29% 8.00% Total Risk Based 16.80% 14.29% 10.00% Strong Capital Levels 1 Peer data obtained from the December 31, 2018 Republic Bank & Trust Company Uniform Bank Performance Report (“UBPR”) Peer Group #3. 2 Based on prompt corrective action thresholds for FDIC supervised financial institutions - see 12 CFR Part 324, subpart H. 21 |
| Continued Strong Credit Quality 22 |
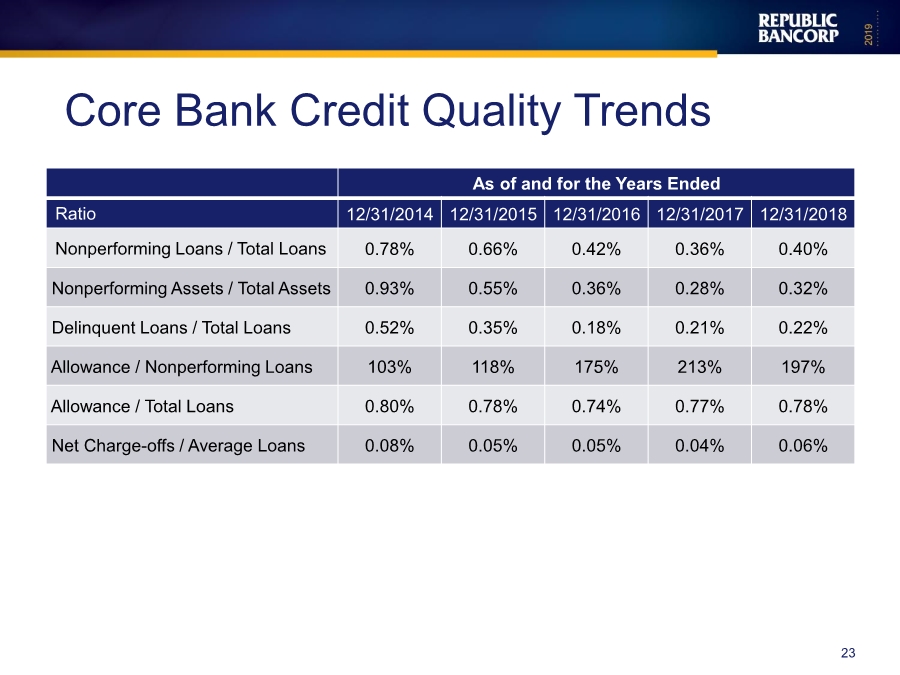
| As of and for the Years Ended Ratio 12/31/2014 12/31/2015 12/31/2016 12/31/2017 12/31/2018 Nonperforming Loans / Total Loans 0.78% 0.66% 0.42% 0.36% 0.40% Nonperforming Assets / Total Assets 0.93% 0.55% 0.36% 0.28% 0.32% Delinquent Loans / Total Loans 0.52% 0.35% 0.18% 0.21% 0.22% Allowance / Nonperforming Loans 103% 118% 175% 213% 197% Allowance / Total Loans 0.80% 0.78% 0.74% 0.77% 0.78% Net Charge-offs / Average Loans 0.08% 0.05% 0.05% 0.04% 0.06% Core Bank Credit Quality Trends 23 |
| Interest Rate Management Strategy 24 |
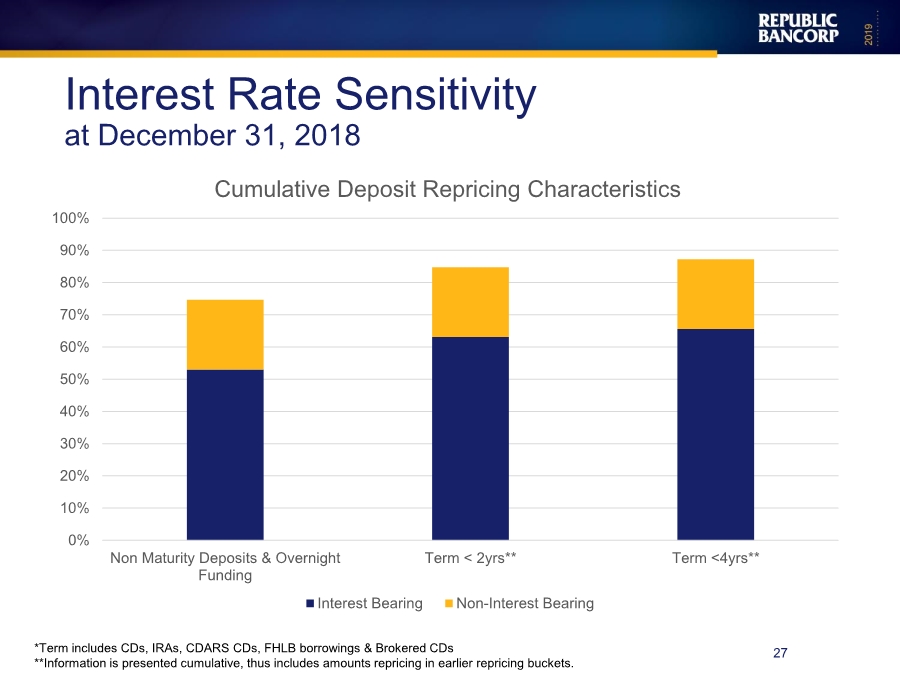
| • Asset Repricing ▪ 87% of our total loan portfolio reprices within 5 years as of December 31, 2018. ▪ 87% of the Commercial Real Estate portfolio reprices within 5 years. ▪ 95% of the Commercial & Industrial portfolio reprices within 5 years. ▪ Mortgage Warehouse balances, which reprice immediately, averaged $495 million in 2018. • Liability Repricing ▪ Growth in core, non-maturity deposits (“NMD”) has reduced the Bank’s need for term FHLB advances, which has resulted in a lower cost of funds. ▪ Noninterest-bearing deposits accounted for 34% of retail funding at December 31, 2018. ▪ The Bank has maintained a prudent pricing strategy for NMD as rates have risen, which positively impacts both net interest income and market value of equity. Interest Rate Sensitivity at December 31, 2018 25 |

| 26 Interest Rate Sensitivity at December 31, 2018 0% 10% 20% 30% 40% 50% 60% 70% 80% 90% 100% Within 30 Days < 1 Year** < 5 Years** Cumulative Loan Repricing Characteristics Residential & HELOC CRE C&I, C&D Warehouse Other *The above is based on the Bank’s dynamic simulation model and assumes prepayments. **Information is presented cumulative, thus includes amounts repricing in earlier repricing buckets. |

| 27 Interest Rate Sensitivity at December 31, 2018 0% 10% 20% 30% 40% 50% 60% 70% 80% 90% 100% Non Maturity Deposits & Overnight Funding Term < 2yrs** Term <4yrs** Cumulative Deposit Repricing Characteristics Interest Bearing Non-Interest Bearing *Term includes CDs, IRAs, CDARS CDs, FHLB borrowings & Brokered CDs **Information is presented cumulative, thus includes amounts repricing in earlier repricing buckets. |
| Strategic Achievements 28 |

| • Talent ▪ Added 17 new mortgage originators across our footprint, with a focus in our Florida and Tennessee markets ▪ M&A disruption has allowed us to lift out a season team of originators and treasury management professionals • Technology ▪ Upgraded mortgage origination platform ▪ Implemented a digital platform for online mortgage applications ▪ Substantially upgraded our treasury management offerings ▪ Added 18 Interactive Teller Machines Investments in Talent and Technology 29 |
| ▪ 2018 • Relocated Northern, Kentucky location to Crestview Hills in March 2018 • Opened Westshore (Tampa), Florida location in May 2018 ▪ 2019 • Opened Oldsmar (Tampa), Florida loan production office in April 2019 • Plan to relocate Port Richey and Temple Terrace locations in Tampa, Florida • Examining new location in Westchester, Ohio Investment in New Offices 30 |
| Cultural Highlights 31 |

| • In 2018 offered qualifying associates a $750 forgivable loan (Tax effected $1,000) • In 2018 we introduced Dollars4Doers, awarding $20,000 in grants to nonprofits where our associates volunteer • In 2018 Republic Bank and our related foundation gave $2.78 million in grants to nonprofits in our communities • In 2019 we had over 95% participation in our employee engagement survey • In 2019 we launched our first Business Resource Group focused on diversity and inclusion IMPACT 32 |
| Best Places to Work 33 For the 3rd year in a row Republic Bank was recognized as a “Best Place to Work”. The recognition is bestowed by the Kentucky Chamber of Commerce and Kentucky S.H.R.M after an anonymous survey of our associates. |

| Highlights First Quarter 2019 34 |

| $8.5 $11.1 $12.5 $11.5 $16.3 $17.0$20.0 $27.5 $29.5 $0.0 $5.0 $10.0 $15.0 $20.0 $25.0 $30.0 $35.0 1Q 2017 1Q 2018* 1Q 2019* Millions Core Bank Republic Processing Group 37% 7% 1Q 2019 Highlights – Net Income Growth *Includes the benefit of a 21% federal statutory income tax rate, with a 35% comparable rate in 2017. .. 35 |

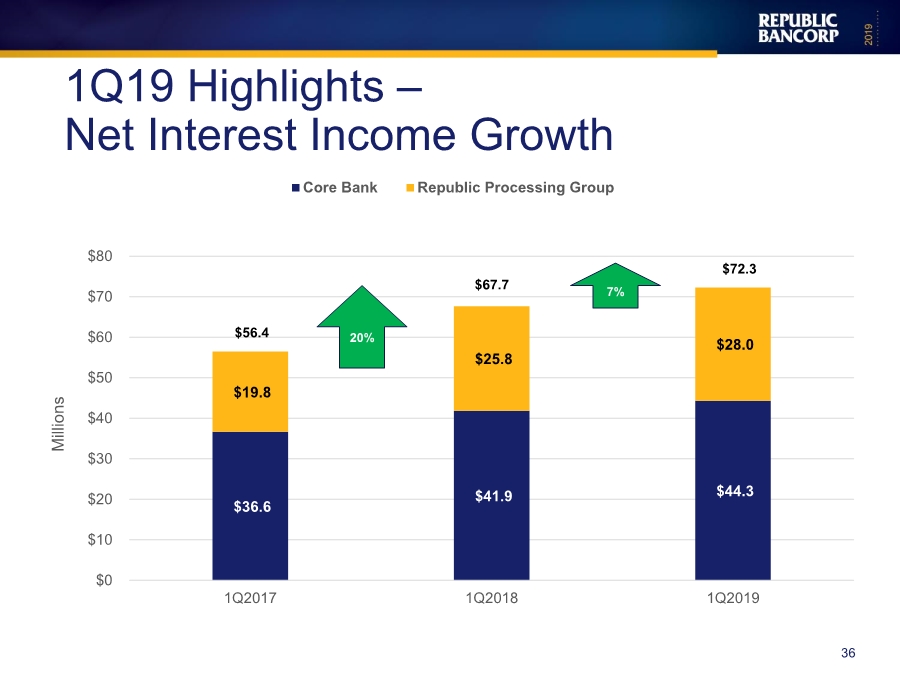
| $36.6 $41.9 $44.3 $19.8 $25.8 $28.0 $0 $10 $20 $30 $40 $50 $60 $70 $80 1Q2017 1Q2018 1Q2019 Millions Core Bank Republic Processing Group $56.4 $67.7 $72.3 1Q19 Highlights – Net Interest Income Growth 36 20% 7% |
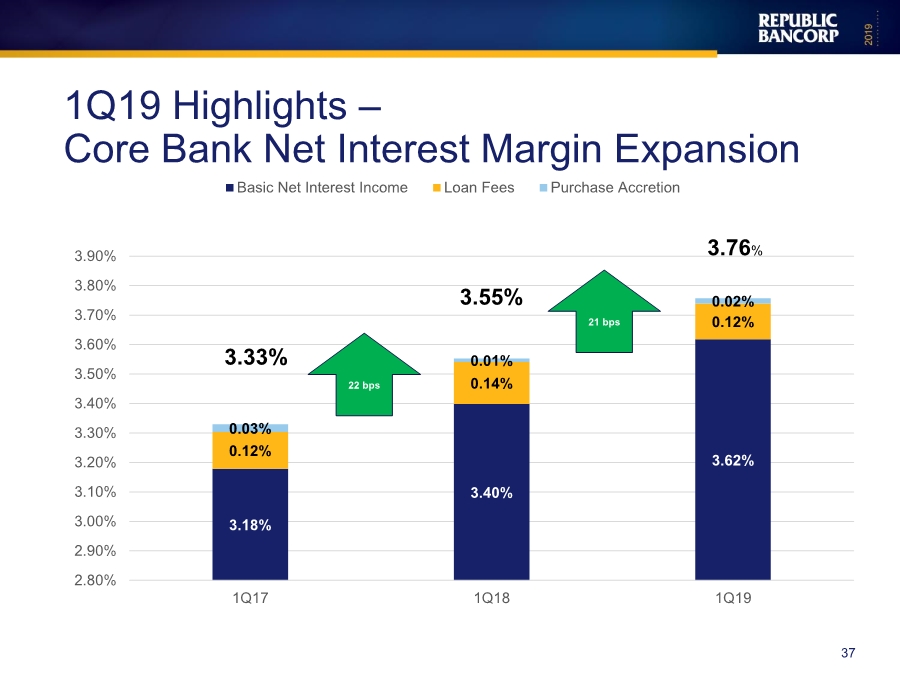
| 3.18% 3.40% 3.62%0.12% 0.14% 0.12% 0.03% 0.01% 0.02% 2.80% 2.90% 3.00% 3.10% 3.20% 3.30% 3.40% 3.50% 3.60% 3.70% 3.80% 3.90% 1Q17 1Q18 1Q19 Basic Net Interest Income Loan Fees Purchase Accretion 3.76% 21 bps 1Q19 Highlights – Core Bank Net Interest Margin Expansion 37 3.33% 3.55% 22 bps |
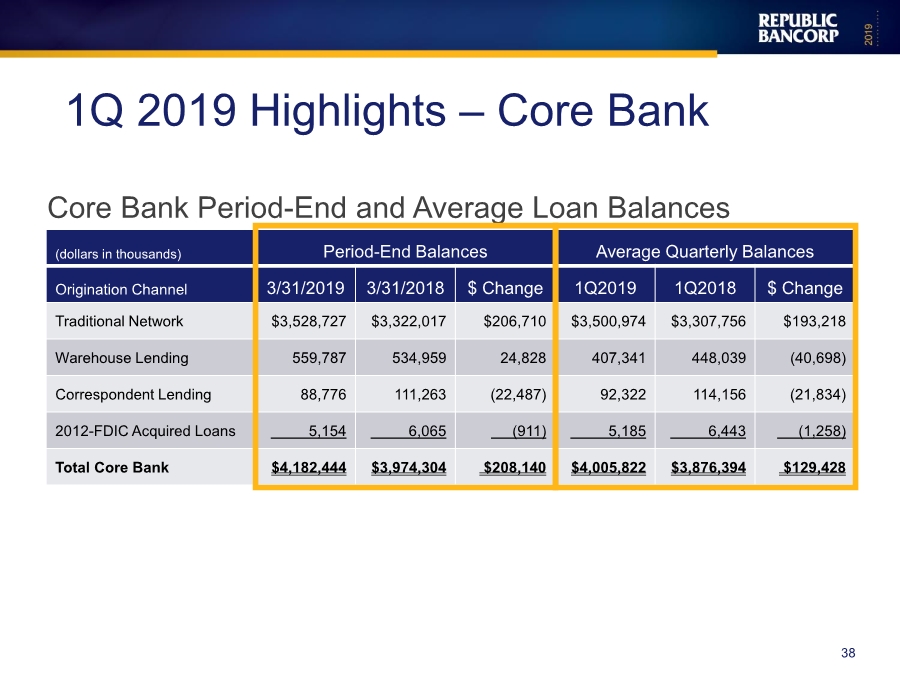
| (dollars in thousands) Period-End Balances Average Quarterly Balances Origination Channel 3/31/2019 3/31/2018 $ Change 1Q2019 1Q2018 $ Change Traditional Network $3,528,727 $3,322,017 $206,710 $3,500,974 $3,307,756 $193,218 Warehouse Lending 559,787 534,959 24,828 407,341 448,039 (40,698) Correspondent Lending 88,776 111,263 (22,487) 92,322 114,156 (21,834) 2012-FDIC Acquired Loans 5,154 6,065 (911) 5,185 6,443 (1,258) Total Core Bank $4,182,444 $3,974,304 $208,140 $4,005,822 $3,876,394 $129,428 1Q 2019 Highlights – Core Bank 38 Core Bank Period-End and Average Loan Balances |
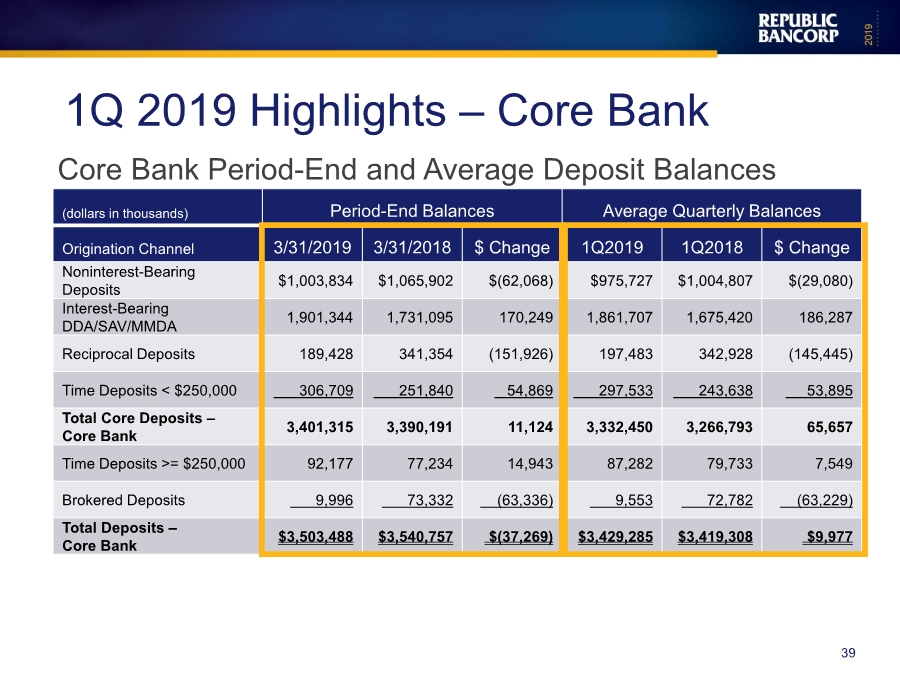
| (dollars in thousands) Period-End Balances Average Quarterly Balances Origination Channel 3/31/2019 3/31/2018 $ Change 1Q2019 1Q2018 $ Change Noninterest-Bearing Deposits $1,003,834 $1,065,902 $(62,068) $975,727 $1,004,807 $(29,080) Interest-Bearing DDA/SAV/MMDA 1,901,344 1,731,095 170,249 1,861,707 1,675,420 186,287 Reciprocal Deposits 189,428 341,354 (151,926) 197,483 342,928 (145,445) Time Deposits < $250,000 306,709 251,840 54,869 297,533 243,638 53,895 Total Core Deposits – Core Bank 3,401,315 3,390,191 11,124 3,332,450 3,266,793 65,657 Time Deposits >= $250,000 92,177 77,234 14,943 87,282 79,733 7,549 Brokered Deposits 9,996 73,332 (63,336) 9,553 72,782 (63,229) Total Deposits – Core Bank $3,503,488 $3,540,757 $(37,269) $3,429,285 $3,419,308 $9,977 1Q 2019 Highlights – Core Bank 39 Core Bank Period-End and Average Deposit Balances |
| $0 $20 $40 $60 $80 $100 $120 3/31/2018 6/30/2018 9/30/2018 12/31/2018 3/31/2019 Millions Total Deposits 40 MemoryBank Growth +$63.7M |

| • Return On Average Assets of 2.16% • Return On Average Equity of 16.70% • Capital ratios continued to exceed “well capitalized” • Increased quarterly cash dividend by 10%, representing the 20th consecutive increase since 1999 • Credit metrics continue to outperform peer 1Q 2019 Other Highlights – Core Bank 41 |
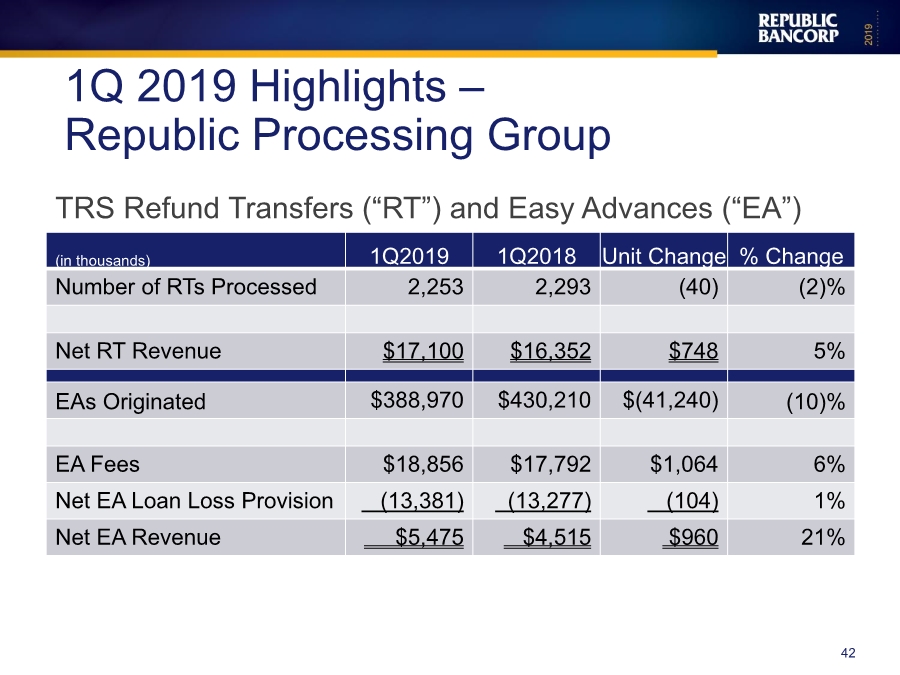
| (in thousands) 1Q2019 1Q2018 Unit Change % Change Number of RTs Processed 2,253 2,293 (40) (2)% Net RT Revenue $17,100 $16,352 $748 5% EAs Originated $388,970 $430,210 $(41,240) (10)% EA Fees $18,856 $17,792 $1,064 6% Net EA Loan Loss Provision (13,381) (13,277) (104) 1% Net EA Revenue $5,475 $4,515 $960 21% 1Q 2019 Highlights – Republic Processing Group 42 TRS Refund Transfers (“RT”) and Easy Advances (“EA”) |
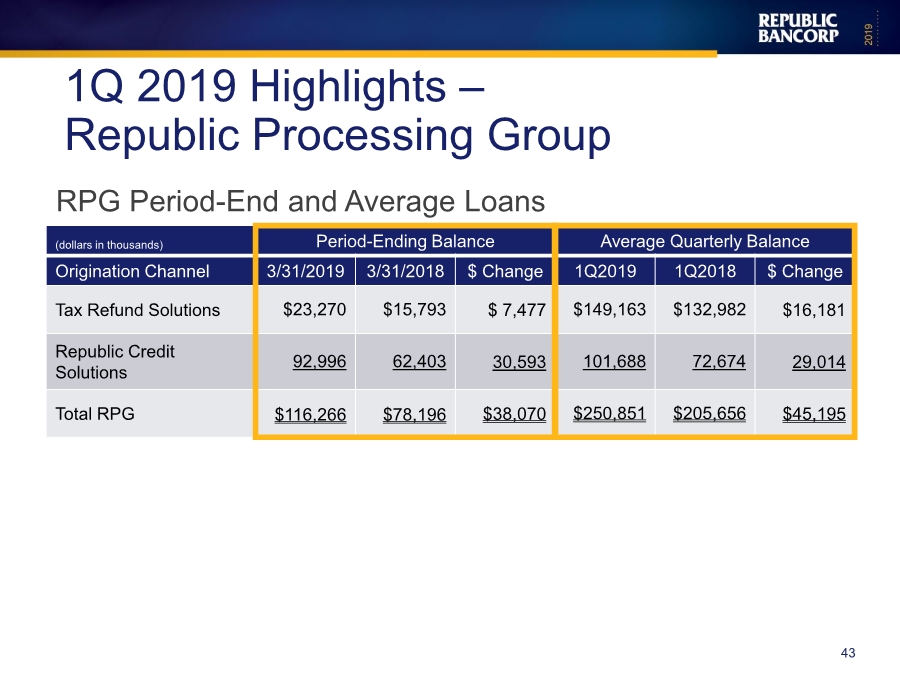
| (dollars in thousands) Period-Ending Balance Average Quarterly Balance Origination Channel 3/31/2019 3/31/2018 $ Change 1Q2019 1Q2018 $ Change Tax Refund Solutions $23,270 $15,793 $ 7,477 $149,163 $132,982 $16,181 Republic Credit Solutions 92,996 62,403 30,593 101,688 72,674 29,014 Total RPG $116,266 $78,196 $38,070 $250,851 $205,656 $45,195 1Q 2019 Highlights – Republic Processing Group 43 RPG Period-End and Average Loans |
| • Grow commercial-sector loan portfolio • Expand secondary market lending • Focus on analytics to drive product profitability • Substantial growth in Core Deposits • Continue to expand Deposit base with MemoryBank • Further season the Dealer Services division • Continue to evaluate opportunities for capital deployment that diversify our revenue streams 2019 Initiatives 44 |
| 45 |

| Thank You 46 |