Exhibit 99.1
| FEBRUARY 2005 NYSE BBX Prepared:February 16, 2005 |
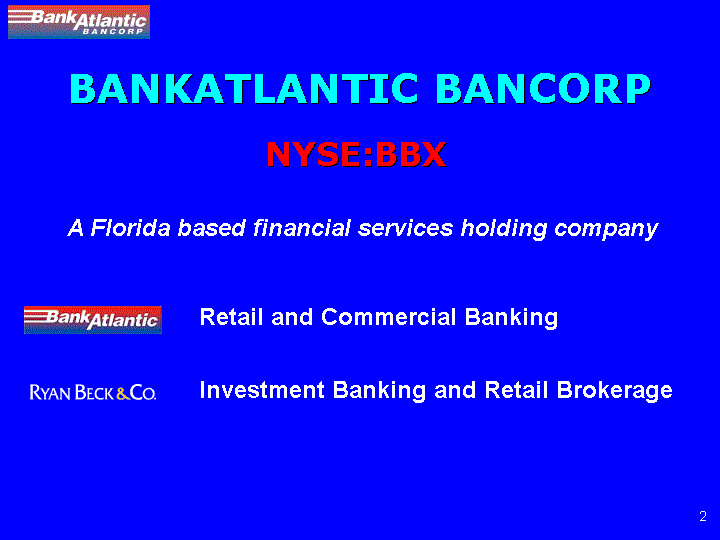
| BANKATLANTIC BANCORP NYSE:BBXA Florida based financial services holding companyInvestment Banking and Retail Brokerage |
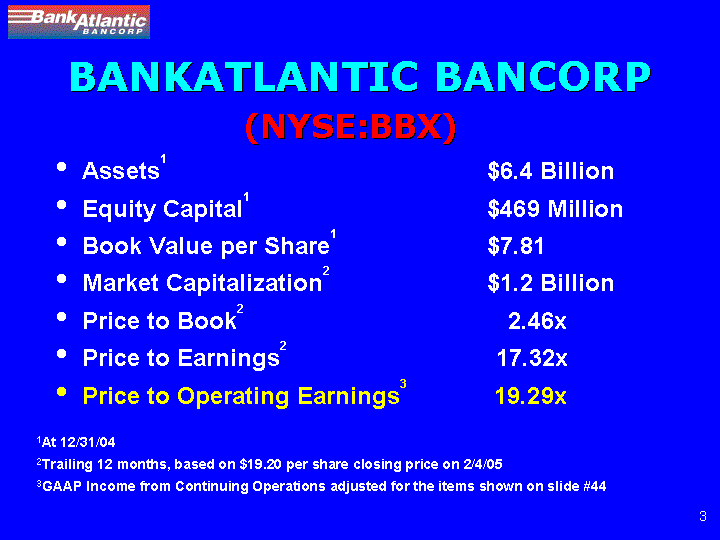
| BANKATLANTIC BANCORP (NYSE:BBX)•Assets 1 $6.4 Billion•Equity Capital 1 $469 Million•Book Value per Share 1 $7.81 •Market Capitalization 2 $1.2 Billion•Price to Book 2 2.46x •Price to Earnings 2 17.32x |
| •Price to Operating Earnings 3 19.29x |
| 1 At 12/31/04 2 Trailing 12 months, based on $19.20 per share closing price on 2/4/05 3 GAAP Income from Continuing Operations adjusted for the items shown on slide #44 |
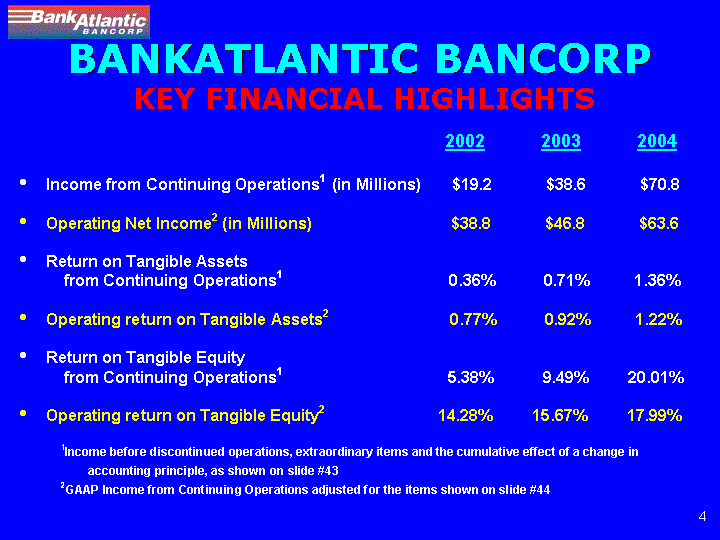
| BANKATLANTIC BANCORP KEY FINANCIAL HIGHLIGHTS•Income from Continuing Operations 1 (in Millions) $19.2 $38.6 $70.8 •Operating Net Income 2 (in Millions) $38.8 $46.8 $63.6 •Return on Tangible Assets |
| from Continuing Operations 1 0.36% 0.71% 1.36% |
| •Operating return on Tangible Assets 2 0.77% 0.92% 1.22% •Return on Tangible Equity |
| from Continuing Operations 1 5.38% 9.49% 20.01% |
| •Operating return on Tangible Equity 2 14.28% 15.67% 17.99% 1 Income before discontinued operations, extraordinary items and the cumulative effect of a change in |
| accounting principle, as shown on slide #43 |
| 2 GAAP Income from Continuing Operations adjusted for the items shown on slide #44 |
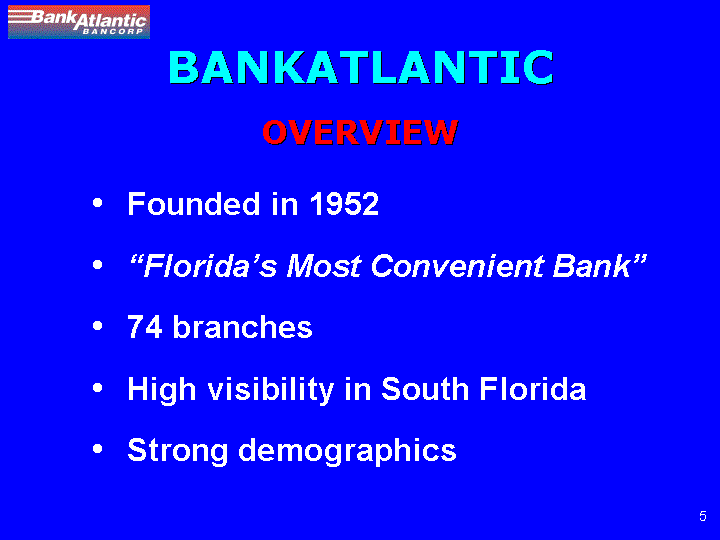
| BANKATLANTIC OVERVIEW |
| •Founded in 1952 •“Florida’s Most Convenient Bank”•74 branches •High visibility in South Florida •Strong demographics |
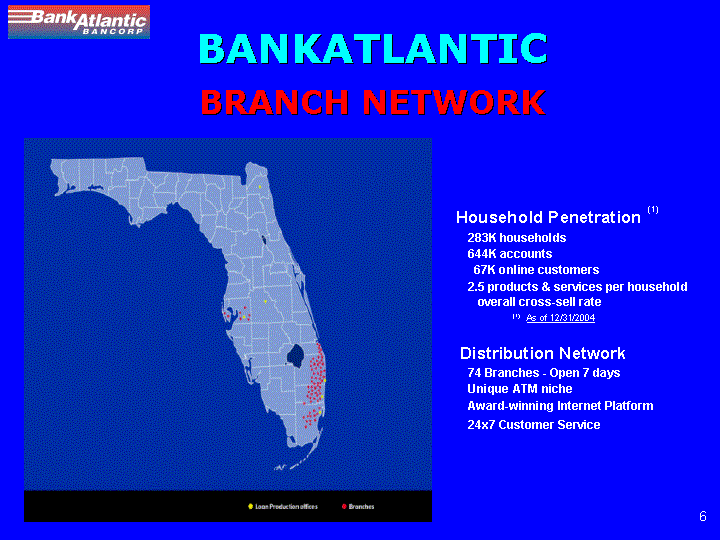
| BANKATLANTIC BRANCH NETWORK Household Penetration 283K households644K accounts 67K online customers 2.5 products & services per household overall cross-sell rateAs of 12/31/2004Distribution Network 74 Branches — Open 7 days Unique ATM niche Award-winning Internet Platform |
| 24x7 Customer Service |
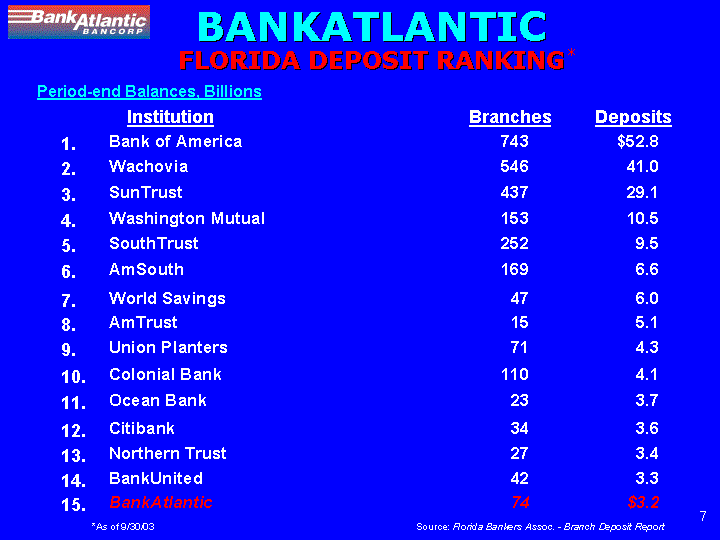
| BANKATLANTIC FLORIDA DEPOSIT RANKING * |
| Period-end Balances, Billions |
| InstitutionBranches |
| Deposits 1. Bank of America |
| 743 $52.8 |
| 2. Wachovia |
| 546 41.0 |
| 3. SunTrust |
| 437 29.1 |
| 4. Washington Mutual |
| 153 10.5 |
| 5. SouthTrust |
| 252 9.5 |
| 6. AmSouth |
| 169 6.6 |
| 7. World Savings |
| 47 6.0 |
| 8. AmTrust |
| 15 5.1 |
| 9. Union Planters |
| 71 4.3 |
| 10. Colonial Bank |
| 110 4.1 |
| 11. Ocean Bank |
| 23 3.7 |
| 12. Citibank |
| 34 3.6 |
| 13. Northern Trust |
| 27 3.4 |
| 14. BankUnited |
| 42 3.3 |
| 15. |
| BankAtlantic74 $3.2 |
| *As of 9/30/03 Source:Florida Bankers Assoc. — Branch Deposit Report |
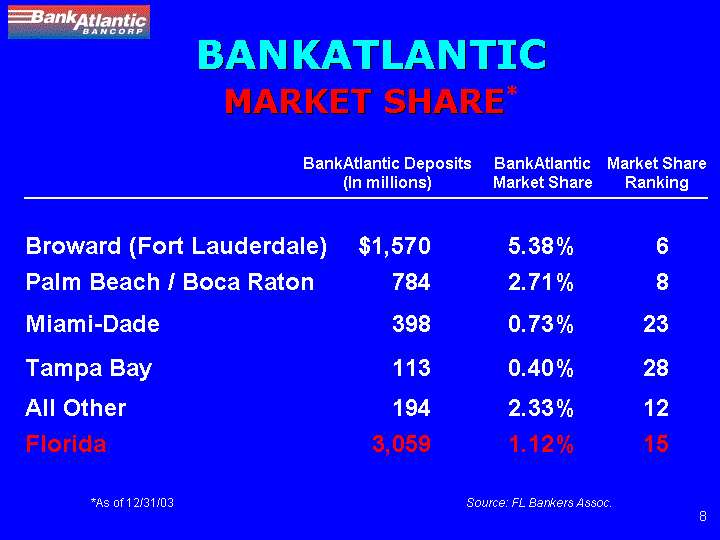
| BANKATLANTIC MARKET SHARE * BankAtlantic Deposits (In millions) BankAtlantic Market ShareMarket Share Ranking |
| Broward (Fort Lauderdale) |
| $1,570 5.38% |
| 6 |
| Palm Beach / Boca Raton |
| 784 2.71% |
| 8 |
| Miami-Dade |
| 398 0.73% |
| 23 |
| Tampa Bay |
| 113 0.40% |
| 28 |
| All Other |
| 194 2.33% |
| 12 |
| Florida |
| 3,059 1.12% |
| 15 |
| *As of 12/31/03 |
| Source: FL Bankers Assoc. |
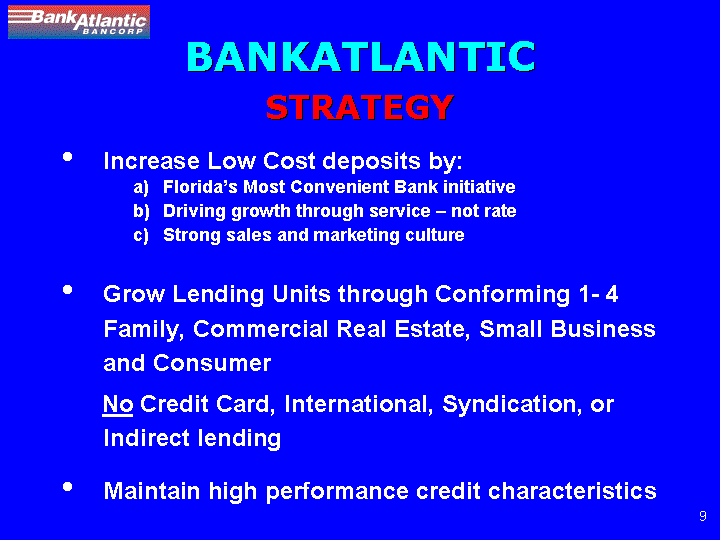
| BANKATLANTIC STRATEGY |
| • Increase Low Cost deposits by: |
| • Florida’s Most Convenient Bank initiative |
| · Driving growth through service – not rate |
| •Strong sales and marketing culture |
| • Grow Lending Units through Conforming 1- 4 Family, Commercial Real Estate, Small Business and Consumer |
| No Credit Card, International, Syndication, or Indirect lending |
| • Maintain high performance credit characteristics |
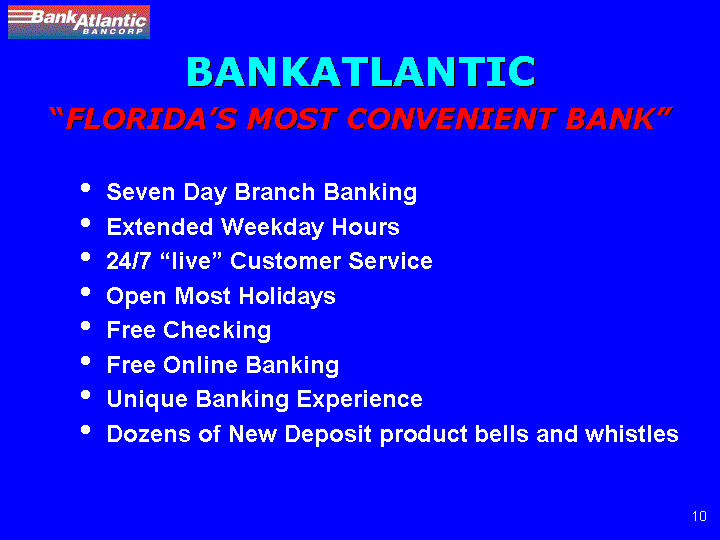
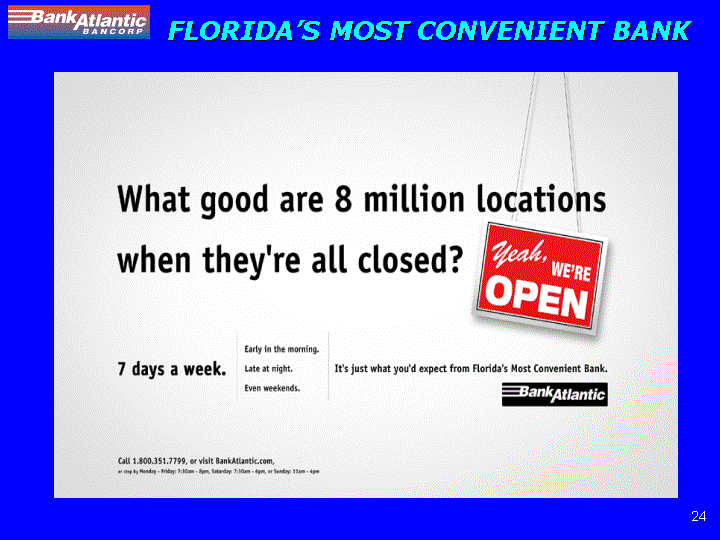
| BANKATLANTIC “FLORIDA’S MOST CONVENIENT BANK” • Seven Day Branch Banking • Extended Weekday Hours • 24/7 “live” Customer Service • Open Most Holidays • Free Checking • Free Online Banking • Unique Banking Experience • Dozens of New Deposit product bells and whistles |

| FLORIDA’S MOST CONVENIENT BANK |

| BANKATLANTIC NEW BRANCH LOOK |
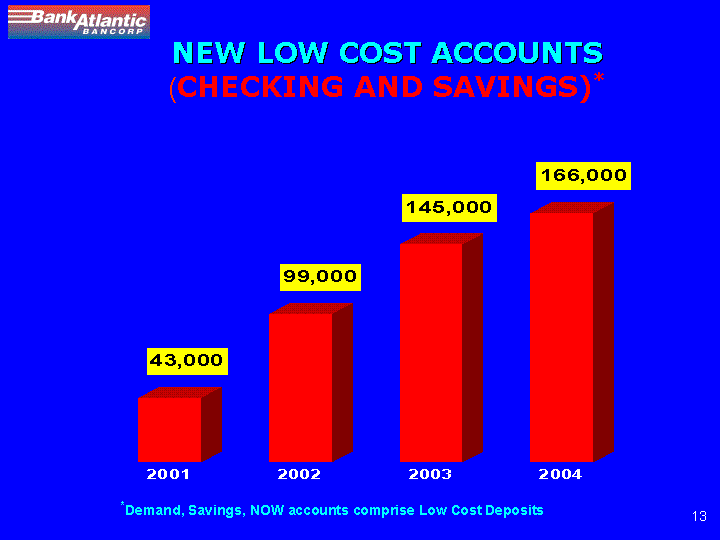
| NEW LOW COST ACCOUNTS (CHECKING AND SAVINGS)* 43,000 99,000 145,000 166,000 2001 2002 2003 2004 * Demand, Savings, NOW accounts comprise Low Cost Deposits |
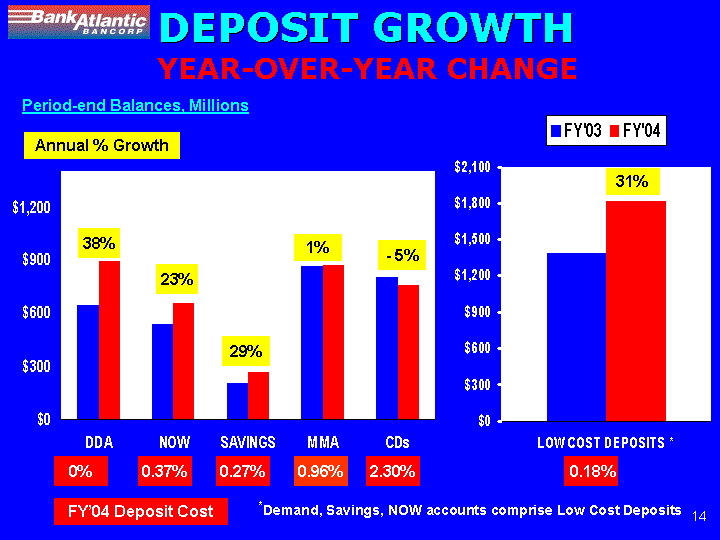
| DEPOSIT GROWTH YEAR-OVER-YEAR CHANGE |
| Period-end Balances, Millions Annual % Growth |
| $1,200 $900 $600 $300 $0 |
| 38% 23% 29% 1% -5% DDA NOW SAVINGS MMA CDs 0% 0.37% 0.27% 0.907 2.30% FY04 Deposit Cost FY’03 FY’04 $2,100 $1,800 $1,500 $1,200 $900 $600 $300 $0 31% LOW COST DEPOSITS* 0.18% |
| * Demand, Savings, NOW accounts comprise Low Cost Deposits |
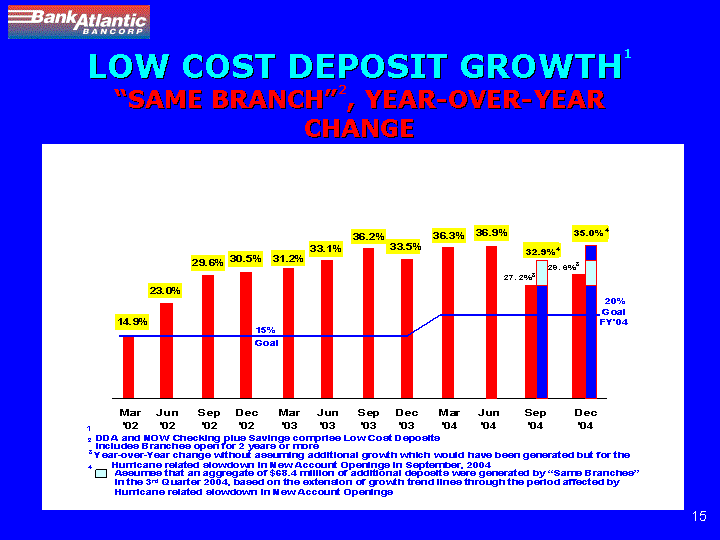
| LOW COST DEPOSIT GROWTH 1 “SAME BRANCH” 2, YEAR-OVER-YEAR CHANGE |
| 14.9% 23.0% 29.6% 30.5% 33.2% 33.1% 36.2% 33.5% 36.3% 36.9% 27.2% 32.9% 29.6% 35.0% 20% |
| Goal FY’04 Mar ‘02 Jun ‘02 Sep ‘02 Dec ‘02 Mar ‘03 Jun ‘03 Sep ‘03 Dec ‘03 Mar ‘04 Jun ‘04 Sep ‘04 Dec ‘04 |
| 1 DDA and NOW Checking plus Savings comprise Low Cost Deposits 2 Includes Branches open for 2 years or more 3 Year-over-Year change without assuming additional growth which would have been generated but for the Hurricane related slowdown in New Account Openings in September, 2004 4 Assumes that an aggregate of $68.4 million of additional deposits were generated by ``Same Branches’’ in the 3rd Quarter 2004, based on the extension of growth trend lines through the period affected by Hurricane related slowdown in New Account Openings |
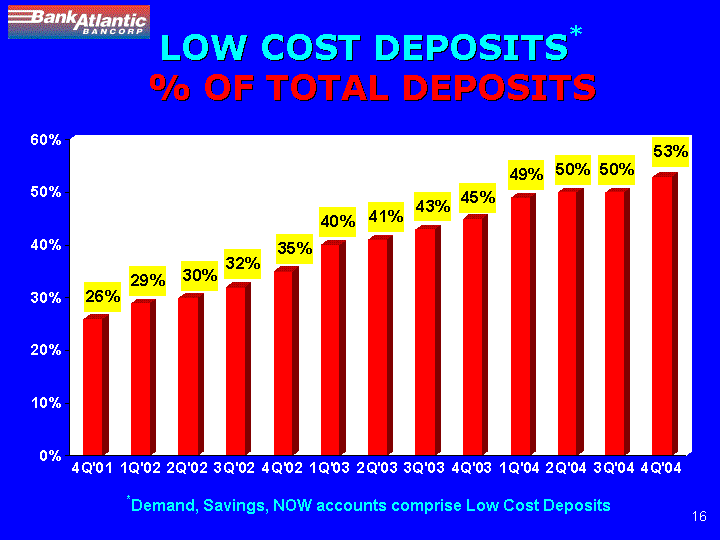
| LOW COST DEPOSITS* % OF TOTAL DEPOSITS |
| 60% 50% 40% 30% 20% 10% 0% |
| 26% 29% 30% 32% 35% 40% 41% 43% 45% 49% 50% 50% 53% |
| 4Q’01 1Q’02 2Q’02 3Q’02 4Q’02 1Q’03 2Q’03 3Q’03 4Q’03 1Q’04 2Q’04 3Q’04 4Q’04 |
| * Demand, Savings, NOW accounts comprise Low Cost Deposits |
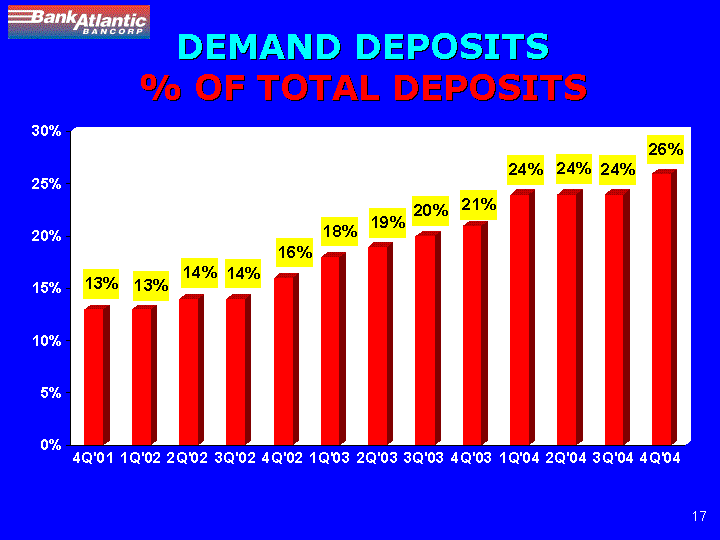
| DEMAND DEPOSITS % OF TOTAL DEPOSITS |
| 60% 50% 40% 30% 20% 10% 0% |
| 13% 13% 14% 14% 16% 18% 19% 20% 21% 24% 24% 24% 26% |
| 4Q’01 1Q’02 2Q’02 3Q’02 4Q’02 1Q’03 2Q’03 3Q’03 4Q’03 1Q’04 2Q’04 3Q’04 4Q’04 |
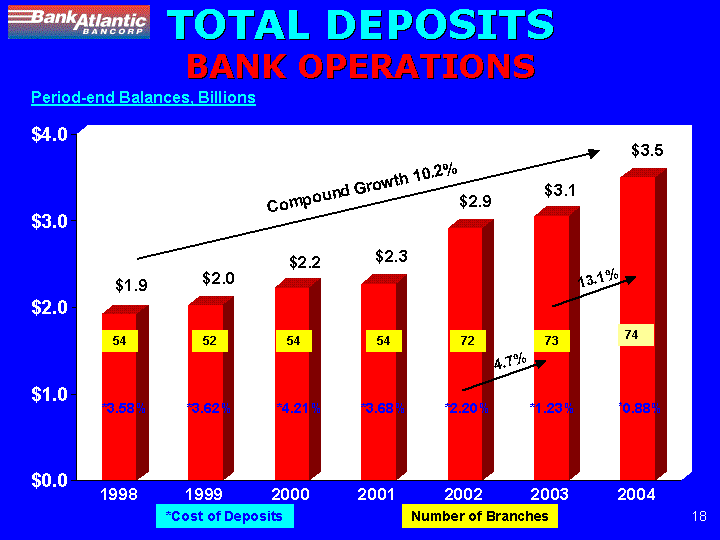
| TOTAL DEPOSITS BANK OPERATIONSPeriod-end Balances, Billions |
| Compound Growth 10.2% |
| $4.0 $3.0 $2.0 $1.0 $0.0 |
| $1.9 $2.0 $2.25 $2.3 $2.9 $3.1 $3.5 |
| 54 52 54 54 72 73 74 |
| 1998 1999 2000 2001 2002 2003 2004 |
| *Cost of Deposits Number of Branches |
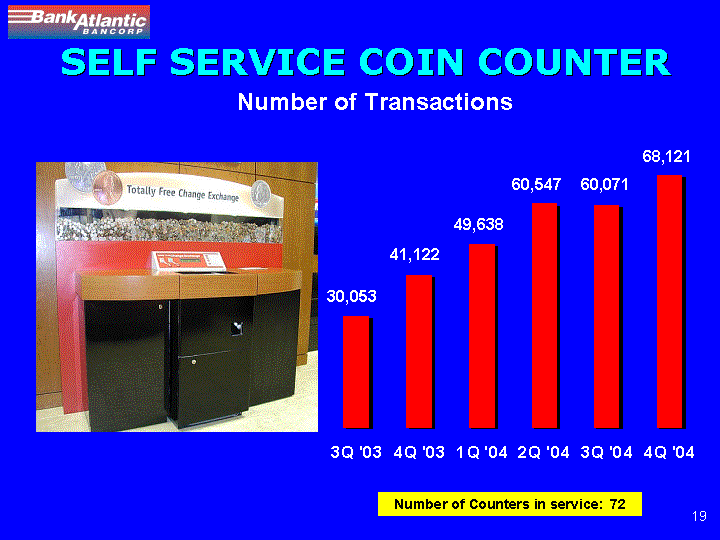
| SELF SERVICE COIN COUNTER Number of Transactions |
| 30,05341,12249,63360,54760,07168,121 3Q ‘034Q ‘031Q ‘042Q ‘043Q ‘044Q ‘04 |
| Number of Counters in service: 72 |
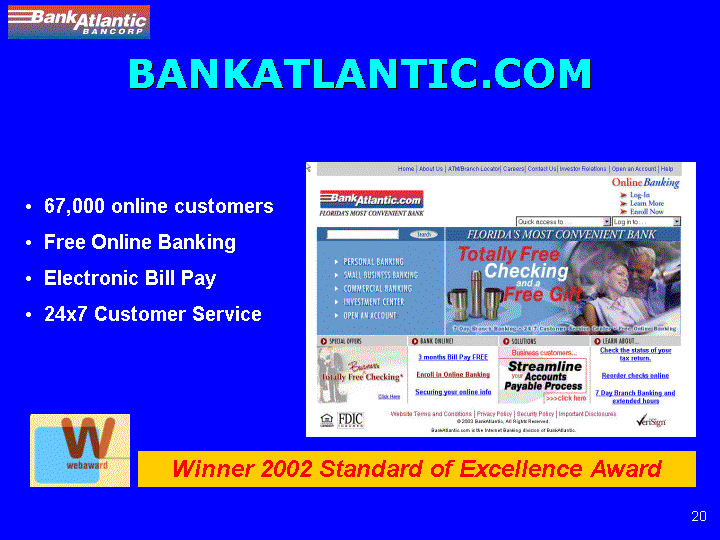
| BANKATLANTIC.COM • 67,000 online customers • Free Online Banking • Electronic Bill Pay • 24x7 Customer Service |
| Winner 2002 Standard of Excellence Award |
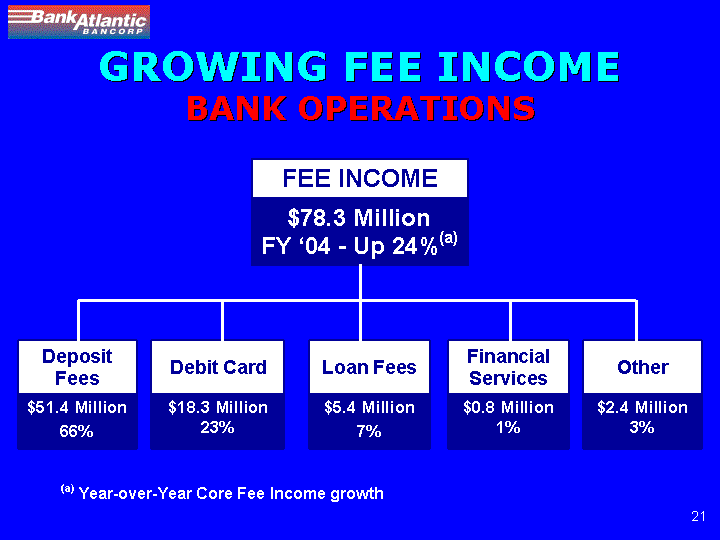
| GROWING FEE INCOME BANK OPERATIONS FEE INCOME $78.3 Million FY ‘04 — Up 24% (a) |
| Deposit Fees $51.4 Million 66% Debit Card $18.3 Million 23% Loan Fees $5.4 Million 7% Financial Services $0.8 Million 1% Other $2.4 Million 3% (a) Year-over-Year Core Fee Income growth |
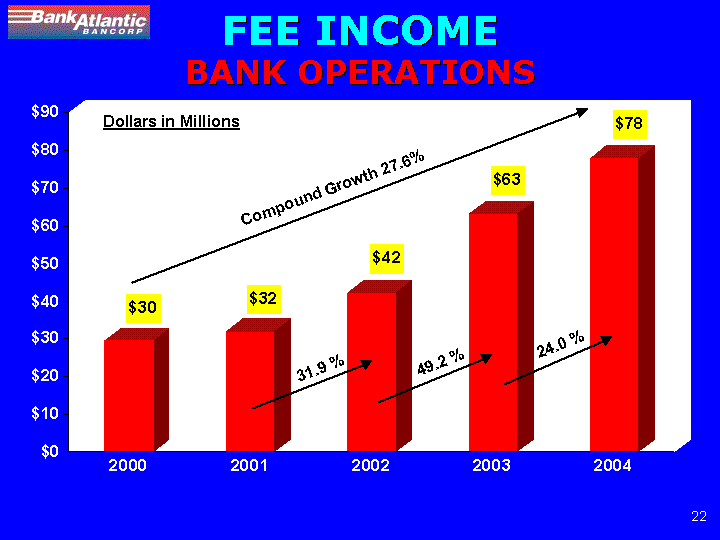
| FEE INCOME BANK OPERATIONSDollars in Millions |
| Compound Growth 27.6% |
| 200 2001 2002 2003 2004 |
| $30 $32 31.9% $42 42.9% $63 24.0% $78 |
| $0 $10 $ 20 $30 $40 $50 $60 $70 $80 $90 |

| FLORIDA’S MOST CONVENIENT BANK |
| FLORIDA’S MOST CONVENIENT BANK |

| FLORIDA’S MOST CONVENIENT BANK |

| FLORIDA’S MOST CONVENIENT BANK |

| FLORIDA’S MOST CONVENIENT BANK |
| BANKATLANTIC |
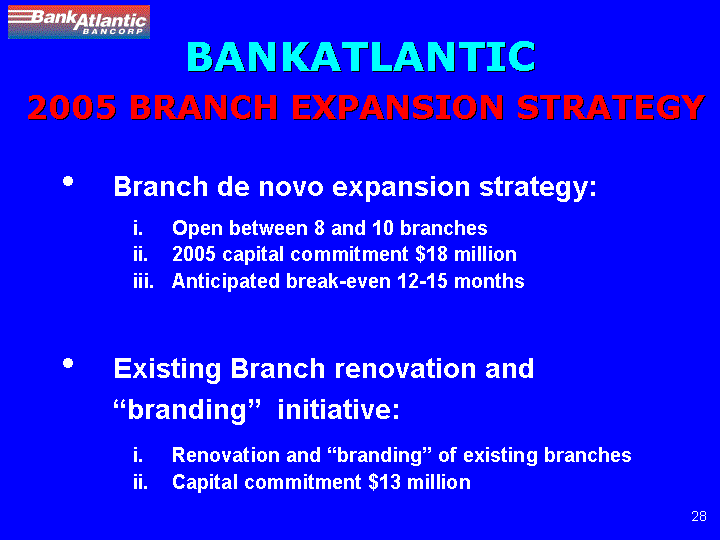
| 2005 BRANCH EXPANSION STRATEGY |
| •Branch de novo expansion strategy: i.Open between 8 and 10 branches ii.2005 capital commitment $18 million iii.Anticipated break-even 12-15 months •Existing Branch renovation and “branding” initiative: |
| i.Renovation and “branding” of existing branches ii.Capital commitment $13 million |
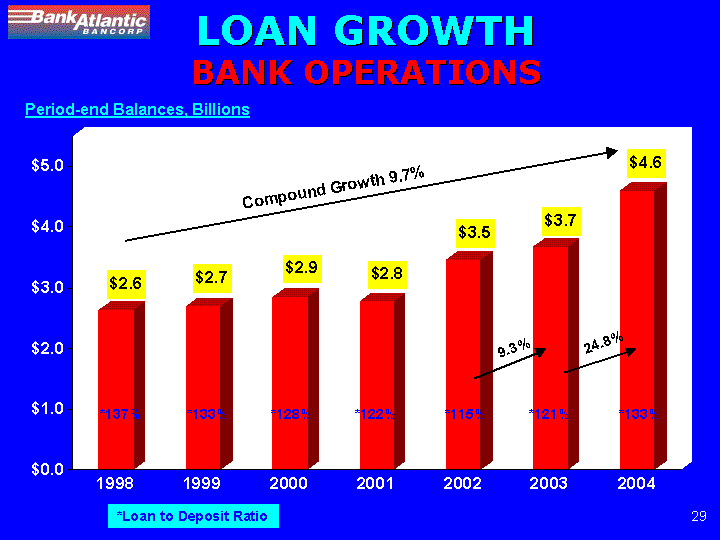
| LOAN GROWTH BANK OPERATIONS |
| Period-end Balances, Billions |
| Compound Growth 9.7% |
| 1998 1999 2000 2001 2002 2003 2004 137% 133% 128% 122% 115% 121% 133% %2.6 $2.7 $2.9 $2.8 $3.5 9.3% $3.7 24.8% $4.6 |
| *Loan to Deposit Ratio |
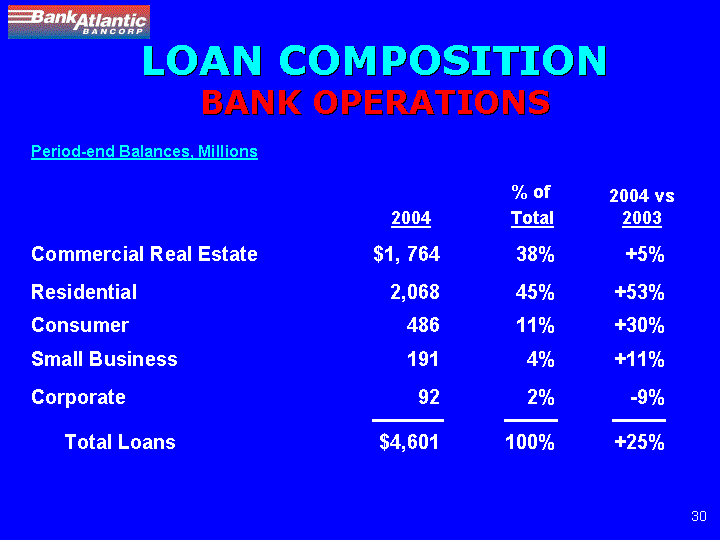
| LOAN COMPOSITION BANK OPERATIONSPeriod-end Balances, Millions |
| 2004 Total |
| 2004 vs2003 |
| Commercial Real Estate $1, 76438% +5% Residential 2,068 45% +53% Consumer 486 11% +30% Small Business 191 4% +11% Corporate 92 2% -9% |
| Total Loans $4,601 100% +25% |
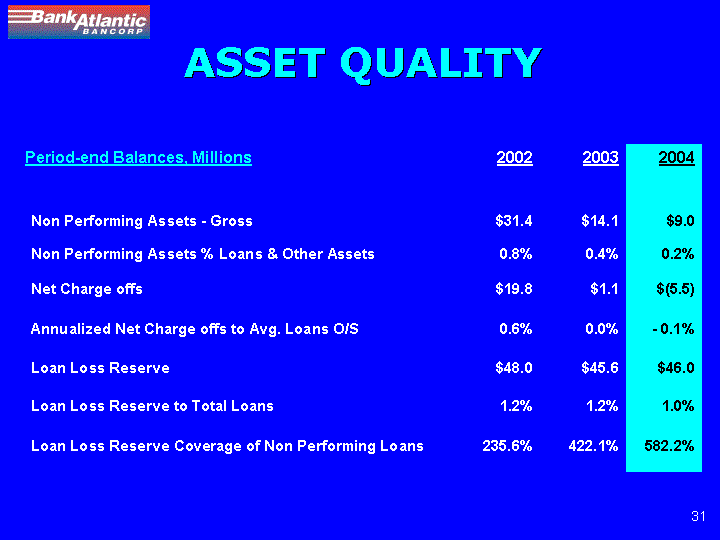
| ASSET QUALITY Period-end Balances, Millions —2002 2003 2004 —— —— —— — |
| Non Performing Assets – Gross $31.4 $14.1 $9.0 Non Performing Assets % Loans & Other Assets 0.8% 0.4% 0.2% Net Charge offs $19.8 $1.1 $(5.5) Annualized Net Charge offs to Avg. Loans O/S 0.6% 0.0% 0.1% Loan Loss Reserve $48.0 $45.6 $46.0 Loan Loss Reserve to Total Loans 1.2% 1.2% 1.0% Loan Loss Reserve Coverage of Non Performing Loans 235.6% 422.1% 582.2% |
| CURRENT POSTURE•Concerned with flat yield curve •Positioned for rising rates •Low Cost Deposits more valuable in rising |
| rate environment |
| •Margin reached 3.91% in 4Q ‘04 (3.79% FY’04) |
| RYAN BECK & CO. OVERVIEW•Full-service investment banking and regional brokerage |
| •Founded in 1946 |
| •Nationally recognized leader in Financial Institutions investment banking |
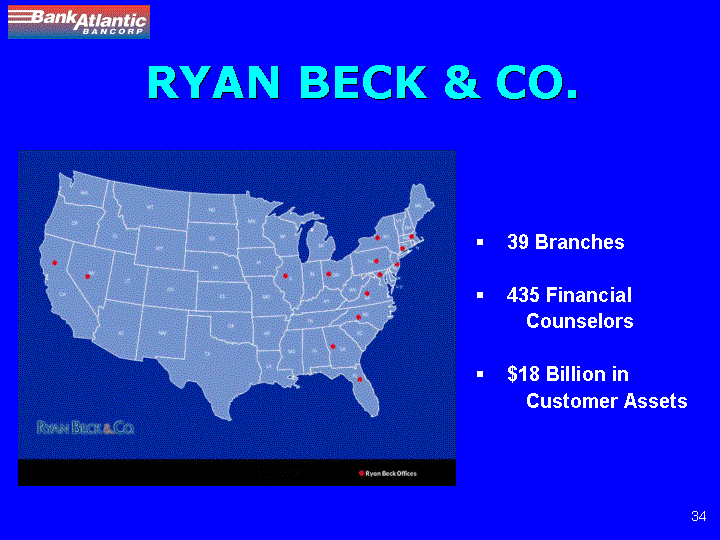
| RYAN BECK & CO. OVERVIEW RYAN BECK & CO.·39 Branches · ·435 Financial |
| Counselors |
| · ·$18 Billion in |
| Customer Assets |
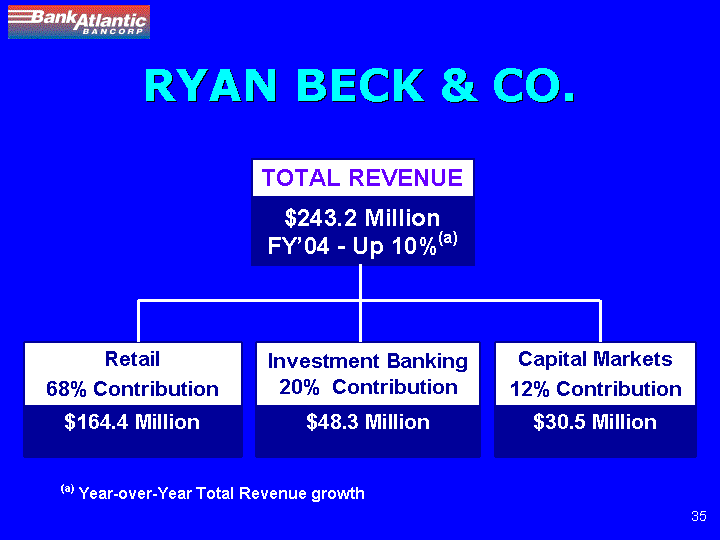
| RYAN BECK & CO. TOTAL REVENUE $243.2 Million FY’04 — Up 10% (a) Retail 68% Contribution $164.4 Million Investment Banking 20% Contribution$48.3 MillionCapital Markets 12% Contribution $30.5 Million |
| a) Year-over-Year Total Revenue growth |

| FINANCIAL RESULTS |
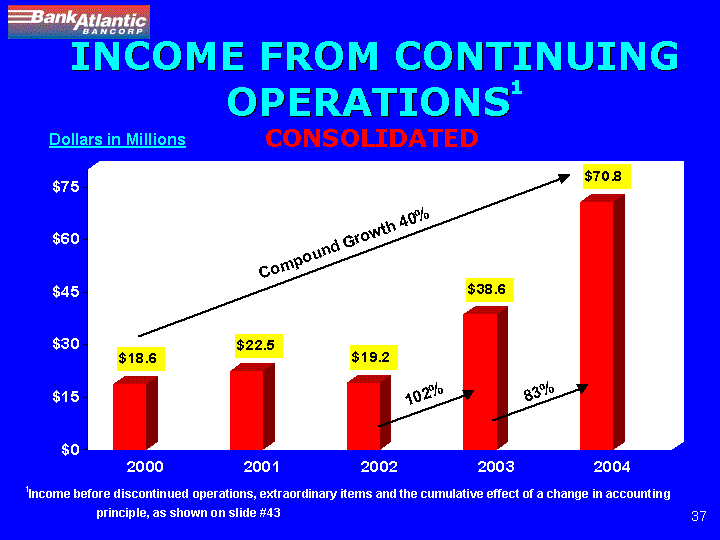
| INCOME FROM CONTINUING OPERATIONS 1 |
| Dollars in Millions |
| CONSOLIDATED$18.6 $22.5$19.2$38.6$70.81 Income before discontinued operations, extraordinary items and the cumulative effect of a change in accounting principle, as shown on slide #43 |
| Compound Growth 40% 102% 83% CONSOLIDATED |
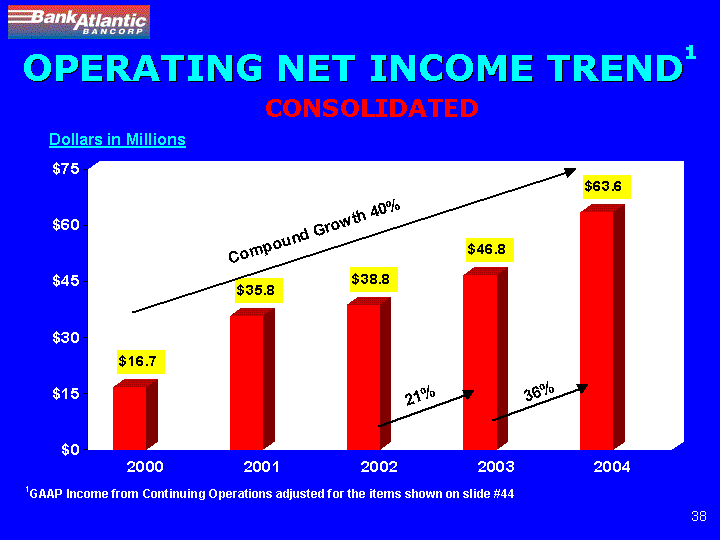 |
| 20002001200220032004 Operating Net Income $16.7$35.8$38.8$46.8$63.6 $0 $15 $30 $45 $60 $7 5 Compound Growth 40% |
| Compound Growth 27% |
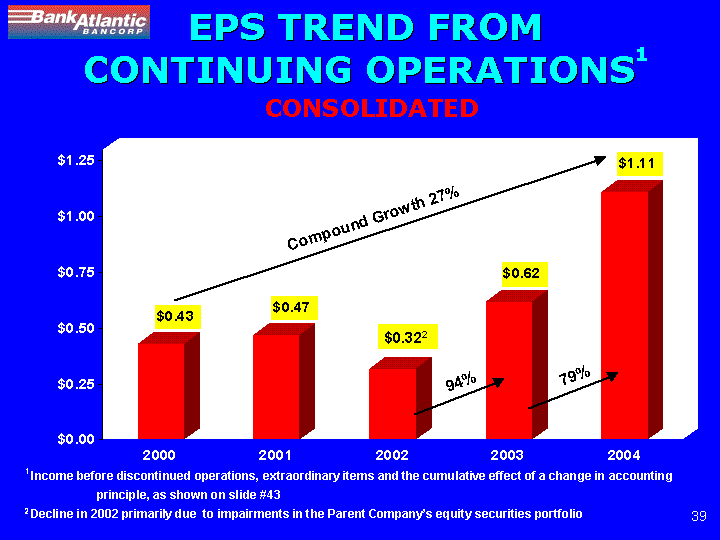
| 1 Income before discontinued operations, extraordinary items and the cumulative effect of a change in accounting principle, as shown on slide #43 2 Decline in 2002 primarily due to impairments in the Parent Company’s equity securities portfolio $0.43 $0.47 $0.62 $1.1194% 79% $0.00 $0.25 $0.50 $0.75 $1.00 $1.25 |
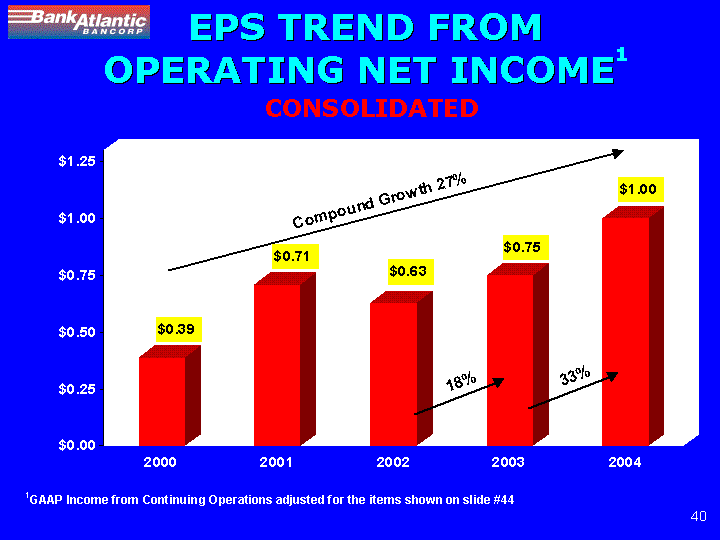
| EPS TREND FROM OPERATING NET INCOME 1 CONSOLIDATED |
| Compound Growth 27% 1 GAAP Income from Continuing Operations adjusted for the items shown on slide #44 33% 18% $0.39$0.71$0.63$0.75 $1.00 200020012002 2003 2004 |
| EPS from Operating Income 0.39 0.71 0.63 0.75 1 |

| STOCKHOLDER VALUE |
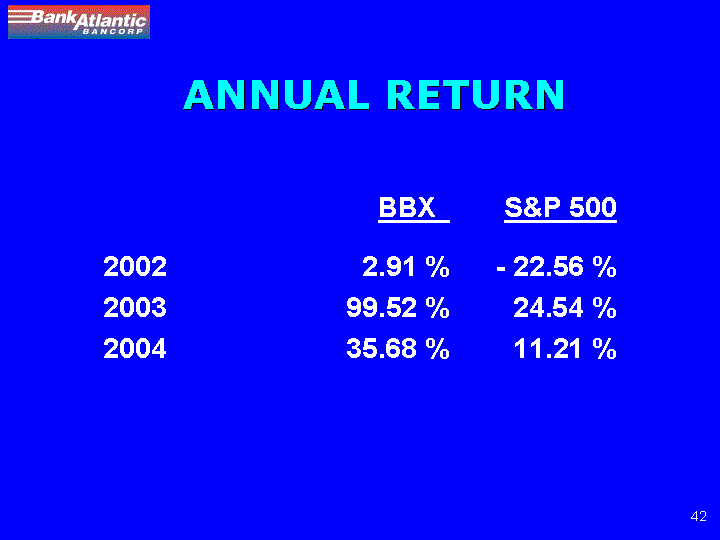
| ANNUAL RETURN |
| BBX S&P 500 —2002 2.91 %- 22.56 % |
| 2003 99.52 % 24.54 % 2004 35.68 % 11.21 % |
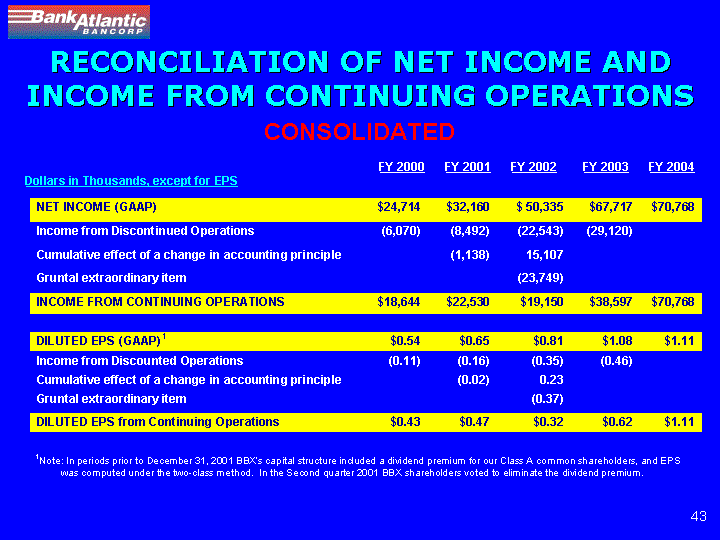
| RECONCILIATION OF NET INCOME AND INCOME FROM CONTINUING OPERATIONS |
| FY 2001CONSOLIDATED |
| Dollars in Thousands, except for EPS |
| FY 2000FY 2001FFY 2002FY 2003FY 2004 |
| NET INCOME (GAAP)$24,714$32,160 $50,335 $67,717$70,768 Income from Discontinued Operations(6,070) (8,492) (22,543)(29,120) Cumulative effect of a change in accounting principle (1,138)15,107 Gruntal extraordinary item (23,749) INCOME FROM CONTINUING OPERATIONS $18,644 $22,530 $19,150 $38,597 $70,768 |
| DILUTED EPS (GAAP)1$0.54 $0.65$0.81 $1.08 $1.11 Income from Discounted Operations(0.11) (0.16) (0.35) (0.46) Cumulative effect of a change in accounting principle (0.02) 0.23 Gruntal extraordinary item (0.37) DILUTED EPS from Continuing Operations $0.43 $0.47 $0.32 $0.62 $1.11 |
| 1Note: In periods prior to December 31, 2001 BBX’s capital structure included a dividend premium for our Class A common shareholders, and EPS was computed under the two-class method. In the Second quarter 2001 BBX shareholders voted to eliminate the dividend premium. |
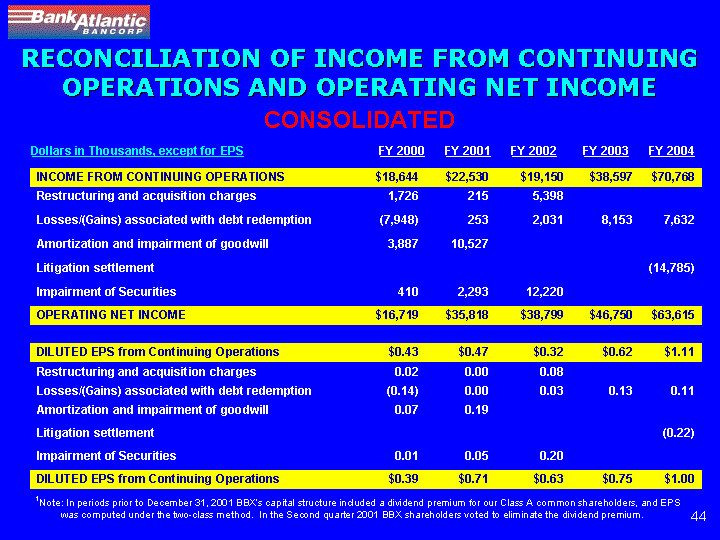
| RECONCILIATION OF INCOME FROM CONTINUING OPERATIONS AND OPERATING NET INCOME |
| CONSOLIDATED |
| Dollars in Thousands, except for EPS |
| FY 2000FY 2001 FY 2002 FY 2003 FY 2004 |
| INCOME FROM CONTINUING OPERATIONS $18,644 $22,530 $19,150 $38,597 $70,768 Restructuring and acquisition charges 1,726 215 5,398 Losses/(Gains) associated with debt redemption (7,948) 253 2,031 8,153 7,632 Amortization and impairment of goodwill 3,887 10,527 Litigation settlement (14,785) Impairment of Securities4102,29312,220 OPERATING NET INCOME$16,719 $35,818 $38,799 $46,750 $63,615 |
| DILUTED EPS from Continuing Operations $0.43 $0.47 $0.32 $0.62 $1.11 Restructuring and acquisition charges 0.02 0.00 0.08 Losses/(Gains) associated with debt redemption (0.14) 0.00 0.03 0.13 0.11 Amortization and impairment of goodwill 0.07 0.19 Litigation settlement (0.22) Impairment of Securities0.010.050.20 DILUTED EPS from Continuing Operations $0.39 $0.71 $0.63 $0.75 $1.00 |
| 1Note: In periods prior to December 31, 2001 BBX’s capital structure included a dividend premium for our Class A common shareholders, and EPS was computed under the two-class method. In the Second quarter 2001 BBX shareholders voted to eliminate the dividend premium. |
| FORWARD-LOOKING INFORMATION |
| Except for historical information contained herein, the matters discussed in these slides contain forward-looking statements within the meaning of Section 27A of the Securities Act of 1933, as amended (the “Securities Act”), and Section 21E of the Securities Exchange Act of 1934, as amended (thce “Exchange Act”), that involve substantial risks and uncertainties. When used in this presentation and in any documents incorporated by reference herein, the words “anticipate,” “believe,” “estimate,” “may,” “intend,” “expect” and similar expressions identify certain of such forward-looking statements. Actual results, performance, or achievements could differ materially from those contemplated, expressed, or implied by the forward-looking statements contained herein. These forward-looking statements are based largely on the expectations of BankAtlantic Bancorp, Inc. (“the Company”) and are subject to a number of risks and uncertainties that are subject to change based on factors which are, in many instances, beyond the Company’s control. These include, but are not limited to, risks and uncertainties associated with: the impact of economic, competitive and other factors affecting the Company and its operations, markets, products and services; credit risks and loan losses, and the related sufficiency of the allowance for loan losses; changes in interest rates and the effects of, and changes in, trade, monetary and fiscal policies and laws including their impact on the banks net interest margin; adverse conditions in the stock market, the public debt market and other capital markets and the impact of such conditions on our activities and the value of our assets; BankAtlantic’s seven-day banking initiative and other growth initiatives not being successful or producing results which do not justify their costs; the impact of periodic testing of goodwill and other intangible assets for impairment; achieving the benefits of the prepayment of the Federal Home Loan Bank advances; as well as the costs related to the correction of compliance deficiencies associated with the USA Patriot Act, anti-money laundering laws and the Bank Secrecy Act, and whether or to what extent monetary or other penalties relating to these compliance deficiencies will be imposed on the Company by regulators or other federal agencies. Estimates and new account opening assumptions are based largely on the application of deposit growth trend lines from prior periods and conjecture relating to the impact of hurricanes which affected Florida during the period. The results or performance derived or implied, directly or indirectly from the estimates and assumptions, are based on our beliefs and may not be accurate. Past performance, actual or estimated new account openings and growth rates, may not be indicative of future results. Further, these slides contain forward-looking statements with respect to Ryan Beck & Co., which are subject to a number of risks and uncertainties including but not limited to the risks and uncertainties associated with its operations, products and services, changes in economic or regulatory policies, its ability to recruit and retain financial consultants, the volatility of the stock market and fixed income markets, as well as its revenue mix, the success of new lines of business; and additional risks and uncertainties that are subject to change and may be outside of Ryan Beck’s control. In addition to the risks and factors identified above, reference is also made to other risks and factors detailed in reports filed by the Company with the Securities and Exchange Commission. The Company cautions that the foregoing factors are not exclusive. |


| SUPPLEMENTAL |
| DATA |
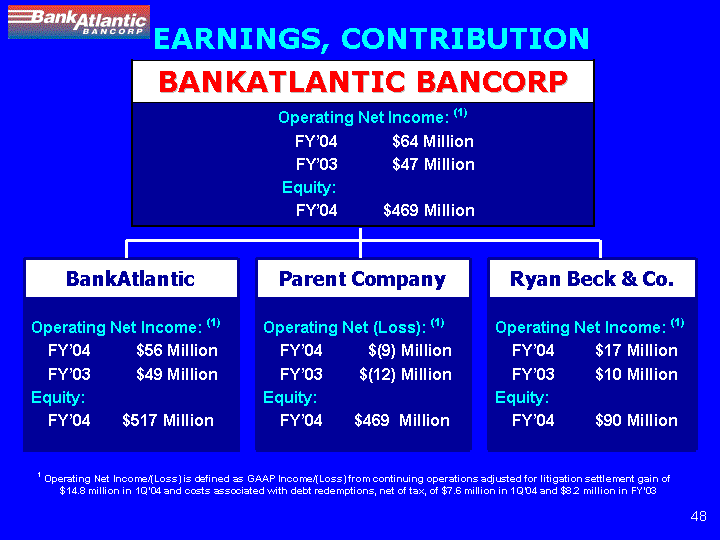
| EARNINGS, CONTRIBUTION |
| BANKATLANTIC BANCORP |
| Operating Net Income:(1) |
| FY’04 $64 Million |
| FY’03 $47 Million |
| Equity: |
| FY’04 $469 Million |
| BankAtlantic Parent Company Ryan Beck & Co. |
| Operating Net Income:(1) FY’04 $56 Million FY’03 $49 Million Equity: FY’04 $517 Million Operating Net (Loss):(1) FY’04 $(9) Million FY’03 $(12) Million Equity: FY’04 $469 Million Operating Net Income:(1) |
| FY’04 $17 Million FY’03 $10 Million |
| Equity: |
| FY’04 $90 Million |
| 1 Operating Net Income/(Loss) is defined as GAAP Income/(Loss) from continuing operations adjusted for litigation settlement gain of $14.8 million in 1Q’04 and costs associated with debt redemptions, net of tax, of $7.6 million in 1Q’04 and $8.2 million in FY’03 |
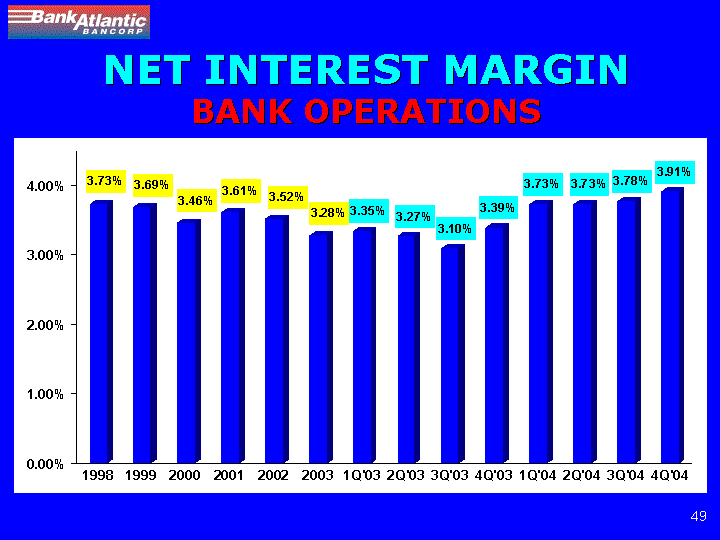
| NET INTEREST MARGIN BANK OPERATIONS |
| 1998 1999 2000 2001 2002 2003 1Q ‘03 2Q’03 3Q’03 4Q’03 1Q’04 2Q’04 3Q’04 4Q’04 |
| 0.00% 1.00% 2.00% 3.00% 4.00% |
| 3.73% 3.69% 3.46% 3.61% 3.52% 3.28% 3.35% 3.27% 3.10% 3.39% 3.73% 3.73% 3.78% 3.91% FY 2000 |
| FY 2001FY 2001 |
| 00 |
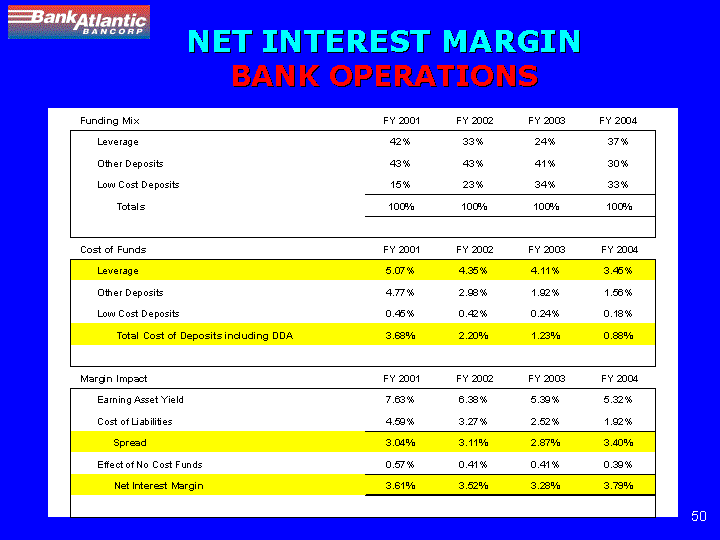
| NET INTEREST MARGIN BANK OPERATIONS |
| Funding Mix FY 2001 FY 2002 FY 2003 FY 2004 |
| Leverage 42%33% 24% 37% Other Deposits 43% 43% 41% 30% Low Cost Deposits 15% 23% 34% 33% Totals 100%100% 100% 100% Cost of Funds FY 2001 FY 2002 FY 2003 FY 2004 |
| Leverage 5.07%4.35% 4.11% 3.45% Other Deposits 4.77% 2.98% 1.92% 1.56% Low Cost Deposits 0.45% 0.42% 0.24% 0.18% Total Cost of Deposits including DDA 3.68%2.20% 1.23%0.88% Margin Impact FY 2001 FY 2002 FY 2003 FY 2004 |
| Earning Asset Yield 7.63% 6.38% 5.39% 5.32% Cost of Liabilities 4.59% 3.27% 2.52% 1.92% Spread 3.04% 3.11% 2.87% 3.40% |
| Effect of No Cost Funds 0.57% 0.41% 0.41% 0.39% Net Interest Margin 3.61% 3.52% 3.28% 3.79% |
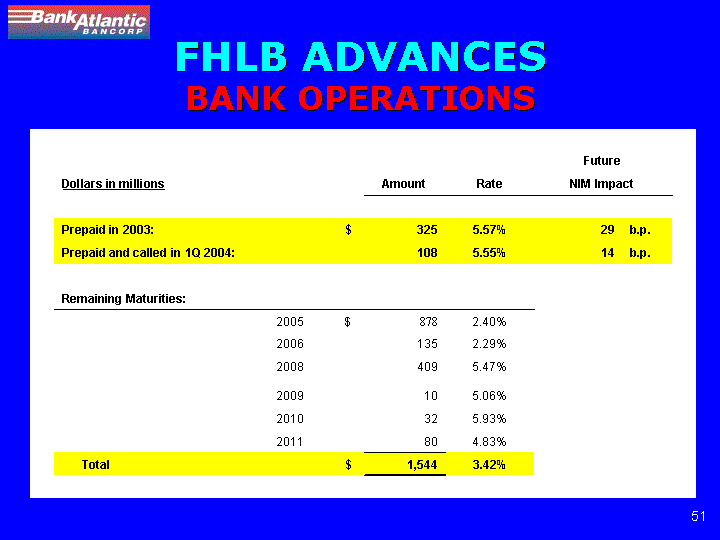
| FHLB ADVANCES BANK OPERATIONS |
| Future Dollars in millions Amount Rate NIM Impact — |
| Prepaid in 2003: $ 325 5.57% 29 b.p. Prepaid and called in 1Q 2004: 108 5.55% 14 b.p. Remaining Maturities: |
| 2005 $ 878 2.40% 2006 135 2.29% 2008 409 5.47% 2009 10 5.06% 2010 32 5.93% 2011 80 4.83% Total $ 1,544 3.42% |
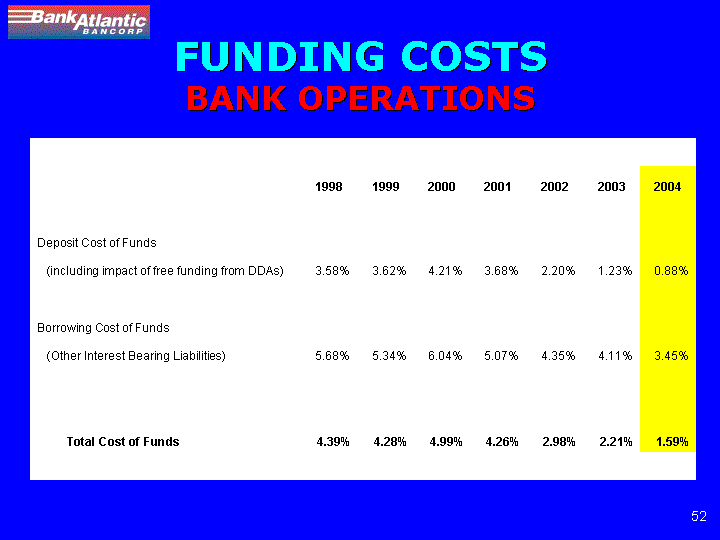
| FUNDING COSTS BANK OPERATIONS 1998 1999 2000 2001 2002 2003 2004 |
| Deposit Cost of Funds (including impact of free funding from DDAs) 3.58% 3.62% 4.21% 3.68% 2.20% 1.23% 0.88% Borrowing Cost of Funds (Other Interest Bearing Liabilities) 5.68% 5.34% 6.04% 5.07% 4.35% 4.11% 3.45% Total Cost of Funds 4.39% 4.28% 4.99% 4.26% 2.98% 2.21% 1.59% |
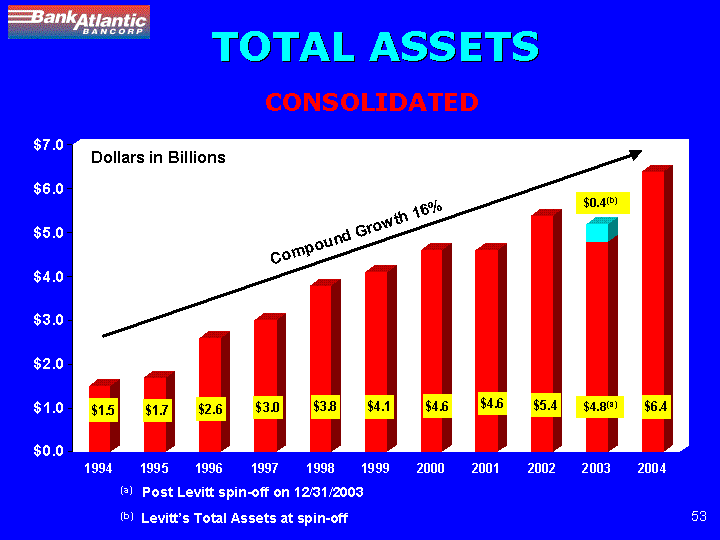
| TOTAL ASSETS CONSOLIDATED Dollars in Billions Compound Growth 16% $7.00 $6.00 $5.00 $4.00 $3.00 $2.00 $1.00 $0.00 1994 1995 1996 1997 1998 1999 2000 2001 2002 2003 2004 $1.5 $1.7 $2.6 $3.0 $3.8 $4.1 $4.6 $4.6 $5.4 $4.8 (a) $6.4 $0.4(b) (a) Post Levitt spin-off on 12/31/2003 (b) Levitt’s Total Assets at spin-off |
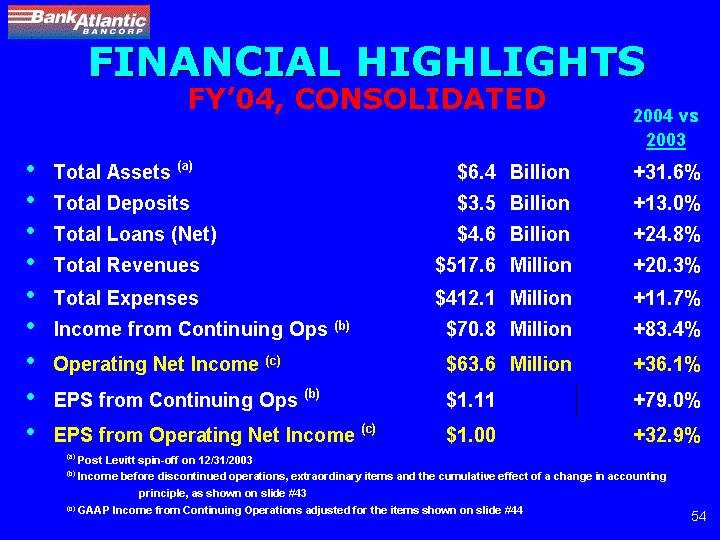
| FINANCIAL HIGHLIGHTS FY’04, CONSOLIDATED |
| • Total Assets (a) $6.4 Billion +31.6% • Total Deposits $3.5Billion +13.0% • Total Loans (Net) $4.6 Billion +24.8% • Total Revenues $517.6 Million +20.3% • Total Expenses $412.1 Million +11.7% • Income from Continuing Ops (b) $70.8 Million +83.4% • Operating Net Income (c) $63.6Million +36.1% • EPS from Continuing Ops (b) $1.11 +79.0% |
| EPS from Operating Net Income (c) $1.00 +32.9% |
| (a) Post Levitt spin-off on 12/31/2003 (b) Income before discontinued operations, extraordinary items and the cumulative effect of a change in accounting principle, as shown on slide #43 (c) GAAP Income from Continuing Operations adjusted for the items shown on slide #44 |