Exhibit 99.1

BankAtlantic Bancorp Reports Earnings
For The Third Quarter, 2005
- Discusses Marketing Initiatives -
FORT LAUDERDALE, Florida — October 19, 2005 — BankAtlantic Bancorp, Inc. (NYSE: BBX), the parent company of BankAtlantic and Ryan Beck & Co., today announced financial results for the third quarter ended September 30, 2005. Net income increased 10.9% to $16.3 million for the third quarter 2005, up from $14.7 million earned in the 2004 quarter. Year-to-date, net income increased 13.5% to $60.7 million in the nine months ending September 30, 2005, up from $53.5 million earned in the comparable period in 2004. Diluted earnings per share were $0.26 for the quarter, up 13.0%, and $0.95 year-to-date, up 13.1%.
Additional accomplishments and highlights include:
BankAtlantic:
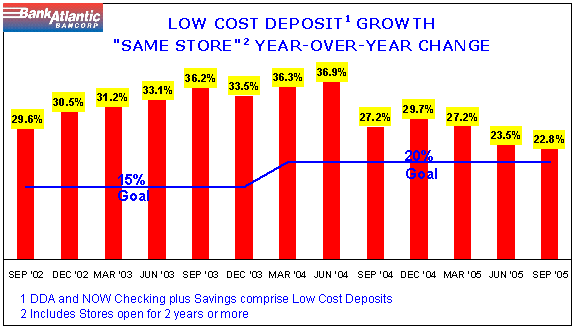
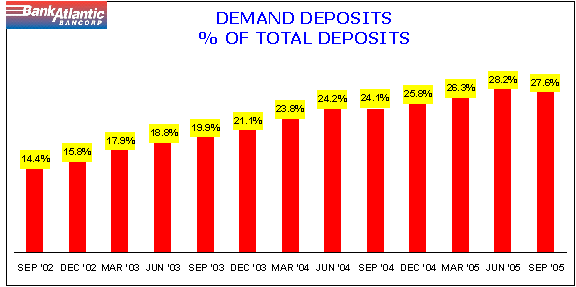
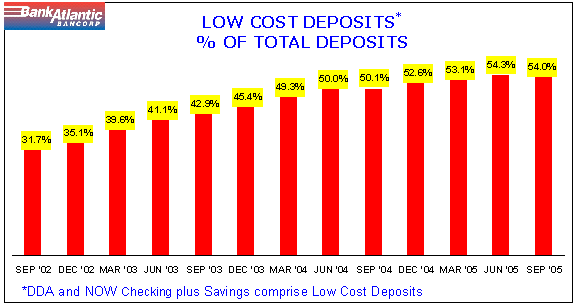
BankAtlantic Bancorp’s Chairman and Chief Executive Officer, Alan B. Levan commented, “We are pleased with the quarter’s results, particularly with the continued effectiveness of BankAtlantic’s ‘Florida’s Most Convenient Bank’ initiatives. Low cost deposit balances (checking and savings) grew 22.8% on a ‘same store’ basis over the same period last year. New account openings were up 32% with nearly 51,000 new accounts being opened this quarter. Since the inception of our ‘Florida’s Most Convenient Bank’ initiatives in the beginning of 2002, demand (checking) deposits have more than doubled, now representing 28 % of total deposits at quarter-end, compared with 13% of total deposits at the end of the fourth quarter 2001. Low cost deposits have also more than doubled during this same period, rising to 54% of total deposits vs. 26% in the fourth quarter 2001. If we included money market deposits in our calculation, checking, savings and money market deposits would be 79% of total deposits at this quarter-end.
1
2
“The tax equivalent net interest margin grew to 3.96% during the third quarter, compared with 3.78% in the 2004 period, and 3.90% in the second quarter of 2005. A 3.96% net interest margin is the highest in over a decade at BankAtlantic. Total loans were $4.5 billion at quarter end, down slightly on average over the second quarter of this year, consistent with our strategy of limiting growth in residential loans due to the relative flatness of the current yield curve. Short term borrowings and advances from the Federal Home Loan Bank were reduced approximately $400 million at September 30, 2005 compared to June 30, 2005. We are waiting for a more opportunistic yield curve before significantly growing the asset side of the balance sheet.
“Nationally there has been a decline in the rate of net growth of all categories of deposits, certainly including checking and savings, which we believe is the result of lower balances in existing accounts. While we have not seen a complete analysis on this trend, we believe the national declines relate to customer outflows due to higher energy prices, increased payments on credit card debt due to regulatory directives to national credit card issuers, and higher payments on increased interest rates on adjustable rate mortgages as well as competition from yields on alternative deposit products. Consistent with this trend, we experienced a decline in BankAtlantic’s low cost net deposit growth rates from the highs established in 2002-2004, when the net growth rates were in the 30-35% range on a same store basis, to current net growth rates, which have been in the 20-25% range this year. Between June and September 2005, average balances in BankAtlantic low cost deposits declined $220 per account, even though average opening balances innew accounts remained stable. We believe this points to our customers’ response to these external factors, and in large part explains our lower growth despite continued new account openings at our normal activity level and initial account size.
“A study by the Federal Reserve Bank of St. Louis noted a decline in the year over year growth in ‘checkable’ deposits (Demand and NOW) from a fairly stable average of 4.7% in the period of August through December, 2004 — thereafter steadily declining to an actualdecrease of approximately 1.8% in August, 2005. We are proud that during this period our growth rates have consistently outperformed the national trends by a margin of 22-29% for comparable deposits. We conclude from this analysis that, while our net growth rates have slowed, they still compare extremely well with the national experience, and confirm the continued effectiveness of our strategy. A graph illustrating this comparison is shown below.
3
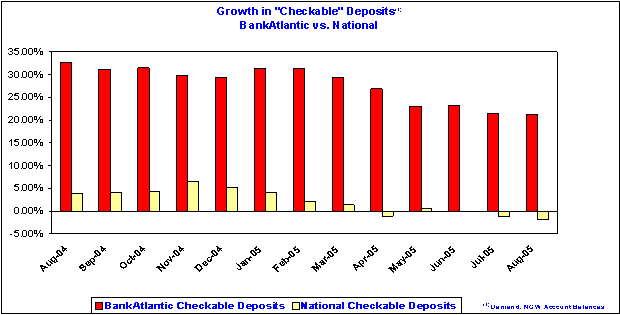
| Aug-04 | Sep-04 | Oct-04 | Nov-04 | Dec-04 | Jan-05 | Feb-05 | Mar-05 | Apr-05 | May-05 | Jun-05 | Jul-05 | Aug-05 | ||||||||||||||||||||||||||||||||||||||||
Growth in BankAtlantic Checkable Deposits | 32.6 | % | 31.2 | % | 31.5 | % | 29.9 | % | 29.4 | % | 31.4 | % | 31.3 | % | 29.4 | % | 26.9 | % | 23.1 | % | 23.3 | % | 21.6 | % | 21.2 | % | ||||||||||||||||||||||||||
Growth in National Checkable Deposits | 3.9 | % | 4.1 | % | 4.2 | % | 6.4 | % | 5.1 | % | 4.0 | % | 2.2 | % | 1.4 | % | -1.1 | % | 0.6 | % | -0.1 | % | -1.2 | % | -1.8 | % | ||||||||||||||||||||||||||
Spread | 28.7 | % | 27.1 | % | 27.3 | % | 23.5 | % | 24.3 | % | 27.4 | % | 29.1 | % | 28.0 | % | 28.0 | % | 22.5 | % | 23.4 | % | 22.8 | % | 23.0 | % | ||||||||||||||||||||||||||
“We continue to believe the real creation of long-term value lies in sustaining high growth rates in core deposits. In order to compensate for lower average account balances, we anticipate increasing our marketing expenses in an attempt to generate additional deposits. Additional outlays of as much as $5.0 million per quarter over current levels may occur in the fourth quarter, 2005 and throughout 2006, which will have an impact on earnings in the short run. We believe this short-term negative impact on earnings will be compensated by above average top line (low cost deposit) growth that over the long run is vitally important to our franchise value and achieving superior profitability.
“Although the yield curve remained relatively flat, BankAtlantic has continued to realize improvements in the net interest margin to 3.96%. This continued improvement in the margin reflects several factors, including the increased level of low cost deposits and their increased value in a higher interest rate environment, the repayment of certain high cost FHLB advances in prior periods, and higher earning asset yields. As we have noted before, the continued flattening of the yield curve will exert downward pressure on the margin, which we presently anticipate will continue to be offset by improved funding mix, driven principally by a higher percentage of low cost deposits.
4
“Credit quality remained strong in the third quarter, with net recoveries in the period of $455,000 compared to net charge-offs of $212,000 for the immediately preceding quarter. On a year-to-date basis, the Bank had net recoveries of $1.2 million. We recorded a negative provision for loan losses of $3.4 million for the third quarter vs. a provision expense of $820,000 in the second quarter, 2005. Year-to-date, the provision expense has been a negative $6.5 million vs. a negative provision of $1.1 million in the same period of 2004. The ratio of the allowance for loan losses to non-performing loans remained high, closing the quarter at 591%.
“We recently announced Mark Begelman’s promotion to Executive Vice President and Chief Marketing Officer as well as welcomed him to the Bank’s Executive Management team. His responsibilities will include all aspects of BankAtlantic’s marketing and advertising strategies and he will also manage our new store real estate and construction efforts. Mark has more than 30 years of executive experience, was twice named Ernst and Young’s ‘Entrepreneur of the Year’ and Financial News’ CEO of the Year. As President and COO of Office Depot from April 1991 through May 1995, Mark grew the company’s store base from 127 to 467 stores and increased revenue from $900 million to $4.5 billion in four years. In addition, Mark was Founder and CEO of Mars Music, December 1995 through October 2002, opening 52 musical instrument superstores. Mark brings an extensive background in retail operations, particularly in new store operations and in marketing for competitive retail environments, which will support and augment our strategic growth.
“BankAtlantic completed the move to its new corporate headquarters during the quarter. Our new 180,000 square-foot ‘Corporate Office’ consolidates most administrative and support departments, customer service, training, and executive functions into one location, providing a technologically advanced and operationally efficient environment.
“During the quarter, BankAtlantic also announced its agreement with Sunrise Sports & Entertainment for the exclusive naming rights to the home of the National Hockey League’s ‘Florida Panthers.’ The ‘BankAtlantic Center’ is a 20,000-seat sports and entertainment venue centrally located in South Florida and was ranked by Billboard Magazine last year as the 13th largest venue in North America in total gross ticket sales for concerts and shows in 2004. The ‘BankAtlantic Center’ provides BankAtlantic with extensive local and regional brand exposure through signage and extensive media coverage.
“BankAtlantic continues to redefine ‘banker’s hours’ during the quarter by extending its store hours throughout its footprint. BankAtlantic’s stores are now open on average 80 hours a week, providing customers more hours to conduct their banking activities than any Florida bank. When
5
combined with our midnight hours stores, holiday hours, and our 24/7 Customer Service Center, BankAtlantic now offers a distinctly higher level of convenience than any competitive institution.
Ryan Beck & Co.:
“We are very pleased to report that Ryan Beck & Co.’s Financial Institutions Group was recently ranked by SNL Securities as the number one advisor in terms of offering amount for the first nine months of 2005. Significantly, the earnings of Ryan Beck for this quarter were down for both the quarter and the year-to-date, almost exclusively due to one large transaction that took place in the second quarter, 2005. That transaction was the largest single transaction ever recorded at Ryan Beck.
“Ryan Beck also expanded its municipal finance capability with the hiring of two seasoned professionals from another firm. Bonnie Siegel will be based in New York and oversee the firm’s municipal investment banking efforts. She previously served as a Managing Director of a competitor’s Public Finance Department and manager of its Healthcare Group. Hamilton Chang will be based in Chicago, and will oversee Ryan Beck’s institutional municipal trading, sales and derivative capabilities. He previously was Managing Director of another firm’s Structured Products Group. These additions follow similar additions announced in prior quarters designed to augment Ryan Beck’s capabilities in several market niches. Each addition, including others announced earlier, is expected to be accretive to earnings within the first year.
BankAtlantic Bancorp:
“BankAtlantic has continued to address compliance with the USA Patriot Act, anti-money laundering laws and the Bank Secrecy Act. Improvements include revised technology and systems and procedures, and a substantial increase to compliance staffing. As we have indicated previously, we cannot predict whether or to what extent monetary or other penalties or restrictions might be imposed upon us by regulators or other federal agencies relating to previously identified compliance deficiencies.”
6
Financial Highlights:
Third Quarter, 2005 Compared to Third Quarter, 2004
Third Quarter, 2005 Compared to Third Quarter, 2004
BankAtlantic Bancorp — consolidated:
| • | Net income of $16.3 million vs. $14.7 million, an increase of 11%. | ||
| • | Diluted earnings per share of $0.26 vs. $0.23, an increase of 13%. | ||
| • | Return on average tangible equity was 15.1%. | ||
| • | Book value per share rose to $8.62. |
BankAtlantic:
| • | Business segment net income was $19.3 million vs. $13.6 million, an increase of 42%. | ||
| • | Return on average tangible assets was 1.26%. | ||
| • | Return on average tangible equity was 16.3%. | ||
| • | Tax equivalent net interest margin increased to 3.96% vs. 3.78%. | ||
| • | Non-interest income was $25.7 million vs. $22.3 million, an increase of 15%. | ||
| • | Non-interest expense grew to $56.7 million vs. $45.5 million, an increase of 25%. |
Ryan Beck & Co.:
| • | Business segment income was $423,000 vs. $4.1 million, a decrease of 90%. | ||
| • | Return on average tangible equity was 1.7%. | ||
| • | Total operating revenues declined slightly to $54.1 million vs. $55.5 million. | ||
| • | Principal transactions were $22.9 million vs. $19.4 million. | ||
| • | Investment banking revenue declined to $3.7 million vs. $13.8 million. | ||
| • | Commission income was $21.4 million vs. $18.6 million. |
7
Year to Date 2005, Compared to Year to Date 2004
BankAtlantic Bancorp — consolidated:
| • | Net income was $60.7 million vs. $53.5 million. Excluding the impairment charge during the June 2005 quarter, of $3.7 million relating to our former headquarters building, a gain in 2004 of $22.8 million from a litigation settlement and an $11.7 million expense in 2004 resulting from the early redemption of debt, operating net income would have been $63.1 million vs. $46.3 million, an increase of 36%. | ||
| • | Diluted earnings per share of $0.95 vs. $0.84, an increase of 13%. Excluding the effects of the items discussed above, diluted earnings per share would have been $0.99 vs. $0.73, an increase of 36%. | ||
| • | Return on average tangible equity was 19.6%. |
BankAtlantic:
| • | Business segment operating net income was $57.3 million vs. $39.4 million, an increase of 46%. | ||
| • | Return on average tangible assets was 1.20% and return on average tangible equity was 15.9%. Excluding the effect of the facilities impairment charge, these ratios would have been 1.25%, and 16.5%, respectively. | ||
| • | Tax equivalent net interest margin increased to 3.91% vs. 3.75%. | ||
| • | Non-interest income was $74.2 million vs. $62.7 million, an increase of 18%. | ||
| • | Non-interest expense, excluding the impairment charge and the costs associated with debt redemption, grew to $161.6 million vs. $130.2 million, an increase of 24%. |
Ryan Beck & Co.:
| • | Business segment net income was $16.0 million vs. $16.2 million. | ||
| • | Return on average tangible equity was 23.2%. | ||
| • | Total operating revenues increased to $199.2 million vs. $187.3 million. | ||
| • | Principal transactions were $79.4 million vs. $65.5 million. | ||
| • | Investment banking revenue declined slightly to $41.0 million vs. $44.5 million. | ||
| • | Commission income was lower, at $61.2 million vs. $66.2 million. |
8
BankAtlantic Bancorp will host an investor and media teleconference call and webcast on Thursday, October 20, 2005, at 11:00 a.m. (Eastern Time).
Teleconference Call Information:
To access the teleconference call in the U.S. and Canada, the toll free number to call is 1-800-968-8156. International calls may be placed to 706-634-5752. Domestic and international callers may reference PIN number9177012.
A replay of the conference call will be available beginning two hours after the call’s completion through 5:00 p.m. Eastern Time, Friday, November 18, 2005. To access the replay option in the U.S. and Canada, the toll free number to call is 1-800-642-1687. International calls for the replay may be placed at 706-645-9291. The replay digital PIN number for both domestic and international calls is9177012.
Webcast Information:
Alternatively, individuals may listen to the live and/or archived webcast of the teleconference call. To listen to the webcast, visitwww.BankAtlanticBancorp.com, access the “Investor Relations” section, and click on the “Webcast” navigation link. The archive of the teleconference call will be available through 5:00 p.m. Eastern Time, Friday, November 18, 2005.
BankAtlantic Bancorp’s third quarter, 2005 earnings results press release and financial summary, as well as the Supplemental Financials (extensive business segment financial data), will be available on its website at:www.BankAtlanticBancorp.com.
| • | To view the press release and financial summary, access the “Investor Relations” section and click on the “Quarterly Financials” navigation link. | ||
| • | To view the Supplemental Financials, access the “Investor Relations” section and click on the “Supplemental Financials” navigation link. |
Copies of BankAtlantic Bancorp’s third quarter, 2005 earnings results press release and financial summary, and the Supplemental Financials will also be made available upon request via fax, email, or postal service mail. To request a copy, contact BankAtlantic Bancorp’s Investor Relations department using the contact information listed below
About BankAtlantic Bancorp:
BankAtlantic Bancorp (NYSE: BBX) is a diversified financial services holding company and the parent company of BankAtlantic and Ryan Beck & Co. Through these subsidiaries, BankAtlantic Bancorp provides a full line of products and services encompassing consumer and commercial banking, brokerage and investment banking.
BankAtlantic Bancorp (NYSE: BBX) is a diversified financial services holding company and the parent company of BankAtlantic and Ryan Beck & Co. Through these subsidiaries, BankAtlantic Bancorp provides a full line of products and services encompassing consumer and commercial banking, brokerage and investment banking.
9
About BankAtlantic:
BankAtlantic, “Florida’s Most Convenient Bank” is one of the largest financial institutions headquartered in Florida and provides a comprehensive offering of banking services and products via its broad network of community stores and its online banking division — BankAtlantic.com. BankAtlantic has 78 stores and operates more than 200 conveniently located ATMs. BankAtlantic is open 7 days a week and offers holiday hours, extended weekday hours, including several stores open until midnight, Totally Free Online Banking & Bill Pay, 24/7 Customer Service Center, Totally Free Change Exchange coin counters and free retail and business checking with a free gift.
BankAtlantic, “Florida’s Most Convenient Bank” is one of the largest financial institutions headquartered in Florida and provides a comprehensive offering of banking services and products via its broad network of community stores and its online banking division — BankAtlantic.com. BankAtlantic has 78 stores and operates more than 200 conveniently located ATMs. BankAtlantic is open 7 days a week and offers holiday hours, extended weekday hours, including several stores open until midnight, Totally Free Online Banking & Bill Pay, 24/7 Customer Service Center, Totally Free Change Exchange coin counters and free retail and business checking with a free gift.
About Ryan Beck & Co.:
Founded in 1946, Ryan Beck & Co., Inc. provides financial advice and innovative solutions to individuals, institutions and corporate clients through the activities of approximately 1,000 employees in 39 offices located in 13 states. For individual investors, the firm’s Private Client Group provides a full range of financial services, including investment consulting, retirement plans, insurance and investment advisory services. Institutional clients benefit from the market making, underwriting and distribution activities of the firm’s experienced Capital Markets Group, which encompasses equity and fixed income trading and institutional sales as well as research. Through its Investment Banking Groups, Ryan Beck raises capital and provides financial advisory services to financial institutions, middle market companies, and municipalities.
Founded in 1946, Ryan Beck & Co., Inc. provides financial advice and innovative solutions to individuals, institutions and corporate clients through the activities of approximately 1,000 employees in 39 offices located in 13 states. For individual investors, the firm’s Private Client Group provides a full range of financial services, including investment consulting, retirement plans, insurance and investment advisory services. Institutional clients benefit from the market making, underwriting and distribution activities of the firm’s experienced Capital Markets Group, which encompasses equity and fixed income trading and institutional sales as well as research. Through its Investment Banking Groups, Ryan Beck raises capital and provides financial advisory services to financial institutions, middle market companies, and municipalities.
For further information, please visit our websites:
www.BankAtlanticBancorp.com
www.BankAtlantic.com
www.RyanBeck.com
www.BankAtlanticBancorp.com
www.BankAtlantic.com
www.RyanBeck.com
* To receive future BankAtlantic Bancorp news releases or announcements directly via Email, please click on the Email Broadcast Sign Up button on our website:www.BankAtlanticBancorp.com.
BankAtlantic Bancorp Contact Info:
Donna Rouzeau,
Assistant Vice President, Investor Relations, & Corporate Communications
Email:CorpComm@BankAtlanticBancorp.com
Leo Hinkley,
Senior Vice President, Investor Relations
Email:InvestorRelations@BankAtlanticBancorp.com
Donna Rouzeau,
Assistant Vice President, Investor Relations, & Corporate Communications
Email:CorpComm@BankAtlanticBancorp.com
Leo Hinkley,
Senior Vice President, Investor Relations
Email:InvestorRelations@BankAtlanticBancorp.com
Phone: (954) 940-5300, Fax: (954) 940-5320
Mailing Address: BankAtlantic Bancorp, Investor Relations,
2100 West Cypress Creek Road, Fort Lauderdale, FL, 33309
Mailing Address: BankAtlantic Bancorp, Investor Relations,
2100 West Cypress Creek Road, Fort Lauderdale, FL, 33309
BankAtlantic, “Florida’s Most Convenient Bank,” Contact Info:
Public Relations:
Hattie Hess, Vice President, Public Relations
Telephone: (954) 940-6383, Fax: (954) 940-6310
Email:hhess@BankAtlantic.com
Public Relations:
Hattie Hess, Vice President, Public Relations
Telephone: (954) 940-6383, Fax: (954) 940-6310
Email:hhess@BankAtlantic.com
Public Relations for BankAtlantic:
Boardroom Communications
Caren Berg
Phone: (954) 370-8999, Fax: (954) 370-8892
Email:caren@boardroompr.com
Boardroom Communications
Caren Berg
Phone: (954) 370-8999, Fax: (954) 370-8892
Email:caren@boardroompr.com
10
# # #
Except for historical information contained herein, the matters discussed in this press release contain forward-looking statements within the meaning of Section 27A of the Securities Act of 1933, as amended (the “Securities Act”), and Section 21E of the Securities Exchange Act of 1934, as amended (the “Exchange Act”), that involve substantial risks and uncertainties. When used in this press release, the words “anticipate,” “believe,” “estimate,” “may,” “intend,” “expect” and similar expressions identify certain of such forward-looking statements. Actual results, performance, or achievements could differ materially from those contemplated, expressed, or implied by the forward-looking statements contained herein. These forward-looking statements are based largely on the expectations of BankAtlantic Bancorp, Inc. (“the Company”) and are subject to a number of risks and uncertainties that are subject to change based on factors which are, in many instances, beyond the Company’s control. These include, but are not limited to, risks and uncertainties associated with: the impact of economic, competitive and other factors affecting the Company and its operations, markets, products and services; credit risks and loan losses, and the related sufficiency of the allowance for loan losses; changes in interest rates and the effects of, and changes in, trade, monetary and fiscal policies and laws including their impact on the bank’s net interest margin; adverse conditions in the stock market, the public debt market and other capital markets and the impact of such conditions on our activities and the value of our assets; BankAtlantic’s seven-day banking initiative, marketing initiatives, and other growth initiatives not resulting in continued growth of low cost deposits or otherwise not producing results which justify their costs; the impact of periodic testing of goodwill and other intangible assets for impairment; as well as our ability to correct and the associated costs of correcting the compliance deficiencies associated with the USA Patriot Act, anti-money laundering laws and the Bank Secrecy Act, and whether or to what extent monetary or other restrictions or penalties relating to compliance deficiencies will be imposed on the Company by regulators or other federal agencies. The results or performance derived or implied, directly or indirectly from the estimates and assumptions, are based on our beliefs and may not be accurate. Past performance, actual or estimated new account openings and growth rates may not be indicative of future results. Further, this press release contains forward-looking statements with respect to Ryan Beck & Co., which are subject to a number of risks and uncertainties including but not limited to the risks and uncertainties associated with its operations, products and services, changes in economic or regulatory policies, its ability to recruit and retain financial consultants, the volatility of the stock market and fixed income markets and its effects on the volume of its business and the value of its securities positions and portfolio, as well as its revenue mix, and the success of new lines of business; and additional risks and uncertainties that are subject to change and may be outside of Ryan Beck’s control. In addition to the risks and factors identified above, reference is also made to other risks and factors detailed in reports filed by the Company with the Securities and Exchange Commission. The Company cautions that the foregoing factors are not exclusive.
11
BankAtlantic Bancorp, Inc. and Subsidiaries
Summary of Selected Financial Data (unaudited)
Summary of Selected Financial Data (unaudited)
| For the Nine | ||||||||||||||||||||||||||||||
| For The Three Months Ended | Months Ended | |||||||||||||||||||||||||||||
| 9/30/2005 | 6/30/2005 | 3/31/2005 | 12/31/2004 | 9/30/2004 | 9/30/2005 | 9/30/2004 | ||||||||||||||||||||||||
| Earnings (in thousands): | ||||||||||||||||||||||||||||||
| Net income (GAAP basis) | $ | 16,260 | 24,537 | 19,878 | 17,293 | 14,691 | 60,675 | 53,475 | ||||||||||||||||||||||
| Operating net income ** | (note 1) | $ | 16,260 | 26,946 | 19,878 | 17,293 | 14,691 | 63,084 | 46,322 | |||||||||||||||||||||
| Average Common Shares Outstanding (in thousands): | ||||||||||||||||||||||||||||||
| Basic | 60,555 | 60,453 | 60,072 | 59,827 | 59,687 | 60,362 | 59,430 | |||||||||||||||||||||||
| Diluted | 63,193 | 63,161 | 63,207 | 63,156 | 63,110 | 63,176 | 63,026 | |||||||||||||||||||||||
| Key Performance Ratios (GAAP basis): | ||||||||||||||||||||||||||||||
| Basic earnings per share | $ | 0.27 | 0.41 | 0.33 | 0.29 | 0.25 | 1.01 | 0.90 | ||||||||||||||||||||||
| Diluted earnings per share * | $ | 0.26 | 0.38 | 0.31 | 0.27 | 0.23 | 0.95 | 0.84 | ||||||||||||||||||||||
| Return on average tangible assets | (note 2) | % | 1.01 | 1.51 | 1.27 | 1.19 | 1.09 | 1.26 | 1.42 | |||||||||||||||||||||
| Return on average tangible equity | (note 2) | % | 15.05 | 23.98 | 20.20 | 18.34 | 16.18 | 19.64 | 20.63 | |||||||||||||||||||||
| Key Performance Ratios (Operating basis): | ||||||||||||||||||||||||||||||
| Basic earnings per share | $ | 0.27 | 0.45 | 0.33 | 0.29 | 0.25 | 1.05 | 0.78 | ||||||||||||||||||||||
| Diluted earnings per share * | $ | 0.26 | 0.42 | 0.31 | 0.27 | 0.23 | 0.99 | 0.73 | ||||||||||||||||||||||
| Return on average tangible assets | (note 2) | % | 1.01 | 1.66 | 1.27 | 1.19 | 1.09 | 1.31 | 1.23 | |||||||||||||||||||||
| Return on average tangible equity | (note 2) | % | 15.05 | 26.33 | 20.20 | 18.34 | 16.18 | 20.42 | 17.87 | |||||||||||||||||||||
| * Diluted earnings per share calculation deducts (in thousands): | ||||||||||||||||||||||||||||||
| Subsidiaries stock options, if dilutive | $ | (21 | ) | (665 | ) | (120 | ) | (51 | ) | (152 | ) | (806 | ) | (617 | ) | |||||||||||||||
| Average Balance Sheet Data (in millions): | ||||||||||||||||||||||||||||||
| Assets | $ | 6,545 | 6,565 | 6,355 | 5,877 | 5,478 | 6,489 | 5,099 | ||||||||||||||||||||||
| Tangible assets | (note 2) | $ | 6,459 | 6,479 | 6,268 | 5,790 | 5,390 | 6,403 | 5,011 | |||||||||||||||||||||
| Loans | $ | 4,726 | 4,802 | 4,668 | 4,359 | 4,032 | 4,732 | 3,847 | ||||||||||||||||||||||
| Investments | $ | 1,322 | 1,306 | 1,242 | 1,076 | 1,018 | 1,290 | 836 | ||||||||||||||||||||||
| Deposits and escrows | $ | 3,655 | 3,658 | 3,557 | 3,371 | 3,283 | 3,624 | 3,185 | ||||||||||||||||||||||
| Stockholders’ equity | $ | 516 | 490 | 480 | 468 | 452 | 495 | 437 | ||||||||||||||||||||||
| Tangible stockholders’ equity | (note 2) | $ | 432 | 409 | 394 | 377 | 363 | 412 | 346 | |||||||||||||||||||||
Notes:
| (1) | Operating net income is defined as GAAP net income adjusted for gain from a litigation settlement, costs associated with debt redemptions and an impairment charge relating to BankAtlantic’s former headquarter facility, net of tax. | |
| (2) | Average tangible assets is defined as average total assets less average goodwill and core deposit intangibles. Average tangible equity is defined as average total stockholders’ equity less average goodwill, core deposit intangibles and other comprehensive income. | |
| ** | Operating net income is not prepared in accordance with GAAP and this non-GAAP financial measure should not be construed as being superior to GAAP. |
BankAtlantic Bancorp, Inc. and Subsidiaries
Consolidated Statements of Financial Condition (unaudited)
Consolidated Statements of Financial Condition (unaudited)
| (In thousands, except share data) | 9/30/2005 | 12/31/2004 | 9/30/2004 | |||||||||
ASSETS | ||||||||||||
| Cash and due from banks | $ | 140,346 | 118,967 | 119,606 | ||||||||
| Short term investments | 11,802 | 16,093 | 26,015 | |||||||||
| Securities available for sale (at fair value) | 702,176 | 747,160 | 679,644 | |||||||||
| Securities owned (at fair value) | 120,298 | 125,443 | 111,944 | |||||||||
| Investment securities and tax certificates (approximate fair value: $366,456, $306,963 and $159,944) | 366,884 | 307,438 | 159,944 | |||||||||
| Loans receivable, net of allowance for loan losses of $40,695, $46,010 and $48,778 | 4,543,245 | 4,599,048 | 4,176,571 | |||||||||
| Federal Home Loan Bank stock, at cost which approximates fair value | 78,931 | 78,619 | 62,425 | |||||||||
| Accrued interest receivable | 39,766 | 35,982 | 30,126 | |||||||||
| Real estate held for development and sale | 24,493 | 27,692 | 25,521 | |||||||||
| Investments and advances in unconsolidated subsidiaries | 12,510 | 7,910 | 7,910 | |||||||||
| Office properties and equipment, net | 140,466 | 129,790 | 115,809 | |||||||||
| Deferred tax asset, net | 25,591 | 20,269 | 18,413 | |||||||||
| Goodwill | 76,674 | 76,674 | 76,674 | |||||||||
| Core deposit intangible asset | 8,796 | 10,270 | 10,695 | |||||||||
| Due from clearing agent | 15,650 | 16,619 | 14,478 | |||||||||
| Other assets | 45,194 | 38,803 | 42,837 | |||||||||
| Total assets | $ | 6,352,822 | 6,356,777 | 5,678,612 | ||||||||
LIABILITIES AND STOCKHOLDERS’ EQUITY | ||||||||||||
| Liabilities: | ||||||||||||
| Deposits | ||||||||||||
| Demand | $ | 1,017,071 | 890,398 | 781,916 | ||||||||
| NOW | 673,803 | 658,137 | 590,051 | |||||||||
| Savings | 303,348 | 270,001 | 252,408 | |||||||||
| Money market | 921,585 | 875,422 | 893,315 | |||||||||
| Certificates of deposit | 777,743 | 763,244 | 724,601 | |||||||||
| Total deposits | 3,693,550 | 3,457,202 | 3,242,291 | |||||||||
| Advances from FHLB | 1,485,649 | 1,544,497 | 1,249,112 | |||||||||
| Securities sold under agreements to repurchase | 147,966 | 296,643 | 200,550 | |||||||||
| Federal funds purchased | 28,042 | 105,000 | 86,300 | |||||||||
| Subordinated debentures, notes and bonds payable | 40,702 | 37,741 | 36,780 | |||||||||
| Junior subordinated debentures | 263,266 | 263,266 | 263,266 | |||||||||
| Securities sold but not yet purchased | 20,688 | 39,462 | 31,760 | |||||||||
| Other liabilities | 149,567 | 143,701 | 109,064 | |||||||||
| Total liabilities | 5,829,430 | 5,887,512 | 5,219,123 | |||||||||
Stockholders’ equity: | ||||||||||||
| Preferred stock, $.01 par value, 10,000,000 shares authorized; none issued and outstanding | — | — | — | |||||||||
| Class A common stock, $.01 par value, authorized 80,000,000 shares; issued and outstanding 55,862,486, 55,214,225 and 54,997,960 shares | 559 | 552 | 550 | |||||||||
| Class B common stock, $.01 par value, authorized 45,000,000 shares; issued and outstanding 4,876,124, 4,876,124 and 4,876,124 shares | 49 | 49 | 49 | |||||||||
| Additional paid-in capital | 261,587 | 259,702 | 258,980 | |||||||||
| Unearned compensation — restricted stock grants | (1,021 | ) | (1,001 | ) | (1,046 | ) | ||||||
| Retained earnings | 265,082 | 210,955 | 195,765 | |||||||||
| Total stockholders’ equity before accumulated other comprehensive income | 526,256 | 470,257 | 454,298 | |||||||||
| Accumulated other comprehensive income (loss) | (2,864 | ) | (992 | ) | 5,191 | |||||||
| Total stockholders’ equity | 523,392 | 469,265 | 459,489 | |||||||||
| Total liabilities and stockholders’ equity | $ | 6,352,822 | 6,356,777 | 5,678,612 | ||||||||
BankAtlantic Bancorp, Inc. and Subsidiaries
Consolidated Statements of Operations (unaudited)
Consolidated Statements of Operations (unaudited)
| For the Nine | ||||||||||||||||||||||||||||||||
| For The Three Months Ended | Months Ended | |||||||||||||||||||||||||||||||
| (in thousands) | 9/30/2005 | 6/30/2005 | 3/31/2005 | 12/31/2004 | 9/30/2004 | 9/30/2005 | 9/30/2004 | |||||||||||||||||||||||||
INTEREST INCOME: | ||||||||||||||||||||||||||||||||
| Interest and fees on loans | $ | 73,110 | 71,099 | 66,355 | 60,088 | 52,661 | 210,564 | 149,631 | ||||||||||||||||||||||||
| Interest on securities available for sale | 4,741 | 5,258 | 5,295 | 4,905 | 4,974 | 15,294 | 13,178 | |||||||||||||||||||||||||
| Interest on tax exempt securities | 3,733 | 3,769 | 3,225 | 2,076 | 1,329 | 10,727 | 1,972 | |||||||||||||||||||||||||
| Interest and dividends on investments and | ||||||||||||||||||||||||||||||||
| securities owned | 8,708 | 7,932 | 7,311 | 7,377 | 7,409 | 23,951 | 21,328 | |||||||||||||||||||||||||
| Total interest income | 90,292 | 88,058 | 82,186 | 74,446 | 66,373 | 260,536 | 186,109 | |||||||||||||||||||||||||
INTEREST EXPENSE: | ||||||||||||||||||||||||||||||||
| Interest on deposits | 10,519 | 9,534 | 8,295 | 7,534 | 7,060 | 28,348 | 20,821 | |||||||||||||||||||||||||
| Interest on advances from FHLB | 17,332 | 15,604 | 13,674 | 11,458 | 9,364 | 46,610 | 26,231 | |||||||||||||||||||||||||
| Interest on short-term borrowed funds | 2,108 | 2,646 | 2,099 | 1,356 | 953 | 6,853 | 1,835 | |||||||||||||||||||||||||
| Interest on long-term debt | 6,392 | 6,316 | 5,672 | 5,112 | 5,034 | 18,380 | 14,773 | |||||||||||||||||||||||||
| Capitalized interest on real estate developments | (477 | ) | (437 | ) | (452 | ) | (390 | ) | (355 | ) | (1,366 | ) | (1,008 | ) | ||||||||||||||||||
| Total interest expense | 35,874 | 33,663 | 29,288 | 25,070 | 22,056 | 98,825 | 62,652 | |||||||||||||||||||||||||
NET INTEREST INCOME | 54,418 | 54,395 | 52,898 | 49,376 | 44,317 | 161,711 | 123,457 | |||||||||||||||||||||||||
| Provision (recovery) for loan losses | (3,410 | ) | 820 | (3,916 | ) | (4,004 | ) | 1,717 | (6,506 | ) | (1,105 | ) | ||||||||||||||||||||
NET INTEREST INCOME AFTER PROVISION | 57,828 | 53,575 | 56,814 | 53,380 | 42,600 | 168,217 | 124,562 | |||||||||||||||||||||||||
NON-INTEREST INCOME: | ||||||||||||||||||||||||||||||||
| Service charges on deposits | 16,415 | 14,744 | 12,989 | 13,637 | 13,493 | 44,148 | 37,798 | |||||||||||||||||||||||||
| Other service charges and fees | 5,824 | 5,849 | 5,238 | 6,733 | 5,819 | 16,911 | 16,887 | |||||||||||||||||||||||||
| Broker/dealer revenue | 50,368 | 83,915 | 54,686 | 53,061 | 52,670 | 188,969 | 178,743 | |||||||||||||||||||||||||
| Securities activities, net | 181 | 90 | 102 | 3,653 | 2 | 373 | 77 | |||||||||||||||||||||||||
| Litigation settlement | — | — | — | — | — | — | 22,840 | |||||||||||||||||||||||||
| Gain on sales of loans | 295 | 116 | 110 | 152 | 86 | 521 | 331 | |||||||||||||||||||||||||
| Income from real estate operations | 1,142 | 1,655 | 2,241 | 517 | 900 | 5,038 | 1,888 | |||||||||||||||||||||||||
| Income from unconsolidated subsidiaries | 142 | 137 | 131 | 126 | 123 | 410 | 359 | |||||||||||||||||||||||||
| Other | 2,137 | 2,697 | 3,173 | 2,026 | 2,081 | 8,007 | 5,961 | |||||||||||||||||||||||||
| Total non-interest income | 76,504 | 109,203 | 78,670 | 79,905 | 75,174 | 264,377 | 264,884 | |||||||||||||||||||||||||
NON-INTEREST EXPENSE: | ||||||||||||||||||||||||||||||||
| Employee compensation and benefits | 68,455 | 78,391 | 65,795 | 65,354 | 58,992 | 212,641 | 189,710 | |||||||||||||||||||||||||
| Occupancy and equipment | 14,853 | 13,953 | 13,237 | 14,753 | 11,782 | 42,043 | 33,393 | |||||||||||||||||||||||||
| Impairment of office properties and equipment | — | 3,706 | — | — | — | 3,706 | — | |||||||||||||||||||||||||
| Advertising and promotion | 6,667 | 8,069 | 6,298 | 5,955 | 4,757 | 21,034 | 15,081 | |||||||||||||||||||||||||
| Professional fees | 4,207 | 4,316 | 4,081 | 7,245 | 4,736 | 12,604 | 10,962 | |||||||||||||||||||||||||
| Communications | 3,371 | 3,508 | 3,205 | 3,301 | 3,182 | 10,084 | 9,226 | |||||||||||||||||||||||||
| Floor broker and clearing fees | 2,305 | 2,012 | 2,368 | 2,452 | 2,143 | 6,685 | 7,383 | |||||||||||||||||||||||||
| Cost associated with debt redemption | — | — | — | — | — | — | 11,741 | |||||||||||||||||||||||||
| Other | 11,326 | 10,188 | 9,801 | 8,460 | 9,025 | 31,315 | 27,037 | |||||||||||||||||||||||||
| Total non-interest expense | 111,184 | 124,143 | 104,785 | 107,520 | 94,617 | 340,112 | 304,533 | |||||||||||||||||||||||||
Income before income taxes | 23,148 | 38,635 | 30,699 | 25,765 | 23,157 | 92,482 | 84,913 | |||||||||||||||||||||||||
| Provision for income taxes | 6,888 | 14,098 | 10,821 | 8,472 | 8,466 | 31,807 | 31,438 | |||||||||||||||||||||||||
GAAP net income | $ | 16,260 | 24,537 | 19,878 | 17,293 | 14,691 | 60,675 | 53,475 | ||||||||||||||||||||||||
Reconciliation of Operating and GAAP Net Income | ||||||||||||||||||||||||||||||||
| GAAP net income | $ | 16,260 | 24,537 | 19,878 | 17,293 | 14,691 | 60,675 | 53,475 | ||||||||||||||||||||||||
| Impairment of office properties and equipment | — | 2,409 | — | — | — | 2,409 | — | |||||||||||||||||||||||||
| Costs associated with debt redemption | — | — | — | — | — | — | 7,632 | |||||||||||||||||||||||||
| Litigation settlement | — | — | — | — | — | — | (14,785 | ) | ||||||||||||||||||||||||
Operating net income | (note 1) | $ | 16,260 | 26,946 | 19,878 | 17,293 | 14,691 | 63,084 | 46,322 | |||||||||||||||||||||||
BankAtlantic Bancorp, Inc. and Subsidiaries
Consolidated Average Balance Sheet (unaudited)
Consolidated Average Balance Sheet (unaudited)
| For The Three Months Ended | ||||||||||||||||||||||||
| (in thousands except percentages and per share data) | 9/30/2005 | 6/30/2005 | 3/31/2005 | 12/31/2004 | 9/30/2004 | |||||||||||||||||||
| Loans: | ||||||||||||||||||||||||
| Residential real estate | $ | 2,245,067 | 2,262,214 | 2,085,473 | 1,812,018 | 1,583,353 | ||||||||||||||||||
| Commercial real estate | 1,643,570 | 1,731,243 | 1,764,927 | 1,743,952 | 1,670,928 | |||||||||||||||||||
| Consumer | 527,190 | 505,338 | 487,746 | 467,716 | 438,205 | |||||||||||||||||||
| Lease financing | 2,768 | 4,710 | 6,242 | 8,219 | 9,738 | |||||||||||||||||||
| Commercial business | 90,578 | 91,756 | 128,372 | 136,391 | 142,022 | |||||||||||||||||||
| Small business | 216,931 | 206,272 | 195,733 | 190,849 | 187,536 | |||||||||||||||||||
| Total Loans | 4,726,104 | 4,801,533 | 4,668,493 | 4,359,145 | 4,031,782 | |||||||||||||||||||
| Investments — taxable | 924,911 | 899,134 | 877,003 | 823,903 | 845,286 | |||||||||||||||||||
| Investments — tax exempt | 396,908 | 406,403 | 364,824 | 251,699 | 172,328 | |||||||||||||||||||
| Total interest earning assets | 6,047,923 | 6,107,070 | 5,910,320 | 5,434,747 | 5,049,396 | |||||||||||||||||||
| Goodwill and core deposit intangibles | 85,679 | 86,095 | 86,791 | 87,164 | 87,591 | |||||||||||||||||||
| Other non-interest earning assets | 411,116 | 371,549 | 358,024 | 354,815 | 340,979 | |||||||||||||||||||
| Total assets | $ | 6,544,718 | 6,564,714 | 6,355,135 | 5,876,726 | 5,477,966 | ||||||||||||||||||
| Tangible assets | (note 2) | $ | 6,459,039 | 6,478,619 | 6,268,344 | 5,789,562 | 5,390,375 | |||||||||||||||||
| Deposits: | ||||||||||||||||||||||||
| Demand deposits | $ | 1,000,219 | 981,643 | 912,897 | 845,797 | 791,639 | ||||||||||||||||||
| Savings | 303,268 | 301,331 | 281,512 | 262,549 | 250,286 | |||||||||||||||||||
| NOW | 666,567 | 685,769 | 664,313 | 622,308 | 590,787 | |||||||||||||||||||
| Money market | 904,382 | 906,514 | 921,382 | 903,602 | 931,596 | |||||||||||||||||||
| Certificates of deposit | 781,044 | 782,335 | 777,353 | 736,704 | 718,826 | |||||||||||||||||||
| Total deposits | 3,655,480 | 3,657,592 | 3,557,457 | 3,370,960 | 3,283,134 | |||||||||||||||||||
| Short-term borrowed funds | 251,242 | 359,861 | 352,911 | 266,840 | 283,011 | |||||||||||||||||||
| FHLB advances | 1,659,411 | 1,615,310 | 1,536,434 | 1,339,051 | 1,036,651 | |||||||||||||||||||
| Long-term debt | 298,887 | 299,075 | 300,551 | 299,741 | 299,596 | |||||||||||||||||||
| Total borrowings | 2,209,540 | 2,274,246 | 2,189,896 | 1,905,632 | 1,619,258 | |||||||||||||||||||
| Other liabilities | 163,581 | 142,617 | 128,233 | 132,047 | 123,750 | |||||||||||||||||||
| 6,028,601 | 6,074,455 | 5,875,586 | 5,408,639 | 5,026,142 | ||||||||||||||||||||
| Stockholders’ equity | 516,117 | 490,259 | 479,549 | 468,087 | 451,824 | |||||||||||||||||||
| Total liabilities and stockholders’ equity | $ | 6,544,718 | 6,564,714 | 6,355,135 | 5,876,726 | 5,477,966 | ||||||||||||||||||
| Other comprehensive income (loss) in stockholders’ equity | $ | (1,612 | ) | (5,119 | ) | (949 | ) | 3,656 | 1,065 | |||||||||||||||
| Tangible stockholders’ equity | (note 2) | $ | 432,050 | 409,283 | 393,707 | 377,267 | 363,168 | |||||||||||||||||
Period End | ||||||||||||||||||||||||
| Total loans, net | $ | 4,543,245 | 4,803,529 | 4,637,232 | 4,599,048 | 4,176,571 | ||||||||||||||||||
| Total assets | 6,352,822 | 6,717,676 | 6,418,351 | 6,356,777 | 5,678,612 | |||||||||||||||||||
| Total stockholders’ equity | 523,392 | 510,394 | 480,981 | 469,265 | 459,489 | |||||||||||||||||||
| Common shares outstanding | 60,738,610 | 60,642,777 | 60,542,092 | 60,090,349 | 59,874,084 | |||||||||||||||||||
| Cash dividends | 2,308,067 | 2,122,497 | 2,118,973 | 2,103,164 | 2,095,600 | |||||||||||||||||||
| Common stock cash dividends per share | 0.038 | 0.035 | 0.035 | 0.035 | 0.035 | |||||||||||||||||||
| Closing stock price | 16.99 | 18.95 | 17.40 | 19.90 | 18.32 | |||||||||||||||||||
| High stock price for the quarter | 19.33 | 19.15 | 20.00 | 20.08 | 19.25 | |||||||||||||||||||
| Low stock price for the quarter | 15.64 | 16.51 | 17.02 | 16.06 | 17.40 | |||||||||||||||||||
| Book value per share | 8.62 | 8.42 | 7.94 | 7.81 | 7.67 | |||||||||||||||||||
Bank Operations Business Segment
Condensed Statements of Operations (Unaudited)
Condensed Statements of Operations (Unaudited)
| For the Nine | ||||||||||||||||||||||||||||
| For the Three Months Ended | Months Ended | |||||||||||||||||||||||||||
| (In thousands) | 9/30/2005 | 6/30/2005 | 3/31/2005 | 12/31/2004 | 9/30/2004 | 9/30/2005 | 9/30/2004 | |||||||||||||||||||||
Net interest income | $ | 55,939 | 56,031 | 54,345 | 50,339 | 45,380 | 166,315 | 126,519 | ||||||||||||||||||||
Provision (recovery) for loan losses | (3,410 | ) | 820 | (3,916 | ) | (4,004 | ) | 1,717 | (6,506 | ) | (1,105 | ) | ||||||||||||||||
Net Interest income after provision for loan losses | 59,349 | 55,211 | 58,261 | 54,343 | 43,663 | 172,821 | 127,624 | |||||||||||||||||||||
Non-interest income | ||||||||||||||||||||||||||||
| Service charges on deposits | 16,415 | 14,744 | 12,989 | 13,637 | 13,493 | 44,148 | 37,798 | |||||||||||||||||||||
| Other service charges and fees | 5,824 | 5,849 | 5,238 | 6,733 | 5,819 | 16,911 | 16,887 | |||||||||||||||||||||
| Securities gains (losses) | 23 | 87 | 7 | 40 | — | 117 | (3 | ) | ||||||||||||||||||||
| Gain on sales of loans | 295 | 116 | 110 | 152 | 86 | 521 | 331 | |||||||||||||||||||||
| Income from real estate operations | 1,142 | 1,655 | 2,241 | 517 | 900 | 5,038 | 1,888 | |||||||||||||||||||||
| Other non-interest income | 2,019 | 2,514 | 2,956 | 1,924 | 2,034 | 7,489 | 5,820 | |||||||||||||||||||||
| Total non-interest income | 25,718 | 24,965 | 23,541 | 23,003 | 22,332 | 74,224 | 62,721 | |||||||||||||||||||||
Non-interest expense | ||||||||||||||||||||||||||||
| Employee compensation and benefits | 28,106 | 27,577 | 26,398 | 25,136 | 23,128 | 82,081 | 68,018 | |||||||||||||||||||||
| Occupancy and equipment | 10,826 | 10,165 | 9,117 | 9,658 | 8,100 | 30,108 | 23,055 | |||||||||||||||||||||
| Impairment of office properties and equipment | — | 3,706 | — | — | — | 3,706 | — | |||||||||||||||||||||
| Advertising | 5,518 | 5,965 | 5,168 | 5,087 | 3,301 | 16,651 | 10,925 | |||||||||||||||||||||
| Professional fees | 2,641 | 2,638 | 1,895 | 4,725 | 3,667 | 7,174 | 6,561 | |||||||||||||||||||||
| Cost associated with debt redemption | — | — | — | — | — | — | 11,741 | |||||||||||||||||||||
| Other | 9,631 | 8,265 | 7,686 | 7,058 | 7,334 | 25,582 | 21,658 | |||||||||||||||||||||
| Total non-interest expense | 56,722 | 58,316 | 50,264 | 51,664 | 45,530 | 165,302 | 141,958 | |||||||||||||||||||||
Income from bank operations business segment before income taxes | 28,345 | 21,860 | 31,538 | 25,682 | 20,465 | 81,743 | 48,387 | |||||||||||||||||||||
| Provision for income taxes | 9,054 | 7,089 | 10,677 | 8,870 | 6,866 | 26,820 | 16,659 | |||||||||||||||||||||
Net income from bank operations business segment | $ | 19,291 | 14,771 | 20,861 | 16,812 | 13,599 | 54,923 | 31,728 | ||||||||||||||||||||
Reconciliation of Operating and business segment net income | ||||||||||||||||||||||||||||
| Business segment income | $ | 19,291 | 14,771 | 20,861 | 16,812 | 13,599 | 54,923 | 31,728 | ||||||||||||||||||||
| Impairment of office properties and equipment | — | 2,409 | — | — | — | 2,409 | — | |||||||||||||||||||||
| Cost associated with debt redemption | — | — | — | — | — | — | 7,632 | |||||||||||||||||||||
Operating net income | $ | 19,291 | 17,180 | 20,861 | 16,812 | 13,599 | 57,332 | 39,360 | ||||||||||||||||||||
Bank Operations Business Segment
Condensed Statements of Condition and Statistics (Unaudited)
Condensed Statements of Condition and Statistics (Unaudited)
| For the Nine | ||||||||||||||||||||||||||||
| For the Three Months Ended | Months Ended | |||||||||||||||||||||||||||
| (in thousands except percentages | ||||||||||||||||||||||||||||
| and per share data) | 9/30/2005 | 6/30/2005 | 3/31/2005 | 12/31/2004 | 9/30/2004 | 9/30/2005 | 9/30/2004 | |||||||||||||||||||||
Statistics: | ||||||||||||||||||||||||||||
| Average earning assets | $ | 5,820,252 | 5,882,065 | 5,696,192 | 5,225,840 | 4,843,628 | 5,799,958 | 4,496,733 | ||||||||||||||||||||
| Average interest bearing liabilities | $ | 4,606,611 | 4,691,644 | 4,575,247 | 4,172,665 | 3,851,388 | 4,624,616 | 3,562,120 | ||||||||||||||||||||
| Average tangible assets | $ | 6,132,529 | 6,180,083 | 5,979,211 | 5,492,505 | 5,090,496 | 6,097,836 | 4,742,968 | ||||||||||||||||||||
| Average tangible equity | $ | 473,387 | 463,813 | 448,667 | 435,787 | 425,437 | 462,047 | 417,142 | ||||||||||||||||||||
| Borrowings to deposits and borrowings | % 31.64 | 36.18 | 33.79 | 36.53 | 32.75 | 31.64 | 32.75 | |||||||||||||||||||||
| Tax equivalent: | ||||||||||||||||||||||||||||
| Yield on earning assets | % 6.05 | 5.84 | 5.64 | 5.50 | 5.25 | 5.84 | 5.25 | |||||||||||||||||||||
| Cost of interest-bearing liabilities | % 2.64 | 2.43 | 2.19 | 1.99 | 1.85 | 2.42 | 1.89 | |||||||||||||||||||||
| Interest spread | % 3.41 | 3.41 | 3.45 | 3.51 | 3.40 | 3.42 | 3.36 | |||||||||||||||||||||
| Net interest margin | % 3.96 | 3.90 | 3.88 | 3.91 | 3.78 | 3.91 | 3.75 | |||||||||||||||||||||
| GAAP: | ||||||||||||||||||||||||||||
| Efficiency ratio | % 69.46 | 72.00 | 64.54 | 70.44 | 67.24 | 68.72 | 75.01 | |||||||||||||||||||||
| Return on average tangible assets | % 1.26 | 0.96 | 1.40 | 1.22 | 1.07 | 1.20 | 0.89 | |||||||||||||||||||||
| Return on average tangible equity | % 16.30 | 12.74 | 18.60 | 15.43 | 12.79 | 15.85 | 10.14 | |||||||||||||||||||||
| Operating (1): | ||||||||||||||||||||||||||||
| Efficiency ratio | % 69.46 | 67.42 | 64.54 | 70.44 | 67.24 | 67.18 | 68.81 | |||||||||||||||||||||
| Return on average tangible assets | % 1.26 | 1.11 | 1.40 | 1.22 | 1.07 | 1.25 | 1.11 | |||||||||||||||||||||
| Return on average tangible equity | % 16.30 | 14.82 | 18.60 | 15.43 | 12.79 | 16.54 | 12.58 | |||||||||||||||||||||
| Earning assets repricing (2): | ||||||||||||||||||||||||||||
| Percent of earning assets that have fixed rates | % 50 | |||||||||||||||||||||||||||
| Percent of earning assets that have variable rates | % 50 | |||||||||||||||||||||||||||
| One year Gap | % 4 | |||||||||||||||||||||||||||
| (1) | Ratios have been adjusted to exclude costs associated with debt redemptions and impairment on BankAtlantic’s former corporate headquarters. | |
| (2) | Percentages for periods prior to September 30, 2005 are not available. |
Condensed Statements of Financial Condition (Unaudited)
| As of | ||||||||||||||||||||
| (In thousands) | 9/30/2005 | 6/30/2005 | 3/31/2005 | 12/31/2004 | 9/30/2004 | |||||||||||||||
ASSETS | ||||||||||||||||||||
| Loans receivable | $ | 4,539,544 | 4,799,485 | 4,616,846 | 4,554,952 | 4,132,133 | ||||||||||||||
| Held to maturity securities | 439,015 | 483,992 | 376,298 | 378,912 | 215,420 | |||||||||||||||
| Available for sale securities | 608,375 | 658,532 | 695,154 | 700,642 | 648,043 | |||||||||||||||
| Goodwill | 70,489 | 70,489 | 70,489 | 70,489 | 70,489 | |||||||||||||||
| Core deposit intangible asset | 8,796 | 9,197 | 9,597 | 10,270 | 10,695 | |||||||||||||||
| Other assets | 369,994 | 374,207 | 335,215 | 329,723 | 308,894 | |||||||||||||||
| Total assets | $ | 6,036,213 | 6,395,902 | 6,103,599 | 6,044,988 | 5,385,674 | ||||||||||||||
LIABILITIES AND STOCKHOLDER’S EQUITY | ||||||||||||||||||||
| Deposits | ||||||||||||||||||||
| Demand | $ | 1,017,866 | 1,039,703 | 960,152 | 890,919 | 782,677 | ||||||||||||||
| NOW | 673,803 | 660,633 | 676,945 | 658,137 | 590,051 | |||||||||||||||
| Savings | 303,348 | 302,677 | 296,485 | 270,001 | 252,408 | |||||||||||||||
| Total low cost deposits | 1,995,017 | 2,003,013 | 1,933,582 | 1,819,057 | 1,625,136 | |||||||||||||||
| Money market | 921,585 | 899,364 | 913,434 | 875,422 | 893,315 | |||||||||||||||
| Certificate of deposits | 777,743 | 789,533 | 796,928 | 763,244 | 724,601 | |||||||||||||||
| Total deposits | 3,694,345 | 3,691,910 | 3,643,944 | 3,457,723 | 3,243,052 | |||||||||||||||
| Advances from Federal Home Loan Bank | 1,485,649 | 1,695,265 | 1,524,881 | 1,544,497 | 1,249,112 | |||||||||||||||
| Short term borrowings | 187,513 | 362,307 | 298,816 | 407,841 | 293,562 | |||||||||||||||
| Long term debt | 36,702 | 35,232 | 35,878 | 37,641 | 36,680 | |||||||||||||||
| Other liabilities | 79,228 | 69,235 | 73,191 | 80,410 | 52,749 | |||||||||||||||
| Total liabilities | 5,483,437 | 5,853,949 | 5,576,710 | 5,528,112 | 4,875,155 | |||||||||||||||
Stockholder’s equity | 552,776 | 541,953 | 526,889 | 516,876 | 510,519 | |||||||||||||||
Total liabilities and stockholder’s equity | $ | 6,036,213 | 6,395,902 | 6,103,599 | 6,044,988 | 5,385,674 | ||||||||||||||
Bank Operations Business Segment
Average Balance Sheet — Yield / Rate Analysis
Average Balance Sheet — Yield / Rate Analysis
| For the Three Months Ended | ||||||||||||||||||||||||
| September 30, 2005 | September 30, 2004 | |||||||||||||||||||||||
| ( in thousands) | Average | Revenue/ | Yield/ | Average | Revenue/ | Yield/ | ||||||||||||||||||
| Balance | Expense | Rate | Balance | Expense | Rate | |||||||||||||||||||
| Loans: | ||||||||||||||||||||||||
| Residential real estate | $ | 2,245,067 | 27,676 | 4.93 | % | $ | 1,583,353 | 18,636 | 4.71 | % | ||||||||||||||
| Commercial real estate | 1,639,530 | 30,839 | 7.52 | 1,662,978 | 23,737 | 5.71 | ||||||||||||||||||
| Consumer | 527,189 | 8,433 | 6.40 | 438,205 | 4,609 | 4.21 | ||||||||||||||||||
| Lease financing | 2,768 | 66 | 9.54 | 9,738 | 235 | 9.65 | ||||||||||||||||||
| Commercial business | 90,578 | 1,828 | 8.07 | 104,022 | 1,636 | 6.29 | ||||||||||||||||||
| Small business | 216,931 | 4,268 | 7.87 | 187,536 | 3,372 | 7.19 | ||||||||||||||||||
| Total loans | 4,722,063 | 73,110 | 6.19 | 3,985,832 | 52,225 | 5.24 | ||||||||||||||||||
| Investments — tax exempt | 386,097 | 5,617 | (1) | 5.82 | 144,126 | 1,948 | (1) | 5.41 | ||||||||||||||||
| Investments — taxable | 712,092 | 9,348 | 5.25 | 713,670 | 9,439 | 5.29 | ||||||||||||||||||
| Total interest earning assets | 5,820,252 | 88,075 | 6.05 | % | 4,843,628 | 63,612 | 5.25 | % | ||||||||||||||||
| Goodwill and core deposit intangibles | 79,494 | 81,406 | ||||||||||||||||||||||
| Other non-interest earning assets | 312,261 | 246,868 | ||||||||||||||||||||||
| Total Assets | $ | 6,212,007 | $ | 5,171,902 | ||||||||||||||||||||
| Deposits: | ||||||||||||||||||||||||
| Savings | $ | 303,268 | 229 | 0.30 | % | $ | 250,286 | 169 | 0.27 | % | ||||||||||||||
| NOW | 666,567 | 773 | 0.46 | 590,787 | 555 | 0.37 | ||||||||||||||||||
| Money market | 904,382 | 3,729 | 1.64 | 931,596 | 2,283 | 0.97 | ||||||||||||||||||
| Certificate of deposit | 781,044 | 5,788 | 2.94 | 718,826 | 4,053 | 2.24 | ||||||||||||||||||
| Total interest bearing deposits | 2,655,261 | 10,519 | 1.57 | 2,491,495 | 7,060 | 1.13 | ||||||||||||||||||
| Short-term borrowed funds | 256,492 | 2,151 | 3.33 | 287,011 | 966 | 1.34 | ||||||||||||||||||
| Advances from FHLB | 1,659,411 | 17,332 | 4.14 | 1,036,651 | 9,364 | 3.59 | ||||||||||||||||||
| Long-term debt | 35,447 | 645 | 7.22 | 36,231 | 515 | 5.65 | ||||||||||||||||||
| Total interest bearing liabilities | 4,606,611 | 30,647 | 2.64 | 3,851,388 | 17,905 | 1.85 | ||||||||||||||||||
| Demand deposits | 1,000,694 | 792,227 | ||||||||||||||||||||||
| Non-interest bearing other liabilities | 56,659 | 22,626 | ||||||||||||||||||||||
| Total Liabilities | 5,663,964 | 4,666,241 | ||||||||||||||||||||||
| Stockholder’s equity | 548,043 | 505,661 | ||||||||||||||||||||||
| Total liabilities and stockholder’s equity | $ | 6,212,007 | $ | 5,171,902 | ||||||||||||||||||||
| Net tax equivalent interest income/ net interest spread | $ | 57,428 | 3.41 | % | $ | 45,707 | 3.40 | % | ||||||||||||||||
| Tax equivalent adjustment | (1,966 | ) | (682 | ) | ||||||||||||||||||||
| Capitalized interest from real estate operations | 477 | 355 | ||||||||||||||||||||||
| Net interest income | 55,939 | 45,380 | ||||||||||||||||||||||
Margin | ||||||||||||||||||||||||
| Interest income/interest earning assets | 6.05 | % | 5.25 | % | ||||||||||||||||||||
| Interest expense/interest earning assets | 2.09 | 1.47 | ||||||||||||||||||||||
| Net interest margin (tax equivalent) | 3.96 | % | 3.78 | % | ||||||||||||||||||||
| (1) | The tax equivalent basis is computed using a 35% tax rate. |
Bank Operations
Average Balance Sheet — Yield / Rate Analysis
Average Balance Sheet — Yield / Rate Analysis
| For the Nine Months Ended | ||||||||||||||||||||||||
| September 30, 2005 | September 30, 2004 | |||||||||||||||||||||||
| ( in thousands) | Average | Revenue/ | Yield/ | Average | Revenue/ | Yield/ | ||||||||||||||||||
| Balance | Expense | Rate | Balance | Expense | Rate | |||||||||||||||||||
| Loans: | ||||||||||||||||||||||||
| Residential real estate | $ | 2,198,170 | 80,782 | 4.90 | % | $ | 1,432,518 | 50,358 | 4.69 | % | ||||||||||||||
| Commercial real estate | 1,708,272 | 89,460 | 6.98 | 1,664,786 | 70,101 | 5.61 | ||||||||||||||||||
| Consumer | 506,902 | 22,376 | 5.89 | 405,537 | 12,577 | 4.14 | ||||||||||||||||||
| Lease financing | 4,561 | 365 | 10.67 | 11,628 | 933 | 10.70 | ||||||||||||||||||
| Commercial business | 90,199 | 5,047 | 7.46 | 102,260 | 4,725 | 6.16 | ||||||||||||||||||
| Small business | 206,389 | 11,978 | 7.74 | 181,222 | 9,679 | 7.12 | ||||||||||||||||||
| Total loans | 4,714,493 | 210,008 | 5.94 | 3,797,951 | 148,373 | 5.21 | ||||||||||||||||||
| Investments — tax exempt | 362,988 | 15,775 | (1) | 5.79 | 73,646 | 2,937 | 5.32 | |||||||||||||||||
| Investments — taxable | 722,477 | 28,423 | 5.25 | 625,136 | 25,753 | 5.49 | ||||||||||||||||||
| Total interest earning assets | 5,799,958 | 254,206 | 5.84 | % | 4,496,733 | 177,063 | 5.25 | % | ||||||||||||||||
| Goodwill and core deposit intangibles | 79,923 | 81,838 | ||||||||||||||||||||||
| Other non-interest earning assets | 297,873 | 246,235 | ||||||||||||||||||||||
| Total Assets | $ | 6,177,754 | $ | 4,824,806 | ||||||||||||||||||||
| Deposits: | ||||||||||||||||||||||||
| Savings | $ | 295,450 | 628 | 0.28 | % | $ | 237,646 | 473 | 0.27 | % | ||||||||||||||
| NOW | 672,224 | 2,097 | 0.42 | 573,617 | 1,581 | 0.37 | ||||||||||||||||||
| Money market | 910,697 | 9,727 | 1.43 | 903,579 | 6,275 | 0.93 | ||||||||||||||||||
| Certificate of deposit | 780,258 | 15,896 | 2.72 | 732,715 | 12,492 | 2.28 | ||||||||||||||||||
| Total deposits | 2,658,629 | 28,348 | 1.43 | 2,447,557 | 20,821 | 1.14 | ||||||||||||||||||
| Short-term borrowed funds | 325,670 | 6,955 | 2.86 | 246,218 | 1,970 | 1.07 | ||||||||||||||||||
| Advances from FHLB | 1,604,169 | 46,610 | 3.88 | 832,177 | 26,231 | 4.21 | ||||||||||||||||||
| Long-term debt | 36,148 | 1,823 | 6.74 | 36,168 | 1,502 | 5.55 | ||||||||||||||||||
| Total interest bearing liabilities | 4,624,616 | 83,736 | 2.42 | 3,562,120 | 50,524 | 1.89 | ||||||||||||||||||
| Demand deposits | 965,900 | 737,738 | ||||||||||||||||||||||
| Non-interest bearing other liabilities | 49,823 | 27,063 | ||||||||||||||||||||||
| Total Liabilities | 5,640,339 | 4,326,921 | ||||||||||||||||||||||
| Stockholder’s equity | 537,415 | 497,885 | ||||||||||||||||||||||
| Total liabilities and stockholder’s equity | $ | 6,177,754 | $ | 4,824,806 | ||||||||||||||||||||
| Net interest income/net interest spread | $ | 170,470 | 3.42 | % | $ | 126,539 | 3.36 | % | ||||||||||||||||
| Tax equivalent adjustment | (5,521 | ) | (1,028 | ) | ||||||||||||||||||||
| Capitalized interest from real estate operations | 1,366 | 1,008 | ||||||||||||||||||||||
| Net interest income | 166,315 | 126,519 | ||||||||||||||||||||||
Margin | ||||||||||||||||||||||||
| Interest income/interest earning assets | 5.84 | % | 5.25 | % | ||||||||||||||||||||
| Interest expense/interest earning assets | 1.93 | 1.50 | ||||||||||||||||||||||
| Net interest margin | 3.91 | % | 3.75 | % | ||||||||||||||||||||
| (1) | The tax equivalent basis is computed using a 35% tax rate. |
Bank Operations Business Segment
Allowance for Loan Loss and Credit Quality
Allowance for Loan Loss and Credit Quality
| For the Nine | ||||||||||||||||||||||||||||
| (in thousands) | For the Three Months Ended | Months Ended | ||||||||||||||||||||||||||
| 9/30/2005 | 6/30/2005 | 3/31/2005 | 12/31/2004 | 9/30/2004 | 9/30/2005 | 9/30/2004 | ||||||||||||||||||||||
Allowance for Loan Losses | ||||||||||||||||||||||||||||
Beginning balance | $ | 43,650 | 43,042 | 46,010 | 48,778 | 46,737 | 46,010 | 45,595 | ||||||||||||||||||||
Charge-offs: | ||||||||||||||||||||||||||||
| Residential real estate | (191 | ) | (56 | ) | (198 | ) | (76 | ) | (151 | ) | (445 | ) | (506 | ) | ||||||||||||||
| Commercial real estate | — | — | — | (645 | ) | — | — | — | ||||||||||||||||||||
| Commercial business | (222 | ) | (511 | ) | (286 | ) | (762 | ) | (429 | ) | (1,019 | ) | (853 | ) | ||||||||||||||
| Consumer | (99 | ) | (43 | ) | (106 | ) | (71 | ) | (174 | ) | (248 | ) | (707 | ) | ||||||||||||||
| Small business | (68 | ) | (466 | ) | (128 | ) | (233 | ) | (144 | ) | (662 | ) | (223 | ) | ||||||||||||||
Total charge-offs | (580 | ) | (1,076 | ) | (718 | ) | (1,787 | ) | (898 | ) | (2,374 | ) | (2,289 | ) | ||||||||||||||
Recoveries: | ||||||||||||||||||||||||||||
| Residential real estate | 55 | — | 1 | 190 | 53 | 56 | 296 | |||||||||||||||||||||
| Commercial real estate | — | — | — | 2,000 | 1 | — | 2,052 | |||||||||||||||||||||
| Commercial business | 355 | 345 | 116 | 259 | 454 | 816 | 1,841 | |||||||||||||||||||||
| Consumer | 159 | 121 | 176 | 266 | 167 | 456 | 745 | |||||||||||||||||||||
| Small business | 289 | 220 | 185 | 231 | 378 | 694 | 1,199 | |||||||||||||||||||||
| Other | 177 | 178 | 1,188 | 77 | 169 | 1,543 | 444 | |||||||||||||||||||||
Total recoveries | 1,035 | 864 | 1,666 | 3,023 | 1,222 | 3,565 | 6,577 | |||||||||||||||||||||
Net (charge-offs) recoveries | 455 | (212 | ) | 948 | 1,236 | 324 | 1,191 | 4,288 | ||||||||||||||||||||
Provision (recovery) for loan losses | (3,410 | ) | 820 | (3,916 | ) | (4,004 | ) | 1,717 | (6,506 | ) | (1,105 | ) | ||||||||||||||||
Ending balance | $ | 40,695 | 43,650 | 43,042 | 46,010 | 48,778 | 40,695 | 48,778 | ||||||||||||||||||||
| Annualized net charge-offs (recoveries) to average loans | % | (0.04 | ) | 0.02 | (0.08 | ) | (0.11 | ) | (0.03 | ) | (0.03 | ) | (0.15 | ) | ||||||||||||||
| As of | ||||||||||||||||||||
| 9/30/2005 | 6/30/2005 | 3/31/2005 | 12/31/2004 | 9/30/2004 | ||||||||||||||||
Credit Quality | ||||||||||||||||||||
| Nonaccrual loans | $ | 6,883 | 5,785 | 6,504 | 7,903 | 11,352 | ||||||||||||||
| Nonaccrual tax certificates | 385 | 562 | 417 | 381 | 448 | |||||||||||||||
| Real estate owned | 912 | 1,178 | 1,438 | 692 | 1,059 | |||||||||||||||
| Other repossessed assets | 46 | 328 | — | — | — | |||||||||||||||
| Total nonperforming assets | $ | 8,226 | 7,853 | 8,359 | 8,976 | 12,859 | ||||||||||||||
| Nonperforming assets to total loans and other assets | % | 0.17 | 0.16 | 0.17 | 0.19 | 0.30 | ||||||||||||||
| Allowance for loan losses to total loans | % | 0.89 | 0.90 | 0.92 | 1.00 | 1.17 | ||||||||||||||
| Provision expense to average loans | % | (0.29 | ) | 0.07 | (0.34 | ) | (0.37 | ) | 0.17 | |||||||||||
| Allowance to nonperforming loans | % | 591.24 | 754.54 | 661.78 | 582.18 | 429.69 | ||||||||||||||
Ryan Beck & Co., Inc. Business Segment
Consolidated Statements of Operations and Statistics — Unaudited
Consolidated Statements of Operations and Statistics — Unaudited
| For the Nine | ||||||||||||||||||||||||||||
| For the Three Months Ended | Months Ended | |||||||||||||||||||||||||||
| (in thousands) | 9/30/2005 | 6/30/2005 | 3/31/2005 | 12/31/2004 | 9/30/2004 | 9/30/2005 | 9/30/2004 | |||||||||||||||||||||
Revenues | ||||||||||||||||||||||||||||
| Principal transactions | $ | 22,895 | 36,690 | 19,802 | 24,925 | 19,393 | 79,387 | 65,490 | ||||||||||||||||||||
| Investment banking | 3,741 | 25,394 | 11,882 | 3,753 | 13,835 | 41,017 | 44,492 | |||||||||||||||||||||
| Commissions | 21,390 | 19,478 | 20,315 | 23,109 | 18,564 | 61,183 | 66,180 | |||||||||||||||||||||
| Interest, dividends and other | 6,098 | 5,842 | 5,634 | 4,114 | 3,727 | 17,574 | 11,092 | |||||||||||||||||||||
| Total operating revenues | 54,124 | 87,404 | 57,633 | 55,901 | 55,519 | 199,161 | 187,254 | |||||||||||||||||||||
Operating expenses | ||||||||||||||||||||||||||||
| Compensation, benefits | 39,358 | 49,766 | 38,437 | 39,439 | 35,090 | 127,561 | 119,429 | |||||||||||||||||||||
| Professional fees | 1,411 | 1,591 | 1,417 | 2,044 | 1,063 | 4,419 | 3,438 | |||||||||||||||||||||
| Communications | 3,371 | 3,508 | 3,205 | 3,301 | 3,182 | 10,084 | 9,226 | |||||||||||||||||||||
| Occupancy and equipment | 4,025 | 3,786 | 4,118 | 5,095 | 3,680 | 11,929 | 10,334 | |||||||||||||||||||||
| Floor broker and clearing fees | 2,305 | 2,012 | 2,368 | 2,452 | 2,143 | 6,685 | 7,383 | |||||||||||||||||||||
| Interest and other | 3,495 | 4,733 | 3,522 | 2,318 | 3,177 | 11,750 | 9,523 | |||||||||||||||||||||
| Total operating expenses | 53,965 | 65,396 | 53,067 | 54,649 | 48,335 | 172,428 | 159,333 | |||||||||||||||||||||
| Income from Ryan Beck business segment - | ||||||||||||||||||||||||||||
| before income taxes | 159 | 22,008 | 4,566 | 1,252 | 7,184 | 26,733 | 27,921 | |||||||||||||||||||||
| Provision for income taxes | (264 | ) | 8,977 | 2,036 | 11 | 3,083 | 10,749 | 11,678 | ||||||||||||||||||||
Net income from Ryan Beck | ||||||||||||||||||||||||||||
business segment | $ | 423 | 13,031 | 2,530 | 1,241 | 4,101 | 15,984 | 16,243 | ||||||||||||||||||||
Statistics: | ||||||||||||||||||||||||||||
| Average tangible assets | $ | 208,883 | 184,601 | 171,833 | 178,967 | 182,226 | 189,423 | 168,689 | ||||||||||||||||||||
| Average tangible equity | 99,195 | 85,735 | 85,248 | 83,242 | 81,693 | 91,689 | 76,881 | |||||||||||||||||||||
| GAAP return on average tangible assets | %0.81 | 28.24 | 5.89 | 2.77 | 9.00 | 11.25 | 12.84 | |||||||||||||||||||||
| GAAP return on average tangible equity | 1.71 | 60.80 | 11.87 | 5.96 | 20.08 | 23.24 | 28.17 | |||||||||||||||||||||
| Compensation as a percent of revenues | 72.72 | 56.94 | 66.69 | 70.55 | 63.20 | 64.05 | 63.78 | |||||||||||||||||||||
| Commissions to total revenues | 39.52 | 22.29 | 35.25 | 41.34 | 33.44 | 30.72 | 35.34 | |||||||||||||||||||||
| Principal transactions to total revenues | 42.30 | 41.98 | 34.36 | 44.59 | 34.93 | 39.86 | 34.97 | |||||||||||||||||||||
| Investment banking revenue to total revenues | 6.91 | 29.05 | 20.62 | 6.71 | 24.92 | 20.59 | 23.76 | |||||||||||||||||||||
Condensed Statements of Financial Condition — Unaudited
| As of | ||||||||||||||||||||
| (in thousands) | 9/30/2005 | 6/30/2005 | 3/31/2005 | 12/31/2004 | 9/30/2004 | |||||||||||||||
ASSETS | ||||||||||||||||||||
| Cash and cash equivalents | $ | 5,388 | 4,103 | 6,312 | 3,674 | 4,225 | ||||||||||||||
| Securities | 120,298 | 109,095 | 142,294 | 125,443 | 111,944 | |||||||||||||||
| Notes receivable — GMS | 3,702 | 4,043 | 4,386 | 6,096 | 6,438 | |||||||||||||||
| Property and equipment, net | 7,503 | 6,795 | 7,020 | 7,472 | 7,748 | |||||||||||||||
| Goodwill | 6,184 | 6,184 | 6,184 | 6,184 | 6,184 | |||||||||||||||
| Due from clearing agent | 15,650 | 22,091 | 1,120 | 16,619 | 14,478 | |||||||||||||||
| Other assets | 37,332 | 51,338 | 29,426 | 28,129 | 24,441 | |||||||||||||||
Total assets | $ | 196,057 | 203,649 | 196,742 | 193,617 | 175,458 | ||||||||||||||
LIABILITIES AND STOCKHOLDER’S EQUITY | ||||||||||||||||||||
| Liabilities: | ||||||||||||||||||||
| Securities sold not yet purchased | $ | 20,688 | 28,184 | 60,276 | 39,462 | 31,760 | ||||||||||||||
| Other liabilities | 69,695 | 70,214 | 44,246 | 63,974 | 54,757 | |||||||||||||||
| Total liabilities | 90,383 | 98,398 | 104,522 | 103,436 | 86,517 | |||||||||||||||
Stockholder’s equity | 105,674 | 105,251 | 92,220 | 90,181 | 88,941 | |||||||||||||||
Total liabilities and stockholder’s equity | $ | 196,057 | 203,649 | 196,742 | 193,617 | 175,458 | ||||||||||||||
Parent Company Business Segment Activities
Condensed Statements of Operations — Unaudited
Condensed Statements of Operations — Unaudited
| For the Nine | ||||||||||||||||||||||||||||
| For the Three Months Ended | Months Ended | |||||||||||||||||||||||||||
| (in thousands) | 9/30/2005 | 6/30/2005 | 3/31/2005 | 12/31/2004 | 9/30/2004 | 9/30/2005 | 9/30/2004 | |||||||||||||||||||||
| Net interest (expense) | $ | (4,457 | ) | (4,157 | ) | (3,892 | ) | (3,593 | ) | (3,683 | ) | (12,506 | ) | (10,858 | ) | |||||||||||||
| Income from unconsolidated subsidiaries | 142 | 137 | 131 | 126 | 123 | 410 | 359 | |||||||||||||||||||||
| Gains on sales of securities | 158 | 3 | 95 | 3,613 | 2 | 256 | 80 | |||||||||||||||||||||
| Litigation settlement | — | — | — | — | — | — | 22,840 | |||||||||||||||||||||
| Employee compensation and benefits | (991 | ) | (1,048 | ) | (960 | ) | (778 | ) | (774 | ) | (2,999 | ) | (2,264 | ) | ||||||||||||||
| Other income (expense) | (208 | ) | (168 | ) | (779 | ) | (536 | ) | (160 | ) | (1,155 | ) | (1,552 | ) | ||||||||||||||
Income (loss) from parent company activities before income taxes | (5,356 | ) | (5,233 | ) | (5,405 | ) | (1,168 | ) | (4,492 | ) | (15,994 | ) | 8,605 | |||||||||||||||
| Provision (Benefit) for income taxes | (1,902 | ) | (1,968 | ) | (1,892 | ) | (409 | ) | (1,483 | ) | (5,762 | ) | 3,101 | |||||||||||||||
Net income (loss) from parent company business segment | $ | (3,454 | ) | (3,265 | ) | (3,513 | ) | (759 | ) | (3,009 | ) | (10,232 | ) | 5,504 | ||||||||||||||
Reconciliation of Operating and business segment income | ||||||||||||||||||||||||||||
| Business segment net income | $ | (3,454 | ) | (3,265 | ) | (3,513 | ) | (759 | ) | (3,009 | ) | (10,232 | ) | 5,504 | ||||||||||||||
| Litigation settlement | — | — | — | — | — | — | (14,785 | ) | ||||||||||||||||||||
Operating loss | $ | (3,454 | ) | (3,265 | ) | (3,513 | ) | (759 | ) | (3,009 | ) | (10,232 | ) | (9,281 | ) | |||||||||||||
Condensed Statements of Financial Condition — Unaudited
| As of | ||||||||||||||||||||
| (in thousands) | 9/30/2005 | 6/30/2005 | 3/31/2005 | 12/31/2004 | 9/30/2004 | |||||||||||||||
ASSETS | ||||||||||||||||||||
| Cash | $ | 12,783 | 11,218 | 8,032 | 9,131 | 10,643 | ||||||||||||||
| Securities | 103,755 | 100,592 | 85,711 | 64,656 | 62,324 | |||||||||||||||
| Notes receivable from related parties | — | — | 16,000 | 38,000 | 38,000 | |||||||||||||||
| Investment in subsidiaries | 658,454 | 647,207 | 619,111 | 607,061 | 599,462 | |||||||||||||||
| Investment in unconsolidated subsidiaries | 12,510 | 7,910 | 7,910 | 7,910 | 7,910 | |||||||||||||||
| Other assets | 7,075 | 13,905 | 15,452 | 8,918 | 7,939 | |||||||||||||||
Total assets | $ | 794,577 | 780,832 | 752,216 | 735,676 | 726,278 | ||||||||||||||
LIABILITIES AND STOCKHOLDERS’ EQUITY | ||||||||||||||||||||
| Subordinated debentures and notes payable | $ | 263,266 | 263,266 | 263,266 | 263,366 | 263,366 | ||||||||||||||
| Other liabilities | 7,919 | 7,172 | 7,969 | 3,045 | 3,423 | |||||||||||||||
| Total liabilities | 271,185 | 270,438 | 271,235 | 266,411 | 266,789 | |||||||||||||||
Stockholders’ equity | 523,392 | 510,394 | 480,981 | 469,265 | 459,489 | |||||||||||||||
Total liabilities and stockholders’ equity | $ | 794,577 | 780,832 | 752,216 | 735,676 | 726,278 | ||||||||||||||