
| November 2008 Prepared: November 3, 2008 NYSE BBX |
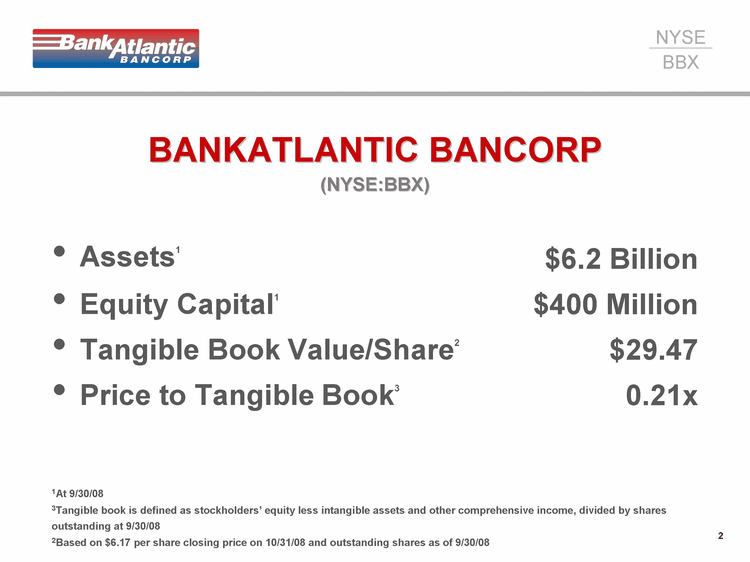
| 2 BANKATLANTIC BANCORP (NYSE:BBX) Assets1 Equity Capital1 Tangible Book Value/Share2 Price to Tangible Book3 $6.2 Billion $400 Million $29.47 0.21x 1At 9/30/08 3Tangible book is defined as stockholders' equity less intangible assets and other comprehensive income, divided by shares outstanding at 9/30/08 2Based on $6.17 per share closing price on 10/31/08 and outstanding shares as of 9/30/08 |
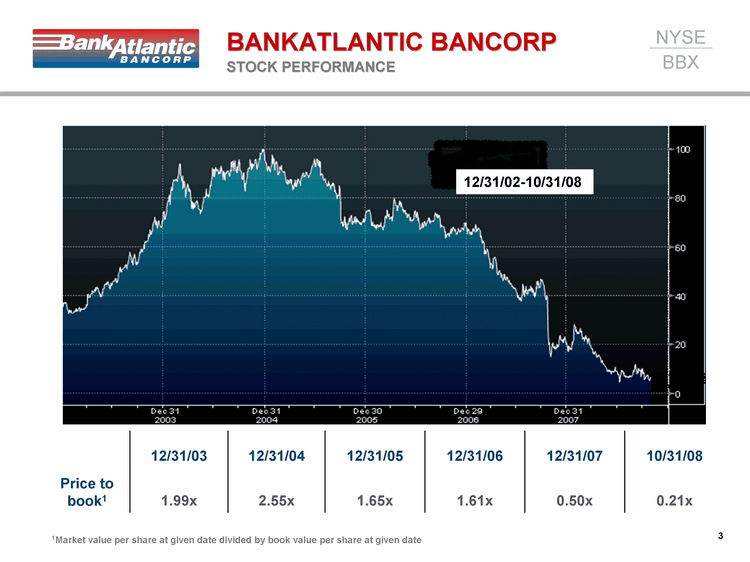
| 3 BANKATLANTIC BANCORP STOCK PERFORMANCE 1Market value per share at given date divided by book value per share at given date 12/31/03 12/31/04 12/31/05 12/31/06 12/31/07 10/31/08 Price to book1 1.99x 2.55x 1.65x 1.61x 0.50x 0.21x 12/31/02-10/31/08 |
| 4 Founded in 1952 "Florida's Most Convenient Bank" Second largest bank headquartered in Florida Over 100 stores Operates in top 6 counties in Florida BANKATLANTIC OVERVIEW |
| 5 Increase Core Deposits by: Florida's Most Convenient Bank initiative Strong service, sales and marketing culture "WOW!" Customer Experience Managed loan growth in Small Business, Corporate, Consumer and Commercial Real Estate sectors Maintain capital strength Improve operational efficiency Improve operating earnings BANKATLANTIC STRATEGY |
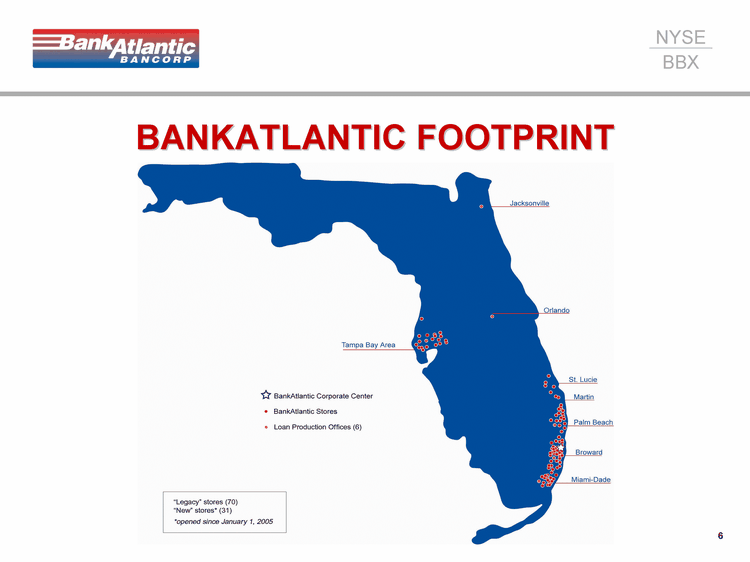
| 6 BANKATLANTIC FOOTPRINT |
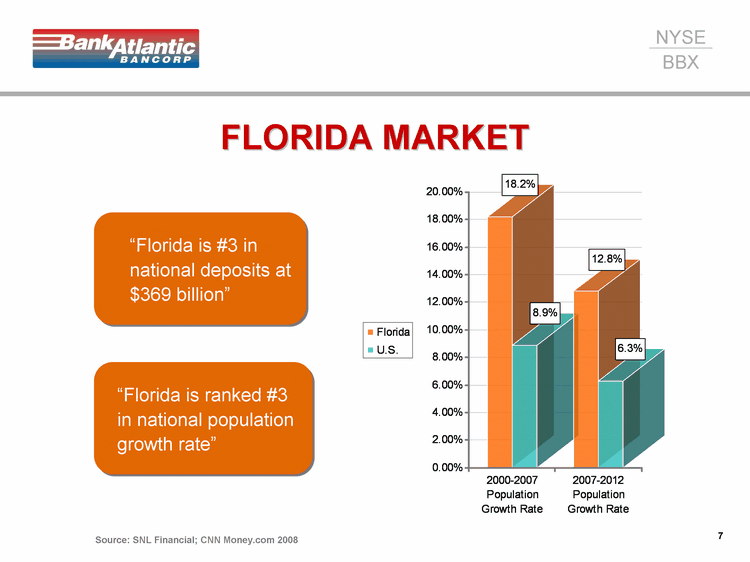
| 7 2000-2007 Population Growth Rate 2007-2012 Population Growth Rate Florida 0.182 0.128 U.S. 0.089 0.063 FLORIDA MARKET "Florida is #3 in national deposits at $369 billion" "Florida is ranked #3 in national population growth rate" Source: SNL Financial; CNN Money.com 2008 |
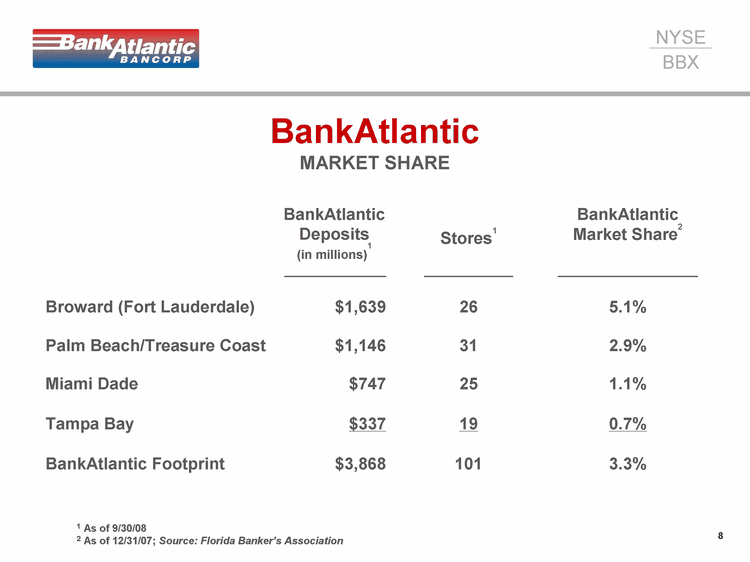
| 8 BankAtlantic MARKET SHARE BankAtlantic Deposits (in millions)1 Stores1 BankAtlantic Market Share2 ________________ ______________ ______________________ Broward (Fort Lauderdale) $1,639 26 5.1% Palm Beach/Treasure Coast $1,146 31 2.9% Miami Dade $747 25 1.1% Tampa Bay $337 19 0.7% BankAtlantic Footprint $3,868 101 3.3% 1 As of 9/30/08 2 As of 12/31/07; Source: Florida Banker's Association |
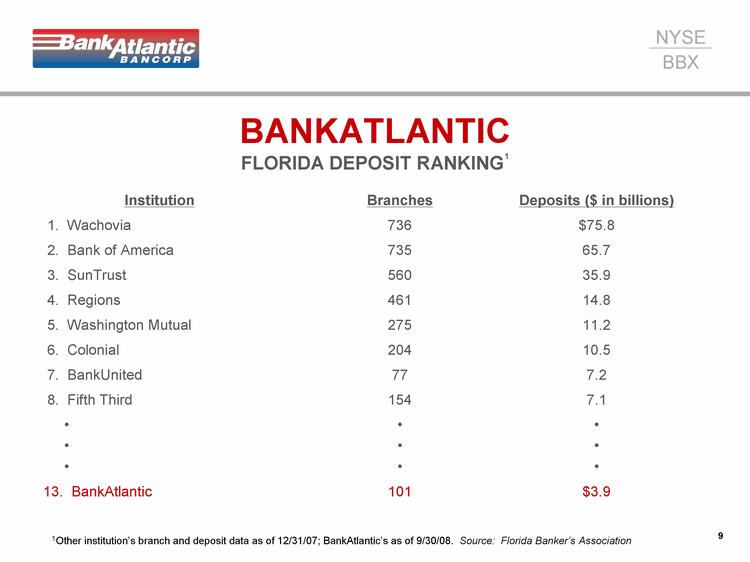
| 9 BANKATLANTIC FLORIDA DEPOSIT RANKING1 Institution Branches Deposits ($ in billions) 1. Wachovia 736 $75.8 2. Bank of America 735 65.7 3. SunTrust 560 35.9 4. Regions 461 14.8 5. Washington Mutual 275 11.2 6. Colonial 204 10.5 7. BankUnited 77 7.2 8. Fifth Third 154 7.1 13. BankAtlantic 101 $3.9 1Other institution's branch and deposit data as of 12/31/07; BankAtlantic's as of 9/30/08. Source: Florida Banker's Association |
| 10 IMPROVE CORE OPERATING PERFORMANCE MANAGE CREDIT QUALITY 3. MAINTAIN CAPITAL STRENGTH BANKATLANTIC 2008 Strategic Initiatives |
| 11 BANKATLANTIC 2008 Strategic Initiatives IMPROVE CORE OPERATING PERFORMANCE MANAGE CREDIT QUALITY 3. MAINTAIN CAPITAL STRENGTH |
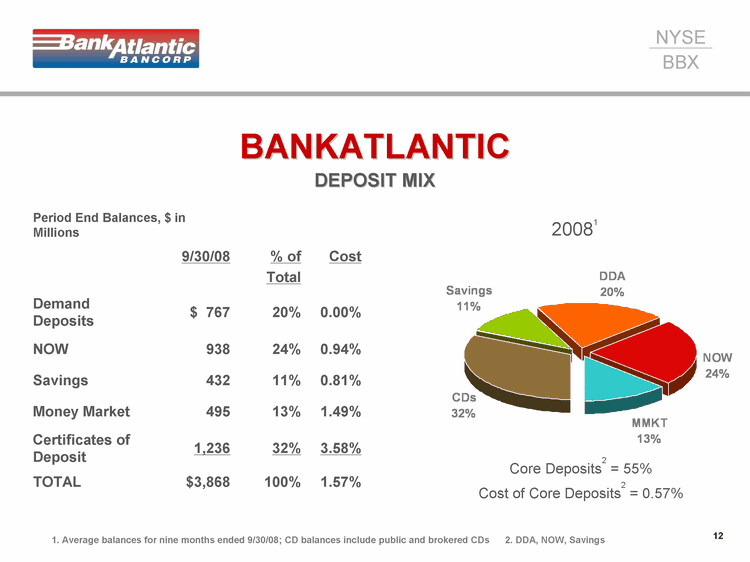
| 12 BANKATLANTIC DEPOSIT MIX CDs Savings DDA NOW MMKT 0.32 0.11 0.2 0.24 0.13 20081 Core Deposits2 = 55% Cost of Core Deposits2 = 0.57% 1. Average balances for nine months ended 9/30/08; CD balances include public and brokered CDs 2. DDA, NOW, Savings Period End Balances, $ in Millions Period End Balances, $ in Millions 9/30/08 % of Total Cost Demand Deposits $ 767 20% 0.00% NOW 938 24% 0.94% Savings 432 11% 0.81% Money Market 495 13% 1.49% Certificates of Deposit 1,236 32% 3.58% TOTAL $3,868 100% 1.57% |
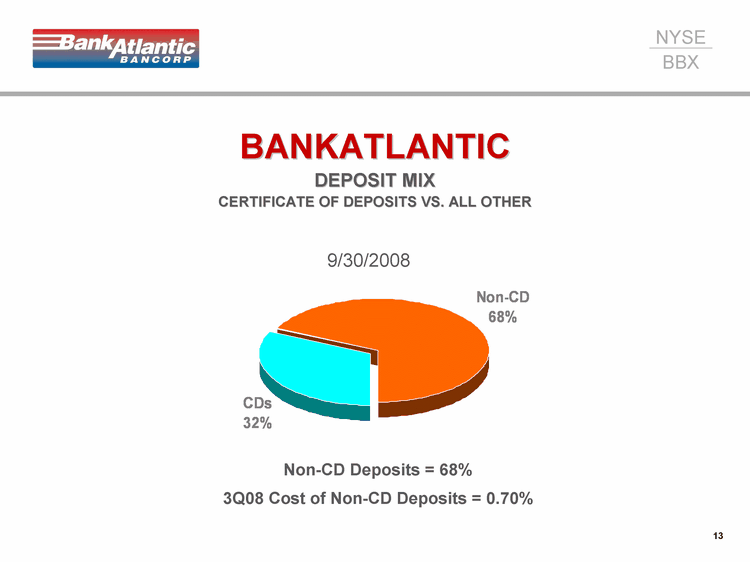
| 13 BANKATLANTIC DEPOSIT MIX CERTIFICATE OF DEPOSITS VS. ALL OTHER CDs Non-CD 1236 2632 9/30/2008 Non-CD Deposits = 68% 3Q08 Cost of Non-CD Deposits = 0.70% |
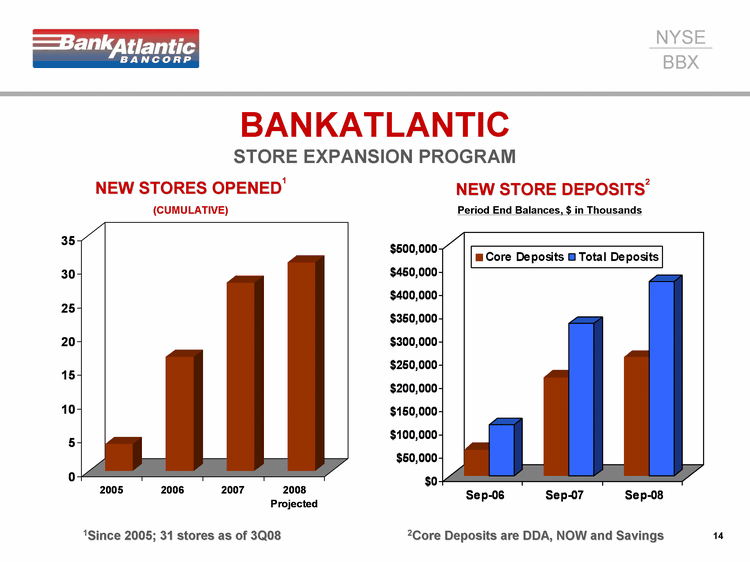
| 14 BANKATLANTIC STORE EXPANSION PROGRAM 2005 2006 2007 2008 Projected Core Deposits 4 17 28 31 Sep-06 Sep-07 Sep-08 Core Deposits 57519 214116 257340 Total Deposits 110338 328495 419210 NEW STORES OPENED1 (CUMULATIVE) 1Since 2005; 31 stores as of 3Q08 NEW STORE DEPOSITS2 Period End Balances, $ in Thousands 2Core Deposits are DDA, NOW and Savings |
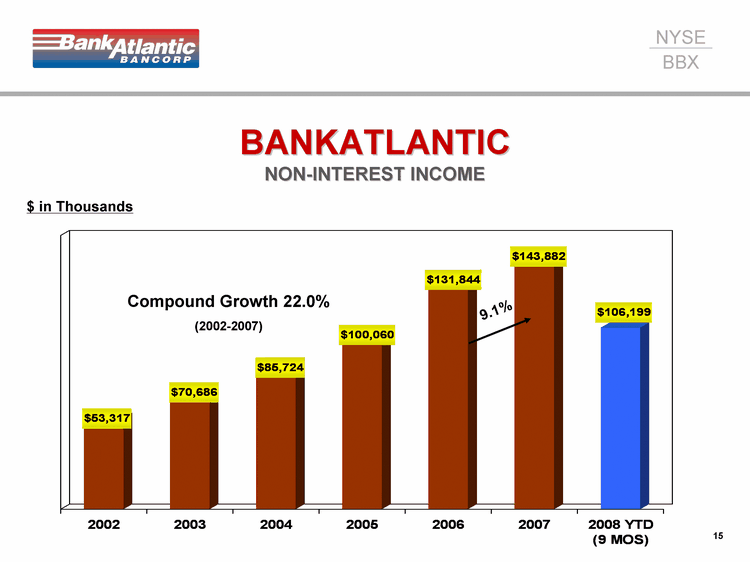
| 15 15 2002 2003 2004 2005 2006 2007 2008 YTD (9 MOS) Fee Income 53317 70686 85724 100060 131844 143882 106199 $ in Thousands 9.1% Compound Growth 22.0% (2002-2007) BANKATLANTIC NON-INTEREST INCOME |
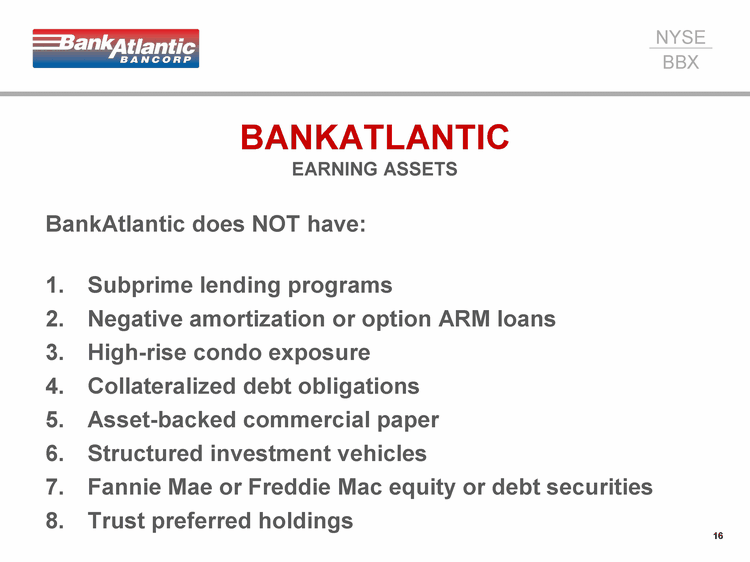
| 16 BANKATLANTIC EARNING ASSETS BankAtlantic does NOT have: Subprime lending programs Negative amortization or option ARM loans High-rise condo exposure Collateralized debt obligations Asset-backed commercial paper Structured investment vehicles Fannie Mae or Freddie Mac equity or debt securities Trust preferred holdings |
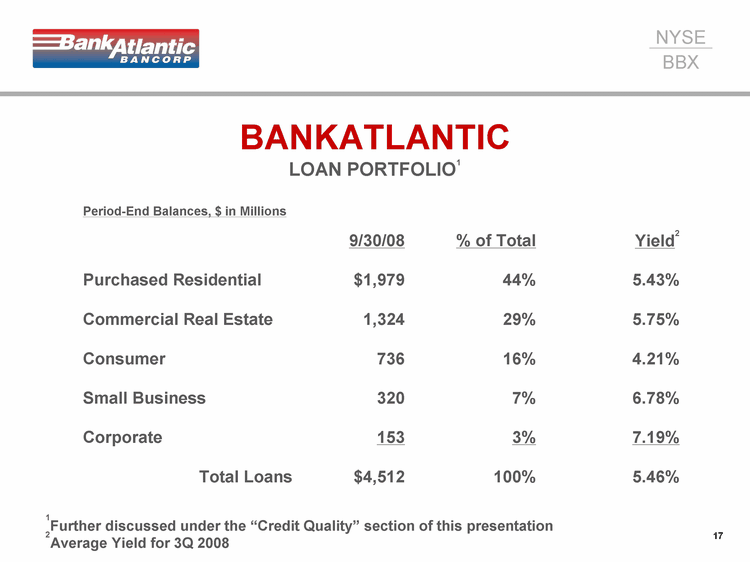
| 17 BANKATLANTIC LOAN PORTFOLIO1 Period-End Balances, $ in Millions 9/30/08 % of Total Yield2 Purchased Residential $1,979 44% 5.43% Commercial Real Estate 1,324 29% 5.75% Consumer 736 16% 4.21% Small Business 320 7% 6.78% Corporate 153 3% 7.19% Total Loans $4,512 100% 5.46% 1Further discussed under the "Credit Quality" section of this presentation 2Average Yield for 3Q 2008 |
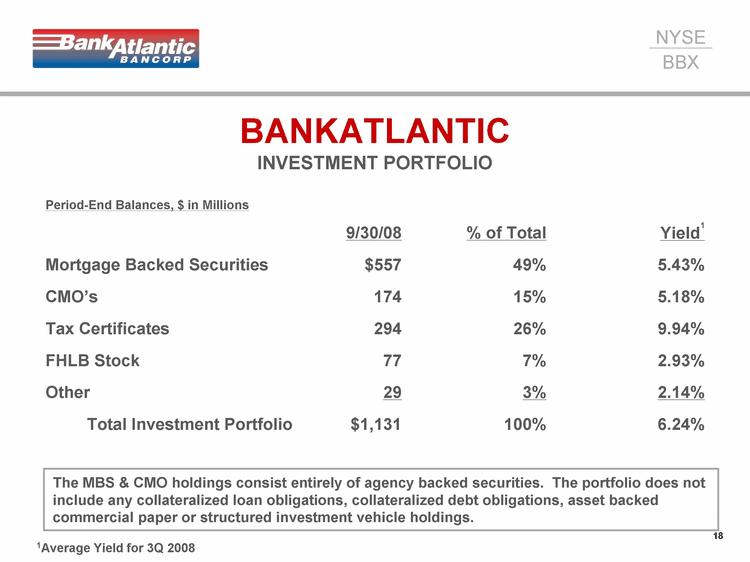
| 18 Period-End Balances, $ in Millions 9/30/08 % of Total Yield1 Mortgage Backed Securities $557 49% 5.43% CMO's 174 15% 5.18% Tax Certificates 294 26% 9.94% FHLB Stock 77 7% 2.93% Other 29 3% 2.14% Total Investment Portfolio $1,131 100% 6.24% BANKATLANTIC INVESTMENT PORTFOLIO The MBS & CMO holdings consist entirely of agency backed securities. The portfolio does not include any collateralized loan obligations, collateralized debt obligations, asset backed commercial paper or structured investment vehicle holdings. 1Average Yield for 3Q 2008 |
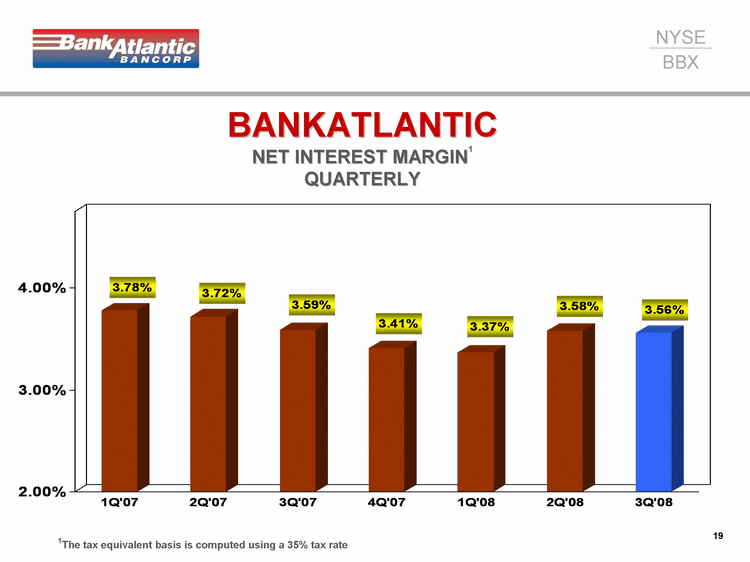
| 19 19 1Q'07 2Q'07 3Q'07 4Q'07 1Q'08 2Q'08 3Q'08 NIM 0.0378 0.0372 0.0359 0.0341 0.0337 0.0358 0.0356 1The tax equivalent basis is computed using a 35% tax rate BANKATLANTIC NET INTEREST MARGIN1 QUARTERLY |
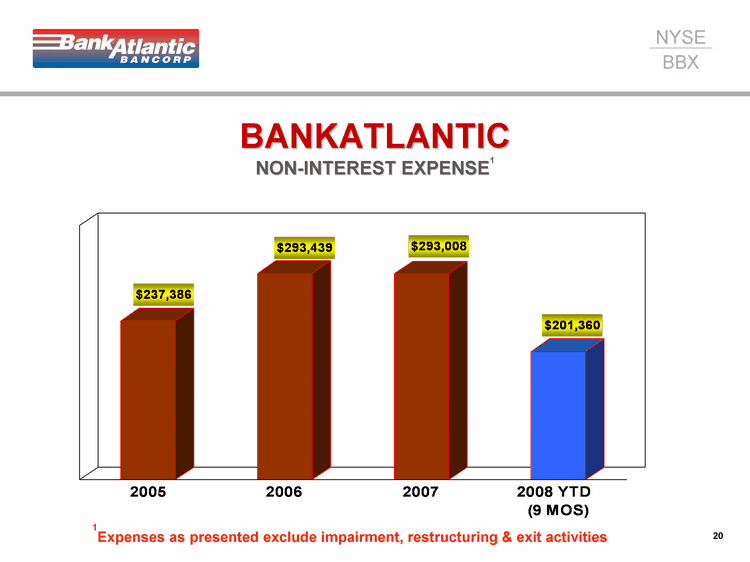
| 20 20 2005 2006 2007 2008 YTD (9 MOS) Excl. Impairment, Restructuring & Exit Activities 237386 293439 293008 201360 BANKATLANTIC NON-INTEREST EXPENSE1 1Expenses as presented exclude impairment, restructuring & exit activities |
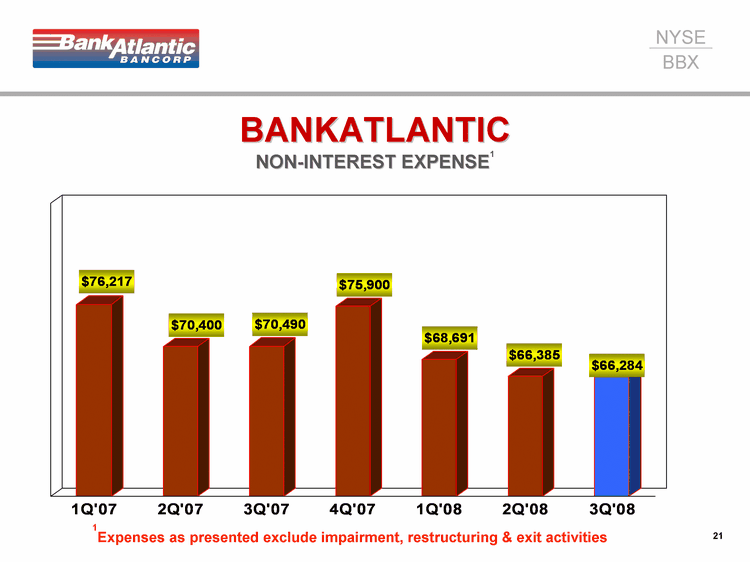
| 21 21 1Q'07 2Q'07 3Q'07 4Q'07 1Q'08 2Q'08 3Q'08 Excl. Impairment, Restructuring & Exit Activities 76217 70400 70490 75900 68691 66385 66284 BANKATLANTIC NON-INTEREST EXPENSE1 1Expenses as presented exclude impairment, restructuring & exit activities |
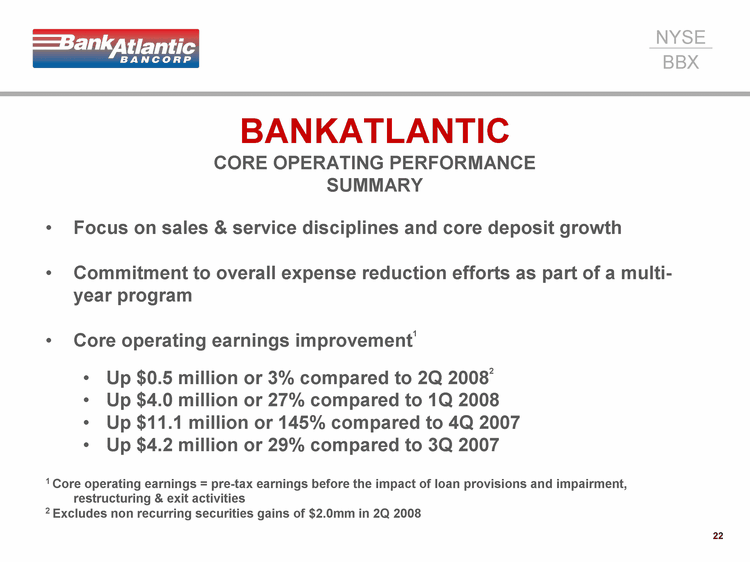
| 22 BANKATLANTIC CORE OPERATING PERFORMANCE SUMMARY Focus on sales & service disciplines and core deposit growth Commitment to overall expense reduction efforts as part of a multi- year program Core operating earnings improvement1 Up $0.5 million or 3% compared to 2Q 20082 Up $4.0 million or 27% compared to 1Q 2008 Up $11.1 million or 145% compared to 4Q 2007 Up $4.2 million or 29% compared to 3Q 2007 1 Core operating earnings = pre-tax earnings before the impact of loan provisions and impairment, restructuring & exit activities 2 Excludes non recurring securities gains of $2.0mm in 2Q 2008 |
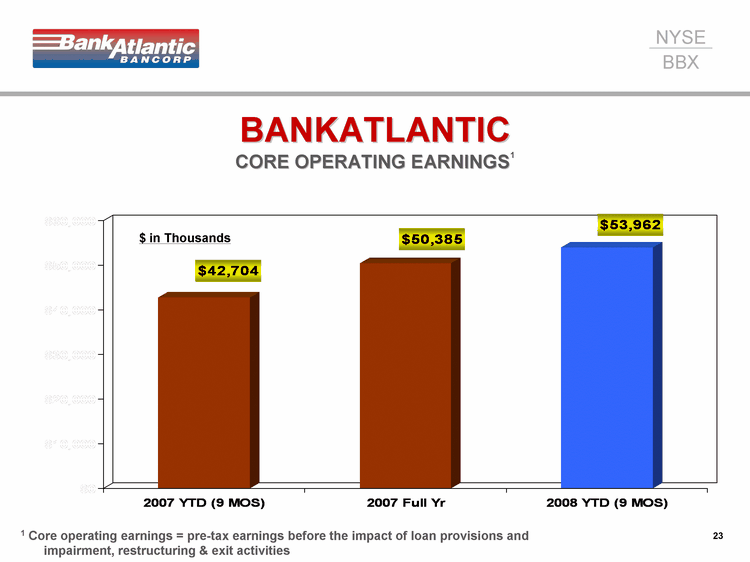
| 23 23 2007 YTD (9 MOS) 2007 Full Yr 2008 YTD (9 MOS) Core Oper Earnings 42704 50385 53962 $ in Thousands BANKATLANTIC CORE OPERATING EARNINGS1 1 Core operating earnings = pre-tax earnings before the impact of loan provisions and impairment, restructuring & exit activities |
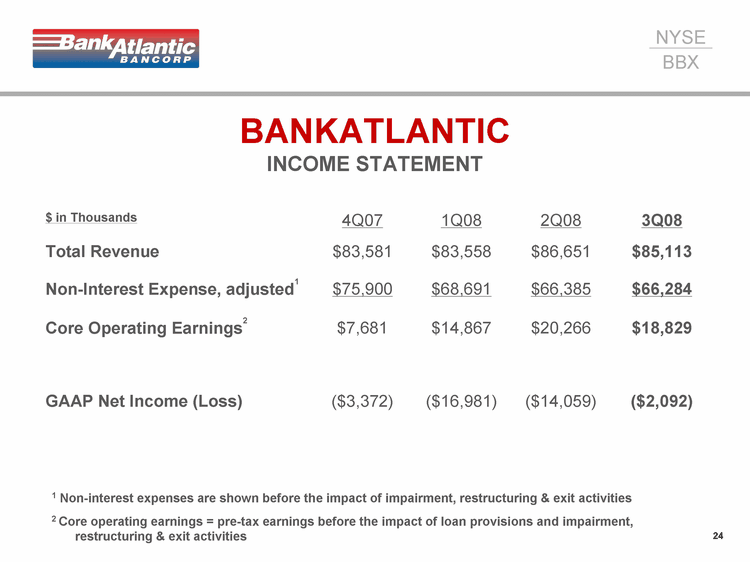
| 24 BANKATLANTIC INCOME STATEMENT $ in Thousands 4Q07 1Q08 2Q08 3Q08 Total Revenue $83,581 $83,558 $86,651 $85,113 Non-Interest Expense, adjusted1 $75,900 $68,691 $66,385 $66,284 Core Operating Earnings2 $7,681 $14,867 $20,266 $18,829 GAAP Net Income (Loss) ($3,372) ($16,981) ($14,059) ($2,092) 1 Non-interest expenses are shown before the impact of impairment, restructuring & exit activities 2 Core operating earnings = pre-tax earnings before the impact of loan provisions and impairment, restructuring & exit activities |
| 25 BANKATLANTIC 2008 STRATEGIC INITIATIVES IMPROVE CORE OPERATING PERFORMANCE MANAGE CREDIT QUALITY 3. MAINTAIN CAPITAL STRENGTH |
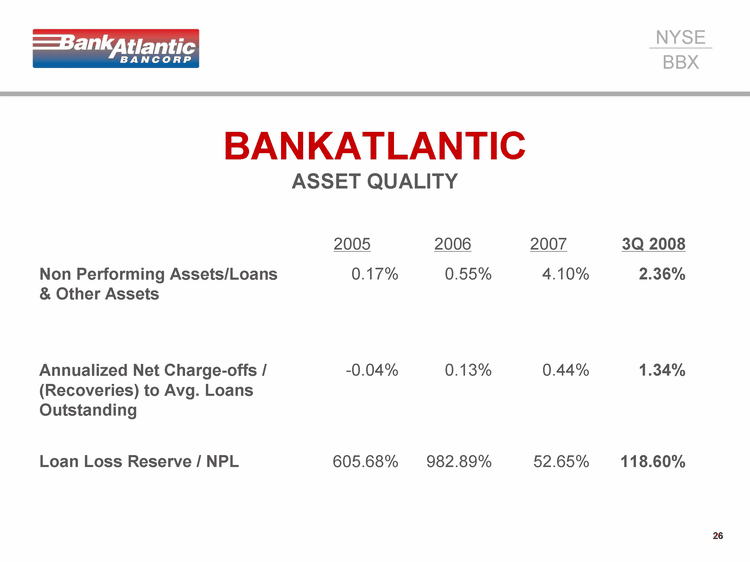
| 26 2005 2005 2006 2007 3Q 2008 3Q 2008 Non Performing Assets/Loans & Other Assets 0.17% 0.17% 0.55% 4.10% 2.36% 2.36% Annualized Net Charge-offs / (Recoveries) to Avg. Loans Outstanding -0.04% -0.04% 0.13% 0.44% 1.34% 1.34% Loan Loss Reserve / NPL 605.68% 605.68% 982.89% 52.65% 118.60% 118.60% BANKATLANTIC ASSET QUALITY |
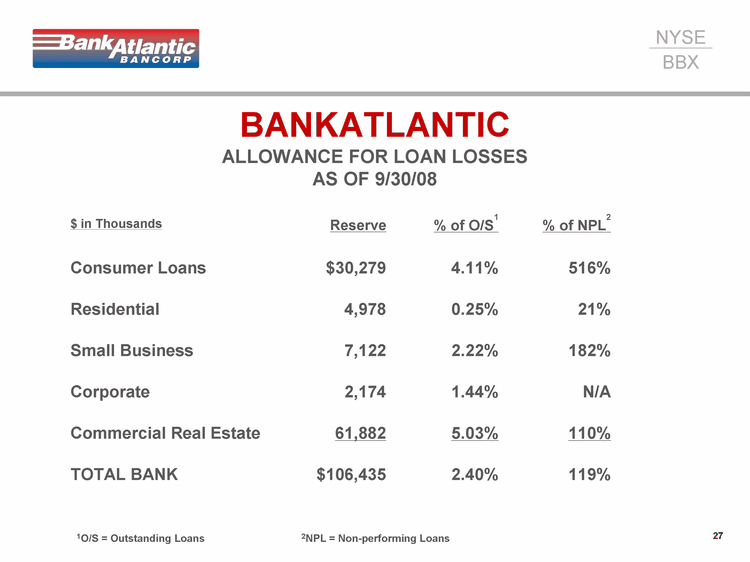
| 27 BANKATLANTIC ALLOWANCE FOR LOAN LOSSES AS OF 9/30/08 $ in Thousands Reserve % of O/S1 % of NPL2 Consumer Loans $30,279 4.11% 516% Residential 4,978 0.25% 21% Small Business 7,122 2.22% 182% Corporate 2,174 1.44% N/A Commercial Real Estate 61,882 5.03% 110% TOTAL BANK $106,435 2.40% 119% 1O/S = Outstanding Loans 2NPL = Non-performing Loans |
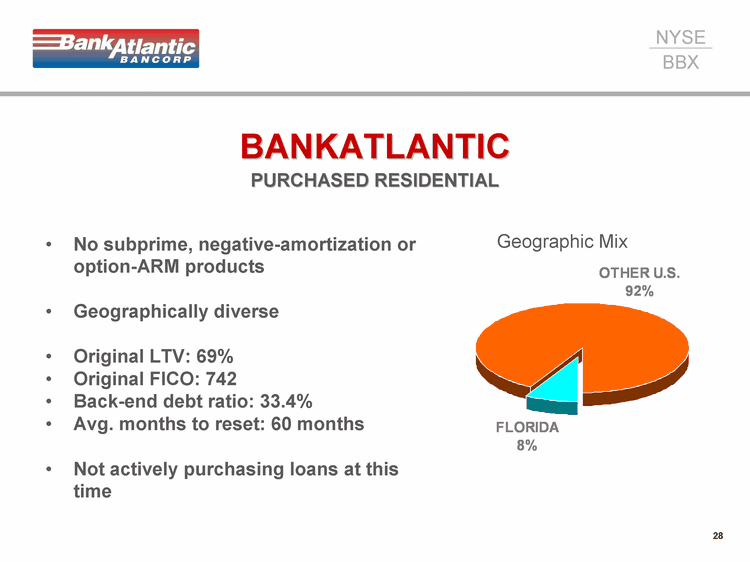
| 28 BANKATLANTIC PURCHASED RESIDENTIAL FLORIDA OTHER U.S. 0.08 0.92 Geographic Mix No subprime, negative-amortization or option-ARM products Geographically diverse Original LTV: 69% Original FICO: 742 Back-end debt ratio: 33.4% Avg. months to reset: 60 months Not actively purchasing loans at this time |
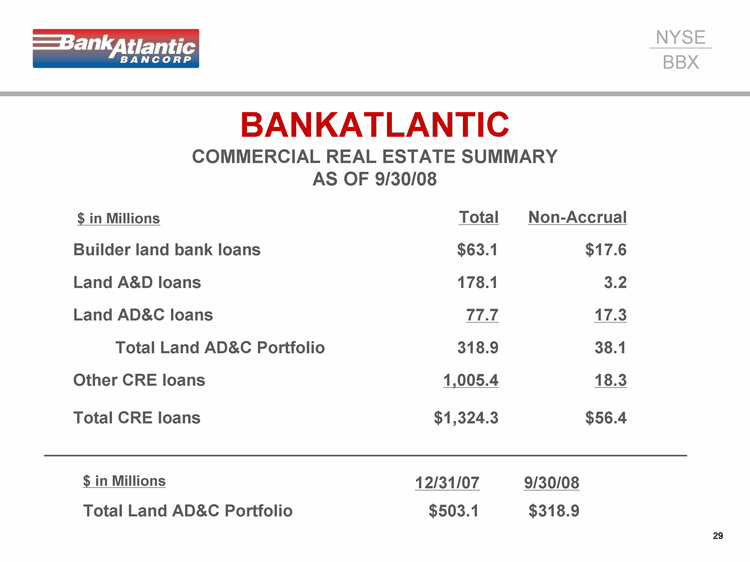
| 29 BANKATLANTIC COMMERCIAL REAL ESTATE SUMMARY AS OF 9/30/08 $ in Millions Total Non-Accrual Builder land bank loans $63.1 $17.6 Land A&D loans 178.1 3.2 Land AD&C loans 77.7 17.3 Total Land AD&C Portfolio 318.9 38.1 Other CRE loans 1,005.4 18.3 Total CRE loans $1,324.3 $56.4 $ in Millions 12/31/07 9/30/08 Total Land AD&C Portfolio $503.1 $318.9 |
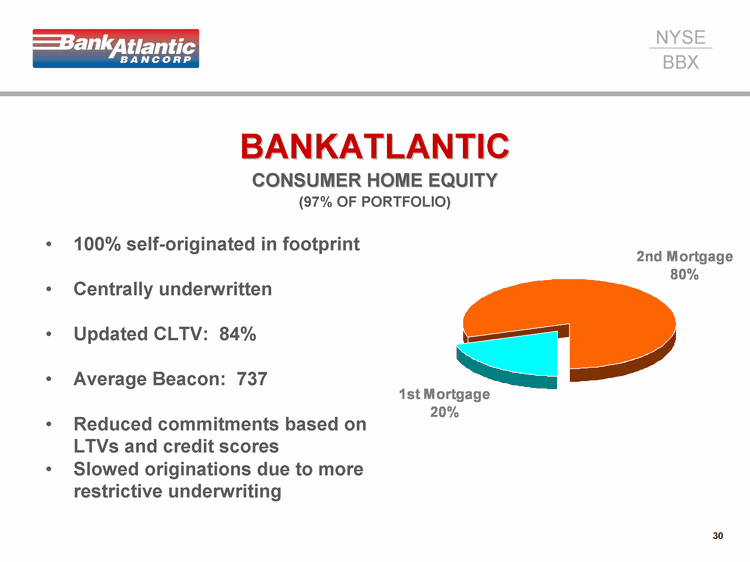
| 30 BANKATLANTIC CONSUMER HOME EQUITY (97% OF PORTFOLIO) 1st Mortgage 2nd Mortgage 0.2 0.8 100% self-originated in footprint Centrally underwritten Updated CLTV: 84% Average Beacon: 737 Reduced commitments based on LTVs and credit scores Slowed originations due to more restrictive underwriting |
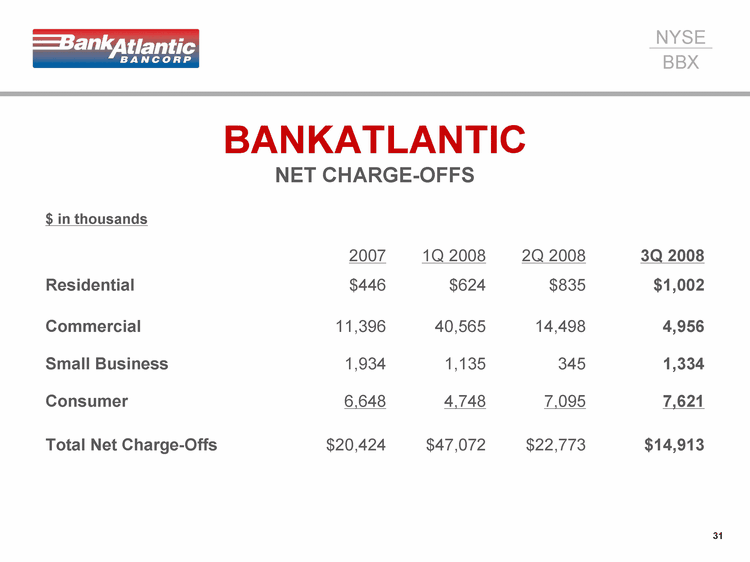
| 31 BANKATLANTIC NET CHARGE-OFFS $ in thousands 2007 1Q 2008 2Q 2008 3Q 2008 Residential $446 $624 $835 $1,002 Commercial 11,396 40,565 14,498 4,956 Small Business 1,934 1,135 345 1,334 Consumer 6,648 4,748 7,095 7,621 Total Net Charge-Offs $20,424 $47,072 $22,773 $14,913 |
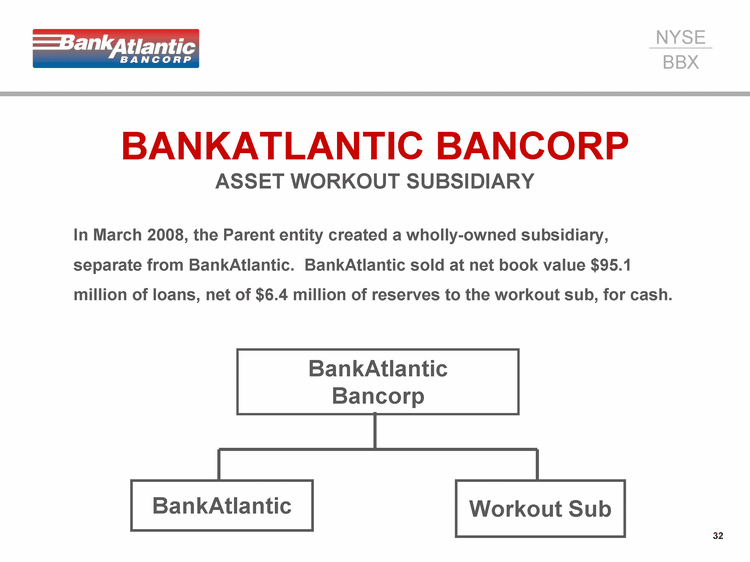
| 32 BANKATLANTIC BANCORP ASSET WORKOUT SUBSIDIARY In March 2008, the Parent entity created a wholly-owned subsidiary, separate from BankAtlantic. BankAtlantic sold at net book value $95.1 million of loans, net of $6.4 million of reserves to the workout sub, for cash. BankAtlantic Bancorp BankAtlantic Workout Sub |
| 33 BANKATLANTIC BANCORP TRANSFER OF NPAs TO WORKOUT SUBSIDIARY Results of new sub/transfer of loans: Reduces BankAtlantic's non-performing loans Strengthens BankAtlantic's loan reserve coverage Strengthens BankAtlantic's capital ratios Allows cash to be used by the Bank Allows isolation of the assets into the workout subsidiary for consideration of other alternatives in the future No impact to consolidated financials |
| 34 BANKATLANTIC 2008 STRATEGIC INITIATIVES IMPROVE CORE OPERATING PERFORMANCE MANAGE CREDIT QUALITY 3. MAINTAIN CAPITAL STRENGTH |
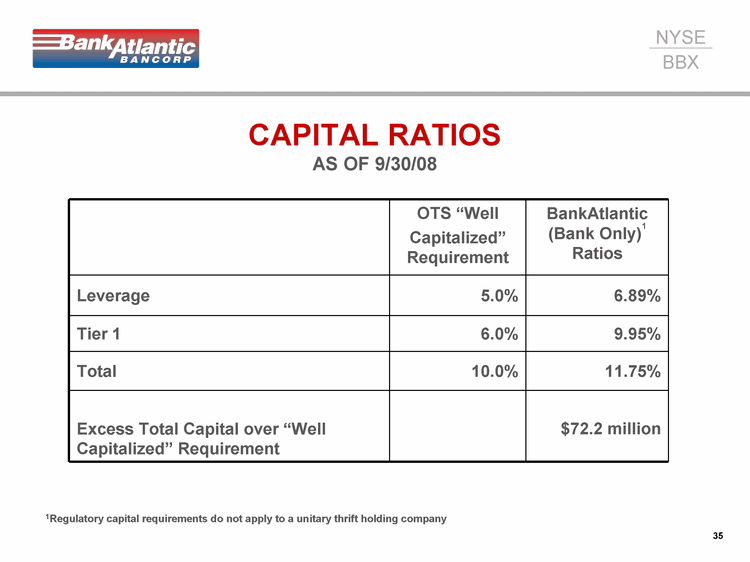
| 35 CAPITAL RATIOS AS OF 9/30/08 OTS "Well Capitalized" Requirement BankAtlantic (Bank Only)1 Ratios Leverage 5.0% 6.89% Tier 1 6.0% 9.95% Total 10.0% 11.75% Excess Total Capital over "Well Capitalized" Requirement $72.2 million 1Regulatory capital requirements do not apply to a unitary thrift holding company |
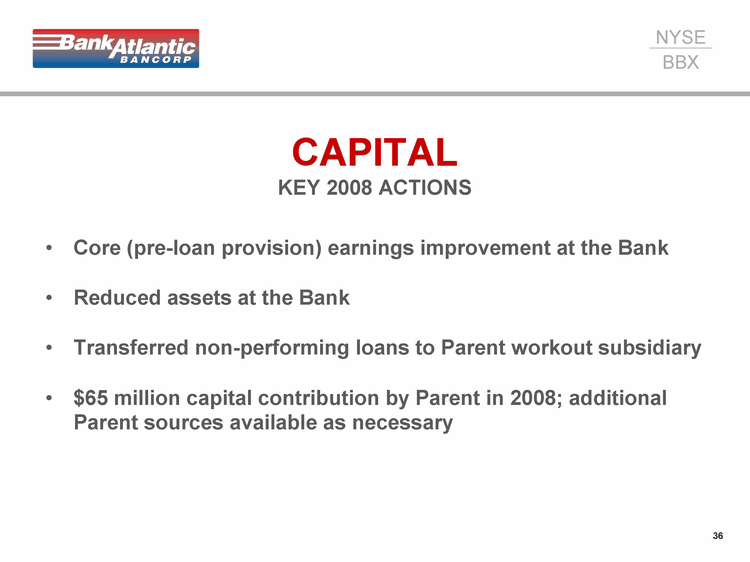
| 36 CAPITAL KEY 2008 ACTIONS Core (pre-loan provision) earnings improvement at the Bank Reduced assets at the Bank Transferred non-performing loans to Parent workout subsidiary $65 million capital contribution by Parent in 2008; additional Parent sources available as necessary |
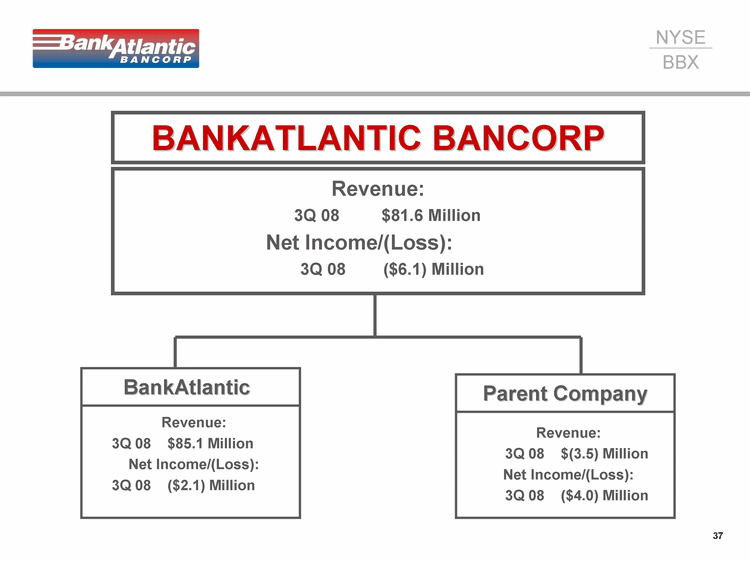
| 37 BANKATLANTIC BANCORP Revenue: 3Q 08 $81.6 Million Net Income/(Loss): 3Q 08 ($6.1) Million BankAtlantic Revenue: 3Q 08 $85.1 Million Net Income/(Loss): 3Q 08 ($2.1) Million Parent Company Revenue: 3Q 08 $(3.5) Million Net Income/(Loss): 3Q 08 ($4.0) Million |
| 38 BANKATLANTIC BANCORP KEY 2008 EVENTS Sale of Stifel common stock & warrants; liquidation of certain other Parent Company investments Creation of loan workout subsidiary; transfer of approx. $95 million in cash to BankAtlantic in exchange for nonperforming loans, at net book value Capital contributions from Bancorp to BankAtlantic of $65 million In August 2008, received $9.6 million prepayment of Stifel Financial contingent payment associated with the 2007 sale of Ryan Beck Reverse stock split complete in September 2008 |
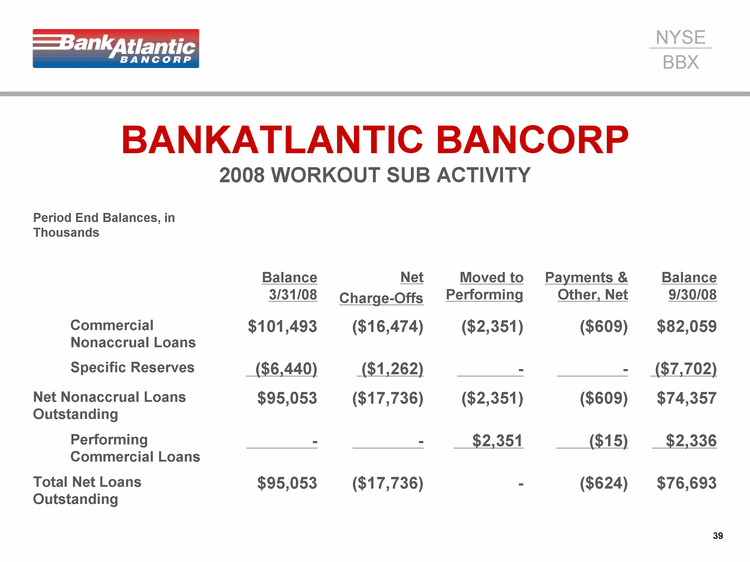
| 39 BANKATLANTIC BANCORP 2008 WORKOUT SUB ACTIVITY Period End Balances, in Thousands Balance 3/31/08 Net Charge-Offs Moved to Performing Payments & Other, Net Balance 9/30/08 Commercial Nonaccrual Loans $101,493 ($16,474) ($2,351) ($609) $82,059 Specific Reserves ($6,440) ($1,262) - - ($7,702) Net Nonaccrual Loans Outstanding $95,053 ($17,736) ($2,351) ($609) $74,357 Performing Commercial Loans - - $2,351 ($15) $2,336 Total Net Loans Outstanding $95,053 ($17,736) - ($624) $76,693 |
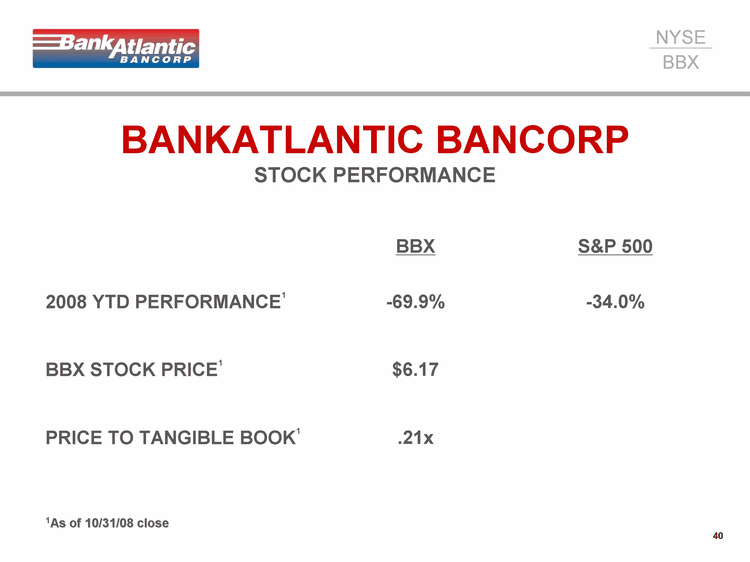
| 40 BANKATLANTIC BANCORP STOCK PERFORMANCE BBX S&P 500 2008 YTD PERFORMANCE1 -69.9% -34.0% BBX STOCK PRICE1 $6.17 PRICE TO TANGIBLE BOOK1 .21x 1As of 10/31/08 close |
| 41 FORWARD-LOOKING INFORMATION Except for historical information contained herein, the matters discussed in this document contain forward-looking statements within the meaning of Section 27A of the Securities Act of 1933, as amended (the "Securities Act"), and Section 21E of the Securities Exchange Act of 1934, as amended (the "Exchange Act"), that involve substantial risks and uncertainties. When used in this document and in any documents incorporated by reference herein, the words "anticipate," "believe," "estimate," "may," "intend," "expect" and similar expressions identify certain of such forward-looking statements. Actual results, performance, or achievements could differ materially from those contemplated, expressed, or implied by the forward-looking statements contained herein. These forward-looking statements are based largely on the expectations of BankAtlantic Bancorp, Inc. ("the Company") and are subject to a number of risks and uncertainties that are subject to change based on factors which are, in many instances, beyond the Company's control. These include, but are not limited to, risks and uncertainties associated with: the impact of economic, competitive and other factors affecting the Company and its operations, markets, products and services, including the impact of a continued downturn in the economy or a recession on our business generally, as well as the ability of our borrowers to service their obligations and of our customers to maintain account balances; credit risks and loan losses, and the related sufficiency of the allowance for loan losses, including the impact on the credit quality of our loans (including those held in the asset workout subsidiary of the Company) of a sustained downturn in the economy and in the real estate market and other changes in the real estate markets in our trade area, and where our collateral is located; the quality of our residential land acquisition and development loans (including "Builder land bank loans") and conditions specifically in that market sector; the risks of additional charge-offs, impairments and required increases in our allowance for loan losses; BankAtlantic Bancorp's ability to successfully manage the loans held by the newly formed asset workout subsidiary; the successful completion of a sale or joint venture of BankAtlantic Bancorp's interests in the newly formed asset workout subsidiary in the future, and the risk that we will continue to realize losses in that loan portfolio; changes in interest rates and the effects of, and changes in, trade, monetary and fiscal policies and laws including their impact on the bank's net interest margin; adverse conditions in the stock market, the public debt market and other financial and credit markets and the impact of such conditions on our activities, the value of our assets and on the ability of our borrowers to service their debt obligations; BankAtlantic's seven-day banking initiatives and other growth, marketing or advertising initiatives not resulting in continued growth of core deposits or increasing average balances of new deposit accounts or producing results which do not justify their costs; the success of our expense reduction initiatives and the ability to achieve additional cost savings; the success of BankAtlantic's store expansion program, and achieving growth and profitability at the stores in the time frames anticipated, if at all; and the impact of periodic testing of goodwill, deferred tax assets and other assets for impairment. Past performance, actual or estimated new account openings and growth may not be indicative of future results. In addition to the risks and factors identified above, reference is also made to other risks and factors detailed in reports filed by the Company with the Securities and Exchange Commission. The Company cautions that the foregoing factors are not exclusive |