 JUNE 2011 JUNE 2011 NYSE NYSE BBX BBX Prepared as of July 27, 2011 Prepared as of July 27, 2011 Exhibit 99.1 |
 NYSE BBX 2 • Assets - $3.9 Billion • Exchange Listing – NYSE:BBX • Major Subsidiary - BankAtlantic – Founded in 1952 – “Florida’s Most Convenient Bank” – 78 branches – Headquartered in Fort Lauderdale, FL – Operates in top 5 counties in Florida – Franchise value built on the strength of its low cost deposit base • On June 3, 2011, BankAtlantic Bancorp sold its Tampa region, including 19 branches, to PNC National Bank. • 77.2 million total Class A common shares outstanding as of June 30, 2011 BANKATLANTIC BANCORP BANKATLANTIC BANCORP OVERVIEW AS OF JUNE 30, 2011 OVERVIEW AS OF JUNE 30, 2011 |
 NYSE BBX BankAtlantic 1. Compelling franchise value based on the strength of the deposit base and recognized customer service excellence 2. Core operating earnings and fundamental operating trends of the business have remained resilient throughout the economic downturn 3. Capital ratios have been consistent and are in excess of all applicable regulatory requirements 4. Credit trends are stable to improving in the loan portfolios 5. Economic trends in Florida are improving Investment Highlights Investment Highlights 3 |
 NYSE BBX BankAtlantic has: • No Subprime lending programs • No Negative amortization or option ARM loans • No High-rise condo exposure • No Collateralized debt obligations • No Asset-backed commercial paper • No Structured investment vehicles • No Fannie Mae or Freddie Mac equity or debt securities • No Trust preferred holdings Investment Highlights Investment Highlights 4 |
 NYSE BBX 5 Investment Highlight #1: BankAtlantic’s compelling franchise value based on the strength of the deposit base and recognized customer service excellence |
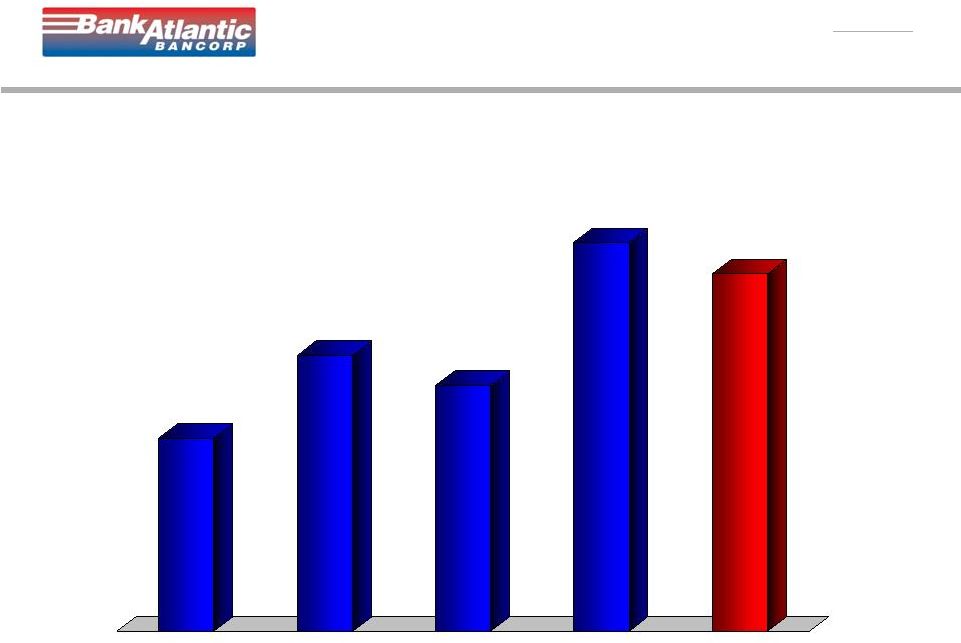
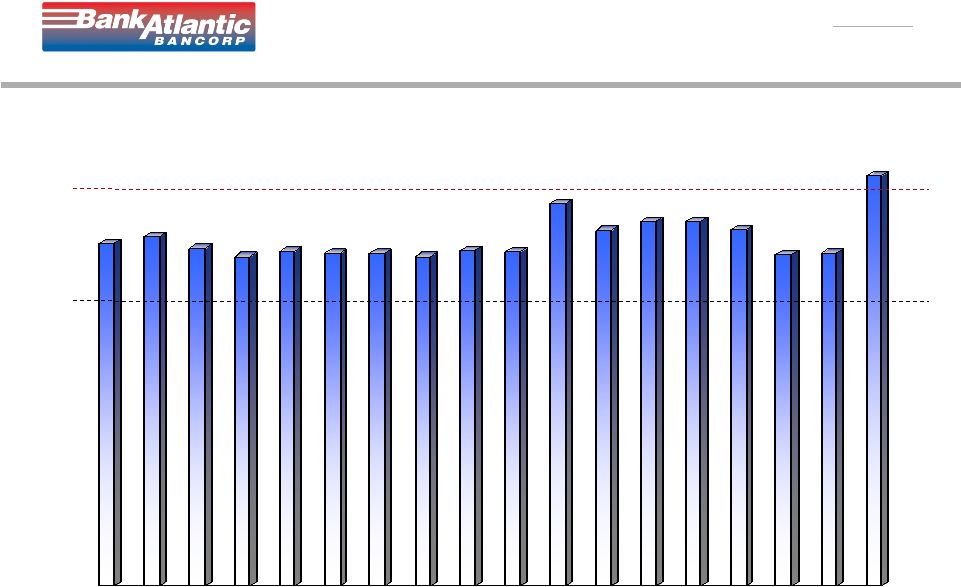
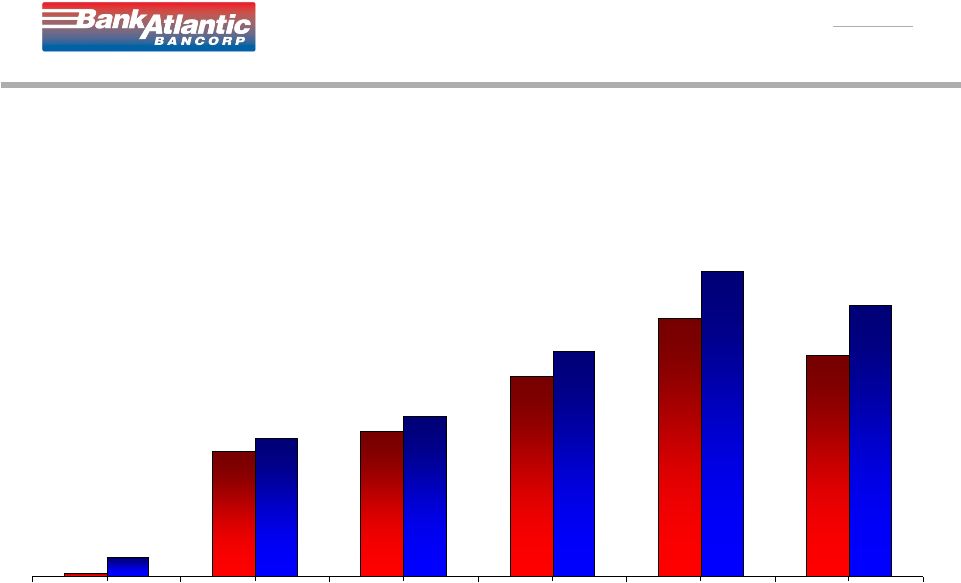
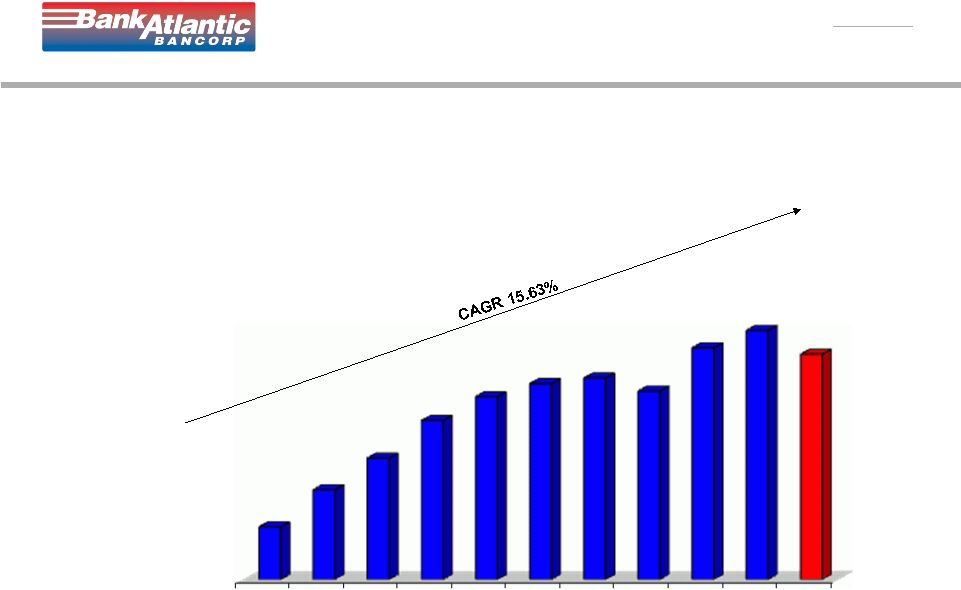 NYSE BBX 6 BankAtlantic BankAtlantic Core Deposit Balances Core Deposit Balances (1) (1) 12/31/2001 $ in Millions 12/31/2003 12/31/2005 12/31/2007 12/31/2009 06/30/2001 (1) Core deposits include DDA, NOW and savings deposit accounts held by individuals and business customers. June 30, 2011 balances include the effect of the June 2011 sale of BankAtlantic’s Tampa branches which reduced core deposits by approximately $251 million. $602 $1,026 $1,388 $1,819 $2,090 $2,240 $2,305 $2,154 $2,649 $2,847 $2,575 |
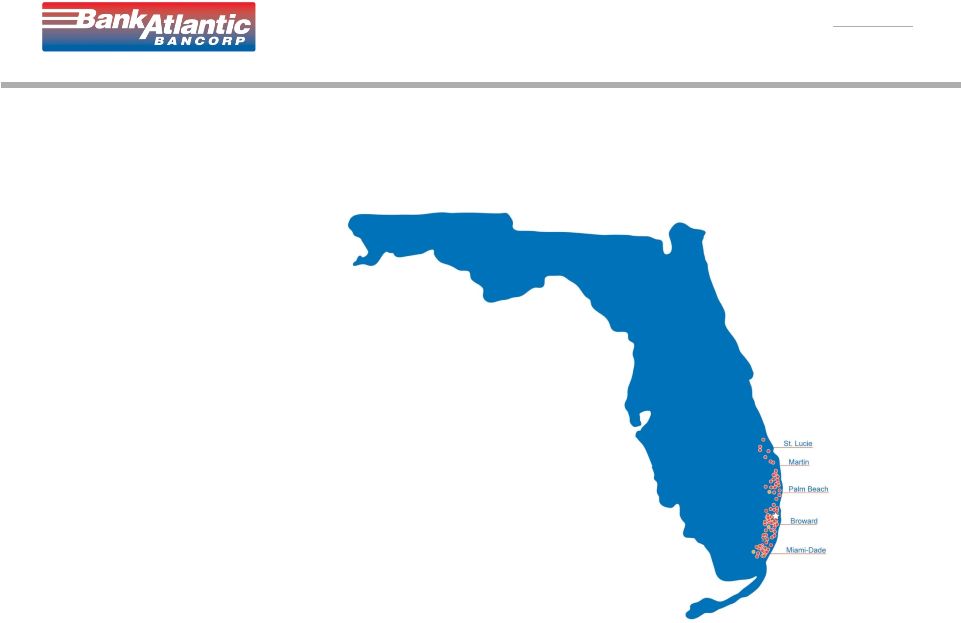 NYSE BBX 7 BANKATLANTIC FOOTPRINT BANKATLANTIC FOOTPRINT 78 Locations as of June 30, 2011 |
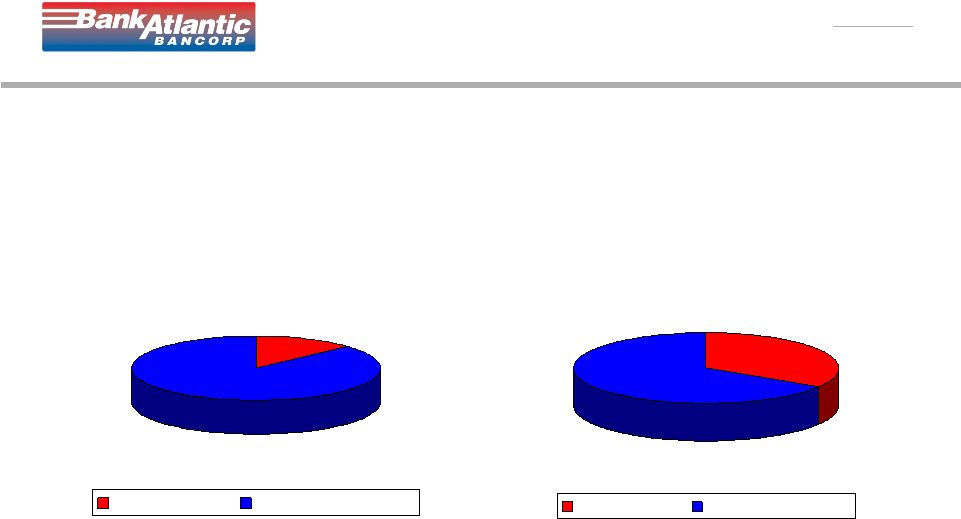 NYSE BBX 8 BankAtlantic As of 6/30/11 13% 87% Time Deposits Non-Time Deposits All Publicly Traded Florida Banks & Thrifts 34% 66% Time Deposits Non-Time Deposits BankAtlantic BankAtlantic Deposit Mix Deposit Mix Source: SNL Financial. Data as of the most recent quarter available. |
 NYSE BBX 9 BankAtlantic BankAtlantic Cost of Deposits Cost of Deposits Publicly Traded Florida Banks & Thrifts Median Cost of Deposits (as of March 31, 2011) 1 : 1.08% 1 Source: SNL Financial. Data as of the most recent quarter available. 4Q2007 4Q2008 4Q2009 4Q2010 1Q2011 2Q2011 2.15% 1.58% 0.92% 0.46% 0.44% 0.41% |
 NYSE BBX 10 BankAtlantic BankAtlantic Core Core Deposits Deposits Cost Cost of of Funds Funds (1) (1) (1) Core deposits is a non-GAAP measure that we use to refer to Demand, NOW, and Savings accounts. See BankAtlantic Bancorp’s website for supplemental financials and a reconciliation to GAAP. 4Q2007 4Q2008 4Q2009 4Q2010 1Q2011 2Q2011 0.94% 0.49% 0.38% 0.25% 0.25% 0.22% |
 NYSE BBX 11 BankAtlantic BankAtlantic Total Cost of Funds Total Cost of Funds 3.54% 2.30% 1.13% 0.62% 0.59% 0.57% 4Q2007 4Q2008 4Q2009 4Q2010 1Q2011 2Q2011 |
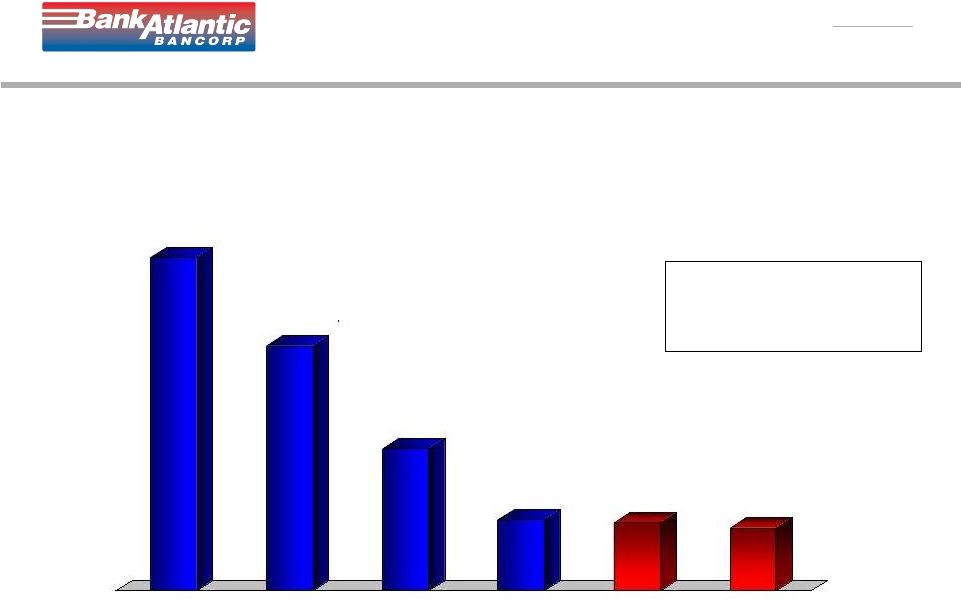
 NYSE BBX 12 BankAtlantic FLORIDA BRANCH RANKING (1) As of 3/31/11 Source: SNL Financial (2) 78 branches as of June 30, 2011 Institution Branches 1. Wells Fargo 703 2. Bank of America 659 3. SunTrust 555 4. Regions Bank 399 5. BB&T 274 6. JPMorgan Chase 273 7. PNC Financial 217 8. Toronto-Dominion Bank 172 9. Fifth Third Bancorp 167 10. BankUnited 81 11. BankAtlantic 2 78 12. Hancock 69 13. CenterState Banks 66 1 |
 NYSE BBX 13 In 2010, BankAtlantic was honored with the award of the “Highest in Customer Satisfaction with Retail Banking in Florida” from J.D. Power and Associates* BankAtlantic BankAtlantic Customer Service Customer Service * BankAtlantic received the highest numerical score among retail banks in Florida in the proprietary J.D. Power and Associates 2010 Retail Banking Satisfaction Study based on 47,673 total responses measuring 9 providers in Florida and measures opinions of consumers with their primary banking provider. Proprietary study results are based on experiences and perceptions of consumers surveyed in January 2010. Your experiences may vary. Visit jdpower.com |
 NYSE BBX 14 Investment Highlight #2: Core operating earnings and fundamental operating trends of the business have remained resilient throughout the economic downturn |
 NYSE BBX 15 BankAtlantic BankAtlantic Total Assets Total Assets ($ in thousands, period end) ($ in thousands, period end) 12/31/2007 12/31/2008 12/31/2010 12/31/2009 6/30/2011 $6,161,962 $5,713,690 $4,755,122 $4,469,168 $3,831,471 |
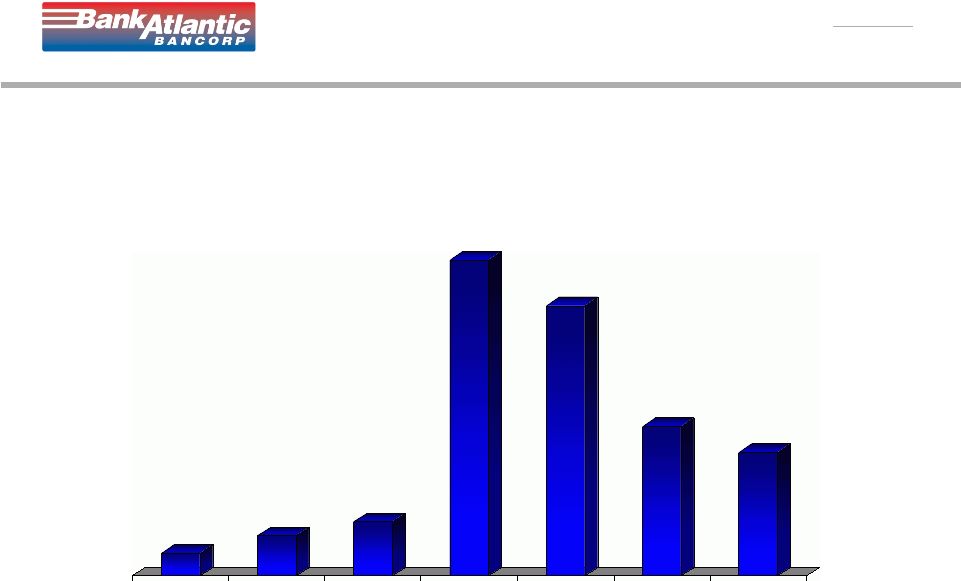
 NYSE BBX Mar- 07 Jun- 07 Sep- 07 Dec- 07 Mar- 08 Jun- 08 Sep- 08 Dec- 08 Mar- 09 Jun- 09 Sep- 09 Dec- 09 Mar- 10 Jun- 10 Sep- 10 Dec- 10 Mar- 11 Jun- 11 BankAtlantic Borrowings BankAtlantic Borrowings (Leverage) (Leverage) $1.5 Bil $1.8 Bil $1.3 Bil $667 Mil $172 Mil $226 Mil 16 $23 Mil |
 NYSE BBX BankAtlantic BankAtlantic Total Liquidity * Total Liquidity * (as a % of deposits) (as a % of deposits) 17 6/30/2008 12/31/2008 12/31/2009 12/31/2010 * Total Liquidity = Cash, unencumbered securities & the unused portion of lines of credit 6/30/2011 18.73% 26.76% 23.92% 37.71% 34.69% |
 NYSE BBX 18 BankAtlantic BankAtlantic Net Interest Margin Net Interest Margin 3.62% 3.45% 3.35% 3.55% 3.30% 2007 2008 2009 2010 6/30/11 |
 NYSE BBX 19 BankAtlantic BankAtlantic Number of Employees, period end Number of Employees, period end 12/31/2006 12 /31 /2007 12 /31 /2008 12/31/2009 12/31/2010 6 /30 /2011 2,811 2,562 1,841 1,532 1,265 1,045 |
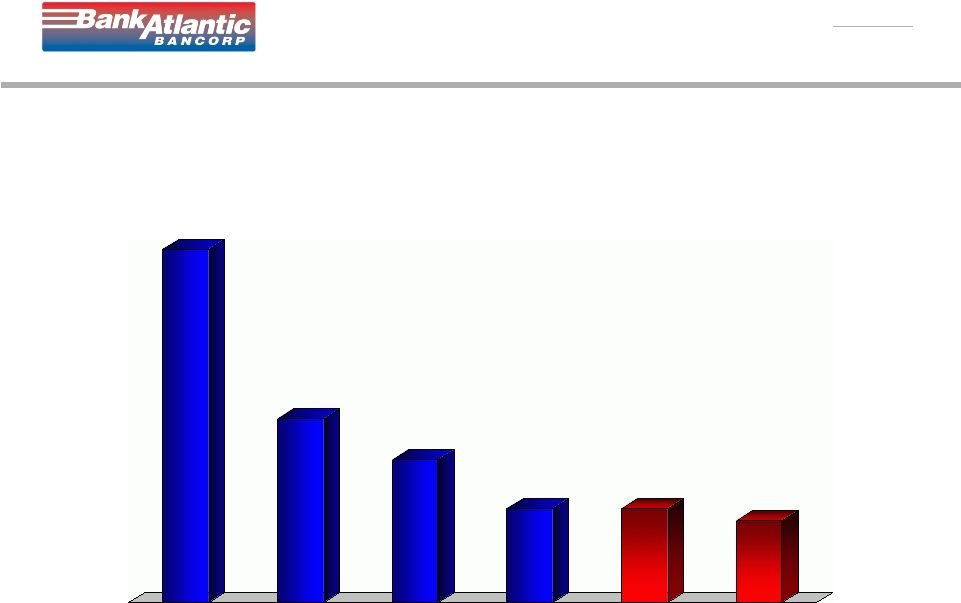
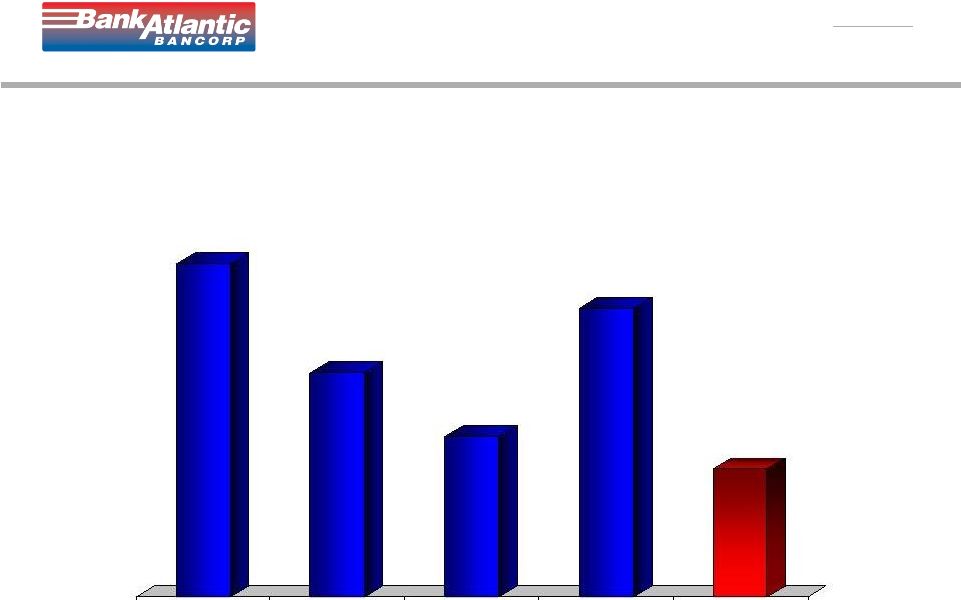
 NYSE BBX 20 $292,707 $263,786 $223,405 $209,999 $88,780 2007 2008 2009 2010 2011 YTD BankAtlantic BankAtlantic Core Non-Interest Expense Core Non-Interest Expense ¹ 1 ($ in thousands) ($ in thousands) 1 Core non-interest expense is a non-GAAP measure. See BankAtlantic Bancorp’s website for supplemental financials and a reconciliation to GAAP. 1Q2011 = $46,042 2Q2011 = $42,738 |
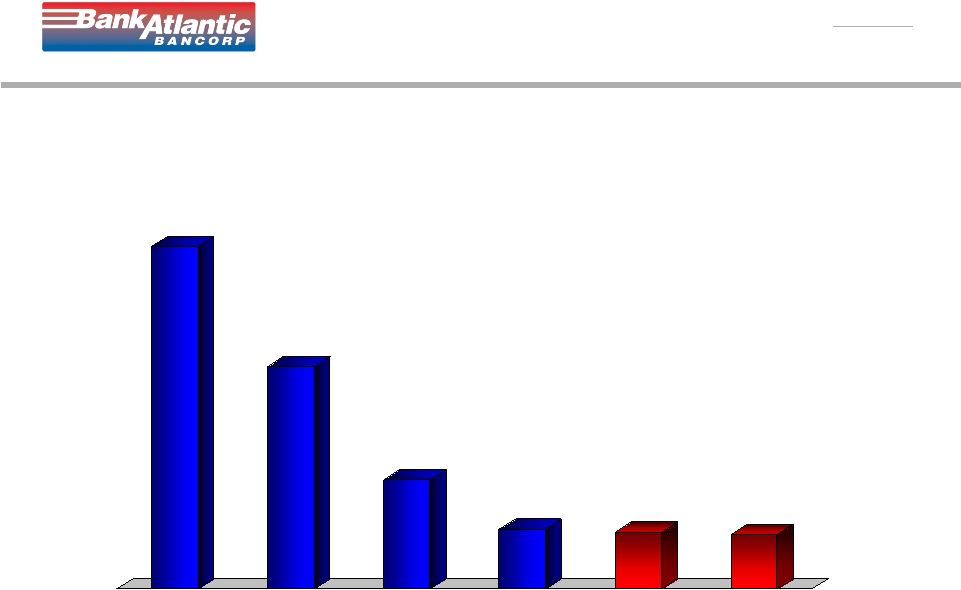
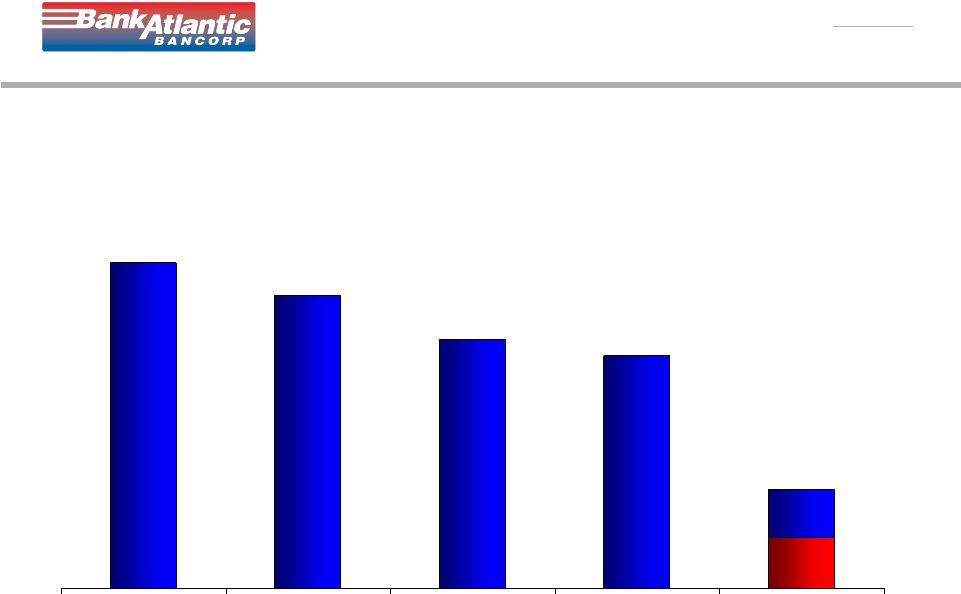
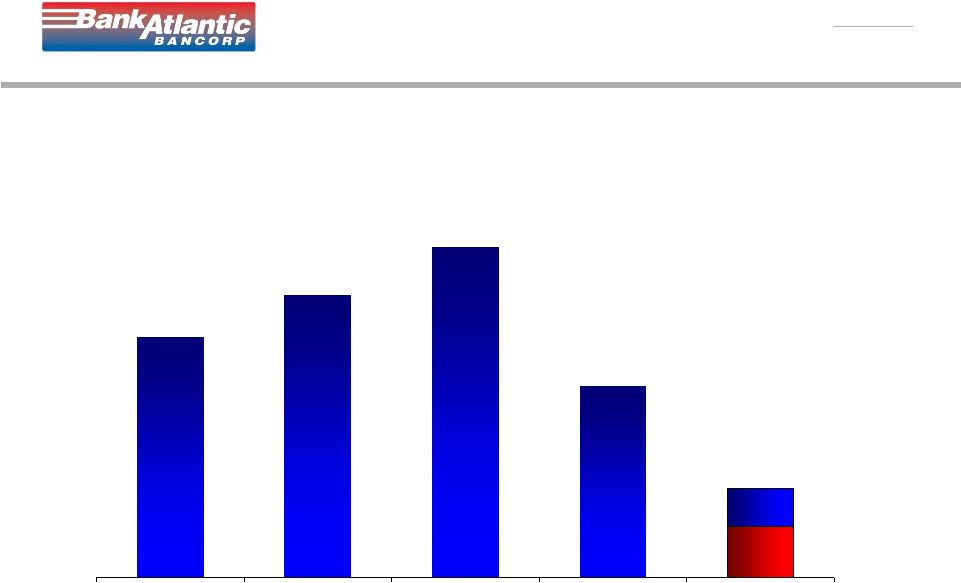
 NYSE BBX 21 $50,685 $67,170 $69,211 $47,097 $23,232 2007 2008 2009 2010 2011 YTD BankAtlantic BankAtlantic Core Core Operating Operating Earnings Earnings 1 1 ($ in thousands) ($ in thousands) 1 Core Operating Earnings is a non-GAAP measure. See BankAtlantic Bancorp’s website for supplemental financials and a reconciliation to GAAP. 1Q2011 = $11,575 2Q2011 = $11,657 |
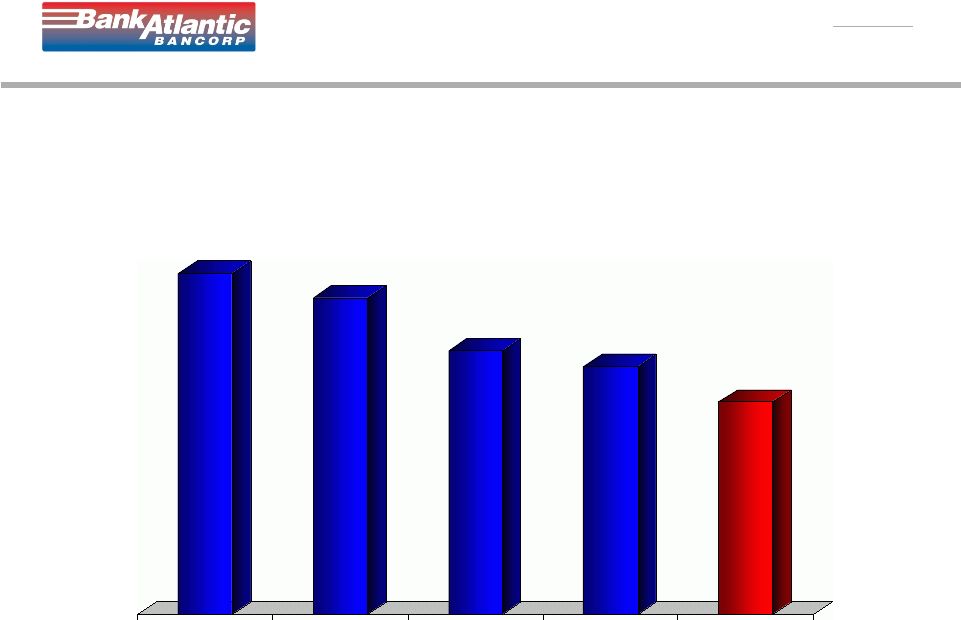
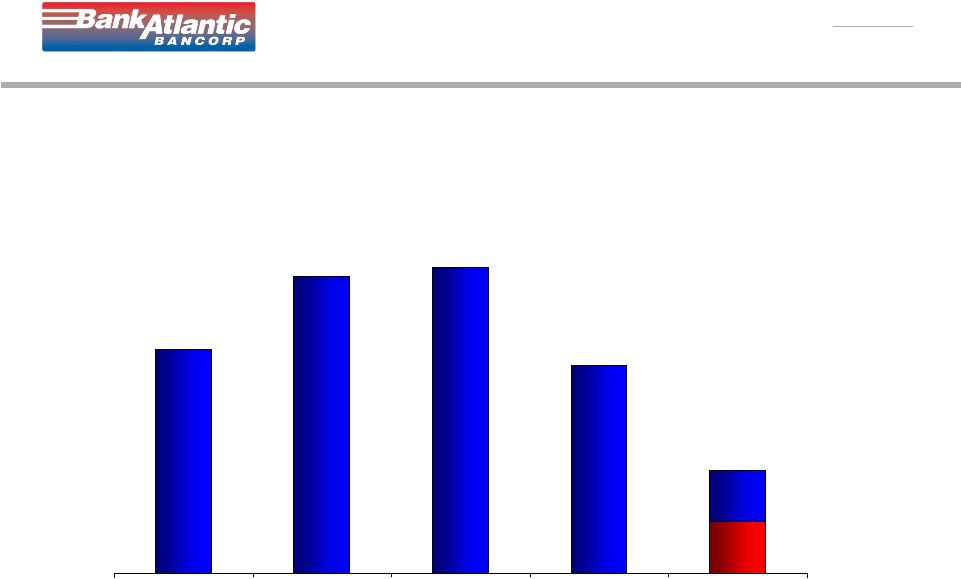
 NYSE BBX 22 22 $12,505 $27,170 $46,813 $39,900 $33,900 2007 2008 2009 2010 2011 YTD BANKATLANTIC BANCORP (BBX) BANKATLANTIC BANCORP (BBX) CORE CORE OPERATING OPERATING EARNINGS EARNINGS 1 1 ($ in thousands) ($ in thousands) 1 Core Operating Earnings is a non-GAAP measure. See BankAtlantic Bancorp’s website for supplemental financials and a reconciliation to GAAP. 1Q2011 = $7,210 2Q2011 = $5,295 |
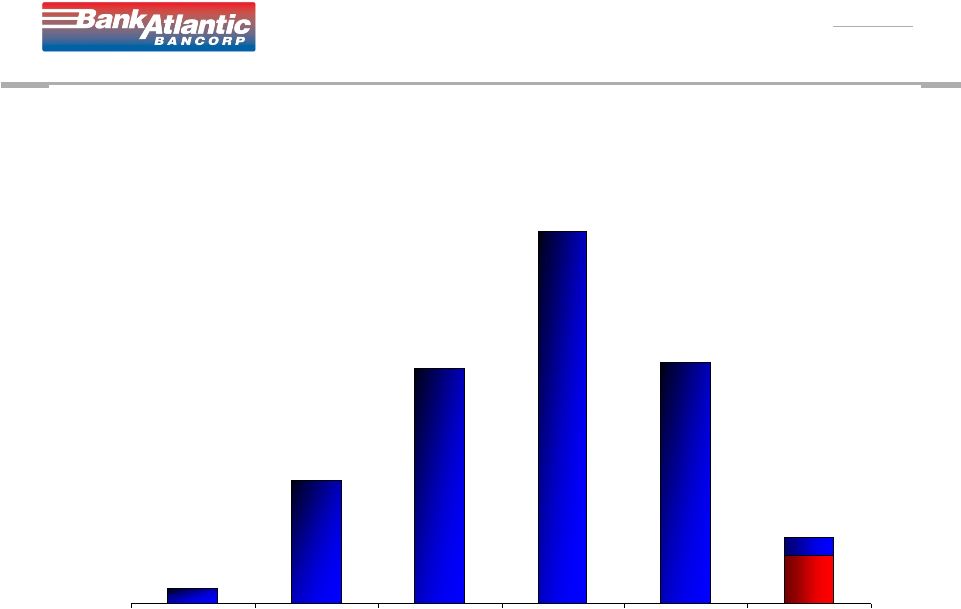
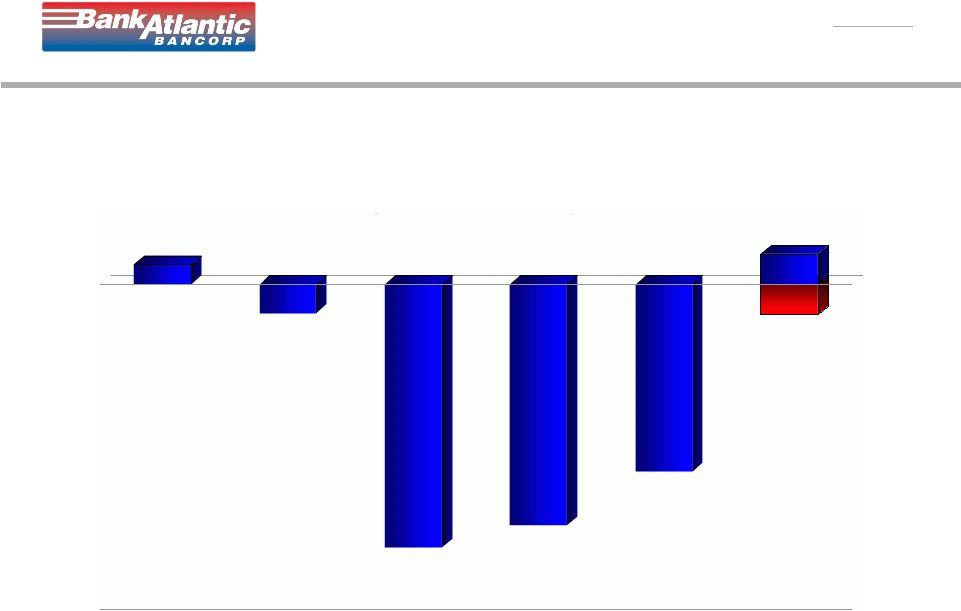 NYSE BBX 23 23 BANKATLANTIC BANCORP (BBX) BANKATLANTIC BANCORP (BBX) GAAP INCOME/LOSSES GAAP INCOME/LOSSES ($ in thousands) ($ in thousands) ($202,600) ($185,800) ($144,181) 2006 2007 2008 2009 2010 2011 YTD 1Q2011 = ($23,182) 2Q2011 = $23,111 $15,400 ($22,200) ($71) |
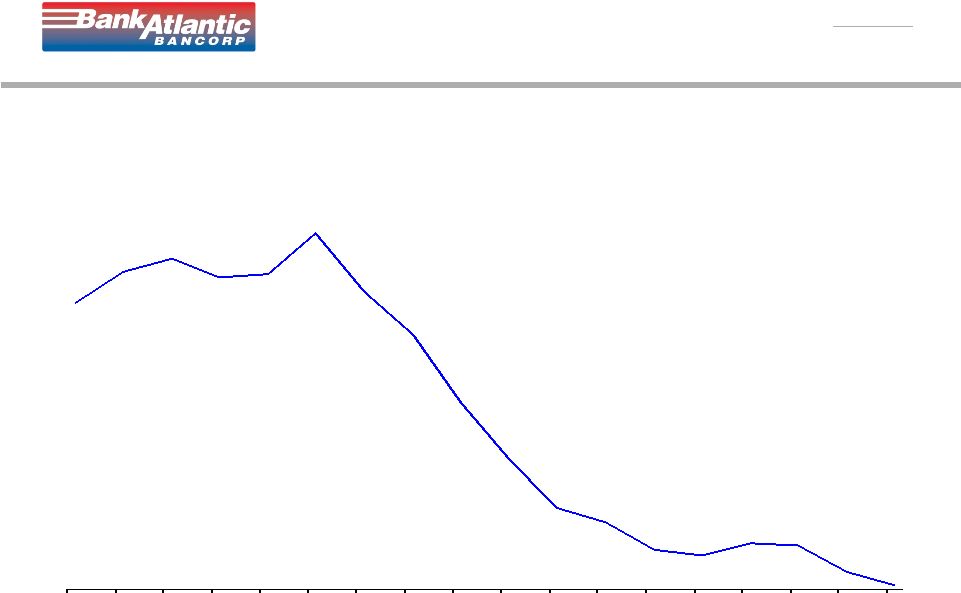
 NYSE BBX 24 BANKATLANTIC BANCORP STOCK PERFORMANCE CLOSING PRICE 1 NYSE:BBX 1 Stock price represents adjusted closing price at the last day of trading each year, and reflects the impact of a 1:5 reverse stock split in September 2008. Dec-97 Dec-98 Dec-99 Dec-00 Dec-01 Dec-02 Dec-03 Dec-04 Dec-05 Dec-06 Dec-07 Dec-08 Dec-09 Dec-10 Mar-11 'Jun-11 $36.06 $18.01 $13.53 $12.52 $31.28 $32.58 $66.03 $94.59 $67.15 $66.97 $20.17 $5.76 $1.30 $1.15 $0.92 $0.95 |
 NYSE BBX 25 Investment Highlight #3: Capital ratios have been consistent and are in excess of all applicable regulatory requirements |
 NYSE BBX 26 BankAtlantic BankAtlantic Regulatory Capital Requirements Regulatory Capital Requirements Historical Regulatory Requirement BankAtlantic 6/30/2011 Ratios BankAtlantic New Regulatory Requirements (1) Tier 1 (Core) 5.00% 8.24% 8.00% Total Risk-Based 10.00% 14.52% 14.00% (1) On February 23, 2011, BankAtlantic Bancorp and BankAtlantic entered into a Stipulation and Consent to the issuance of an Order to Cease and Desist (the “Order”) with the Office of Thrift Supervision. The Order requires corrective measures in a number of areas, including a requirement that, by June 30, 2011, BankAtlantic is to have and maintain a Tier 1 (Core) Capital Ratio equal to or greater than 8% and a Total Risk-Based Capital Ratio equal to or greater than 14%. For further information, including a copy of the Orders, see the Form 8-K filed by BankAtlantic Bancorp with the SEC on February 25, 2011. |
 NYSE BBX 27 BankAtlantic BankAtlantic Tier 1 (Core) Capital Tier 1 (Core) Capital Prior requirement (5%) Current requirement (8%) Mar- 07 Jun- 07 Sep- 07 Dec- 07 Mar- 08 Jun- 08 Sep- 08 Dec- 08 Mar- 09 Jun- 09 Sep- 09 Dec- 09 Mar- 10 Jun- 10 Sep- 10 Dec- 10 Mar- 11 Jun- 11 7.51% 7.49% 7.20% 6.94% 6.87% 6.82% 6.89% 6.80% 6.97% 7.01% 8.31% 7.58% 7.51% 7.36% 7.17% 6.22% 5.97% 8.24% |
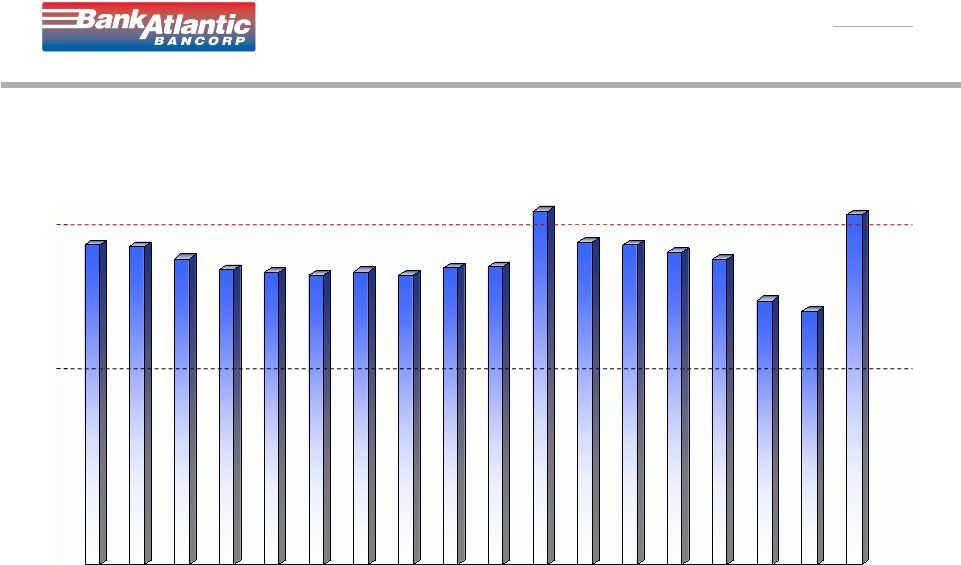
 NYSE BBX 28 12.11% 12.34% 11.93% 11.63% 11.83% 11.77%11.75% 11.63% 11.86% 11.81% 13.51% 12.56% 12.86%12.86% 12.59% 11.72% 11.76% 14.52% Mar- 07 Jun- 07 Sep- 07 Dec- 07 Mar- 08 Jun- 08 Sep- 08 Dec- 08 Mar- 09 Jun- 09 Sep- 09 Dec- 09 Mar- 10 Jun- 10 Sep- 10 Dec- 10 Mar- 11 Jun- 11 BankAtlantic BankAtlantic Total Risk-Based Capital Total Risk-Based Capital Current requirement (14%) Prior requirement (10%) |
 NYSE BBX 29 Investment Highlight #4: BankAtlantic’s credit trends are stable to improving in the loan portfolios |
 NYSE BBX 30 These balances and the following BankAtlantic Credit Trend slides exclude information on the loans that were transferred to BankAtlantic Bancorp Partners, Inc. effective 3/31/08, which total approximately $12.0 million as of 6/30/11. BankAtlantic BankAtlantic Credit Composition Credit Composition Average Balances Loans 6/30/2011 % of Total Residential real estate $ 1.1 Bil 37% Commercial real estate 822 Mil 28% Consumer 605 Mil 21% Commercial business 124 Mil 4% Small business 298 Mil 10% Total Loans $ 2.9 Bil 100% Allowance for Loan Losses (Ending Balance) 138 Mil - as a % of total loans, gross 4.92% |
 NYSE BBX 31 ($ in Thousands) BankAtlantic BankAtlantic Credit Quality Credit Quality Loan Provision Loan Provision 1Q2011 = $27,832 2Q2011 = $10,195 $8,574 $135,383 $70,842 $214,244 $138,824 $38,027 2006 2007 2008 2009 2010 2011 YTD |
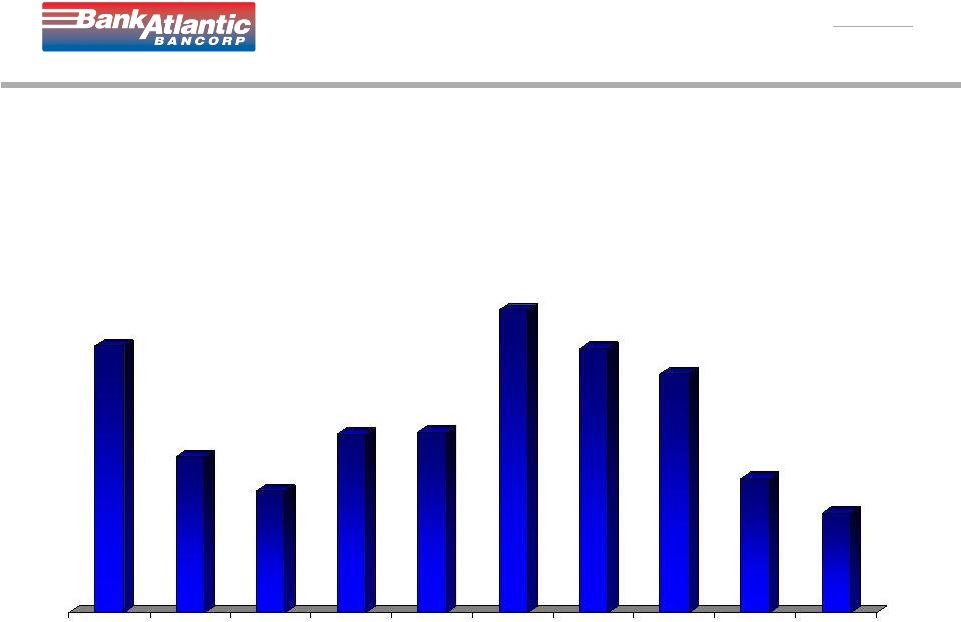 NYSE BBX BankAtlantic BankAtlantic New New Non-Performing Non-Performing Loans Loans (Total (Total Bank) Bank) by by Quarter Quarter ($ in Thousands) 32 1 Of these amounts, the following were designated as non-performing, but continued to pay as agreed: 2Q2010 - $49,770, 3Q2010 - $59,040, 4Q2010 - $48,173, 1Q2011 - $11,820, 2Q2011 - $6,869. 1 $88,785 $51,831 $40,462 $59,522 $60,118 $100,669 $87,984 $79,487 $44,655 $33,133 1Q2009 2Q2009 3Q2009 4Q2009 1Q2010 2Q2010 3Q2010 4Q2010 1Q2011 2Q2011 |
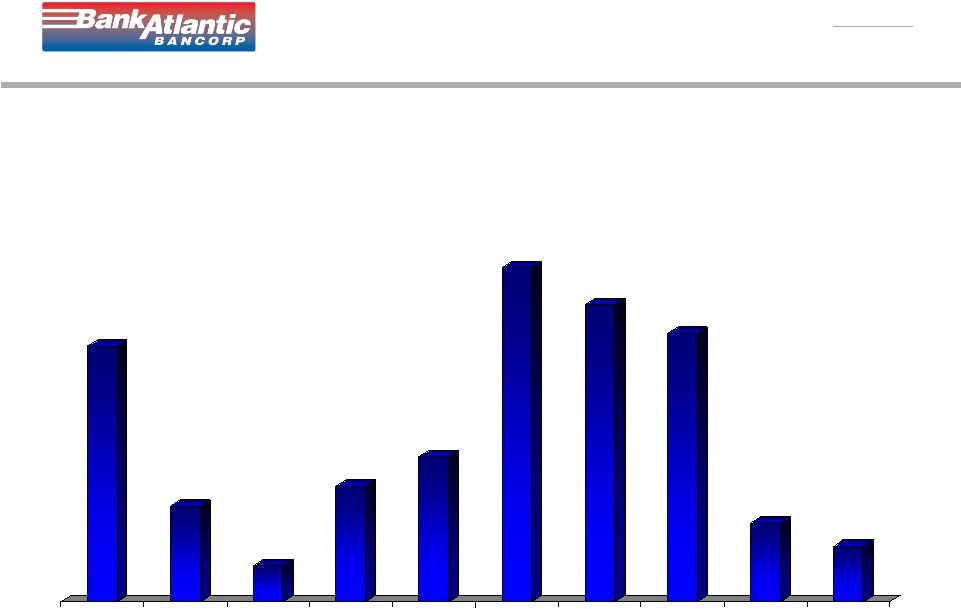 NYSE BBX $56,122 $20,938 $7,812 $25,328 $31,809 $73,267 $65,155 $58,885 $17,248 $12,202 1Q2009 2Q2009 3Q2009 4Q2009 1Q2010 2Q2010 3Q2010 4Q2010 1Q2011 2Q2011 BankAtlantic BankAtlantic New New Non-Performing Non-Performing Loans Loans (Commercial (Commercial Real Real Estate) Estate) by by Quarter Quarter ($ in Thousands) 33 1 Of these amounts, the following were designated as non-performing, but continued to pay as agreed: 2Q2010 - $49,770, 3Q2010 - $59,040, 4Q2010 - $48,173, 1Q2011 - $11,820, 2Q2011 - $6,869 1 |
 NYSE BBX 34 BankAtlantic BankAtlantic Non-Performing Loans and Non-Performing Loans and Non-Performing Assets Non-Performing Assets ($ in Thousands) 12/31/06 12/31/07 12/31/08 12/31/09 12/31/10 6/30/11 $4,436 $26,814 $324,226 $438,923 $389,789 $315,973 $178,591 $208,088 $286,120 $370,959 $228,574 $197,901 |
 NYSE BBX 35 BankAtlantic BankAtlantic Total Delinquency Trends Total Delinquency Trends (excluding non-performing loans) 12/31/2005 12/31/2006 12/31/2007 12/31/2008 12/31/2009 12/31/2010 6/30/2011 0.18% 0.32% 0.43% 2.54% 2.17% 1.20% 0.99% |
 NYSE BBX 36 BankAtlantic BankAtlantic Commercial Real Estate Delinquency Trends Commercial Real Estate Delinquency Trends (excluding non-performing loans) 12/31/2005 12/31/2006 12/31/2007 12/31/2008 12/31/2009 12/31/2010 6/30/2011 6.11% 3.07% 0.00% 0.00% 0.00% 0.41% 0.00% |
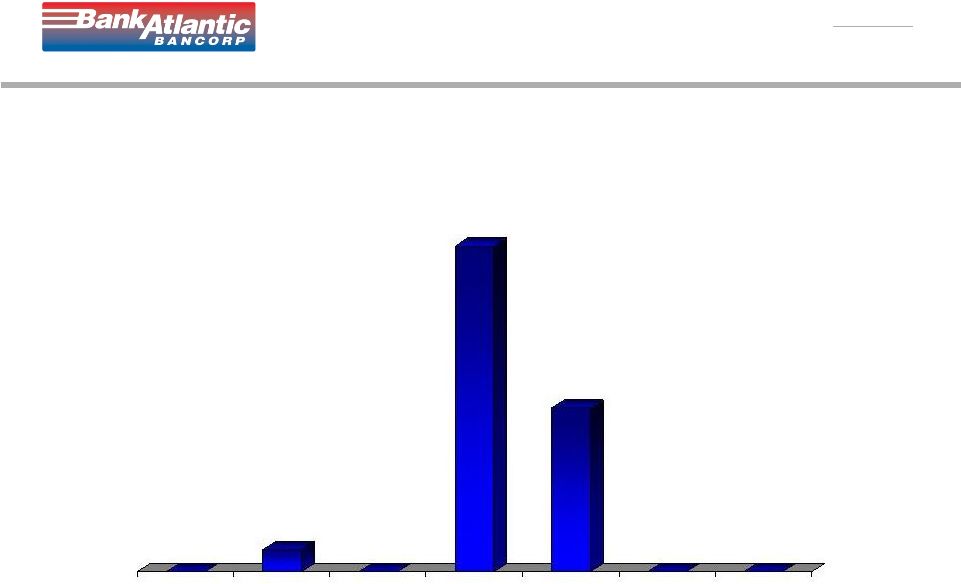
 NYSE BBX 37 BankAtlantic BankAtlantic Commercial Real Estate Residential Land Portfolio Commercial Real Estate Residential Land Portfolio Outstanding Balance ($ in thousands) Outstanding Balance ($ in thousands) 1 Net of specific reserves 3Q 2007 2Q 2011 82 Loans - $550,702 1 26 Loans - $76,830 |
 NYSE BBX 38 Investment Highlight #5: Economic trends in Florida are improving |
 NYSE BBX 39 Improving South Florida Improving South Florida Housing Market Housing Market “We have seen year-over-year increase for pending sales for nearly one year. Pending sales have also increased month-over-month 10 out of the last 13 months.” - Jack H. Levine, chairman of the Miami Association of Realtors, South Florida Business Journal, February 28, 2011 “All market trends indicate continued growth for Miami-Dade County’s real estate market. This is very positive for the local real estate market. Increased pending sales reflect the existence of pent-up demand and should result in strengthening home values as distressed housing inventory continues to be absorbed.” - Jack H. Levine, chairman of the Miami Association of Realtors, South Florida Business Journal, March 29, 2011 Miami-Dade County 1 • March 2011 pending home sales up 18% year-over-year Broward County 1 • March 2011 pending home sales up 6% year-over-year 1. Source: South Florida Business Journal, March 29, 2011 |
 NYSE BBX 40 FLORIDA MARKET FLORIDA MARKET “Florida is #3 in national deposits at $369 billion” • Florida is projected to have 4.25% population growth over the next 5 years (2010 to 2015) • Florida is #4 in national deposits at $410 billion 1. Source: FDIC, June 30, 2010 1 |
 NYSE BBX 41 Source: SunSentinel; Impact of the 2010 Census – Population and Economic Trends, May 20, 2011 (Rick Gilbert) Data from 2010 Census FLORIDA MARKET Rank 2010 Population % Change from 2000 Rank 2010 Population % Change from 2000 - United States 308,745,538 9.7% - United States 308,745,538 9.7% 1 California 37,253,956 10.0% 1 Nevada 2,700,551 35.1% 2 Texas 25,145,561 20.6% 2 Arizona 6,392,017 24.6% 3 New York 19,378,102 2.1% 3 Utah 2,763,885 23.8% 4 Florida 18,801,310 17.6% 4 Idaho 1,567,582 21.1% 5 Illinois 12,830,632 3.3% 5 Texas 25,145,561 20.6% 6 Pennsylvania 12,702,379 3.4% 6 North Carolina 9,535,483 18.5% 7 Ohio 11,536,504 1.6% 7 Georgia 9,687,653 18.3% 8 Michigan 9,883,640 -0.6% 8 Florida 18,801,310 17.6% 9 Georgia 9,687,653 18.3% 9 Colorado 5,029,196 16.9% 10 North Carolina 9,535,483 18.5% 10 South Carolina 4,625,364 15.3% 2010 U.S. Census States Ranked by 2010 Population 2010 U.S. Census States Ranked by 10-Year Growth Rate |
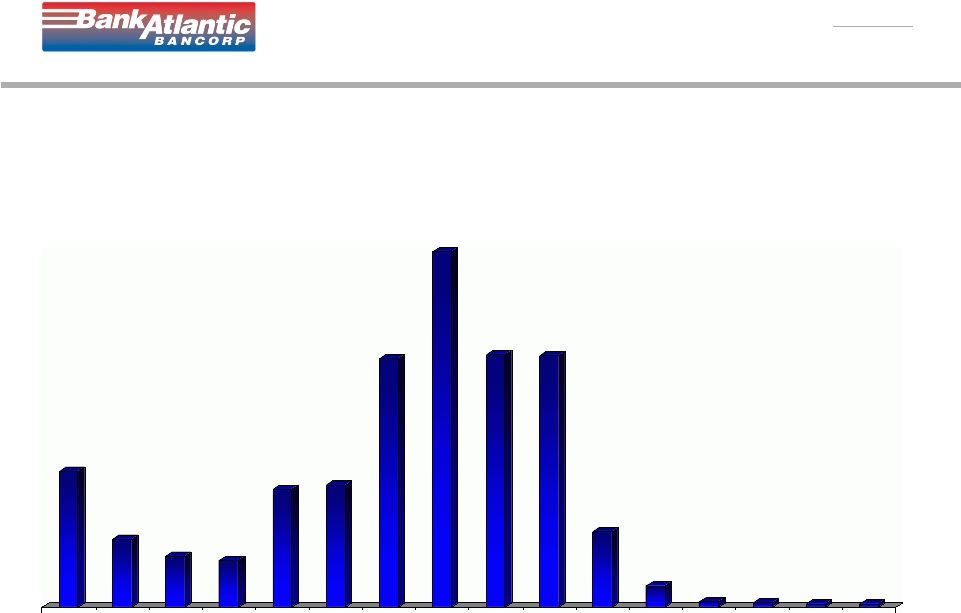
 NYSE BBX 42 Source: SunSentinel; Impact of the 2010 Census – Population and Economic Trends, May 20, 2011 (Rick Gilbert) Data from 2010 Census Rank MSA Population Rank MSA Population Rank MSA Population 1 New York 16,846,046 1 New York 18,323,002 1 New York 18,897,109 2 Los Angeles 11,273,720 2 Los Angeles 12,365,627 2 Los Angeles 12,828,837 3 Chicago 8,182,076 3 Chicago 9,098,316 3 Chicago 9,461,105 4 Philadelphia 5,435,468 4 Philadelphia 5,687,147 4 Dallas-Forth Worth 6,371,773 5 Detroit 4,248,699 5 Dallas-Forth Worth 5,161,544 5 Philadelphia 5,965,343 6 Boston 4,133,895 6 Miami-Fort Lauderdale 5,007,564 6 Houston 5,946,800 7 Washington DC 4,122,914 7 Washington DC 4,796,183 7 Washington DC 5,582,170 8 Miami-Fort Lauderdale 4,056,100 8 Houston 4,715,407 8 Miami-Fort Lauderdale 5,564,635 9 Dallas-Forth Worth 3,989,294 9 Detroit 4,452,557 9 Atlanta 5,268,860 10 Houston 3,767,335 10 Boston 4,391,344 10 Boston 4,552,402 2010 Census 2010 U.S. Census Metro Area Rankings 1990 Census 2000 Census FLORIDA MARKET |
 NYSE BBX BankAtlantic 1. Compelling franchise value based on the strength of the deposit base and recognized customer service excellence 2. Core operating earnings and fundamental operating trends of the business have remained resilient throughout the economic downturn 3. Capital ratios have been consistent and are in excess of all applicable regulatory requirements 4. Credit trends are stable to improving in the loan portfolios 5. Economic trends in Florida are improving Value Proposition Value Proposition 43 |
 NYSE BBX 44 Forward-Looking Statements Forward-Looking Statements Except for historical information contained herein, the matters discussed in this press release contain forward-looking statements within the meaning of Section 27A of the Securities Act of 1933, as amended (the “Securities Act”), and Section 21E of the Securities Exchange Act of 1934, as amended (the “Exchange Act”), that involve substantial risks and uncertainties. Actual results, performance, or achievements could differ materially from those contemplated, expressed, or implied by the forward- looking statements contained herein. These forward-looking statements are based largely on the expectations of BankAtlantic Bancorp, Inc. (“the Company”) and are subject to a number of risks and uncertainties that are subject to change based on factors which are, in many instances, beyond the Company’s control. These include, but are not limited to, risks and uncertainties associated with: the impact of economic, competitive and other factors affecting the Company and its operations, markets, products and services, including the impact of the changing regulatory environment, a continued or deepening recession, continued decreases in real estate values, and increased unemployment or sustained high unemployment rates on our business generally, BankAtlantic’s regulatory capital ratios, the ability of our borrowers to service their obligations and of our customers to maintain account balances and the value of collateral securing our loans; credit risks and loan losses, and the related sufficiency of the allowance for loan losses, including the impact on the credit quality of our loans (including those held in the asset workout subsidiary of the Company) of the economy; the risk that loan losses have not peaked and risks of additional charge-offs, impairments and required increases in our allowance for loan losses; the impact of regulatory proceedings and litigation including but not limited to proceedings and litigation relating to overdraft fees and tax certificates; risks associated with maintaining compliance with the Cease and Desist Orders entered into by the Company and BankAtlantic with the Office of Thrift Supervision, including risks that BankAtlantic will not maintain required capital levels, that compliance will adversely impact operations, and that failing to comply with regulatory mandates will result in the imposition of additional regulatory requirements and/or fines; changes in interest rates and the effects of, and changes in, trade, monetary and fiscal policies and laws including their impact on the bank’s net interest margin; adverse conditions in the stock market, the public debt market and other financial and credit markets and the impact of such conditions on our activities and our ability to raise capital; we may raise additional capital and such capital may be highly dilutive to BankAtlantic Bancorp’s shareholders or may not be available; and the risks associated with the impact of periodic valuation testing of goodwill, deferred tax assets and other assets. Past performance and perceived trends may not be indicative of future results. In addition to the risks and factors identified above, reference is also made to other risks and factors detailed in reports filed by the Company with the Securities and Exchange Commission, including the Company’s Annual Report on Form 10-K for the year ended December 31, 2010, and the Quarterly Report on Form 10-Q for the quarter ended March 31, 2011. The Company cautions that the foregoing factors are not exclusive. |
 NYSE BBX 45 This presentation contains financial information determined by methods other than in accordance with accounting principles generally accepted in the United States of America (“GAAP”). Management uses non-GAAP financial measures to supplement its GAAP financial information and to provide additional useful measures in the evaluation of BankAtlantic's operating results and any related trends that may be affecting BankAtlantic's business. Management uses pre-tax core operating earnings to measure BankAtlantic's financial performance excluding items that are not currently controllable by management. Management uses core expenses to measure expense reduction trends excluding items that are not currently controllable by management. The core operating efficiency ratio is used by management to measure the costs expended to generate a dollar of revenues excluding items that are not currently controllable by management. The return on average tangible equity and average tangible assets is used by management to measure BankAtlantic's effectiveness in its use of capital and assets, respectively, and to allow for comparison to other companies in the industry. The tangible equity to tangible asset ratio is used by management to evaluate capital adequacy trends and to allow for comparison to other companies in the industry. Management uses the core deposit measure to assess trends relating to its lower cost deposit categories, which management believes may generally be more indicative of relationship deposits. These disclosures should not be viewed as a substitute for operating results determined in accordance with GAAP, nor are they necessarily comparable to non-GAAP performance measures that may be presented by other companies. See reconciliations of GAAP to non-GAAP measures in the financial information presented on BankAtlantic Bancorp’s website under Investor Relations. Non-GAAP Information Non-GAAP Information |
 NYSE BBX 46 |