Exhibit 99.1

BankAtlantic Bancorp Reports Financial Results
For the Third Quarter, 2011
FORT LAUDERDALE, Florida – November 2, 2011 – BankAtlantic Bancorp, Inc. (NYSE: BBX) today reported a net loss of ($11.8) million, or ($0.74) per diluted share, for the quarter ended September 30, 2011, compared to a net loss of ($25.2) million, or ($2.09) per diluted share, for the quarter ended September 30, 2010. Its banking subsidiary, BankAtlantic, had a net loss of ($8.1) million for the third quarter of 2011, compared to a net loss of ($17.7) million for the third quarter of 2010.
BankAtlantic Bancorp’s Chairman and Chief Executive Officer, Alan B. Levan, commented, “As announced on November 1, 2011, BankAtlantic Bancorp has signed a definitive agreement to sell its wholly-owned subsidiary, BankAtlantic, to BB&T Corporation (NYSE: BBT). With the strength of BB&T, one of the nation’s largest financial holding companies, we are confident that BankAtlantic’s customers and employees will be served well by this transaction. For more detailed information about the proposed transaction, please refer to the press release issued on November 1, 2011, as well as reports filed by the Company with the Securities and Exchange Commission, and can be viewed free of charge on the SEC’s website,www.sec.gov.
“BankAtlantic’s results this quarter reflect our continued commitment to capital, credit and core earnings. Our capital ratios improved from the prior quarter and remain above all regulatory requirements, credit metrics continue to reflect a stabilizing economic environment, and operations remain strong and customer focused.
“We completed the sale of our Tampa branches in June of this year, and accordingly, this quarter’s results reflect the first quarter of BankAtlantic’s sole focus on South Florida. While the local economy is still challenging and recovery is slower than many anticipated, the signs of a developing economic rebound are present.
“As we have discussed in previous quarters, we believe that BankAtlantic’s loan losses peaked in 2009 and that the trends continue to support our optimism that we, along with South Florida, are on the path toward economic recovery. These trends, from the beginning of the
1
recession through the current quarter, are reflected in the Supplemental Graphs which should be viewed in conjunction with the Supplemental Financials on our BankAtlantic Bancorp’s Investor Relations website.”
BANKATLANTIC PERFORMANCE
CAPITAL:
BankAtlantic’s Chief Executive Officer, Jarett S. Levan, commented, “BankAtlantic’s capital ratios improved from the prior quarter and exceeded all regulatory capital requirements applicable to it at September 30, 2011 with a Tier 1/Core Capital Ratio of 8.29% and a Total Risk Based Capital Ratio of 14.96%. Throughout the last several difficult years for the U.S. and Florida economy, BankAtlantic’s capital ratios never fell below its regulatory requirements. Historical capital ratios at BankAtlantic were:
| 12/2006 | 12/2007 | 12/2008 | 12/2009 | 12/2010 | 6/2011 | 9/2011 | ||||||||||||||||||||||
Tier 1/Core | 7.55 | % | 6.94 | % | 6.80 | % | 7.58 | % | 6.22 | % | 8.24 | % | 8.29 | % | ||||||||||||||
Tier 1 Risk-Based | 10.50 | % | 9.85 | % | 9.80 | % | 10.63 | % | 9.68 | % | 12.38 | % | 12.77 | % | ||||||||||||||
Total Risk-Based | 12.08 | % | 11.63 | % | 11.63 | % | 12.56 | % | 11.72 | % | 14.52 | % | 14.96 | % | ||||||||||||||
CREDIT:
“We are encouraged by recent credit trends, including:
| • | “Total non-accrual loans were $315.2 million at September 30, 2011, flat from $315.7 million at June 30, 2011, and a decrease of $88.9 million or 22% as compared to September 30, 2010. New non-accrual loans in the third quarter of 2011 totaled $37.8 million as compared to $33.1 million in the second quarter of 2011 and $88.0 million in the third quarter of 2010. |
| • | “New non-accrual commercial real estate loans in the third quarter of 2011 totaled $22.1 million (including one $20.0 million loan which continued to pay as agreed) as compared to $12.2 million in the second quarter of 2011 and $65.2 million in the third quarter of 2010. |
| • | “At September 30, 2011, approximately $96.5 million of commercial real estate and commercial business non-accrual loans (representing 46.4% of those categories’ |
2
aggregate non-accrual loans and 30.6% of total non-accrual loans) were impaired but continued to be current and paying pursuant to the terms of the loan agreements. |
| • | “Delinquencies excluding non-accrual loans were $33.0 million or 1.22% of total loans at September 30, 2011, as compared to $27.8 million or 0.99% of total loans at June 30, 2011, and $47.2 million or 1.39% of total loans at September 30, 2010. |
| • | “Net charge-offs were $24.2 million in the third quarter of 2011, compared to $26.6 million in the second quarter of 2011, and $21.9 million in the third quarter of 2010. Included in the third quarter 2011 net charge-offs was $7.5 million related to the factoring joint venture that has ceased operations. The prior comparative quarters only had $0.1 million of charge-offs related to this joint venture. |
| • | “BankAtlantic’s allowance for loan losses was $130.6 million at September 30, 2011. The allowance coverage to total loans was 4.89% at September 30, 2011, compared to 4.92% at June 30, 2011 and 5.34% at September 30, 2010. |
| • | “The provision for loan losses in the third quarter of 2011 was $17.8 million, compared to $10.2 million in the second quarter of 2011 and $23.0 million in the third quarter of 2010. Excluding the $7.5 million joint venture charge-off noted previously, the third quarter 2011 provision would have been $10.3 million, similar to the second quarter 2011 charge-off level. |
CORE EARNINGS:
| • | Results of Operations –“BankAtlantic’s net loss was ($7.8) million for the third quarter of 2011, compared to a net loss of ($17.9) million for the third quarter of 2010. |
| • | “Pretax core operating earnings(1) for the third quarter of 2011 were $11.4 million, compared to $13.9 million for the third quarter of 2010. |
| • | “BankAtlantic completed its sale of its Tampa branches and related deposits to PNC Bank in June 2011, and accordingly, the balances and operating results related to those branches are not included in the third quarter 2011 financials. As the Tampa |
| (1) | Pre-tax core operating earnings is a non-GAAP measure that we use to refer to pre-tax earnings before provision for loan losses, tax certificate provisions, debt redemption costs, gains/losses on sales of real estate, and impairments, restructuring and exit activities. A reconciliation of loss from bank operations before income taxes to pre-tax core operating earnings is included in BankAtlantic Bancorp’s Third Quarter, 2011 Supplemental Financials available at www.BankAtlanticBancorp.com. To view the financial data, access the “Investor Relations” section and click on the “Quarterly Financials or Supplemental Financials” navigation links. |
3
branches were not reflected in BankAtlantic’s financials as a separate operating segment, comparative financial information is not available. |
DEPOSITS:
“BankAtlantic’s deposit base, the foundation of its franchise, remains strong, with customer deposits representing over 99% of BankAtlantic’s funding at September 30, 2011. Core deposits(2) and total deposits at September 30, 2011 were $2.5 billion and $3.3 billion, respectively. During the third quarter of 2011:
| • | “Core and total deposits decreased by $109.3 million and $103.8 million, respectively, from June 30, 2011, which we believe reflects seasonality in BankAtlantic’s deposits. Non-CD balances represented approximately 88% of total deposits at September 30, 2011, up from 87% at June 30, 2011. |
| • | “The average cost of core deposits and total deposits for the third quarter of 2011 was 0.20% and 0.37%, respectively, comparing favorably to the publicly traded Florida Bank and Thrift median cost of deposits of 1.07% as of June 30, 2011. |
| • | “Brokered deposit balances were $6.0 million. |
| • | “BankAtlantic had no outstanding borrowings from the FHLB at September 30, 2011, and our available liquidity, which includes cash, unpledged securities and unused FHLB borrowing capacity remained robust at September 30, 2011, at 37.1% of deposits versus 33.7% of deposits at June 30, 2011. |
Net Interest Income and Margin– “Net interest income for the third quarter of 2011 was $30.1 million, compared to $39.1 million for the third quarter of 2010. The reduction in the current quarter net interest income versus the prior year quarter primarily reflected the impact of decreases in earning assets and increases in cash and lower-yielding investments.
| • | “Net interest margin during the third quarter of 2011 was 3.43% as compared to 3.70% during the third quarter of 2010. |
| • | “Net interest spread during the third quarter of 2011 was 3.28% as compared to 3.54% during the third quarter of 2010. |
| (2) | Core deposits is a term that we use to refer to Demand, NOW and Savings accounts. A reconciliation of core deposits to total deposits is included in BankAtlantic Bancorp’s Third Quarter, 2011 Supplemental Financials available at www.BankAtlanticBancorp.com. To view the financial data, access the “Investor Relations” section and click on the “Quarterly Financials or Supplemental Financials” navigation links. |
4
| • | “The cost of interest bearing liabilities during the third quarter of 2011 was 0.53%, an improvement from 0.65% in the third quarter of 2010. |
| • | “The yield on total loans (including nonperforming loans) during the third quarter of 2011 was 4.34%, down slightly from 4.39% in the third quarter of 2010. |
| • | “Investments averaged $727.6 million during the third quarter of 2011 with a yield of 1.80%, as compared to an average of $748.3 million during the third quarter of 2010 with a yield of 3.22%. The yield was impacted by the increase in excess cash invested. During the third quarter of 2011, average invested excess cash was $393.3 million, earning an average yield of 25 basis points, compared to $199.8 million in average invested excess cash during the third quarter of 2010 earning an average yield of 25 basis points. |
| • | “Other average balance sheet activity impacting net interest income included: |
| • | “Average earning assets of $3.5 billion for the third quarter of 2011 were $715.4 million less than average earning assets for the third quarter of 2010, reflecting a decline in average loans of $694.7 million due primarily to routine paydowns and net charge-offs. |
| • | “Nonperforming assets decreased by $63.9 million from September 30, 2010 to September 30, 2011. |
Non-interest income –“Total non-interest income for the third quarter of 2011 was $25.3 million, down from $27.0 million in the third quarter of 2010, primarily reflecting declines in service charges relating to lower levels of customer non-sufficient funds activity and the impact of the sale of BankAtlantic’s Tampa branches and related deposits in June 2011. Non-interest income for the third quarter of 2011includes a $7.0 million gain on the sale of securities.
Non-interest expense–“Total non-interest expenses were $45.9 million in the third quarter of 2011 compared to $60.8 million in the third quarter of 2010. Core expenses(3) were $44.1 million in the third quarter of 2011, compared to core expenses of $52.2 million in the third quarter of 2010, reflecting the impact of the sale of BankAtlantic’s Tampa branches in June
| (3) | Core expense is a non-GAAP measure that we use to refer to total non-interest expenses excluding tax certificate provisions, debt redemption costs, gains/losses on sales of real estate, impairments, restructuring and exit activities. A reconciliation of total expense to core expense is included in BankAtlantic Bancorp’s Third Quarter, 2011 Supplemental Financials available at www.BankAtlanticBancorp.com. To view the financial data, access the “Investor Relations” section and click on the “Quarterly Financials or Supplemental Financials” navigation links. |
5
2011 and a continued focus on expense management. Significant changes include a $5.9 million decrease in employee compensation and benefits due to lower staffing levels, and a $3.2 million decrease in occupancy and equipment expense. These were partially offset by a $2.1 million increase in professional fees in the third quarter of 2011 due primarily to a $2.7 million settlement of tax certificate litigation.
“Expenses not included in ‘core expenses’ consisted of the following:
| • | “Impairment, restructuring and exit activitiesof $2.8 million in the third quarter of 2011, versus $8.1 million in the third quarter of 2010. The charges in the third quarter of 2011 included: |
| • | Charges totaling $3.0 million related to write-downs of real estate owned. |
| • | Lower of cost or market adjustments on loans held for sale of $145,000. |
| • | “Tax certificate provisionof $1.0 million in the third quarter of 2011, versus $0.9 million in the third quarter of 2010. |
| • | “Gain on sale of real estate of $2.0 million in the third quarter of 2011, versus $0.4 million in the third quarter of 2010.” |
BANKATLANTIC BANCORP (Parent Company only):
Alan B. Levan further commented, “BankAtlantic Bancorp’s (Parent Company only) net loss was ($3.7) million for the third quarter of 2011, compared to a net loss of ($7.5) million for the third quarter of 2010. The third quarter of 2011 included a loan provision of $147,000 as compared to a loan provision of $1.4 million in the third quarter of 2010.
“Additionally, as first announced in the first quarter of 2009, we continue to defer the regularly scheduled interest payments on the outstanding junior subordinated debentures relating to all of our trust preferred securities, which is permitted under the terms of the securities for up to another 10 consecutive quarterly periods. Total deferred interest amounted to $39.1 million at September 30, 2011. As previously announced, we anticipate the payment of the outstanding deferred interest on these trust preferred securities in connection with the consummation of the BB&T transaction.
Asset Workout Subsidiary– “The loans and real estate owned held by BankAtlantic Bancorp’s workout subsidiary at September 30, 2011 included real estate owned of $9.4 million, performing loans of $2.5 million and non-accrual loans of $9.4 million,” concluded Alan Levan.
6
Supplemental graphs for BankAtlantic (bank only) are provided as a means to illustrate many of the metrics described above. To view the supplemental graphs, please visit our website at www.BankAtlanticBancorp.com, access the “Investor Relations” section and click on the “Supplemental Graphs” navigation link or visit
http://www.snl.com/IRWebLinkX/file.aspx?FID=1001162010&IID=101666.
Additional detailed financial data for BankAtlantic (bank only), the Parent- BankAtlantic Bancorp, and consolidated BankAtlantic Bancorp are available atwww.BankAtlanticBancorp.com. To view the financial data, access the “Investor Relations” section and click on the “Quarterly Financials or Supplemental Financials” navigation links. Additionally, BankAtlantic’s financial information is provided quarterly to the OCC through Thrift Financial Reports, available to the public through the OCC and FDIC websites.
Additionally, copies of BankAtlantic Bancorp’s third quarter, 2011 financial results press release and financial data are available upon request via fax, email, or postal service mail. To request a copy, contact BankAtlantic Bancorp’s Investor Relations department using the contact information listed below.
About BankAtlantic Bancorp:
BankAtlantic Bancorp (NYSE: BBX) is a bank holding company and the parent company of BankAtlantic.
About BankAtlantic:
BankAtlantic, Florida’s Most Convenient Bank, is one of the largest financial institutions headquartered in Florida. Via its broad network of community branches and conveniently located ATMs, BankAtlantic provides a full line of personal, small business and commercial banking products and services. BankAtlantic is open 7 days a week and offers extended weekday hours, Online Banking & Bill Pay, a 7-Day Customer Service Center, Change Exchange coin counters, as well as retail and business checking accounts. Member FDIC.
For further information, please visit our websites:
www.BankAtlanticBancorp.com
www.BankAtlantic.com
To receive future BankAtlantic Bancorp news releases or announcements directly via Email, please click on the Email Broadcast Sign Up button on our website:www.BankAtlanticBancorp.com.
BankAtlantic Bancorp, Inc. Contact Info:
Leo Hinkley, Investor and Corporate Communications Officer: 954- 940-5300
InvestorRelations@BankAtlanticBancorp.com
Sharon Lyn, V.P., Investor and Corporate Communications: 954-940-6383
7
CorpComm@BankAtlanticBancorp.com
BankAtlantic Media Contact:
Caren Berg, Boardroom Communications
(954) 370-8999
cberg@boardroompr.com
# # #
This press release contains forward-looking statements based on current expectations that involve a number of risks and uncertainties. All opinions, forecasts, projections, future plans or other statements, other than statements of historical fact, are forward-looking statements and include words or phrases such as “believes,” “will,” “expects,” “anticipates,” “intends,” “estimates,” “our view,” “we see,” “would” and words and phrases of similar import. The forward looking statements in this press release are also forward-looking statements within the meaning of Section 27A of the Securities Act of 1933, as amended (the “Securities Act”), and Section 21E of the Securities Exchange Act of 1934, as amended (the “Exchange Act”), and involve substantial risks and uncertainties. We can give no assurance that such expectations will prove to have been correct. Actual results could differ materially as a result of a variety of risks and uncertainties, many of which are outside of the control of management. These risks and uncertainties include, but are not limited to the impact of economic, competitive and other factors affecting BankAtlantic Bancorp (the “Company”) and its operations, markets, products and services, including the impact of the changing regulatory environment, a continued or deepening recession, continued decreases in real estate values, and increased unemployment or sustained high unemployment rates on our business generally, BankAtlantic’s regulatory capital ratios, the ability of our borrowers to service their obligations and of our customers to maintain account balances and the value of collateral securing our loans; credit risks and loan losses, and the related sufficiency of the allowance for loan losses, including the impact of the economy and real estate market values on the credit quality of our loans (including those held in the asset workout subsidiary of the Company); the risk that loan losses have not peaked and risks of additional charge-offs, impairments and required increases in our allowance for loan losses; the impact of regulatory proceedings and litigation including but not limited to proceedings and litigation relating to overdraft fees; risks associated with maintaining compliance with the Cease and Desist Orders entered into by the Company and BankAtlantic, including risks that BankAtlantic will not maintain required capital levels, that compliance will adversely impact operations, and that failing to comply with regulatory mandates will result in the imposition of additional regulatory requirements and/or fines; changes in interest rates and the effects of, and changes in, trade, monetary and fiscal policies and laws including their impact on the bank’s net interest margin; adverse conditions in the stock market, the public debt market and other financial and credit markets and the impact of such conditions on our activities and our ability to raise capital; and the risks associated with the impact of periodic valuation testing of goodwill, deferred tax assets and other assets. Past performance and perceived trends may not be indicative of future results. In addition, this press release contains forward looking statements relating to an agreement between the Company and BB&T Corporation to sell BankAtlantic, which are subject to risks and uncertainties including, but not limited to the risk that a transaction between BB&T and BankAtlantic Bancorp may not be completed on a timely basis, on anticipated terms, or at all; BankAtlantic Bancorp’s and/or BankAtlantic’s business or net asset values may be negatively affected by the pendency of the proposed transaction or otherwise; that regulatory approvals may not be received; that the transaction may not be as advantageous to BankAtlantic Bancorp as expected;. In addition to the risks and factors identified above, reference is also made to other risks and factors detailed in reports filed by the Company with the Securities and Exchange Commission, including the Company’s Annual Report on Form 10-K for the year ended December 31, 2010, and the Quarterly Report on Form 10-Q for the quarter ended June 30, 2011. The Company cautions that the foregoing factors are not exclusive.
8

Supplemental Financial Information
Third Quarter 2011
Release Date: November 2, 2011
This information is preliminary, unaudited and based on data available at the time of the release.
Table of Contents | Page | |||
Consolidated BankAtlantic Bancorp, Inc. and Subsidiaries | ||||
Summary of Selected Financial Data (unaudited) | 2 | |||
Consolidated Statement of Financial Condition (unaudited) | 3 | |||
Consolidated Statements of Operations (unaudited) | 4 | |||
Consolidated Average Balance Sheet (unaudited) | 5 | |||
Nonperforming Assets and Credit Quality Statistics | 6 | |||
Reconciliation of GAAP Financial Measures to Non-GAAP Measures | 7 | |||
BankAtlantic (Bank Operations Business Segment) | ||||
Summary of Selected Financial Data (unaudited) | 8 | |||
Condensed Statements of Operations (unaudited) | 9 | |||
Condensed Statements of Financial Condition (unaudited) | 10 | |||
Quarterly Average Balance Sheet – Yield/Rate Analysis | 11 | |||
Year-to-Date Average Balance Sheet – Yield/Rate Analysis | 12 | |||
Allowance for Loan Loss and Credit Quality | 13 | |||
Delinquencies, Excluding Non-Accrual Loans, at Period-End | 14 | |||
Loan Provision and Allowance for Loan Losses by Portfolio | 14 | |||
Reconciliation of GAAP Financial Measures to Non-GAAP Measures | 15 | |||
Parent Company Business Segment | ||||
Condensed Statements of Operations (unaudited) | 16 | |||
Condensed Statements of Financial Condition (unaudited) | 16 | |||
Allowance for Loan Loss and Credit Quality | 16 | |||
1
BankAtlantic Bancorp, Inc. and Subsidiaries
Summary of Selected Financial Data (unaudited)
| For the Three Months Ended | For the Nine Months Ended | |||||||||||||||||||||||||||||||
| 9/30/2011 | 6/30/2011 | 3/31/2011 | 12/31/2010 | 9/30/2010 | 9/30/2011 | 9/30/2010 | ||||||||||||||||||||||||||
Earnings (in thousands): | ||||||||||||||||||||||||||||||||
Net income (loss) from continuing operations | $ | (11,794 | ) | 23,401 | (22,887 | ) | (45,795 | ) | (25,184 | ) | (11,280 | ) | (96,955 | ) | ||||||||||||||||||
Net income (loss) | $ | (11,794 | ) | 23,401 | (22,887 | ) | (46,295 | ) | (25,184 | ) | (11,280 | ) | (96,955 | ) | ||||||||||||||||||
Net income (loss) attributable to BankAtlantic Bancorp | $ | (11,540 | )�� | 23,111 | (23,182 | ) | (46,554 | ) | (25,409 | ) | (11,611 | ) | (97,627 | ) | ||||||||||||||||||
Pre-tax core operating earnings – Non-GAAP | (note 1 | ) | $ | 8,286 | 5,295 | 7,210 | 4,269 | 7,871 | 20,791 | 22,901 | ||||||||||||||||||||||
Average Common Shares Outstanding (in thousands): | ||||||||||||||||||||||||||||||||
Basic | 15,627 | 13,059 | 12,545 | 12,514 | 12,157 | 13,755 | 10,713 | |||||||||||||||||||||||||
Diluted | 15,627 | 13,059 | 12,545 | 12,514 | 12,157 | 13,755 | 10,713 | |||||||||||||||||||||||||
Key Performance Ratios | ||||||||||||||||||||||||||||||||
Basic and diluted income (loss) per share from continuing operations | (note 2 | ) | $ | (0.74 | ) | 1.77 | (1.85 | ) | (3.68 | ) | (2.09 | ) | (0.84 | ) | (9.11 | ) | ||||||||||||||||
Basic and diluted income (loss) per share | (note 2 | ) | $ | (0.74 | ) | 1.77 | (1.85 | ) | (3.72 | ) | (2.09 | ) | (0.84 | ) | (9.11 | ) | ||||||||||||||||
Return on average tangible assets from continuing operations | (note 3 | ) | % | (1.24 | ) | 2.18 | (2.02 | ) | (4.06 | ) | (2.22 | ) | (0.36 | ) | (2.80 | ) | ||||||||||||||||
Return on average tangible equity from continuing operations | (note 3 | ) | % | (262.69 | ) | (4,557.16 | ) | (1,152.71 | ) | (356.19 | ) | (138.75 | ) | (188.35 | ) | (127.22 | ) | |||||||||||||||
Average Balance Sheet Data (in millions): | ||||||||||||||||||||||||||||||||
Assets | $ | 3,812 | 4,317 | 4,550 | 4,530 | 4,548 | 4,224 | 4,635 | ||||||||||||||||||||||||
Tangible assets – Non-GAAP | (note 3 | ) | $ | 3,798 | 4,303 | 4,536 | 4,515 | 4,533 | 4,210 | 4,620 | ||||||||||||||||||||||
Loans, gross | $ | 2,803 | 2,956 | 3,123 | 3,360 | 3,513 | 2,960 | 3,645 | ||||||||||||||||||||||||
Investments | $ | 728 | 1,046 | 1,118 | 883 | 748 | 963 | 667 | ||||||||||||||||||||||||
Deposits and escrows | $ | 3,386 | 3,859 | 3,980 | 3,900 | 3,931 | 3,740 | 4,008 | ||||||||||||||||||||||||
Equity | $ | 26 | 6 | 16 | 63 | 85 | 16 | 115 | ||||||||||||||||||||||||
Tangible equity – Non-GAAP | (note 3 | ) | $ | 18 | (2 | ) | 8 | 51 | 73 | 8 | 102 | |||||||||||||||||||||
Period End ($ in thousands) | ||||||||||||||||||||||||||||||||
Loans receivable, net | $ | 2,545,143 | 2,666,847 | 2,821,429 | 3,018,179 | 3,239,542 | ||||||||||||||||||||||||||
Total assets | $ | 3,740,654 | 3,863,864 | 4,470,629 | 4,509,433 | 4,527,736 | ||||||||||||||||||||||||||
Total equity | $ | 7,121 | 26,235 | (8,729 | ) | 14,744 | 64,082 | |||||||||||||||||||||||||
Class A common shares outstanding | 15,431,699 | 15,431,699 | 12,395,814 | 12,319,064 | 12,319,064 | |||||||||||||||||||||||||||
Class B common shares outstanding | 195,045 | 195,045 | 195,045 | 195,045 | 195,045 | |||||||||||||||||||||||||||
Book value per share | $ | 0.46 | 1.68 | (0.69 | ) | 1.18 | 5.12 | |||||||||||||||||||||||||
Tangible book value per share – Non-GAAP | (note 4 | ) | $ | 0.46 | 1.19 | (1.29 | ) | 0.50 | 4.19 | |||||||||||||||||||||||
High stock price for the quarter | $ | 5.90 | 5.15 | 6.65 | 7.95 | 9.25 | ||||||||||||||||||||||||||
Low stock price for the quarter | $ | 3.00 | 3.45 | 4.10 | 3.00 | 3.75 | ||||||||||||||||||||||||||
Closing stock price | $ | 3.10 | 4.75 | 4.60 | 5.75 | 4.00 | ||||||||||||||||||||||||||
Notes:
| (1) | Pre-tax core operating earnings excludes the gain on sale of Tampa branches, provision for loan losses, cost associated with debt redemption, provision for tax certificates, gains/losses on sales of real estate and impairments, restructuring and exit activities. Pre-tax core operating earnings is a non-GAAP measure. |
| See page 7 for a reconciliation of non-GAAP measures to GAAP financial measures. |
| (2) | Diluted and basic loss per share are the same for all periods presented. |
| (3) | Average tangible assets is defined as average total assets less average goodwill and core deposit intangibles. |
| Average tangible equity is defined as average total equity less average goodwill, core deposit intangibles and other comprehensive income. Average tangible assets and average tangible equity are non-GAAP measures. See page 7 for a reconciliation of non-GAAP measures to GAAP financial measures. |
| (4) | Tangible book value per share is defined as equity less accumulated other comprehensive loss, goodwill and core deposit intangibles divided by the number of common shares outstanding. Tangible book value per share is a non-GAAP measure. |
| See page 7 for a reconciliation of non-GAAP measures to GAAP financial measures. |
2
BankAtlantic Bancorp, Inc. and Subsidiaries
Consolidated Statements of Financial Condition (unaudited)
| (in thousands) | September 30, 2011 | December 31, 2010 | ||||||
ASSETS | ||||||||
Cash and due from depository institutions | $ | 99,612 | 97,930 | |||||
Interest bearing deposits at federal reserve and other banks | 574,398 | 455,538 | ||||||
Securities available for sale and derivatives (at fair value) | 84,487 | 424,391 | ||||||
Investment securities | — | 1,500 | ||||||
Tax certificates, net of allowance of $7,535 and $8,811 | 56,268 | 89,789 | ||||||
Loans receivable, net of allowance for loan losses of $130,719 and $162,139 | 2,545,143 | 3,018,179 | ||||||
Loans held for sale (at lower of cost or fair value) | 47,596 | 29,765 | ||||||
Federal Home Loan Bank stock, at cost which approximates fair value | 25,223 | 43,557 | ||||||
Real estate held for sale | 4,145 | 5,436 | ||||||
Real estate owned | 92,751 | 74,488 | ||||||
Office properties and equipment, net | 144,359 | 151,414 | ||||||
Goodwill and other intangible assets | 13,670 | 14,569 | ||||||
Assets held for sale | — | 37,334 | ||||||
Other assets | 53,002 | 65,543 | ||||||
|
|
|
| |||||
Total assets | $ | 3,740,654 | 4,509,433 | |||||
|
|
|
| |||||
LIABILITIES AND EQUITY | ||||||||
Liabilities: | ||||||||
Deposits | ||||||||
Demand | $ | 857,582 | 792,260 | |||||
Savings | 439,051 | 418,304 | ||||||
NOW | 1,166,615 | 1,370,568 | ||||||
Money market | 449,800 | 354,282 | ||||||
Certificates of deposit | 409,167 | 616,454 | ||||||
Deposits held for sale | — | 341,146 | ||||||
|
|
|
| |||||
Total deposits | 3,322,215 | 3,893,014 | ||||||
Advances from FHLB | — | 170,000 | ||||||
Securities sold under agreements to repurchase | — | 21,524 | ||||||
Short term borrowings | 960 | 1,240 | ||||||
Subordinated debentures | 22,000 | 22,000 | ||||||
Junior subordinated debentures | 333,333 | 322,385 | ||||||
Liabilities held for sale | — | 87 | ||||||
Other liabilities | 55,025 | 64,440 | ||||||
|
|
|
| |||||
Total liabilities | 3,733,533 | 4,494,690 | ||||||
|
|
|
| |||||
Equity: | ||||||||
Common stock | 156 | 125 | ||||||
Additional paid-in capital | 329,790 | 317,863 | ||||||
Accumulated deficit | (309,226 | ) | (297,615 | ) | ||||
Accumulated other comprehensive loss | (13,664 | ) | (6,088 | ) | ||||
|
|
|
| |||||
Total BankAtlantic Bancorp stockholders’ equity | 7,056 | 14,285 | ||||||
Noncontrolling interests | 65 | 458 | ||||||
|
|
|
| |||||
Total equity | 7,121 | 14,743 | ||||||
|
|
|
| |||||
Total liabilities and equity | $ | 3,740,654 | 4,509,433 | |||||
|
|
|
| |||||
3
BankAtlantic Bancorp, Inc. and Subsidiaries
Consolidated Statements of Operations (unaudited)
| For the Three Months Ended | For the Nine Months Ended | |||||||||||||||||||||||||||
| (in thousands) | 9/30/2011 | 6/30/2011 | 3/31/2011 | 12/31/2010 | 9/30/2010 | 9/30/2011 | 9/30/2010 | |||||||||||||||||||||
INTEREST INCOME: | ||||||||||||||||||||||||||||
Interest and fees on loans | $ | 30,313 | 33,241 | 34,910 | 36,106 | 38,356 | 98,464 | 119,888 | ||||||||||||||||||||
Interest on securities available for sale | 1,916 | 2,374 | 2,597 | 2,815 | 2,847 | 6,887 | 9,206 | |||||||||||||||||||||
Interest on tax certificates | 1,027 | 1,043 | 1,410 | 1,544 | 2,837 | 3,480 | 5,707 | |||||||||||||||||||||
Interest and dividends on investments | 326 | 622 | 588 | 299 | 367 | 1,536 | 743 | |||||||||||||||||||||
|
|
|
|
|
|
|
|
|
|
|
|
|
| |||||||||||||||
Total interest income | 33,582 | 37,280 | 39,505 | 40,764 | 44,407 | 110,367 | 135,544 | |||||||||||||||||||||
|
|
|
|
|
|
|
|
|
|
|
|
|
| |||||||||||||||
INTEREST EXPENSE: | ||||||||||||||||||||||||||||
Interest on deposits | 3,174 | 3,975 | 4,367 | 4,556 | 4,877 | 11,516 | 17,955 | |||||||||||||||||||||
Interest on advances from FHLB | — | 38 | 115 | 144 | 106 | 153 | 1,065 | |||||||||||||||||||||
Interest on short-term borrowed funds | — | 3 | 6 | 7 | 8 | 9 | 23 | |||||||||||||||||||||
Interest on debentures | 4,127 | 4,080 | 4,008 | 4,007 | 4,107 | 12,215 | 11,789 | |||||||||||||||||||||
|
|
|
|
|
|
|
|
|
|
|
|
|
| |||||||||||||||
Total interest expense | 7,301 | 8,096 | 8,496 | 8,714 | 9,098 | 23,893 | 30,832 | |||||||||||||||||||||
|
|
|
|
|
|
|
|
|
|
|
|
|
| |||||||||||||||
NET INTEREST INCOME | 26,281 | 29,184 | 31,009 | 32,050 | 35,309 | 86,474 | 104,712 | |||||||||||||||||||||
Provision for loan losses | 17,901 | 10,709 | 27,812 | 40,643 | 24,410 | 56,422 | 103,718 | |||||||||||||||||||||
|
|
|
|
|
|
|
|
|
|
|
|
|
| |||||||||||||||
NET INTEREST INCOME AFTER PROVISION | 8,380 | 18,475 | 3,197 | (8,593 | ) | 10,899 | 30,052 | 994 | ||||||||||||||||||||
|
|
|
|
|
|
|
|
|
|
|
|
|
| |||||||||||||||
NON-INTEREST INCOME: | ||||||||||||||||||||||||||||
Service charges on deposits | 10,165 | 11,226 | 12,032 | 14,080 | 15,214 | 33,423 | 45,764 | |||||||||||||||||||||
Other service charges and fees | 6,129 | 6,886 | 7,191 | 7,528 | 7,495 | 20,206 | 22,612 | |||||||||||||||||||||
Securities activities, net | 6,959 | (1,500 | ) | (24 | ) | (34 | ) | (552 | ) | 5,435 | 2,898 | |||||||||||||||||
(Loss) gain on sale of Tampa branches | (34 | ) | 38,656 | — | — | — | 38,622 | — | ||||||||||||||||||||
Other | 2,618 | 3,742 | 4,008 | 3,091 | 5,204 | 10,368 | 11,074 | |||||||||||||||||||||
|
|
|
|
|
|
|
|
|
|
|
|
|
| |||||||||||||||
Total non-interest income | 25,837 | 59,010 | 23,207 | 24,665 | 27,361 | 108,054 | 82,348 | |||||||||||||||||||||
|
|
|
|
|
|
|
|
|
|
|
|
|
| |||||||||||||||
NON-INTEREST EXPENSE: | ||||||||||||||||||||||||||||
Employee compensation and benefits | 17,116 | 19,731 | 19,290 | 19,868 | 23,549 | 56,137 | 74,082 | |||||||||||||||||||||
Occupancy and equipment | 10,019 | 11,488 | 12,585 | 12,999 | 13,263 | 34,092 | 40,590 | |||||||||||||||||||||
Advertising and business promotion | 1,587 | 1,523 | 1,695 | 2,389 | 2,026 | 4,805 | 6,209 | |||||||||||||||||||||
Professional fees | 6,230 | 1,295 | 3,359 | 6,518 | 6,209 | 10,884 | 13,920 | |||||||||||||||||||||
Check losses | 559 | 663 | 299 | 705 | 763 | 1,521 | 1,716 | |||||||||||||||||||||
Supplies and postage | 758 | 955 | 902 | 1,052 | 983 | 2,615 | 2,902 | |||||||||||||||||||||
Telecommunication | 388 | 446 | 575 | 635 | 702 | 1,409 | 1,898 | |||||||||||||||||||||
Cost associated with debt redemption | — | 1,115 | 10 | — | — | 1,125 | 60 | |||||||||||||||||||||
Provision for tax certificates | 969 | 1,021 | 779 | 800 | 885 | 2,769 | 3,752 | |||||||||||||||||||||
(Gain) loss on sale of real estate | (2,023 | ) | (378 | ) | (453 | ) | 663 | (442 | ) | (2,854 | ) | 944 | ||||||||||||||||
Impairment, restructuring and exit activities | 3,321 | 8,083 | 1,948 | 10,219 | 8,165 | 13,352 | 11,255 | |||||||||||||||||||||
Other | 7,209 | 8,142 | 8,301 | 8,280 | 7,304 | 23,652 | 22,842 | |||||||||||||||||||||
|
|
|
|
|
|
|
|
|
|
|
|
|
| |||||||||||||||
Total non-interest expense | 46,133 | 54,084 | 49,290 | 64,128 | 63,407 | 149,507 | 180,170 | |||||||||||||||||||||
|
|
|
|
|
|
|
|
|
|
|
|
|
| |||||||||||||||
Loss (income) from continuing operationsbefore income taxes | (11,916 | ) | 23,401 | (22,886 | ) | (48,056 | ) | (25,147 | ) | (11,401 | ) | (96,828 | ) | |||||||||||||||
(Benefit) provision for income taxes | (122 | ) | — | 1 | (2,261 | ) | 37 | (121 | ) | 127 | ||||||||||||||||||
|
|
|
|
|
|
|
|
|
|
|
|
|
| |||||||||||||||
Income (loss) from continuing operations | (11,794 | ) | 23,401 | (22,887 | ) | (45,795 | ) | (25,184 | ) | (11,280 | ) | (96,955 | ) | |||||||||||||||
Discontinued operations | — | — | — | (500 | ) | — | — | — | ||||||||||||||||||||
|
|
|
|
|
|
|
|
|
|
|
|
|
| |||||||||||||||
Net (loss) income | (11,794 | ) | 23,401 | (22,887 | ) | (46,295 | ) | (25,184 | ) | (11,280 | ) | (96,955 | ) | |||||||||||||||
Less: net loss (income) attributable to noncontrolling interest | 254 | (290 | ) | (295 | ) | (259 | ) | (225 | ) | (331 | ) | (672 | ) | |||||||||||||||
|
|
|
|
|
|
|
|
|
|
|
|
|
| |||||||||||||||
Net (loss) income attributable to BankAtlantic Bancorp | $ | (11,540 | ) | 23,111 | (23,182 | ) | (46,554 | ) | (25,409 | ) | (11,611 | ) | (97,627 | ) | ||||||||||||||
|
|
|
|
|
|
|
|
|
|
|
|
|
| |||||||||||||||
4
BankAtlantic Bancorp, Inc. and Subsidiaries
Consolidated Average Balance Sheet (unaudited)
| For the Three Months Ended | ||||||||||||||||||||||||
| (in thousands except percentages and per share data) | 9/30/2011 | 6/30/2011 | 3/31/2011 | 12/31/2010 | 9/30/2010 | |||||||||||||||||||
Loans: | ||||||||||||||||||||||||
Residential real estate | $ | 1,038,201 | 1,093,487 | 1,175,875 | 1,270,095 | 1,356,748 | ||||||||||||||||||
Commercial real estate | 762,270 | 834,114 | 891,043 | 1,010,148 | 1,061,918 | |||||||||||||||||||
Consumer | 588,257 | 605,062 | 620,986 | 635,564 | 653,631 | |||||||||||||||||||
Commercial business | 124,508 | 125,116 | 134,452 | 139,485 | 133,841 | |||||||||||||||||||
Small business | 289,845 | 298,338 | 300,931 | 304,406 | 306,927 | |||||||||||||||||||
|
|
|
|
|
|
|
|
|
| |||||||||||||||
Total Loans | 2,803,081 | 2,956,117 | 3,123,287 | 3,359,698 | 3,513,065 | |||||||||||||||||||
Investments | 727,588 | 1,046,442 | 1,117,901 | 882,974 | 748,299 | |||||||||||||||||||
|
|
|
|
|
|
|
|
|
| |||||||||||||||
Total interest earning assets | 3,530,669 | 4,002,559 | 4,241,188 | 4,242,672 | 4,261,364 | |||||||||||||||||||
Goodwill and core deposit intangibles | 13,815 | 14,125 | 14,411 | 14,718 | 15,028 | |||||||||||||||||||
Other non-interest earning assets | 267,171 | 300,615 | 294,489 | 272,805 | 271,950 | |||||||||||||||||||
|
|
|
|
|
|
|
|
|
| |||||||||||||||
Total assets | $ | 3,811,655 | 4,317,299 | 4,550,088 | 4,530,195 | 4,548,342 | ||||||||||||||||||
|
|
|
|
|
|
|
|
|
| |||||||||||||||
Tangible assets – Non-GAAP | (note 3 | ) | $ | 3,797,840 | 4,303,174 | 4,535,677 | 4,515,477 | 4,533,314 | ||||||||||||||||
|
|
|
|
|
|
|
|
|
| |||||||||||||||
Deposits: | ||||||||||||||||||||||||
Demand deposits | $ | 881,776 | 952,411 | 944,956 | 924,035 | 907,294 | ||||||||||||||||||
Savings | 445,273 | 478,628 | 468,673 | 448,942 | 444,981 | |||||||||||||||||||
NOW | 1,206,452 | 1,412,720 | 1,519,105 | 1,476,258 | 1,484,558 | |||||||||||||||||||
Money market | 420,628 | 408,653 | 389,155 | 406,781 | 404,406 | |||||||||||||||||||
Certificates of deposit | 432,345 | 606,292 | 658,051 | 644,124 | 689,664 | |||||||||||||||||||
|
|
|
|
|
|
|
|
|
| |||||||||||||||
Total deposits | 3,386,474 | 3,858,704 | 3,979,940 | 3,900,140 | 3,930,903 | |||||||||||||||||||
Short-term borrowed funds | 1,050 | 10,868 | 19,191 | 18,099 | 26,187 | |||||||||||||||||||
FHLB advances | — | 42,747 | 134,833 | 149,130 | 106,685 | |||||||||||||||||||
Debentures | 352,213 | 348,540 | 344,971 | 341,409 | 340,230 | |||||||||||||||||||
|
|
|
|
|
|
|
|
|
| |||||||||||||||
Total borrowings | 353,263 | 402,155 | 498,995 | 508,638 | 473,102 | |||||||||||||||||||
Other liabilities | 46,370 | 50,635 | 55,040 | 58,015 | 59,207 | |||||||||||||||||||
|
|
|
|
|
|
|
|
|
| |||||||||||||||
Total liabilities | 3,786,107 | 4,311,494 | 4,533,975 | 4,466,793 | 4,463,212 | |||||||||||||||||||
|
|
|
|
|
|
|
|
|
| |||||||||||||||
Equity | 25,548 | 5,805 | 16,113 | 63,402 | 85,130 | |||||||||||||||||||
|
|
|
|
|
|
|
|
|
| |||||||||||||||
Total liabilities and equity | $ | 3,811,655 | 4,317,299 | 4,550,088 | 4,530,195 | 4,548,342 | ||||||||||||||||||
|
|
|
|
|
|
|
|
|
| |||||||||||||||
Other comprehensive loss in equity | (6,226 | ) | (6,266 | ) | (6,240 | ) | (2,743 | ) | (2,499 | ) | ||||||||||||||
|
|
|
|
|
|
|
|
|
| |||||||||||||||
Tangible equity – Non-GAAP | (note 3 | ) | $ | 17,959 | (2,054 | ) | 7,942 | 51,427 | 72,601 | |||||||||||||||
|
|
|
|
|
|
|
|
|
| |||||||||||||||
Net Interest Margin | 2.98 | % | 2.92 | % | 2.92 | % | 3.03 | % | 3.32 | % | ||||||||||||||
|
|
|
|
|
|
|
|
|
| |||||||||||||||
5
Consolidated BankAtlantic Bancorp, Inc. and Subsidiaries
Nonperforming Assets and Credit Quality Statistics
| (in thousands) | As of | |||||||||||||||||||
| 9/30/2011 | 6/30/2011 | 3/31/2011 | 12/31/2010 | 9/30/2010 | ||||||||||||||||
Nonaccrual loans: | ||||||||||||||||||||
BankAtlantic | $ | 315,214 | 315,748 | 362,604 | 370,959 | 404,087 | ||||||||||||||
Parent- Work out Sub | 9,356 | 9,360 | 11,360 | 14,508 | 19,916 | |||||||||||||||
|
|
|
|
|
|
|
|
|
| |||||||||||
Consolidated nonaccrual loans | $ | 324,570 | 325,108 | 373,964 | 385,467 | 424,003 | ||||||||||||||
|
|
|
|
|
|
|
|
|
| |||||||||||
Quarter-to-Date Net Charge-offs: | ||||||||||||||||||||
BankAtlantic | $ | (24,210 | ) | (26,564 | ) | (27,823 | ) | (57,688 | ) | (21,887 | ) | |||||||||
Parent- Work out Sub | 20 | (1,329 | ) | 4 | (3,741 | ) | (4,438 | ) | ||||||||||||
|
|
|
|
|
|
|
|
|
| |||||||||||
Consolidated charge-offs | $ | (24,190 | ) | (27,893 | ) | (27,819 | ) | (61,429 | ) | (26,325 | ) | |||||||||
|
|
|
|
|
|
|
|
|
| |||||||||||
Quarter-to-date Loan Provision: | ||||||||||||||||||||
BankAtlantic | $ | 17,754 | 10,195 | 27,832 | 40,144 | 23,012 | ||||||||||||||
Parent- Work out Sub | 147 | 515 | (20 | ) | 498 | 1,398 | ||||||||||||||
|
|
|
|
|
|
|
|
|
| |||||||||||
Consolidated loan provision | $ | 17,901 | 10,710 | 27,812 | 40,642 | 24,410 | ||||||||||||||
|
|
|
|
|
|
|
|
|
| |||||||||||
Allowance for Loan Loss: | ||||||||||||||||||||
BankAtlantic | $ | 130,552 | 137,643 | 154,237 | 161,309 | 181,760 | ||||||||||||||
Parent- Work out Sub | 167 | — | 814 | 830 | 4,187 | |||||||||||||||
|
|
|
|
|
|
|
|
|
| |||||||||||
Consolidated allowance for loan loss | $ | 130,719 | 137,643 | 155,051 | 162,139 | 185,947 | ||||||||||||||
|
|
|
|
|
|
|
|
|
| |||||||||||
Nonperforming Assets: | ||||||||||||||||||||
BankAtlantic | $ | 400,990 | 389,564 | 432,316 | 438,923 | 464,865 | ||||||||||||||
Parent- Work out Sub | 18,747 | 18,004 | 20,195 | 24,668 | 29,682 | |||||||||||||||
|
|
|
|
|
|
|
|
|
| |||||||||||
Consolidated nonperforming assets | $ | 419,737 | 407,568 | 452,511 | 463,591 | 494,547 | ||||||||||||||
|
|
|
|
|
|
|
|
|
| |||||||||||
Consolidated Credit Quality Statistics | ||||||||||||||||||||
Allowance for loan losses to total loans | % | 4.89 | 4.91 | 5.21 | 5.10 | 5.43 | ||||||||||||||
Allowance to nonaccrual loans | % | 40.27 | 42.34 | 41.46 | 42.06 | 43.86 | ||||||||||||||
Provision to average loans | % | 2.55 | 1.45 | 3.56 | 4.84 | 2.78 | ||||||||||||||
Nonaccrual loans, gross to total assets | % | 8.68 | 8.41 | 8.36 | 8.55 | 9.36 | ||||||||||||||
Nonperforming assets, gross to total assets | % | 11.22 | 10.55 | 10.12 | 10.28 | 10.92 | ||||||||||||||
6
BankAtlantic Bancorp, Inc. and Subsidiaries
Reconciliation of GAAP Financial Measures to Non-GAAP Measures
Management uses non-GAAP financial measures to supplement its GAAP financial information and to provide additional useful measures in the evaluation of the Company’s operating results and any related trends that may be affecting the Company’s business. Management uses pre-tax core operating earnings to measure the Company’s ongoing financial performance excluding items that are not currently controllable by management. Management uses book value per share and tangible book value per share to enable investors to compare these measures to the quoted market price of the Company’s Class A common stock and to other companies in the industry. The return on average tangible equity and average tangible assets is used by management to measure the Company’s effectiveness in its use of capital and assets, respectively, and to allow for comparison to other companies in the industry. These disclosures should not be viewed as a substitute for operating results determined in accordance with GAAP, nor are they necessarily comparable to non-GAAP performance measures that may be presented by other companies.
| Reconciliation of loss from continuing operations before income taxes to pre-tax core operating earnings | ||||||||||||||||||||||||||||
| For the Three Months Ended | For the Nine Months Ended | |||||||||||||||||||||||||||
| (in thousands) | 9/30/2011 | 6/30/2011 | 3/31/2011 | 12/31/2010 | 9/30/2010 | 9/30/2011 | 9/30/2010 | |||||||||||||||||||||
Income (loss) from continuing operationsbefore income taxes | $ | (11,916 | ) | 23,401 | (22,886 | ) | (48,056 | ) | (25,147 | ) | (11,401 | ) | (96,828 | ) | ||||||||||||||
Loss (gain) on sale of Tampa branches | 34 | (38,656 | ) | — | — | — | (38,622 | ) | — | |||||||||||||||||||
Costs associated with debt redemption | — | 1,115 | 10 | — | — | 1,125 | 60 | |||||||||||||||||||||
Provision for tax certificates | 969 | 1,021 | 779 | 800 | 885 | 2,769 | 3,752 | |||||||||||||||||||||
Loss (gain) on sale of real estate | (2,023 | ) | (378 | ) | (453 | ) | 663 | (442 | ) | (2,854 | ) | 944 | ||||||||||||||||
Impairment, restructuring and exit activities | 3,321 | 8,083 | 1,948 | 10,219 | 8,165 | 13,352 | 11,255 | |||||||||||||||||||||
Provision for loan losses | 17,901 | 10,709 | 27,812 | 40,643 | 24,410 | 56,422 | 103,718 | |||||||||||||||||||||
|
|
|
|
|
|
|
|
|
|
|
|
|
| |||||||||||||||
Non-GAAP pre-tax core operating earnings | $ | 8,286 | 5,295 | 7,210 | 4,269 | 7,871 | 20,791 | 22,901 | ||||||||||||||||||||
|
|
|
|
|
|
|
|
|
|
|
|
|
| |||||||||||||||
| 9/30/2010 | 9/30/2010 | 9/30/2010 | 9/30/2010 | 9/30/2010 | ||||||||||||||||
| Reconciliation of equity to tangible book value per share | ||||||||||||||||||||
| As of | ||||||||||||||||||||
| (in thousands) | 9/30/2011 | 6/30/2011 | 3/31/2011 | 12/31/2010 | 9/30/2010 | |||||||||||||||
Equity | $ | 7,121 | 26,235 | (8,729 | ) | 14,744 | 64,082 | |||||||||||||
Goodwill and core deposit intangibles | (13,670 | ) | (13,965 | ) | (14,260 | ) | (14,569 | ) | (14,877 | ) | ||||||||||
Other comprehensive loss | 13,664 | 6,346 | 6,807 | 6,088 | 3,207 | |||||||||||||||
|
|
|
|
|
|
|
|
|
| |||||||||||
Tangible book value | $ | 7,115 | 18,616 | (16,182 | ) | 6,263 | 52,412 | |||||||||||||
Common shares outstanding, period end | 15,626,744 | 15,626,744 | 12,590,859 | 12,514,109 | 12,514,109 | |||||||||||||||
Book value per share | $ | 0.46 | 1.68 | (0.69 | ) | 1.18 | 5.12 | |||||||||||||
|
|
|
|
|
|
|
|
|
| |||||||||||
Tangible book value per share – Non-GAAP | $ | 0.46 | 1.19 | (1.29 | ) | 0.50 | 4.19 | |||||||||||||
|
|
|
|
|
|
|
|
|
| |||||||||||
| Reconciliation of return on average assets and average equity to return on average tangible assets and average tangible equity | ||||||||||||||||||||||||||||
| For the Three Months Ended | For the Nine Months Ended | |||||||||||||||||||||||||||
| (in thousands) | 9/30/2011 | 6/30/2011 | 3/31/2011 | 12/31/2010 | 9/30/2010 | 9/30/2011 | 9/30/2010 | |||||||||||||||||||||
Net income (loss) from continuing operations | $ | (11,794 | ) | 23,401 | (22,887 | ) | (45,795 | ) | (25,184 | ) | (11,280 | ) | (96,955 | ) | ||||||||||||||
|
|
|
|
|
|
|
|
|
|
|
|
|
| |||||||||||||||
Average total assets | 3,811,655 | 4,317,299 | 4,550,088 | 4,530,195 | 4,548,342 | 4,223,642 | 4,635,217 | |||||||||||||||||||||
Average goodwill and core deposit intangibles | (13,815 | ) | (14,125 | ) | (14,411 | ) | (14,718 | ) | (15,028 | ) | (14,115 | ) | (15,342 | ) | ||||||||||||||
|
|
|
|
|
|
|
|
|
|
|
|
|
| |||||||||||||||
Average tangible assets | 3,797,840 | 4,303,174 | 4,535,677 | 4,515,477 | 4,533,314 | 4,209,527 | 4,619,875 | |||||||||||||||||||||
|
|
|
|
|
|
|
|
|
|
|
|
|
| |||||||||||||||
Average equity | 25,548 | 5,805 | 16,113 | 63,402 | 85,130 | 15,856 | 114,685 | |||||||||||||||||||||
Average goodwill and core deposit intangibles | (13,815 | ) | (14,125 | ) | (14,411 | ) | (14,718 | ) | (15,028 | ) | (14,115 | ) | (15,342 | ) | ||||||||||||||
Other comprehensive loss | 6,226 | 6,266 | 6,240 | 2,743 | 2,499 | 6,244 | 2,271 | |||||||||||||||||||||
|
|
|
|
|
|
|
|
|
|
|
|
|
| |||||||||||||||
Average tangible equity | $ | 17,959 | (2,054 | ) | 7,942 | 51,427 | 72,601 | 7,985 | 101,614 | |||||||||||||||||||
Return on average assets from continuing operations | -1.24 | % | 2.17 | % | -2.01 | % | -4.04 | % | -2.21 | % | -0.36 | % | -2.79 | % | ||||||||||||||
|
|
|
|
|
|
|
|
|
|
|
|
|
| |||||||||||||||
Return on average tangible assets from continuing operations – Non-GAAP | -1.24 | % | 2.18 | % | -2.02 | % | -4.06 | % | -2.22 | % | -0.36 | % | -2.80 | % | ||||||||||||||
|
|
|
|
|
|
|
|
|
|
|
|
|
| |||||||||||||||
Return on average equity from continuing operations | -184.66 | % | 1612.47 | % | -568.16 | % | -288.92 | % | -118.33 | % | -94.85 | % | -112.72 | % | ||||||||||||||
|
|
|
|
|
|
|
|
|
|
|
|
|
| |||||||||||||||
Return on average tangible equity from continuing operations – Non-GAAP | -262.69 | % | -4557.16 | % | -1152.71 | % | -356.19 | % | -138.75 | % | -188.35 | % | -127.22 | % | ||||||||||||||
|
|
|
|
|
|
|
|
|
|
|
|
|
| |||||||||||||||
7
BankAtlantic (Bank Operations Business Segment)
Summary of Selected Financial Data (unaudited)
| (in thousands except percentages) | For the Three Months Ended | For the Nine Months Ended | ||||||||||||||||||||||||||
| 9/30/2011 | 6/30/2011 | 3/31/2011 | 12/31/2010 | 9/30/2010 | 9/30/2011 | 9/30/2010 | ||||||||||||||||||||||
Statistics: | ||||||||||||||||||||||||||||
Average interest earning assets | $ | 3,518,717 | 3,988,628 | 4,224,423 | 4,220,720 | 4,234,115 | 3,908,003 | 4,276,245 | ||||||||||||||||||||
Average interest bearing liabilities | $ | 2,527,734 | 2,986,328 | 3,221,899 | 3,177,611 | 3,189,179 | 2,909,445 | 3,263,758 | ||||||||||||||||||||
Period end borrowings to deposits and borrowings | % | 0.69 | 0.67 | 2.15 | 5.50 | 5.76 | 0.69 | 5.76 | ||||||||||||||||||||
Efficiency ratio | % | 82.77 | 55.76 | 80.10 | 105.60 | 91.87 | 69.83 | 87.75 | ||||||||||||||||||||
Yield on interest earning assets | % | 3.81 | 3.73 | 3.73 | 3.86 | 4.19 | 3.76 | 4.22 | ||||||||||||||||||||
Cost of interest-bearing liabilities | % | 0.53 | 0.57 | 0.59 | 0.62 | 0.65 | 0.57 | 0.81 | ||||||||||||||||||||
Interest spread | % | 3.28 | 3.16 | 3.14 | 3.24 | 3.54 | 3.19 | 3.41 | ||||||||||||||||||||
Net interest margin | % | 3.43 | 3.30 | 3.28 | 3.40 | 3.70 | 3.34 | 3.60 | ||||||||||||||||||||
Net income (loss) | $ | (7,819 | ) | 30,677 | (16,665 | ) | (41,502 | ) | (17,894 | ) | 6,193 | (75,340 | ) | |||||||||||||||
Non-GAAP Measures (Note 1) | ||||||||||||||||||||||||||||
Average tangible assets | $ | 3,764,512 | 4,258,843 | 4,495,637 | 4,473,959 | 4,489,189 | 4,170,319 | 4,566,803 | ||||||||||||||||||||
Average tangible equity | $ | 314,295 | 277,639 | 282,135 | 319,982 | 338,712 | 291,474 | 353,971 | ||||||||||||||||||||
Pre-tax core operating earnings | $ | 11,416 | 11,657 | 11,575 | 8,323 | 13,922 | 34,648 | 38,774 | ||||||||||||||||||||
Core operating efficiency ratio | % | 79.43 | 78.57 | 79.91 | 86.12 | 78.95 | 79.32 | 80.33 | ||||||||||||||||||||
Return on average tangible assets | % | (0.86) | 2.91 | (1.46 | ) | (3.69 | ) | (1.57 | ) | 0.21 | (2.18 | ) | ||||||||||||||||
Return on average tangible equity | % | (10.27) | 44.61 | (23.21 | ) | (51.56 | ) | (20.87 | ) | 2.98 | (28.13 | ) | ||||||||||||||||
Tangible capital to tangible assets | % | 7.92 | 8.06 | 5.80 | 6.12 | 7.08 | ||||||||||||||||||||||
Earning assets repricing at period end: | ||||||||||||||||||||||||||||
Percent of earning assets that have fixed rates | % | 45 | 45 | 46 | 45 | 45 | ||||||||||||||||||||||
Percent of earning assets that have variable rates | % | 55 | 55 | 54 | 55 | 55 | ||||||||||||||||||||||
Regulatory capital ratios and statistics at period end | ||||||||||||||||||||||||||||
Total risk-based capital | % | 14.96 | 14.52 | 11.76 | 11.72 | 12.59 | ||||||||||||||||||||||
Tier I risk-based capital | % | 12.77 | 12.38 | 9.68 | 9.68 | 10.59 | ||||||||||||||||||||||
Core capital | % | 8.29 | 8.24 | 5.97 | 6.22 | 7.17 | ||||||||||||||||||||||
Risk-weighted assets | $ | 2,396,060 | 2,535,217 | 2,713,638 | 2,855,415 | 3,021,862 | ||||||||||||||||||||||
Adjusted total assets | $ | 3,691,410 | 3,807,960 | 4,401,218 | 4,444,797 | 4,459,875 | ||||||||||||||||||||||
Note 1
See page 15 for a reconciliation of non-GAAP measures to GAAP financial measures.
8
BankAtlantic (Bank Operations Business Segment)
Condensed Statements of Operations (unaudited)
| For the Three Months Ended | For the Nine Months Ended | |||||||||||||||||||||||||||
| (in thousands) | 9/30/2011 | 6/30/2011 | 3/31/2011 | 12/31/2010 | 9/30/2010 | 9/30/2011 | 9/30/2010 | |||||||||||||||||||||
Net interest income | $ | 30,133 | 32,977 | 34,704 | 35,766 | 39,101 | 97,814 | 115,568 | ||||||||||||||||||||
Provision for loan losses | 17,754 | 10,195 | 27,832 | 40,145 | 23,012 | 55,781 | 98,680 | |||||||||||||||||||||
|
|
|
|
|
|
|
|
|
|
|
|
|
| |||||||||||||||
Net interest income after provision for loan losses | 12,379 | 22,782 | 6,872 | (4,379 | ) | 16,089 | 42,033 | 16,888 | ||||||||||||||||||||
|
|
|
|
|
|
|
|
|
|
|
|
|
| |||||||||||||||
Non-interest income | ||||||||||||||||||||||||||||
Service charges on deposits | 10,165 | 11,226 | 12,032 | 14,080 | 15,214 | 33,423 | 45,764 | |||||||||||||||||||||
Other service charges and fees | 6,129 | 6,886 | 7,191 | 7,528 | 7,495 | 20,206 | 22,612 | |||||||||||||||||||||
Securities activities, net | 6,959 | — | (24 | ) | (34 | ) | (543 | ) | 6,935 | 2,898 | ||||||||||||||||||
(Loss) gain on sale of Tampa branches | (34 | ) | 38,656 | — | — | — | 38,622 | — | ||||||||||||||||||||
Other non-interest income | 2,123 | 3,306 | 3,714 | 2,625 | 4,869 | 9,143 | 10,289 | |||||||||||||||||||||
|
|
|
|
|
|
|
|
|
|
|
|
|
| |||||||||||||||
Total non-interest income | 25,342 | 60,074 | 22,913 | 24,199 | 27,035 | 108,329 | 81,563 | |||||||||||||||||||||
|
|
|
|
|
|
|
|
|
|
|
|
|
| |||||||||||||||
Non-interest expense | ||||||||||||||||||||||||||||
Employee compensation and benefits | 16,612 | 19,218 | 18,763 | 20,028 | 22,475 | 54,593 | 71,103 | |||||||||||||||||||||
Occupancy and equipment | 10,019 | 11,488 | 12,585 | 12,996 | 13,263 | 34,092 | 40,589 | |||||||||||||||||||||
Advertising and business promotion | 1,511 | 1,435 | 1,669 | 2,333 | 1,917 | 4,615 | 5,972 | |||||||||||||||||||||
Professional fees | 7,056 | 530 | 2,981 | 5,638 | 4,942 | 10,567 | 11,727 | |||||||||||||||||||||
Check losses | 558 | 663 | 299 | 705 | 763 | 1,520 | 1,716 | |||||||||||||||||||||
Supplies and postage | 758 | 879 | 870 | 1,024 | 929 | 2,507 | 2,789 | |||||||||||||||||||||
Telecommunication | 386 | 444 | 572 | 632 | 697 | 1,402 | 1,881 | |||||||||||||||||||||
Cost associated with debt redemption | — | 1,115 | 10 | — | — | 1,125 | 60 | |||||||||||||||||||||
Provision for tax certificates | 969 | 1,021 | 779 | 800 | 885 | 2,769 | 3,752 | |||||||||||||||||||||
(Gain) loss on sale of real estate | (2,023 | ) | (362 | ) | (278 | ) | 663 | (442 | ) | (2,663 | ) | 334 | ||||||||||||||||
Impairment, restructuring and exit activities | 2,877 | 7,377 | (399 | ) | 10,219 | 8,099 | 9,855 | 10,489 | ||||||||||||||||||||
Other | 7,193 | 8,081 | 8,303 | 8,286 | 7,228 | 23,577 | 22,580 | |||||||||||||||||||||
|
|
|
|
|
|
|
|
|
|
|
|
|
| |||||||||||||||
Total non-interest expense | 45,916 | 51,889 | 46,154 | 63,324 | 60,756 | 143,959 | 172,992 | |||||||||||||||||||||
|
|
|
|
|
|
|
|
|
|
|
|
|
| |||||||||||||||
Income (loss) from bank operations business segment before income taxes | (8,195 | ) | 30,967 | (16,369 | ) | (43,504 | ) | (17,632 | ) | 6,403 | (74,541 | ) | ||||||||||||||||
(Benefit) provision for income taxes | (122 | ) | — | 1 | (2,261 | ) | 37 | (121 | ) | 127 | ||||||||||||||||||
|
|
|
|
|
|
|
|
|
|
|
|
|
| |||||||||||||||
Net income (loss) from bank operations business segment | (8,073 | ) | 30,967 | (16,370 | ) | (41,243 | ) | (17,669 | ) | 6,524 | (74,668 | ) | ||||||||||||||||
Less: net income attributable to noncontrolling interest | 254 | (290 | ) | (295 | ) | (259 | ) | (225 | ) | (331 | ) | (672 | ) | |||||||||||||||
|
|
|
|
|
|
|
|
|
|
|
|
|
| |||||||||||||||
Net income (loss) attributable to BankAtlantic | $ | (7,819 | ) | 30,677 | (16,665 | ) | (41,502 | ) | (17,894 | ) | 6,193 | (75,340 | ) | |||||||||||||||
|
|
|
|
|
|
|
|
|
|
|
|
|
| |||||||||||||||
9
BankAtlantic (Bank Operations Business Segment)
Condensed Statements of Financial Condition (unaudited)
| As of | ||||||||||||||||||||
| (in thousands) | 9/30/2011 | 6/30/2011 | 3/31/2011 | 12/31/2010 | 9/30/2010 | |||||||||||||||
ASSETS | ||||||||||||||||||||
Cash and interest bearing deposits in other banks | $ | 673,922 | 430,544 | 749,355 | 552,913 | 337,105 | ||||||||||||||
Loans receivable, net | 2,538,408 | 2,659,442 | 2,813,097 | 3,009,771 | 3,218,097 | |||||||||||||||
Loans held for sale (lower of cost or fair value) | 42,620 | 44,856 | 44,542 | 21,704 | 2,839 | |||||||||||||||
Investment securities | 56,268 | 66,211 | 77,837 | 89,814 | 104,776 | |||||||||||||||
Available for sale securities | 84,477 | 316,508 | 376,034 | 424,360 | 446,591 | |||||||||||||||
FHLB stock | 25,223 | 31,614 | 43,557 | 43,557 | 45,259 | |||||||||||||||
Goodwill | 13,081 | 13,081 | 13,081 | 13,081 | 13,081 | |||||||||||||||
Core deposit intangible asset | 589 | 884 | 1,179 | 1,488 | 1,796 | |||||||||||||||
Assets held for sale | — | 1,768 | 36,909 | 37,333 | 37,209 | |||||||||||||||
Other assets | 272,460 | 266,563 | 268,975 | 275,147 | 278,723 | |||||||||||||||
|
|
|
|
|
|
|
|
|
| |||||||||||
Total assets | $ | 3,707,048 | 3,831,471 | 4,424,566 | 4,469,168 | 4,485,476 | ||||||||||||||
|
|
|
|
|
|
|
|
|
| |||||||||||
LIABILITIES AND EQUITY | ||||||||||||||||||||
Deposits | ||||||||||||||||||||
Demand | $ | 859,688 | 887,856 | 879,820 | 792,260 | 809,830 | ||||||||||||||
Savings | 439,051 | 447,706 | 452,533 | 418,304 | 411,612 | |||||||||||||||
NOW | 1,166,615 | 1,239,130 | 1,307,041 | 1,370,568 | 1,288,792 | |||||||||||||||
Money market | 449,800 | 399,195 | 366,968 | 354,282 | 386,091 | |||||||||||||||
Certificates of deposit | 409,167 | 454,279 | 609,538 | 616,454 | 601,956 | |||||||||||||||
Deposits held for sale | — | — | 390,432 | 341,146 | 339,360 | |||||||||||||||
|
|
|
|
|
|
|
|
|
| |||||||||||
Total deposits | 3,324,321 | 3,428,166 | 4,006,332 | 3,893,014 | 3,837,641 | |||||||||||||||
Advances from Federal Home Loan Bank | — | — | 45,000 | 170,000 | 180,000 | |||||||||||||||
Short term borrowings | 960 | 1,020 | 20,909 | 34,435 | 32,666 | |||||||||||||||
Subordinated debentures | 22,000 | 22,000 | 22,000 | 22,000 | 22,000 | |||||||||||||||
Liabilities held for sale | — | — | 79 | 87 | 100 | |||||||||||||||
Other liabilities | 53,700 | 58,768 | 60,178 | 62,526 | 81,452 | |||||||||||||||
|
|
|
|
|
|
|
|
|
| |||||||||||
Total liabilities | 3,400,981 | 3,509,954 | 4,154,498 | 4,182,062 | 4,153,859 | |||||||||||||||
Equity | 306,067 | 321,517 | 270,068 | 287,106 | 331,617 | |||||||||||||||
|
|
|
|
|
|
|
|
|
| |||||||||||
Total liabilities and equity | $ | 3,707,048 | 3,831,471 | 4,424,566 | 4,469,168 | 4,485,476 | ||||||||||||||
|
|
|
|
|
|
|
|
|
| |||||||||||
10
BankAtlantic (Bank Operations Business Segment)
Average Balance Sheet – Yield / Rate Analysis
| For the Three Months Ended | ||||||||||||||||||||||||
| September 30, 2011 | September 30, 2010 | |||||||||||||||||||||||
| (in thousands) | Average Balance | Revenue/ Expense | Yield/ Rate | Average Balance | Revenue/ Expense | Yield/ Rate | ||||||||||||||||||
Loans: | ||||||||||||||||||||||||
Residential real estate | $ | 1,038,201 | 12,140 | 4.68 | % | $ | 1,356,748 | 16,340 | 4.82 | % | ||||||||||||||
Commercial real estate | 751,277 | 7,738 | 4.12 | 1,036,215 | 9,703 | 3.75 | ||||||||||||||||||
Consumer | 588,257 | 4,369 | 2.97 | 653,630 | 4,808 | 2.94 | ||||||||||||||||||
Commercial business | 123,559 | 1,371 | 4.44 | 132,306 | 2,573 | 7.78 | ||||||||||||||||||
Small business | 289,845 | 4,649 | 6.42 | 306,927 | 4,875 | 6.35 | ||||||||||||||||||
|
|
|
|
|
|
|
|
|
|
|
| |||||||||||||
Total loans | 2,791,139 | 30,267 | 4.34 | 3,485,826 | 38,299 | 4.39 | ||||||||||||||||||
Investments | 727,578 | 3,268 | 1.80 | 748,289 | 6,032 | 3.22 | ||||||||||||||||||
|
|
|
|
|
|
|
|
|
|
|
| |||||||||||||
Total interest earning assets | 3,518,717 | 33,535 | 3.81 | % | 4,234,115 | 44,331 | 4.19 | % | ||||||||||||||||
|
|
|
|
|
|
|
| |||||||||||||||||
Goodwill and core deposit intangibles | 13,815 | 15,028 | ||||||||||||||||||||||
Other non-interest earning assets | 245,795 | 255,074 | ||||||||||||||||||||||
|
|
|
| |||||||||||||||||||||
Total Assets | $ | 3,778,327 | $ | 4,504,217 | ||||||||||||||||||||
|
|
|
| |||||||||||||||||||||
Deposits: | ||||||||||||||||||||||||
Savings | $ | 445,273 | 212 | 0.19 | % | $ | 444,981 | 250 | 0.22 | % | ||||||||||||||
NOW | 1,206,452 | 1,096 | 0.36 | 1,484,558 | 1,441 | 0.39 | ||||||||||||||||||
Money market | 420,628 | 611 | 0.58 | 404,406 | 551 | 0.54 | ||||||||||||||||||
Certificates of deposit | 432,345 | 1,255 | 1.15 | 689,664 | 2,635 | 1.52 | ||||||||||||||||||
|
|
|
|
|
|
|
|
|
|
|
| |||||||||||||
Total interest bearing deposits | 2,504,698 | 3,174 | 0.50 | 3,023,609 | 4,877 | 0.64 | ||||||||||||||||||
|
|
|
|
|
|
|
|
|
|
|
| |||||||||||||
Short-term borrowed funds | 1,036 | — | — | 36,885 | 12 | 0.13 | ||||||||||||||||||
Advances from FHLB | — | — | — | 106,685 | 106 | 0.39 | ||||||||||||||||||
Subordinated debentures and bonds payable | 22,000 | 228 | 4.11 | 22,000 | 235 | 4.24 | ||||||||||||||||||
|
|
|
|
|
|
|
|
|
|
|
| |||||||||||||
Total interest bearing liabilities | 2,527,734 | 3,402 | 0.53 | 3,189,179 | 5,230 | 0.65 | ||||||||||||||||||
Demand deposits | 884,386 | 907,272 | ||||||||||||||||||||||
Non-interest bearing other liabilities | 44,323 | 56,525 | ||||||||||||||||||||||
|
|
|
| |||||||||||||||||||||
Total Liabilities | 3,456,443 | 4,152,976 | ||||||||||||||||||||||
Equity | 321,884 | 351,241 | ||||||||||||||||||||||
|
|
|
| |||||||||||||||||||||
Total liabilities and equity | $ | 3,778,327 | $ | 4,504,217 | ||||||||||||||||||||
|
|
|
| |||||||||||||||||||||
Net interest income/ net interest spread | $ | 30,133 | 3.28 | % | $ | 39,101 | 3.54 | % | ||||||||||||||||
|
|
|
|
|
|
|
| |||||||||||||||||
Margin | ||||||||||||||||||||||||
Interest income/interest earning assets | 3.81 | % | 4.19 | % | ||||||||||||||||||||
Interest expense/interest earning assets | 0.38 | 0.49 | ||||||||||||||||||||||
|
|
|
| |||||||||||||||||||||
Net interest margin | 3.43 | % | 3.70 | % | ||||||||||||||||||||
|
|
|
| |||||||||||||||||||||
11
BankAtlantic (Bank Operations Business Segment)
Average Balance Sheet – Yield / Rate Analysis
| For the Nine Months Ended | ||||||||||||||||||||||||
| September 30, 2011 | September 30, 2010 | |||||||||||||||||||||||
| (in thousands) | Average Balance | Revenue/ Expense | Yield/ Rate | Average Balance | Revenue/ Expense | Yield/ Rate | ||||||||||||||||||
Loans: | ||||||||||||||||||||||||
Residential real estate | $ | 1,102,017 | 38,990 | 4.72 | % | $ | 1,433,884 | 53,048 | 4.93 | % | ||||||||||||||
Commercial real estate | 815,813 | 25,853 | 4.23 | 1,061,298 | 30,821 | 3.87 | ||||||||||||||||||
Consumer | 604,649 | 13,388 | 2.95 | 670,532 | 14,537 | 2.89 | ||||||||||||||||||
Commercial business | 126,657 | 6,119 | 6.44 | 134,900 | 6,773 | 6.69 | ||||||||||||||||||
Small business | 296,330 | 13,962 | 6.28 | 308,234 | 14,538 | 6.29 | ||||||||||||||||||
|
|
|
|
|
|
|
|
|
|
|
| |||||||||||||
Total loans | 2,945,466 | 98,312 | 4.45 | 3,608,848 | 119,717 | 4.42 | ||||||||||||||||||
Investments | 962,537 | 11,865 | 1.64 | 667,397 | 15,600 | 3.12 | ||||||||||||||||||
|
|
|
|
|
|
|
|
|
|
|
| |||||||||||||
Total interest earning assets | 3,908,003 | 110,177 | 3.76 | % | 4,276,245 | 135,317 | 4.22 | % | ||||||||||||||||
|
|
|
|
|
|
|
| |||||||||||||||||
Goodwill and core deposit intangibles | 14,115 | 15,342 | ||||||||||||||||||||||
Other non-interest earning assets | 262,316 | 290,558 | ||||||||||||||||||||||
|
|
|
| |||||||||||||||||||||
Total Assets | $ | 4,184,434 | $ | 4,582,145 | ||||||||||||||||||||
|
|
|
| |||||||||||||||||||||
Deposits: | ||||||||||||||||||||||||
Savings | $ | 464,106 | 743 | 0.21 | % | $ | 438,707 | 855 | 0.26 | % | ||||||||||||||
NOW | 1,378,280 | 3,903 | 0.38 | 1,492,442 | 5,444 | 0.49 | ||||||||||||||||||
Money market | 406,261 | 1,579 | 0.52 | 384,024 | 1,810 | 0.63 | ||||||||||||||||||
Certificates of deposit | 564,735 | 5,291 | 1.25 | 796,375 | 9,846 | 1.65 | ||||||||||||||||||
|
|
|
|
|
|
|
|
|
|
|
| |||||||||||||
Total deposits | 2,813,382 | 11,516 | 0.55 | 3,111,548 | 17,955 | 0.77 | ||||||||||||||||||
|
|
|
|
|
|
|
|
|
|
|
| |||||||||||||
Short-term borrowed funds | 15,363 | 15 | 0.13 | 36,633 | 35 | 0.13 | ||||||||||||||||||
Advances from FHLB | 58,700 | 153 | 0.35 | 93,410 | 1,065 | 1.52 | ||||||||||||||||||
Long-term debt | 22,000 | 679 | 4.13 | 22,167 | 694 | 4.19 | ||||||||||||||||||
|
|
|
|
|
|
|
|
|
|
|
| |||||||||||||
Total interest bearing liabilities | 2,909,445 | 12,363 | 0.57 | 3,263,758 | 19,749 | 0.81 | ||||||||||||||||||
Demand deposits | 927,038 | 896,080 | ||||||||||||||||||||||
Non-interest bearing other liabilities | 48,606 | 55,266 | ||||||||||||||||||||||
|
|
|
| |||||||||||||||||||||
Total Liabilities | 3,885,089 | 4,215,104 | ||||||||||||||||||||||
Stockholder’s equity | 299,345 | 367,041 | ||||||||||||||||||||||
|
|
|
| |||||||||||||||||||||
Total liabilities and stockholder’s equity | $ | 4,184,434 | $ | 4,582,145 | ||||||||||||||||||||
|
|
|
| |||||||||||||||||||||
Net interest income/net interest spread | $ | 97,814 | 3.19 | % | $ | 115,568 | 3.41 | % | ||||||||||||||||
|
|
|
|
|
|
|
| |||||||||||||||||
Margin | ||||||||||||||||||||||||
Interest income/interest earning assets | 3.76 | % | 4.22 | % | ||||||||||||||||||||
Interest expense/interest earning assets | 0.42 | 0.62 | ||||||||||||||||||||||
|
|
|
| |||||||||||||||||||||
Net interest margin | 3.34 | % | 3.60 | % | ||||||||||||||||||||
|
|
|
| |||||||||||||||||||||
12
BankAtlantic (Bank Operations Business Segment)
Allowance for Loan Loss and Credit Quality
| (in thousands) | For the Three Months Ended | For the Nine Months Ended | ||||||||||||||||||||||||||
| 9/30/2011 | 6/30/2011 | 3/31/2011 | 12/31/2010 | 9/30/2010 | 9/30/2011 | 9/30/2010 | ||||||||||||||||||||||
Allowance for Loan Losses | ||||||||||||||||||||||||||||
Beginning balance | $ | 137,643 | 154,237 | 161,309 | 181,760 | 180,635 | 161,309 | 173,588 | ||||||||||||||||||||
Charge-offs: | ||||||||||||||||||||||||||||
Residential real estate | (3,489 | ) | (5,767 | ) | (8,011 | ) | (4,272 | ) | (4,619 | ) | (17,267 | ) | (14,033 | ) | ||||||||||||||
Commercial real estate | (5,787 | ) | (13,546 | ) | (11,277 | ) | (44,979 | ) | (5,969 | ) | (30,610 | ) | (41,447 | ) | ||||||||||||||
Commercial business | (7,563 | ) | (124 | ) | (464 | ) | (996 | ) | — | (8,151 | ) | — | ||||||||||||||||
Consumer | (6,555 | ) | (6,379 | ) | (7,814 | ) | (7,009 | ) | (9,881 | ) | (20,748 | ) | (32,474 | ) | ||||||||||||||
Small business | (2,321 | ) | (2,010 | ) | (2,611 | ) | (2,409 | ) | (2,402 | ) | (6,942 | ) | (5,464 | ) | ||||||||||||||
|
|
|
|
|
|
|
|
|
|
|
|
|
| |||||||||||||||
Total charge-offs | (25,715 | ) | (27,826 | ) | (30,177 | ) | (59,665 | ) | (22,871 | ) | (83,718 | ) | (93,418 | ) | ||||||||||||||
|
|
|
|
|
|
|
|
|
|
|
|
|
| |||||||||||||||
Recoveries: | ||||||||||||||||||||||||||||
Residential real estate | 543 | 435 | 131 | 284 | 383 | 1,109 | 882 | |||||||||||||||||||||
Commercial real estate | 1 | 75 | 714 | 1,210 | — | 790 | 127 | |||||||||||||||||||||
Commercial business | 1 | 57 | 791 | 57 | — | 849 | 659 | |||||||||||||||||||||
Consumer | 644 | 492 | 408 | 300 | 294 | 1,544 | 742 | |||||||||||||||||||||
Small business | 316 | 203 | 310 | 126 | 307 | 829 | 500 | |||||||||||||||||||||
|
|
|
|
|
|
|
|
|
|
|
|
|
| |||||||||||||||
Total recoveries | 1,505 | 1,262 | 2,354 | 1,977 | 984 | 5,121 | 2,910 | |||||||||||||||||||||
|
|
|
|
|
|
|
|
|
|
|
|
|
| |||||||||||||||
Net charge-offs | (24,210 | ) | (26,564 | ) | (27,823 | ) | (57,688 | ) | (21,887 | ) | (78,597 | ) | (90,508 | ) | ||||||||||||||
Transfer to held for sale | (635 | ) | (225 | ) | (7,081 | ) | (2,907 | ) | — | (7,941 | ) | — | ||||||||||||||||
Provision for loan losses | 17,754 | 10,195 | 27,832 | 40,144 | 23,012 | 55,781 | 98,680 | |||||||||||||||||||||
|
|
|
|
|
|
|
|
|
|
|
|
|
| |||||||||||||||
Ending balance | $ | 130,552 | 137,643 | 154,237 | 161,309 | 181,760 | 130,552 | 181,760 | ||||||||||||||||||||
|
|
|
|
|
|
|
|
|
|
|
|
|
| |||||||||||||||
| As of | ||||||||||||||||||||
| 9/30/2011 | 6/30/2011 | 3/31/2011 | 12/31/2010 | 9/30/2010 | ||||||||||||||||
Credit Quality | ||||||||||||||||||||
Nonaccrual loans | ||||||||||||||||||||
Commercial real estate | $ | 190,715 | 190,684 | 239,798 | 243,299 | 275,057 | ||||||||||||||
Consumer | 14,202 | 14,614 | 13,231 | 14,120 | 13,282 | |||||||||||||||
Small business | 11,708 | 11,990 | 12,172 | 10,879 | 10,995 | |||||||||||||||
Residential real estate | 81,287 | 81,362 | 81,555 | 86,538 | 87,563 | |||||||||||||||
Commercial business | 17,302 | 17,098 | 15,848 | 16,123 | 17,190 | |||||||||||||||
|
|
|
|
|
|
|
|
|
| |||||||||||
Total Nonaccrual loans | 315,214 | 315,748 | 362,604 | 370,959 | 404,087 | |||||||||||||||
Nonaccrual tax certificates | 2,416 | 2,756 | 3,402 | 3,636 | 2,761 | |||||||||||||||
Real estate owned | 83,360 | 71,060 | 66,310 | 64,328 | 58,017 | |||||||||||||||
|
|
|
|
|
|
|
|
|
| |||||||||||
Total nonperforming assets | $ | 400,990 | 389,564 | 432,316 | 438,923 | 464,865 | ||||||||||||||
|
|
|
|
|
|
|
|
|
| |||||||||||
Allowance for loan losses to total loans | % | 4.89 | 4.92 | 5.20 | 5.08 | 5.34 | ||||||||||||||
Allowance to nonaccrual loans | % | 41.42 | 43.59 | 42.54 | 43.48 | 44.98 | ||||||||||||||
Provision to average loans | % | 2.54 | 1.39 | 3.58 | 4.81 | 2.64 | ||||||||||||||
Annualized net charge-offs to average loans | % | 3.47 | 3.61 | 3.58 | 6.91 | 2.51 | ||||||||||||||
Nonaccrual loans to total assets | % | 8.50 | 8.24 | 8.20 | 8.30 | 9.01 | ||||||||||||||
Nonperforming assets to total assets | % | 10.82 | 10.17 | 9.77 | 9.82 | 10.36 | ||||||||||||||
13
BankAtlantic (Bank Operations Business Segment)
Delinquencies, Excluding Non-Accrual Loans, at Period-End
| ($ in thousands) | 9/30/2011 | 6/30/2011 | 3/31/2011 | 12/31/2010 | 9/30/2010 | |||||||||||||||||||||||||||||||||||
Commercial real estate | $ | 973 | — | 1,400 | 31 | 14,317 | ||||||||||||||||||||||||||||||||||
Consumer | 9,652 | 9,230 | 12,025 | 12,405 | 12,004 | |||||||||||||||||||||||||||||||||||
Small business | 2,021 | 2,210 | 2,200 | 2,712 | 2,927 | |||||||||||||||||||||||||||||||||||
Residential real estate | 16,637 | 16,060 | 20,528 | 23,053 | 17,946 | |||||||||||||||||||||||||||||||||||
Commercial business | 3,704 | * | ** | 338 | 19,552 | * | ** | — | — | |||||||||||||||||||||||||||||||
|
|
|
|
|
|
|
|
|
| |||||||||||||||||||||||||||||||
Total BankAtlantic | $ | 32,987 | 27,838 | 55,705 | 38,201 | 47,194 | ||||||||||||||||||||||||||||||||||
|
|
|
|
|
|
|
|
|
| |||||||||||||||||||||||||||||||
| 9/30/2011 | 6/30/2011 | 3/31/2011 | 12/31/2010 | 9/30/2010 | ||||||||||||||||||||||||||||||||||||
Commercial real estate | % | 0.13 | — | 0.17 | — | 1.43 | * | |||||||||||||||||||||||||||||||||
Consumer | % | 1.69 | 1.57 | 2.00 | 2.01 | 1.90 | ||||||||||||||||||||||||||||||||||
Small business | % | 0.71 | 0.75 | 0.74 | 0.89 | 0.96 | ||||||||||||||||||||||||||||||||||
Residential real estate | % | 1.65 | * | * | 1.51 | * | * | 1.83 | * | * | 1.88 | * | * | 1.37 | * | * | ||||||||||||||||||||||||
Commercial business | % | 3.17 | * | ** | 0.28 | 15.36 | * | ** | — | — | ||||||||||||||||||||||||||||||
|
|
|
|
|
|
|
|
|
| |||||||||||||||||||||||||||||||
Total BankAtlantic | % | 1.22 | 0.99 | 1.86 | 1.20 | 1.39 | ||||||||||||||||||||||||||||||||||
|
|
|
|
|
|
|
|
|
| |||||||||||||||||||||||||||||||
| * | Excludes $12.0 million of Commercial Real Estate loans at September 30, 2010, which had matured and had been approved for renewal or forbearance but were not fully documented at period end. Including these loans, Commercial Real Estate delinquencies were 2.63% and total BankAtlantic delinquencies would have been 1.75% at September 30, 2010. |
| ** | Includes $918.4 million, $973.4 million, $1.0 billion, $1.1 billion and $1.2 billion of purchased residential loans with delinquencies excluding non-accrual loans of 1.52%, 1.41%. 1.58%, 1.77% and 1.19% as of September 30, 2011. June 30, 2011, March 31, 2011, December 31, 2010 and September 30, 2010, respectively. |
| *** | Amounts represent loan relationships that are past due as to maturity and are in the process of renewal. |
BankAtlantic (Bank Operations Business Segment)
Loan Provision & Allowance for Loan Losses
| ($ in thousands) | 3Q 2011 Loan Provision | Allowance for Loan Losses | % of Reserves to Total Loans | |||||||||
Commercial real estate | $ | 5,340 | 67,608 | 9.58 | % | |||||||
Consumer | 3,858 | 22,945 | 4.03 | |||||||||
Small business | 109 | 7,957 | 2.80 | |||||||||
Residential real estate | 42 | 20,817 | 2.11 | |||||||||
Commercial business | 7,770 | 11,225 | 9.61 | |||||||||
Transfers to held for sale | 635 | — | — | |||||||||
|
|
|
|
|
| |||||||
Total BankAtlantic | $ | 17,754 | 130,552 | 4.89 | % | |||||||
|
|
|
|
|
| |||||||
14
BankAtlantic (Bank Operations Business Segment)
Reconciliation of GAAP Financial Measures to Non-GAAP Measures
Management uses non-GAAP financial measures to supplement its GAAP financial information and to provide additional useful measures in the evaluation of BankAtlantic’s operating results and any related trends that may be affecting BankAtlantic’s business. Management uses pre-tax core operating earnings to measure BankAtlantic’s ongoing financial performance excluding items that are not currently controllable by management. Management uses core expenses to measure expense reduction trends excluding items that are not currently controllable by management. The core operating efficiency ratio is used by management to measure the costs expended to generate a dollar of revenues excluding items that are not currently controllable by management. The return on average tangible equity and average tangible assets is used by management to measure BankAtlantic’s effectiveness in its use of capital and assets, respectively, and to allow for comparison to other companies in the industry. The tangible equity to tangible asset ratio is used by management to evaluate capital adequacy trends and to allow for comparison to other companies in the industry. Management uses the core deposit measure to assess trends relating to its lower cost deposit categories, which management believes may generally be more indicative of relationship deposits. These disclosures should not be viewed as a substitute for operating results determined in accordance with GAAP, nor are they necessarily comparable to non-GAAP performance measures that may be presented by other companies.
| Reconciliation of income (loss) from bank operations business segment before income taxes to pre-tax core operating earnings | ||||||||||||||||||||||||||||
| For the Three Months Ended | For the Nine Months Ended | |||||||||||||||||||||||||||
| (in thousands) | 9/30/2011 | 6/30/2011 | 3/31/2011 | 12/31/2010 | 9/30/2010 | 9/30/2011 | 9/30/2010 | |||||||||||||||||||||
Income (loss) from bank operationsbusiness segment before income taxes | $ | (8,195 | ) | 30,967 | (16,369 | ) | (43,504 | ) | (17,632 | ) | 6,403 | (74,541 | ) | |||||||||||||||
Loss (gain) on sale of Tampa branches | 34 | (38,656 | ) | — | — | — | (38,622 | ) | — | |||||||||||||||||||
Costs associated with debt redemption | — | 1,115 | 10 | — | — | 1,125 | 60 | |||||||||||||||||||||
Provision for tax certificates | 969 | 1,021 | 779 | 800 | 885 | 2,769 | 3,752 | |||||||||||||||||||||
Loss (gain) on sale of real estate | (2,023 | ) | (362 | ) | (278 | ) | 663 | (442 | ) | (2,663 | ) | 334 | ||||||||||||||||
Impairment, restructuring and exit activities | 2,877 | 7,377 | (399 | ) | 10,219 | 8,099 | 9,855 | 10,489 | ||||||||||||||||||||
Provision for loan losses | 17,754 | 10,195 | 27,832 | 40,145 | 23,012 | 55,781 | 98,680 | |||||||||||||||||||||
|
|
|
|
|
|
|
|
|
|
|
|
|
| |||||||||||||||
Non-GAAP pre-tax core operating earnings | $ | 11,416 | 11,657 | 11,575 | 8,323 | 13,922 | 34,648 | 38,774 | ||||||||||||||||||||
|
|
|
|
|
|
|
|
|
|
|
|
|
| |||||||||||||||
| Reconciliation of non-interest expense to core expenses and calculation of core operating efficiency ratio | ||||||||||||||||||||||||||||
| For the Three Months Ended | For the Nine Months Ended | |||||||||||||||||||||||||||
| ($ in thousands) | 9/30/2011 | 6/30/2011 | 3/31/2011 | 12/31/2010 | 9/30/2010 | 9/30/2011 | 9/30/2010 | |||||||||||||||||||||
Non-interest expense | $ | 45,916 | 51,889 | 46,154 | 63,324 | 60,756 | 143,959 | 172,992 | ||||||||||||||||||||
Costs associated with debt redemption | — | (1,115 | ) | (10 | ) | — | — | (1,125 | ) | (60 | ) | |||||||||||||||||
Provision for tax certificates | (969 | ) | (1,021 | ) | (779 | ) | (800 | ) | (885 | ) | (2,769 | ) | (3,752 | ) | ||||||||||||||
Gain (loss) on sale of real estate | 2,023 | 362 | 278 | (663 | ) | 442 | 2,663 | (334 | ) | |||||||||||||||||||
Impairment, restructuring and exit activities | (2,877 | ) | (7,377 | ) | 399 | (10,219 | ) | (8,099 | ) | (9,855 | ) | (10,489 | ) | |||||||||||||||
FDIC special assessment | — | — | — | — | — | — | — | |||||||||||||||||||||
|
|
|
|
|
|
|
|
|
|
|
|
|
| |||||||||||||||
Core expenses | $ | 44,093 | 42,738 | 46,042 | 51,642 | 52,214 | 132,873 | 158,357 | ||||||||||||||||||||
|
|
|
|
|
|
|
|
|
|
|
|
|
| |||||||||||||||
Net interest income | 30,133 | 32,977 | 34,704 | 35,766 | 39,101 | 97,814 | 115,568 | |||||||||||||||||||||
|
|
|
|
|
|
|
|
|
|
|
|
|
| |||||||||||||||
Non-interest income | 25,342 | 60,074 | 22,913 | 24,199 | 27,035 | 108,329 | 81,563 | |||||||||||||||||||||
Gain on sale of Tampa branches | 34 | (38,656 | ) | — | — | — | (38,622 | ) | — | |||||||||||||||||||
|
|
|
|
|
|
|
|
|
|
|
|
|
| |||||||||||||||
Core non-interest income | 25,376 | 21,418 | 22,913 | 24,199 | 27,035 | 69,707 | 81,563 | |||||||||||||||||||||
|
|
|
|
|
|
|
|
|
|
|
|
|
| |||||||||||||||
Total revenues | $ | 55,509 | $ | 54,395 | $ | 57,617 | $ | 59,965 | $ | 66,136 | $ | 167,521 | $ | 197,131 | ||||||||||||||
|
|
|
|
|
|
|
|
|
|
|
|
|
| |||||||||||||||
Non-GAAP core operating efficiency ratio | 79.43 | % | 78.57 | % | 79.91 | % | 86.12 | % | 78.95 | % | 79.32 | % | 80.33 | % | ||||||||||||||
|
|
|
|
|
|
|
|
|
|
|
|
|
| |||||||||||||||
| Reconciliation of return on average assets and average equity to return on average tangible assets and average tangible equity | ||||||||||||||||||||||||||||
| For the Three Months Ended | For the Nine Months Ended | |||||||||||||||||||||||||||
| ($ in thousands) | 9/30/2011 | 6/30/2011 | 3/31/2011 | 12/31/2010 | 9/30/2010 | 9/30/2011 | 9/30/2010 | |||||||||||||||||||||
Net income (loss) from bank operations | ||||||||||||||||||||||||||||
business segment | $ | (8,073 | ) | 30,967 | (16,370 | ) | (41,243 | ) | (17,669 | ) | 6,524 | (74,668 | ) | |||||||||||||||
|
|
|
|
|
|
|
|
|
|
|
|
|
| |||||||||||||||
Average total assets | 3,778,327 | 4,272,968 | 4,510,048 | 4,488,677 | 4,504,217 | 4,184,434 | 4,582,145 | |||||||||||||||||||||
Average goodwill and core deposit intangibles | (13,815 | ) | (14,125 | ) | (14,411 | ) | (14,718 | ) | (15,028 | ) | (14,115 | ) | (15,342 | ) | ||||||||||||||
|
|
|
|
|
|
|
|
|
|
|
|
|
| |||||||||||||||
Average tangible assets | 3,764,512 | 4,258,843 | 4,495,637 | 4,473,959 | 4,489,189 | 4,170,319 | 4,566,803 | |||||||||||||||||||||
|
|
|
|
|
|
|
|
|
|
|
|
|
| |||||||||||||||
Average equity | 321,884 | 285,498 | 290,307 | 331,957 | 351,241 | 299,345 | 367,041 | |||||||||||||||||||||
Average goodwill and core deposit intangibles | (13,815 | ) | (14,125 | ) | (14,411 | ) | (14,718 | ) | (15,028 | ) | (14,115 | ) | (15,342 | ) | ||||||||||||||
Other comprehensive loss | 6,226 | 6,266 | 6,239 | 2,743 | 2,499 | 6,244 | 2,271 | |||||||||||||||||||||
|
|
|
|
|
|
|
|
|
|
|
|
|
| |||||||||||||||
Average tangible equity | $ | 314,295 | 277,639 | 282,135 | 319,982 | 338,712 | 291,474 | 353,970 | ||||||||||||||||||||
Return on average assets from continuing operations | -0.85 | % | 2.90 | % | -1.45 | % | -3.68 | % | -1.57 | % | 0.21 | % | -2.17 | % | ||||||||||||||
|
|
|
|
|
|
|
|
|
|
|
|
|
| |||||||||||||||
Return on average tangible assets from continuing operations – Non-GAAP | -0.86 | % | 2.91 | % | -1.46 | % | -3.69 | % | -1.57 | % | 0.21 | % | -2.18 | % | ||||||||||||||
|
|
|
|
|
|
|
|
|
|
|
|
|
| |||||||||||||||
Return on average equity from continuing operations | -10.03 | % | 43.39 | % | -22.56 | % | -49.70 | % | -20.12 | % | 2.91 | % | -27.12 | % | ||||||||||||||
|
|
|
|
|
|
|
|
|
|
|
|
|
| |||||||||||||||
Return on average tangible equity from continuing operations – Non-GAAP | -10.27 | % | 44.61 | % | -23.21 | % | -51.56 | % | -20.87 | % | 2.98 | % | -28.13 | % | ||||||||||||||
|
|
|
|
|
|
|
|
|
|
|
|
|
| |||||||||||||||
| Reconciliation of equity to total tangible capital; Total assets to total tangible assets; The calculation of tangible capital to tangible assets | ||||||||||||||||||||||||
| As of | ||||||||||||||||||||||||
| ($ in thousands) | 9/30/2011 | 6/30/2011 | 3/31/2011 | 12/31/2010 | 9/30/2010 | |||||||||||||||||||
Equity | $ | 306,067 | 321,517 | 270,068 | 287,106 | 331,617 | ||||||||||||||||||
Goodwill and core deposit intangibles | (13,670 | ) | (13,965 | ) | (14,260 | ) | (14,569 | ) | (14,877 | ) | ||||||||||||||
|
|
|
|
|
|
|
|
|
| |||||||||||||||
Total tangible capital | 292,397 | 307,552 | 255,808 | 272,537 | 316,740 | |||||||||||||||||||
|
|
|
|
|
|
|
|
|
| |||||||||||||||
Total assets | 3,707,048 | 3,831,471 | 4,424,566 | 4,469,168 | 4,485,476 | |||||||||||||||||||
Goodwill and core deposit intangibles | (13,670 | ) | (13,965 | ) | (14,260 | ) | (14,569 | ) | (14,877 | ) | ||||||||||||||
|
|
|
|
|
|
|
|
|
| |||||||||||||||
Total tangible assets | $ | 3,693,378 | $ | 3,817,506 | $ | 4,410,306 | $ | 4,454,599 | $ | 4,470,599 | ||||||||||||||
|
|
|
|
|
|
|
|
|
| |||||||||||||||
Non-GAAP tangible capital to tangible assets | 7.92 | % | 8.06 | % | 5.80 | % | 6.12 | % | 7.08 | % | ||||||||||||||
|
|
|
|
|
|
|
|
|
| |||||||||||||||
| Reconciliation of total deposits to core deposits | ||||||||||||||||||||||||
| As of | ||||||||||||||||||||||||
| (in thousands) | 9/30/2011 | 6/30/2011 | 3/31/2011 | 12/31/2010 | 9/30/2010 | |||||||||||||||||||
Total deposits | $ | 3,324,321 | 3,428,166 | 4,006,332 | 3,893,014 | 3,837,641 | ||||||||||||||||||
Non-core deposits held for sale | — | — | (75,813 | ) | (75,010 | ) | (78,088 | ) | ||||||||||||||||
Money market | (449,800 | ) | (399,195 | ) | (366,968 | ) | (354,282 | ) | (386,091 | ) | ||||||||||||||
Certificates of deposit | (409,167 | ) | (454,279 | ) | (609,538 | ) | (616,454 | ) | (601,956 | ) | ||||||||||||||
|
|
|
|
|
|
|
|
|
| |||||||||||||||
Core deposits | 2,465,354 | 2,574,692 | 2,954,013 | 2,847,268 | 2,771,506 | |||||||||||||||||||
|
|
|
|
|
|
|
|
|
| |||||||||||||||
15
Parent Company Business Segment
Condensed Statements of Operations (unaudited)
| For the Three Months Ended | For the Nine Months Ended | |||||||||||||||||||||||||||
| (in thousands) | 9/30/2011 | 6/30/2011 | 3/31/2011 | 12/31/2010 | 9/30/2010 | 9/30/2011 | 9/30/2010 | |||||||||||||||||||||
Net interest expense | $ | (3,851 | ) | (3,794 | ) | (3,695 | ) | (3,716 | ) | (3,792 | ) | (11,340 | ) | (10,856 | ) | |||||||||||||
Provision (recovery) for loan losses | 147 | 515 | (20 | ) | 498 | 1,398 | 642 | 5,038 | ||||||||||||||||||||
|
|
|
|
|
|
|
|
|
|
|
|
|
| |||||||||||||||
Net interest expense after provision forloan losses | (3,998 | ) | (4,309 | ) | (3,675 | ) | (4,214 | ) | (5,190 | ) | (11,982 | ) | (15,894 | ) | ||||||||||||||
|
|
|
|
|
|
|
|
|
|
|
|
|
| |||||||||||||||
Non-interest income | ||||||||||||||||||||||||||||
Income from unconsolidated subsidiaries | 482 | 432 | 381 | 335 | 293 | 1,295 | 719 | |||||||||||||||||||||
Securities activities, net | — | (1,500 | ) | — | — | (9 | ) | (1,500 | ) | — | ||||||||||||||||||
Other | 327 | 317 | 209 | 431 | 292 | 853 | 826 | |||||||||||||||||||||
|
|
|
|
|
|
|
|
|
|
|
|
|
| |||||||||||||||
Non-interest income | 809 | (751 | ) | 590 | 766 | 576 | 648 | 1,545 | ||||||||||||||||||||
|
|
|
|
|
|
|
|
|
|
|
|
|
| |||||||||||||||
Non-interest expense | ||||||||||||||||||||||||||||
Employee compensation and benefits | 505 | 512 | 527 | (160 | ) | 1,074 | 1,544 | 2,979 | ||||||||||||||||||||
Advertising and business promotion | 76 | 88 | 26 | 56 | 109 | 190 | 237 | |||||||||||||||||||||
Professional fees | (826 | ) | 765 | 378 | 881 | 1,267 | 317 | 2,193 | ||||||||||||||||||||
(Gain)/loss on sale of real estate | — | (16 | ) | (175 | ) | — | — | (191 | ) | 610 | ||||||||||||||||||
Asset Impairments | 444 | 706 | 2,347 | — | 66 | 3,497 | 766 | |||||||||||||||||||||
Other | 333 | 451 | 329 | 328 | 385 | 1,113 | 1,153 | |||||||||||||||||||||
|
|
|
|
|
|
|
|
|
|
|
|
|
| |||||||||||||||
Non-interest expense | 532 | 2,506 | 3,432 | 1,105 | 2,901 | 6,470 | 7,938 | |||||||||||||||||||||
|
|
|
|
|
|
|
|
|
|
|
|
|
| |||||||||||||||
Loss from parent company activitiesbefore income taxes | (3,721 | ) | (7,566 | ) | (6,517 | ) | (4,553 | ) | (7,515 | ) | (17,804 | ) | (22,287 | ) | ||||||||||||||
Provision (benefit) for income taxes | — | — | — | — | — | — | — | |||||||||||||||||||||
|
|
|
|
|
|
|
|
|
|
|
|
|
| |||||||||||||||
Net loss from parent company business segment | $ | (3,721 | ) | (7,566 | ) | (6,517 | ) | (4,553 | ) | (7,515 | ) | (17,804 | ) | (22,287 | ) | |||||||||||||
|
|
|
|
|
|
|
|
|
|
|
|
|
| |||||||||||||||
Parent Company Business Segment
Condensed Statements of Financial Condition – Unaudited
| As of | ||||||||||||||||||||
| (in thousands) | 9/30/2011 | 6/30/2011 | 3/31/2011 | 12/31/2010 | 9/30/2010 | |||||||||||||||
ASSETS | ||||||||||||||||||||
Cash | $ | 2,195 | 3,839 | 13,112 | 12,226 | 12,240 | ||||||||||||||
Securities | 9 | 9 | 1,508 | 1,507 | 1,508 | |||||||||||||||
Investment in subsidiaries | 326,633 | 341,498 | 291,616 | 313,319 | 359,368 | |||||||||||||||
Investment in unconsolidated subsidiaries | 11,655 | 11,174 | 10,742 | 10,361 | 10,027 | |||||||||||||||
Other assets | 931 | 188 | 882 | 945 | 1,635 | |||||||||||||||
|
|
|
|
|
|
|
|
|
| |||||||||||
Total assets | $ | 341,423 | 356,708 | 317,860 | 338,358 | 384,778 | ||||||||||||||
|
|
|
|
|
|
|
|
|
| |||||||||||
LIABILITIES AND STOCKHOLDERS’ EQUITY | ||||||||||||||||||||
Subordinated debentures and notes payable | $ | 333,333 | 329,643 | 325,974 | 322,385 | 318,802 | ||||||||||||||
Other liabilities | 1,034 | 1,357 | 1,123 | 1,687 | 2,314 | |||||||||||||||
|
|
|
|
|
|
|
|
|
| |||||||||||
Total liabilities | 334,367 | 331,000 | 327,097 | 324,072 | 321,116 | |||||||||||||||
|
|
|
|
|
|
|
|
|
| |||||||||||
Stockholders’ equity | 7,056 | 25,708 | (9,237 | ) | 14,286 | 63,662 | ||||||||||||||
|
|
|
|
|
|
|
|
|
| |||||||||||
Total liabilities and stockholders’ equity | $ | 341,423 | 356,708 | 317,860 | 338,358 | 384,778 | ||||||||||||||
|
|
|
|
|
|
|
|
|
| |||||||||||
Parent Company Business Segment
Allowance for Loan Loss and Credit Quality
Parent Company and Work-out Subsidiary (in thousands) | For the | |||||||||||||||||||||||||||
| For the Three Months Ended | Nine Months Ended | |||||||||||||||||||||||||||
| 9/30/2011 | 6/30/2011 | 3/31/2011 | 12/31/2010 | 9/30/2010 | 9/30/2011 | 9/30/2010 | ||||||||||||||||||||||
Allowance for Loan Losses | ||||||||||||||||||||||||||||
Beginning balance | $ | — | 814 | 830 | 4,187 | 7,227 | 830 | 13,630 | ||||||||||||||||||||
Net charge-offs (recoveries) | 20 | (1,329 | ) | 4 | (3,741 | ) | (4,438 | ) | (1,305 | ) | (14,481 | ) | ||||||||||||||||
Transfer to held for sale | — | — | — | (114 | ) | — | — | — | ||||||||||||||||||||
Provision (recovery) for loan losses | 147 | 515 | (20 | ) | 498 | 1,398 | 642 | 5,038 | ||||||||||||||||||||
|
|
|
|
|
|
|
|
|
|
|
|
|
| |||||||||||||||
Ending balance | $ | 167 | — | 814 | 830 | 4,187 | 167 | 4,187 | ||||||||||||||||||||
|
|
|
|
|
|
|
|
|
|
|
|
|
| |||||||||||||||
| As of | ||||||||||||||||||||
| 9/30/2011 | 6/30/2011 | 3/31/2011 | 12/31/2010 | 9/30/2010 | ||||||||||||||||
Credit Quality | ||||||||||||||||||||
Total Loans – gross | $ | 11,879 | 11,974 | 14,058 | 17,300 | 22,793 | ||||||||||||||
|
|
|
|
|
|
|
|
|
| |||||||||||
Nonaccrual loans | $ | 9,356 | 9,360 | 11,360 | 14,508 | 19,916 | ||||||||||||||
Specific reserves | (167 | ) | — | (814 | ) | (830 | ) | (4,187 | ) | |||||||||||
|
|
|
|
|
|
|
|
|
| |||||||||||
Nonaccrual loans, net | $ | 9,189 | 9,360 | 10,546 | 13,678 | 15,729 | ||||||||||||||
Real estate owned | 9,391 | 8,644 | 8,835 | 10,160 | 9,766 | |||||||||||||||
|
|
|
|
|
|
|
|
|
| |||||||||||
Total nonperforming assets | $ | 18,580 | 18,004 | 19,381 | 23,838 | 25,495 | ||||||||||||||
|
|
|
|
|
|
|
|
|
| |||||||||||
16

BankAtlantic (Bank Operations Business Segment)
Supplemental Graphs
Third Quarter 2011
Release Date: November 2, 2011
This information is preliminary, unaudited and based on data available at the time of the release.
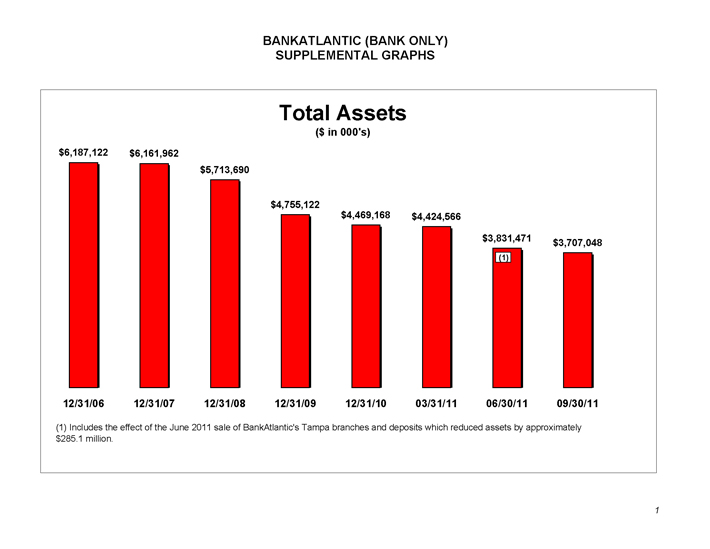
BANKATLANTIC (BANK ONLY) SUPPLEMENTAL GRAPHS Total Assets($ in 000’s) $6,187,122 $6,161,962$5,713,690$4,755,122$4,469,168 $4,424,566$3,831,471 $3,707,04812/31/06 12/31/07 12/31/08 12/31/09 12/31/10 03/31/11 06/30/11 09/30/11(1) Includes the effect of the June 2011 sale of BankAtlantic’s Tampa branches and deposits which reduced assets by approximately $285.1 million.(1)1
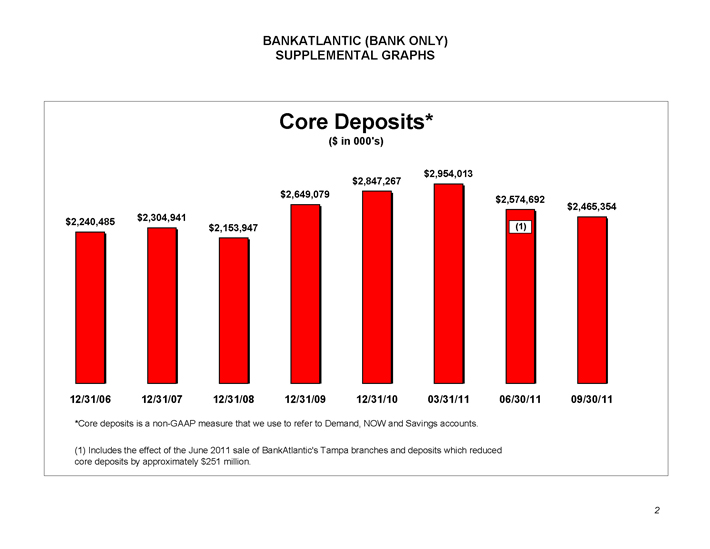
BANKATLANTIC (BANK ONLY) SUPPLEMENTAL GRAPHS Core Deposits*($ in 000’s) $2,240,485 $2,304,941$2,153,947$2,649,079$2,847,267$2,574,692$2,465,354$2,954,01312/31/06 12/31/07 12/31/08 12/31/09 12/31/10 03/31/11 06/30/11 09/30/11(1) *Core deposits is a non-GAAP measure that we use to refer to Demand, NOW and Savings accounts. (1) Includes the effect of the June 2011 sale of BankAtlantic’s Tampa branches and deposits which reduced core deposits by approximately $251 million.2
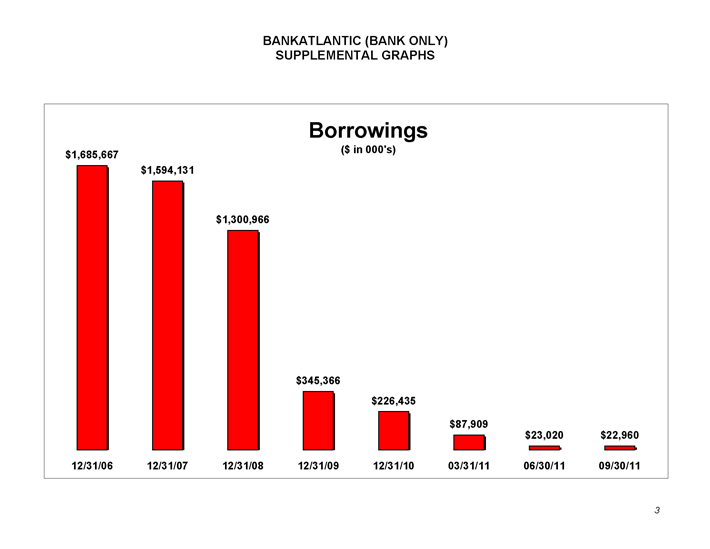
BANKATLANTIC (BANK ONLY) SUPPLEMENTAL GRAPHS Borrowings $1,685,667 ($ in 000’s) $1,594,131 $1,300,966 $345,366 $226,435 $87,909 $23,020 $22,96012/31/06 12/31/07 12/31/08 12/31/09 12/31/10 03/31/11 06/30/11 09/30/113
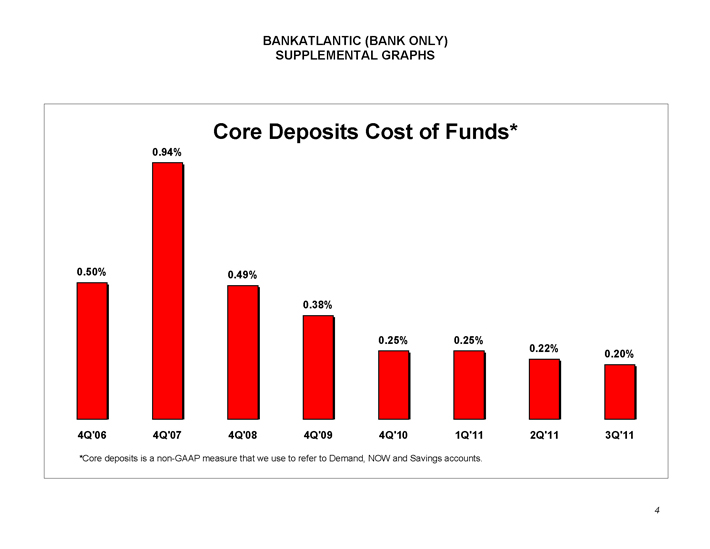
BANKATLANTIC (BANK ONLY) SUPPLEMENTAL GRAPHS Core Deposits Cost of Funds *0.50% 0.94% 0.49% 0.38% 0.25% 0.25% 0.22% 0.20%4Q’ 06 4Q’07 4Q’08 4Q’09 4Q’10 1Q’11 2Q’11 3Q’11*Core deposits is a non-GAAP measure that we use to refer to Demand, NOW and Savings accounts.4
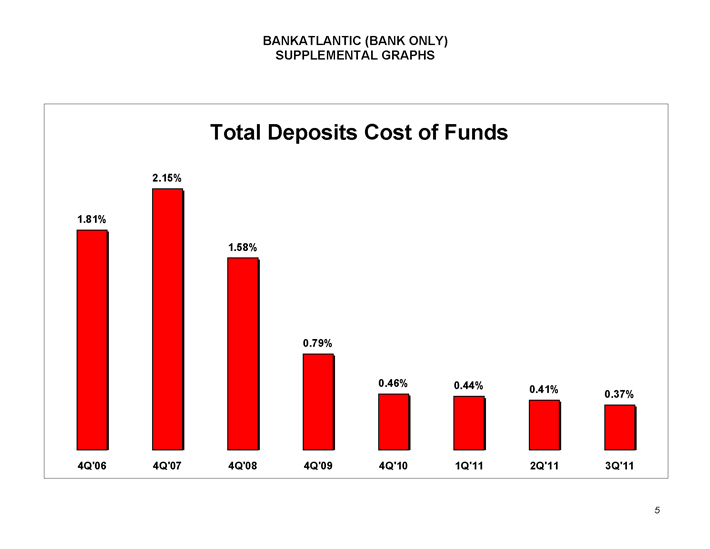
BANKATLANTIC (BANK ONLY) SUPPLEMENTAL GRAPHS Total Deposits Cost of Funds 1.81% 2.15% 1.58% 0.79% 0.46% 0.44% 0.41% 0.37%4Q’06 4Q’07 4Q’08 4Q’09 4Q’10 1Q’11 2Q’11 3Q’115
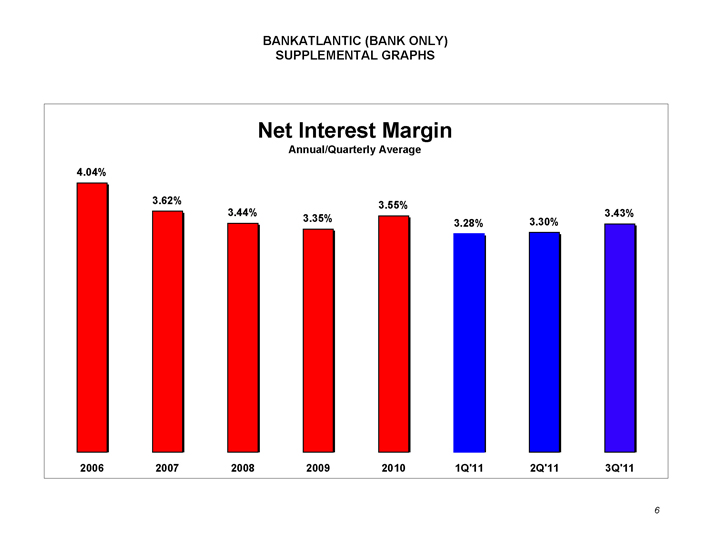
BANKATLANTIC (BANK ONLY) SUPPLEMENTAL GRAPHS Net Interest Margin Annual/Quarterly Average 4.04%3.62%3.44% 3.35%3.55%3.28% 3.30%3.43%2006 2007 2008 2009 2010 1Q’11 2Q’11 3Q’116
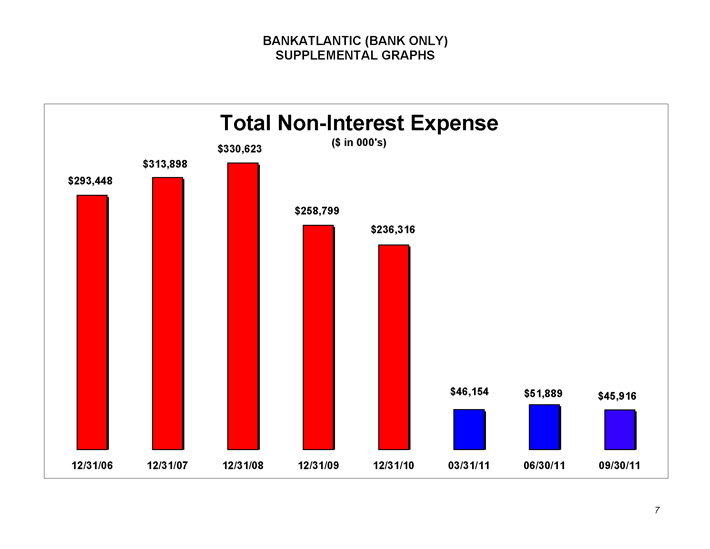
BANKATLANTIC (BANK ONLY) SUPPLEMENTAL GRAPHS Total Non-Interest Expense($ in 000’s) $293,448 $313,898 $330,623 $258,799 $236,316 $46,154 $51,889 $45,916 12/31/06 12/31/07 12/31/08 12/31/09 12/31/10 03/31/11 06/30/11 09/30/117
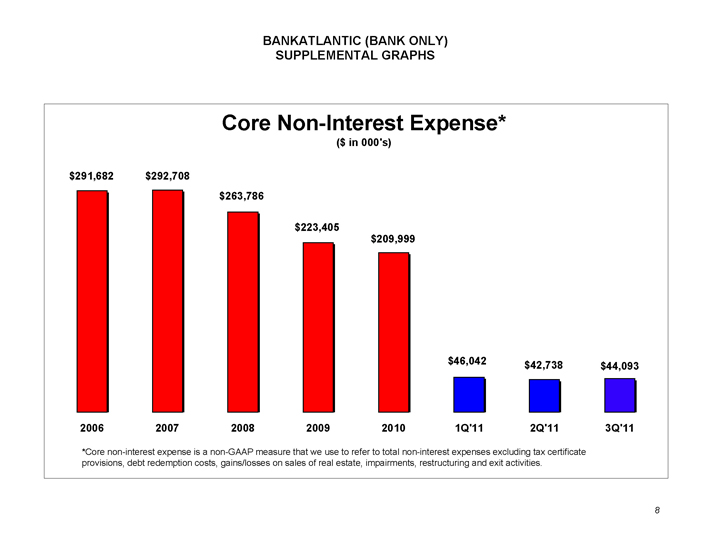
BANKATLANTIC (BANK ONLY) SUPPLEMENTAL GRAPHS Core Non-Interest Expense*($ in 000’s) $291,682 $292,708 $263,786 $223,405 $209,999 $46,042 $42,738 $44,093 2006 2007 2008 2009 2010 1Q’11 2Q’11 3Q’11 * Core non-interest expense is a non-GAAP measure that we use to refer to total non-interest expenses excluding tax certificate provisions, debt redemption costs, gains/losses on sales of real estate, impairments, restructuring and exit activities. 8
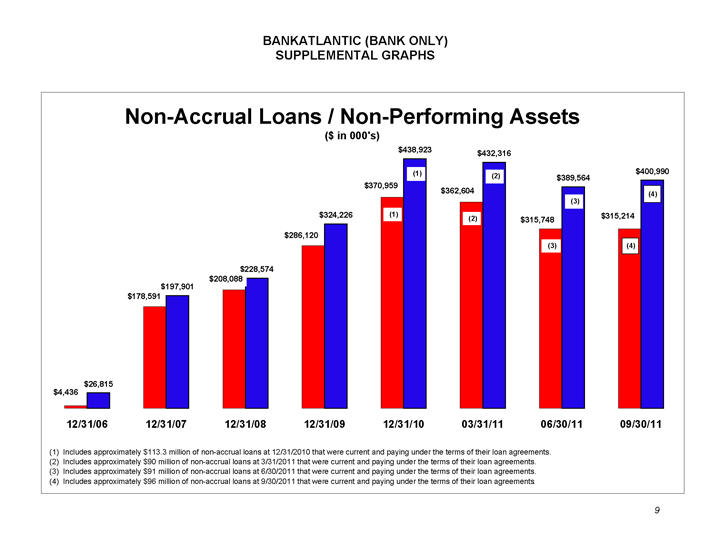
BANKATLANTIC (BANK ONLY) SUPPLEMENTAL GRAPHS Non-Accrual Loans / Non-Performing Assets($ in 000’s) $26,815 $197,901 $228,574 $324,226 $438,923 $432,316 $389,564 $400,990 $4,436 $178,591 $208,088 $286,120 $370,959 $362,604 $315,748 $315,214 12/31/06 12/31/07 12/31/08 12/31/09 12/31/10 03/31/11 06/30/11 09/30/11 (2)(1) Includes approximately $113.3 million of non-accrual loans at 12/31/2010 that were current and paying under the terms of their loan agreements. (2) Includes approximately $90 million of non-accrual loans at 3/31/2011 that were current and paying under the terms of their loan agreements. (3) Includes approximately $91 million of non-accrual loans at 6/30/2011 that were current and paying under the terms of their loan agreements. (4) Includes approximately $96 million of non-accrual loans at 9/30/2011 that were current and paying under the terms of their loan agreements. (1)(1) (2)(3)(3)(4)(4)9
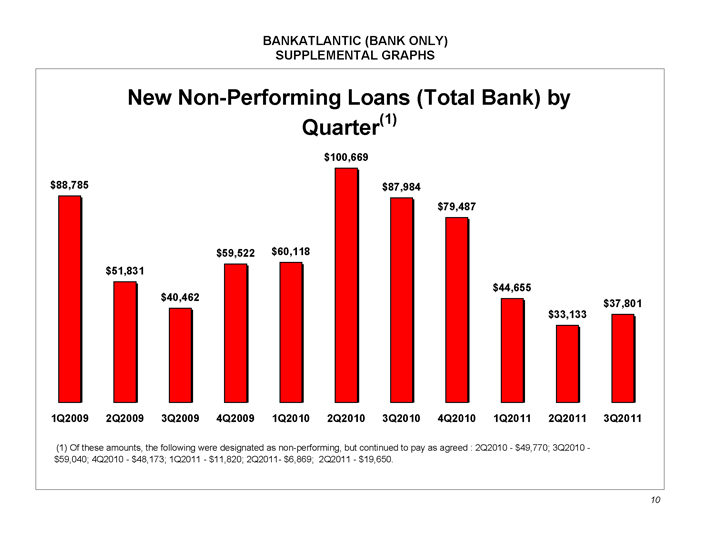
BANKATLANTIC (BANK ONLY) SUPPLEMENTAL GRAPHS $88,785 $51,831 $40,462 $59,522 $60,118 $100,669 $87,984 $79,487 $44,655 $33,133 $37,801 1Q 2009 2Q 2009 3Q 2009 4Q 2009 1Q 2010 2Q 2010 3Q 2010 4Q 2010 1Q 2011 2Q 2011 3Q 2011 New Non-Performing Loans (Total Bank) by Quarter(1)(1) Of these amounts, the following were designated as non-performing, but continued to pay as agreed : 2Q 2010—$49,770; 3Q 2010 -$59,040; 4Q 2010—$48,173; 1Q 2011—$11,820; 2Q 2011- $6,869; 2Q 2011—$19,650.10
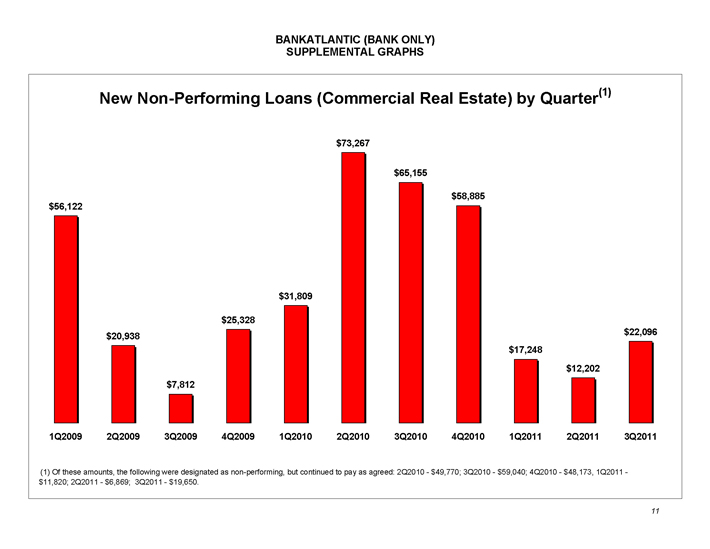
BANKATLANTIC (BANK ONLY) SUPPLEMENTAL GRAPHS $56,122 $20,938 $7,812 $25,328 $31,809 $73,267 $65,155 $58,885 $17,248 $12,202 $22,096 1Q2009 2Q2009 3Q2009 4Q2009 1Q2010 2Q2010 3Q2010 4Q2010 1Q2011 2Q2011 3Q2011New Non-Performing Loans (Commercial Real Estate) by Quarter(1)(1) Of these amounts, the following were designated as non-performing, but continued to pay as agreed: 2Q2010—$49,770; 3Q2010—$59,040; 4Q2010—$48,173, 1Q2011 -$11,820; 2Q2011—$6,869; 3Q2011—$19,650.11
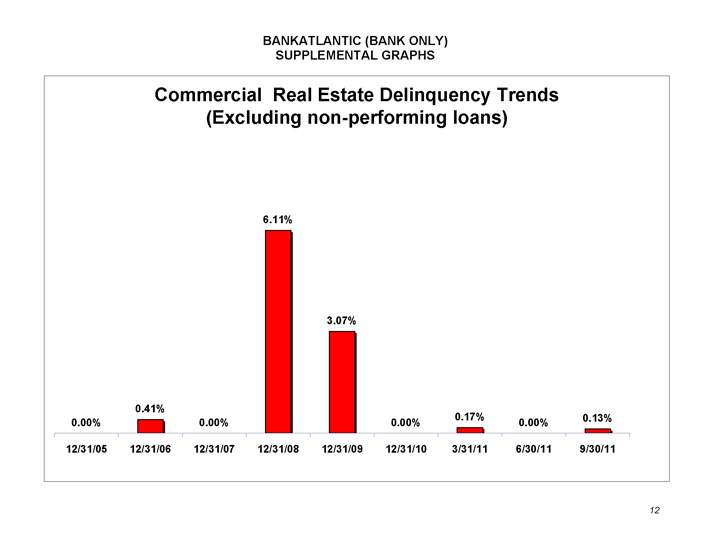
BANKATLANTIC (BANK ONLY) SUPPLEMENTAL GRAPHS 0.00% 0.41% 0.00% 6.11% 3.07% 0.00% 0.17% 0.00% 0.13% 12/31/05 12/31/06 12/31/07 12/31/08 12/31/09 12/31/10 3/31/11 6/30/11 9/30/11 Commercial Real Estate Delinquency Trends (Excluding non-performing loans) 12
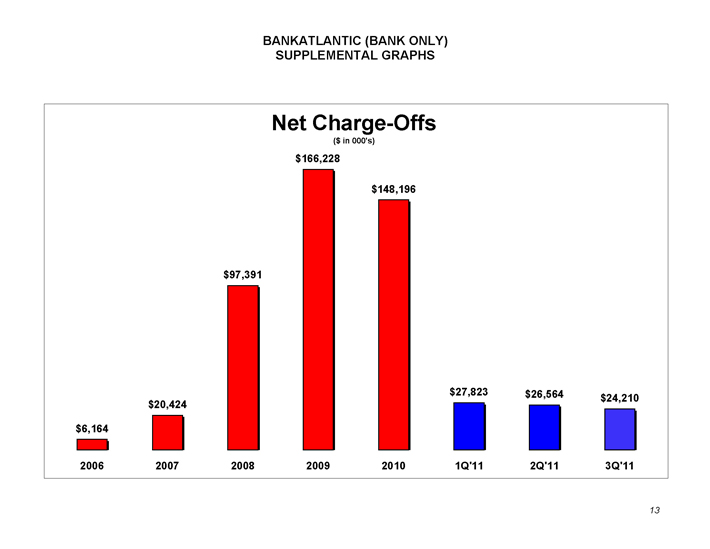
BANKATLANTIC (BANK ONLY) SUPPLEMENTAL GRAPHS Net Charge-Offs($ in 000’s) $6,164 $20,424 $97,391 $148,196 $27,823 $26,564 $166,228 $24,210 2006 2007 2008 2009 2010 1Q’11 2Q’11 3Q’1113
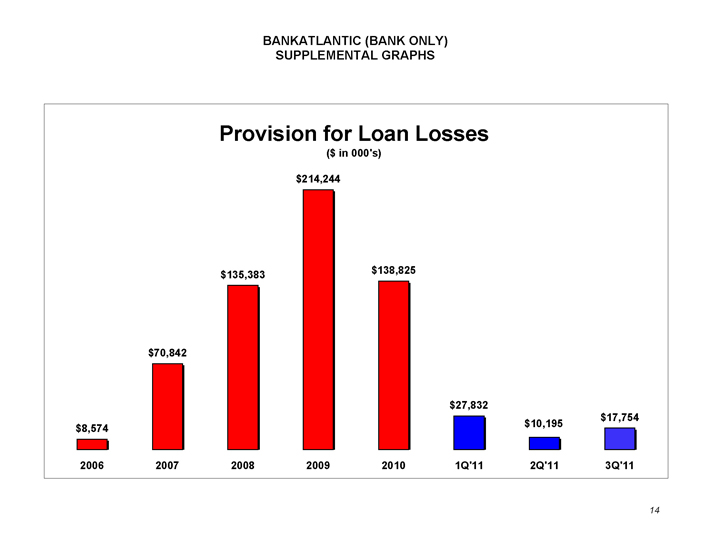
BANKATLANTIC (BANK ONLY) SUPPLEMENTAL GRAPHS Provision for Loan Losses($ in 000’s) $8,574 $70,842 $135,383 $214,244 $138,825 $27,832 $10,195 $17,754 2006 2007 2008 2009 2010 1Q’11 2Q’11 3Q’1114
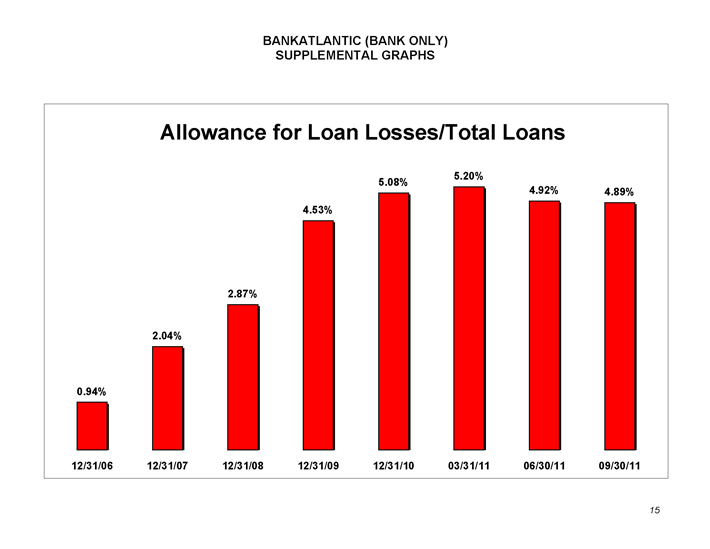
BANKATLANTIC (BANK ONLY) SUPPLEMENTAL GRAPHS Allowance for Loan Losses/Total Loans 0.94% 2.04% 2.87% 4.53% 5.08% 5.20% 4.92% 4.89% 12/31/06 12/31/07 12/31/08 12/31/09 12/31/10 03/31/11 06/30/11 09/30/1115
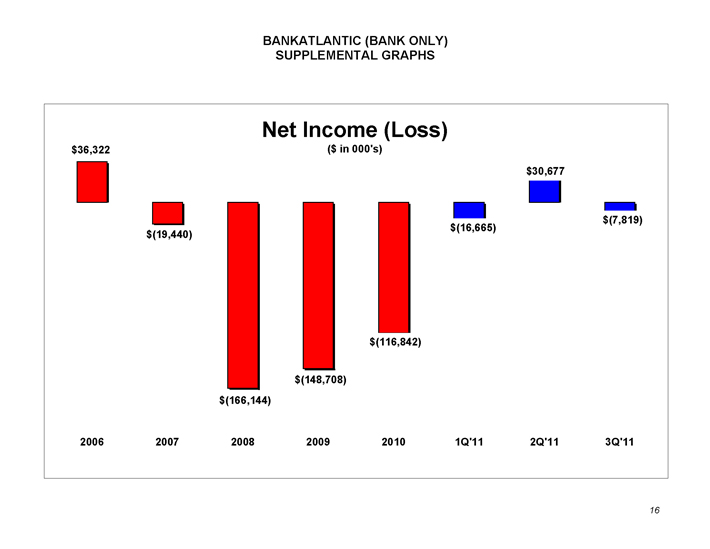
BANKATLANTIC (BANK ONLY) SUPPLEMENTAL GRAPHS Net Income (Loss) $36,322 ($ in 000’s) $(19,440) $(166,144) $(148,708) $(116,842) $(16,665) $30,677 $(7,819) 2006 2007 2008 2009 2010 1Q’11 2Q’11 3Q’1116
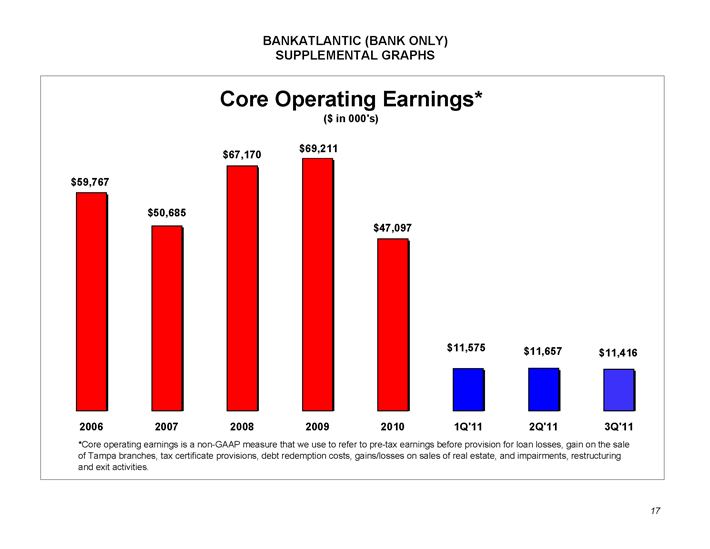
BANKATLANTIC (BANK ONLY) SUPPLEMENTAL GRAPHS Core Operating Earnings* ($ in 000’s) $59,767 $50,685 $67,170 $69,211 $47,097 $11,575 $11,657 $11,416 2006 2007 2008 2009 2010 1Q’11 2Q’11 3Q’11 *Core operating earnings is a non-GAAP measure that we use to refer to pre-tax earnings before provision for loan losses, gain on the sale of Tampa branches, tax certificate provisions, debt redemption costs, gains/losses on sales of real estate, and impairments, restructuring and exit activities. 17
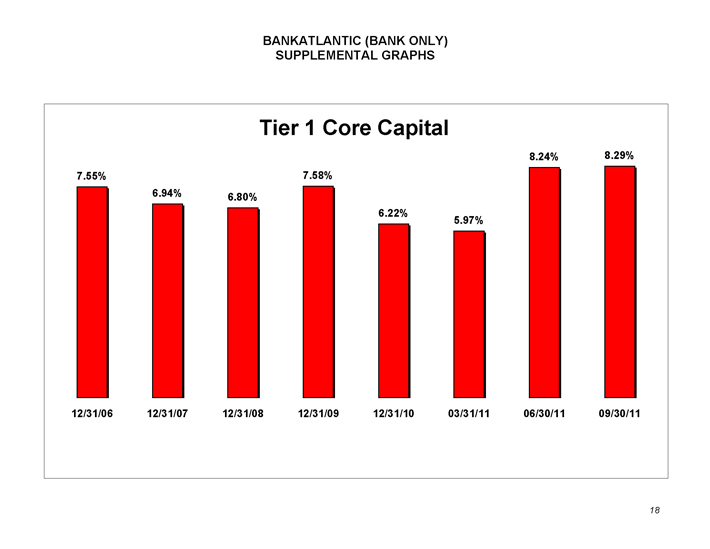
BANKATLANTIC (BANK ONLY) SUPPLEMENTAL GRAPHS Tier 1 Core Capital 7.55% 6.94% 6.80% 7.58% 6.22% 5.97% 8.24% 8.29%12/31/06 12/31/07 12/31/08 12/31/09 12/31/10 03/31/11 06/30/11 09/30/1118
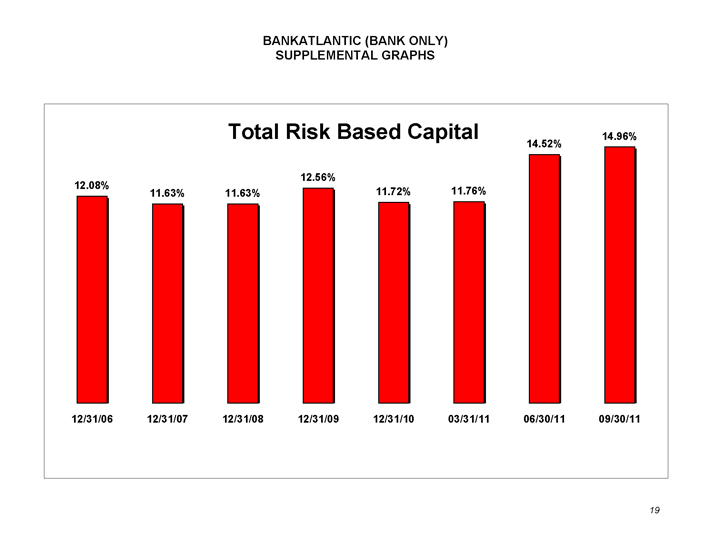
BANKATLANTIC (BANK ONLY) SUPPLEMENTAL GRAPHS Total Risk Based Capital 12.08%11.63% 11.63%12.56%11.72% 11.76%14.52%14.96%12/31/06 12/31/07 12/31/08 12/31/09 12/31/10 03/31/11 06/30/11 09/30/1119