Exhibit (c)(3)
|
July 26th, 2016
Presentation Prepared for the Board of Directors:
|
General Information and Limitations
This presentation (this “Presentation”) has been prepared by Keefe, Bruyette & Woods, Inc. (“KBW”) for the exclusive use of the Board of Directors (the “Board”) of BFC Financial Corporations (“BFC” or the “Company”) in connection with KBW’s presentation to the Board at a meeting to be held on July 26, 2016.
This Presentation contains information obtained from publicly available sources and from materials provided to KBW by the Company and BBX Capital Corporation (“BBX”). In conducting our analyses, we have, with the consent of the Company, assumed and relied upon, without independent verification, the accuracy and completeness of all of the financial and other information reviewed by us, and we have not assumed any responsibility or liability for independent verification of, or the accuracy or completeness of, such information. KBW did not conduct any independent verification or any appraisal or physical inspection of properties, assets or liabilities or evaluate the solvency, financial capability or fair value of the Company or BBX under any state or federal laws, including those relating to bankruptcy, insolvency or other matters, and is not expressing a view or opining as to the terms of the proposed merger or any related transaction undertaken by the Company. We have further assumed that all financial and operating forecasts, estimates and projections, including those relating to Bluegreen Corp. (“Bluegreen”) and pro forma effects on BBX of the merger that were prepared and provided to us by BFC and BBX managements, and that were used by and relied upon by us, have been reasonably prepared by such managements on bases reflecting the best currently available estimates and judgments of such managements as to the future financial performance of BFC, BBX and Bluegreen or as to the pro forma effects of the merger, as the case may be. We have further assumed that such forecast estimates and projections, as well as third party real estate appraisals provided to us by BBX management, provide a reasonable basis upon which we could prepare the Presentation. We express no view as to any of the foregoing information or the assumptions or bases therefor.
This Presentation is based upon economic, market and other conditions as they exist and can be evaluated as of its date (or such other dates as reflected therein) and utilizes several analyses and techniques. KBW did not attribute any particular weight to any analysis or factor. KBW believes that its analyses must be considered as a whole and that selecting portions of such analyses and the factors considered by it, without considering all such analyses and factors, could create an incomplete view of the process underlying its conclusions. Any analysis of this type is subject to uncertainties and contingencies all of which are difficult to predict and are beyond the control of the firm preparing the analysis. It is understood that KBW does not have an obligation to replicate, revise or reaffirm this Presentation.
This Presentation and the information contained herein have been prepared solely for the Board and may not be used by any other person without the express prior written consent of KBW. Any party receiving these materials (other than the Board) is not authorized to rely on these materials for any purpose. The Company acknowledges that it shall not disclose to any person the existence of this Presentation, any view expressed by KBW in connection herewith (in writing or otherwise) or any portion hereof or thereof, or KBW’s engagement, without KBW’s express written consent. This Presentation, and the materials and financial models used by KBW in preparing this Presentation, have been developed by and are proprietary to KBW and are protected under applicable copyright laws. Not in limitation of any of the foregoing, any recipient thereof, by virtue of such receipt, agrees that it will not reproduce, distribute or make publicly available all or any portion of this Presentation or such models or other materials contained therein without the prior written consent of KBW.
2
|
KBW Disclosure
• KBW has acted exclusively for the Board in rendering this Presentation and will receive a fee from BFC for its services, payable in full upon the rendering of this Presentation
• This Presentation does not in any respect constitute a “fairness opinion” or other opinion or recommendation to any person or entity, including the Board, with respect to the proposed merger or any related transaction
• KBW has relied upon the accuracy and completeness of all financial and other information provided to us or publicly available and KBW has not independently verified the accuracy or completeness of any such information or assumed any responsibility or liability for such verification, accuracy, or completeness
• In addition to this engagement and an ongoing engagement of a KBW investment banking affiliate by an affiliate of BFC and BBX to serve as financial advisor in connection with a potential transaction, in the past two years, KBW has provided investment banking and financial advisory services to BFC and received compensation for such services. A commercial bank affiliate of KBW is also a lender to BFC under an existing revolving credit facility
• In the past two years, KBW has not provided investment banking and financial advisory services to BBX
• A senior member of the KBW bank team providing services to BFC in connection with this engagement owns shares of BFC common stock and BBX capital stock
• KBW may in the future provide investment banking advice to BFC, BBX and their affiliates and receive compensation for such services
3
|
Table of Contents
Section Tab
Implied Exchange Ratio / Equity Value Analyses
– Going Concern Value Based Approach1
– Book Value Based Approach2
– BFC and BBX Public Stock Price Based Approach3
– Summary of Approaches4
4
|
Implied Exchange Ratio / Equity Value Analyses
|
Going Concern Value Based Approach
|
Going Concern Value Based Approach
General Approach
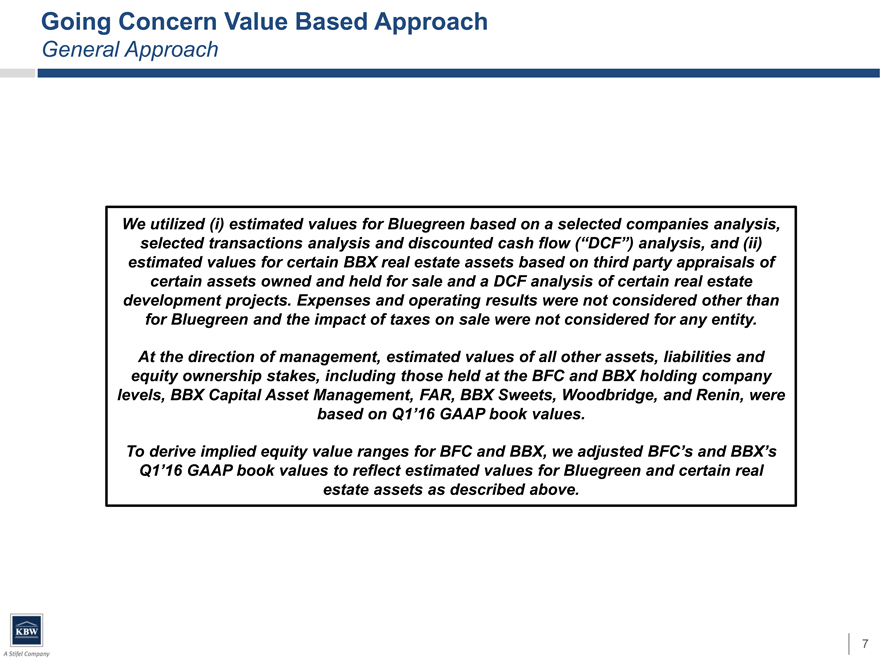
We utilized (i) estimated values for Bluegreen based on a selected companies analysis,
selected transactions analysis and discounted cash flow (“DCF”) analysis, and (ii)
estimated values for certain BBX real estate assets based on third party appraisals of
certain assets owned and held for sale and a DCF analysis of certain real estate
development projects. Expenses and operating results were not considered other than
for Bluegreen and the impact of taxes on sale were not considered for any entity.
At the direction of management, estimated values of all other assets, liabilities and
equity ownership stakes, including those held at the BFC and BBX holding company
levels, BBX Capital Asset Management, FAR, BBX Sweets, Woodbridge, and Renin, were
based on Q1’16 GAAP book values.
To derive implied equity value ranges for BFC and BBX, we adjusted BFC’s and BBX’s
Q1’16 GAAP book values to reflect estimated values for Bluegreen and certain real
estate assets as described above.
7
|
Going Concern Value Based Approach
Bluegreen
Methodology References / Assumptions Selected Metrics
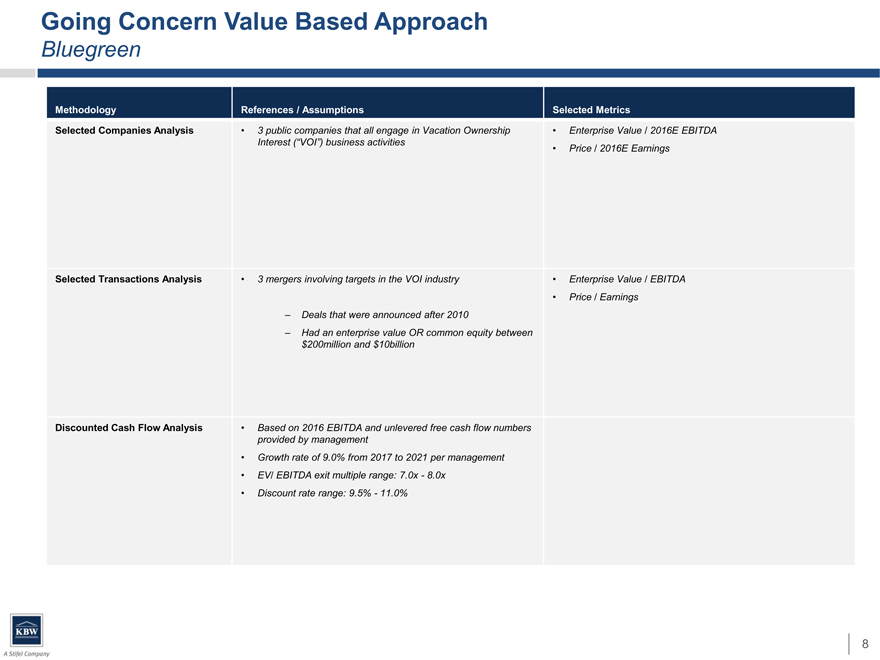
Selected Companies Analysis • 3 public companies that all engage in Vacation Ownership• Enterprise Value / 2016E EBITDA
Interest (“VOI”) business activities• Price / 2016E Earnings
Selected Transactions Analysis • 3 mergers involving targets in the VOI industry• Enterprise Value / EBITDA
• Price / Earnings
–Deals that were announced after 2010
–Had an enterprise value OR common equity between
$200million and $10billion
Discounted Cash Flow Analysis • Based on 2016 EBITDA and unlevered free cash flow numbers
provided by management
Growth rate of 9.0% from 2017 to 2021 per management
EV/ EBITDA exit multiple range: 7.0x—8.0x
Discount rate range: 9.5%—11.0%
8
|
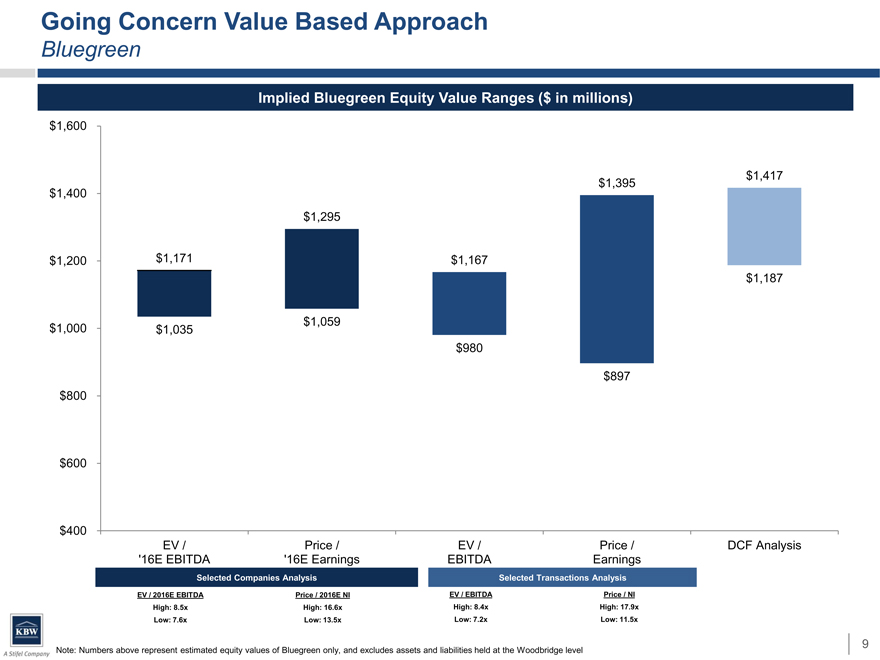
Going Concern Value Based Approach
Bluegreen
Implied Bluegreen Equity Value Ranges ($ in millions)
$1,600
$1,395$1,417
$1,400
$1,295
$1,200 $1,171$1,167
$1,187
$1,000 $1,035$1,059
$980
$897
$800
$600
$400
EV /Price /EV /Price /DCF Analysis
‘16E EBITDA ’16E EarningsEBITDAEarnings
Selected Companies AnalysisSelected Transactions Analysis
EV / 2016E EBITDA Price / 2016E NIEV / EBITDAPrice / NI
High: 8.5x High: 16.6xHigh: 8.4xHigh: 17.9x
Low: 7.6x Low: 13.5xLow: 7.2xLow: 11.5x
Note: Numbers above represent estimated equity values of Bluegreen only, and excludes assets and liabilities held at the Woodbridge level
9
|
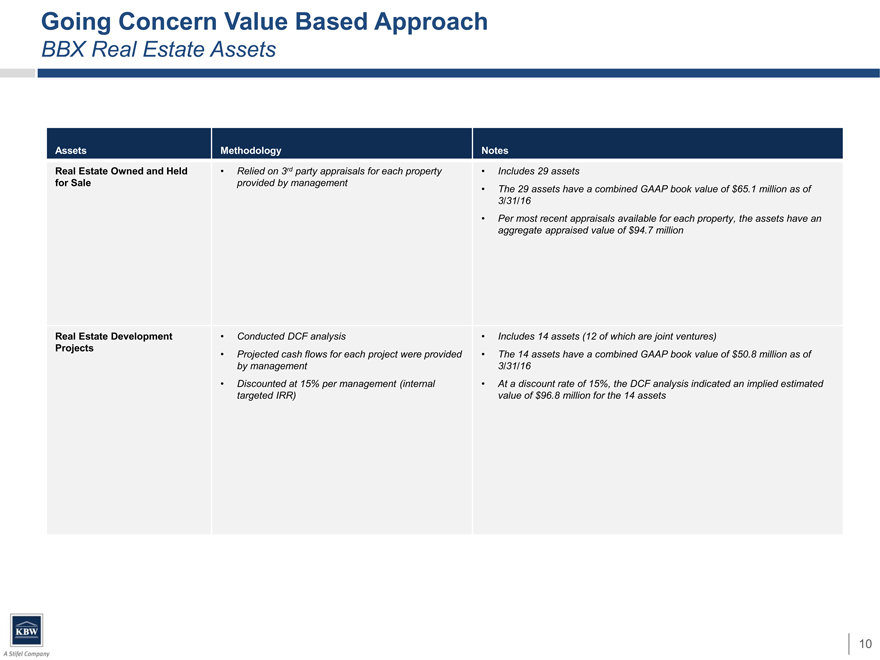
Going Concern Value Based Approach
BBX Real Estate Assets
Assets
Methodology
Notes
Real Estate Owned and Held
• Relied on 3rd party appraisals for each property
• Includes 29 assets
for Sale
provided by management
• The 29 assets have a combined GAAP book value of $65.1 million as of
3/31/16
• Per most recent appraisals available for each property, the assets have an
aggregate appraised value of $94.7 million
Real Estate Development
• Conducted DCF analysis
• Includes 14 assets (12 of which are joint ventures)
Projects
• Projected cash flows for each project were provided
• The 14 assets have a combined GAAP book value of $50.8 million as of
by management
3/31/16
• Discounted at 15% per management (internal
• At a discount rate of 15%, the DCF analysis indicated an implied estimated
targeted IRR)
value of $96.8 million for the 14 assets
10
|
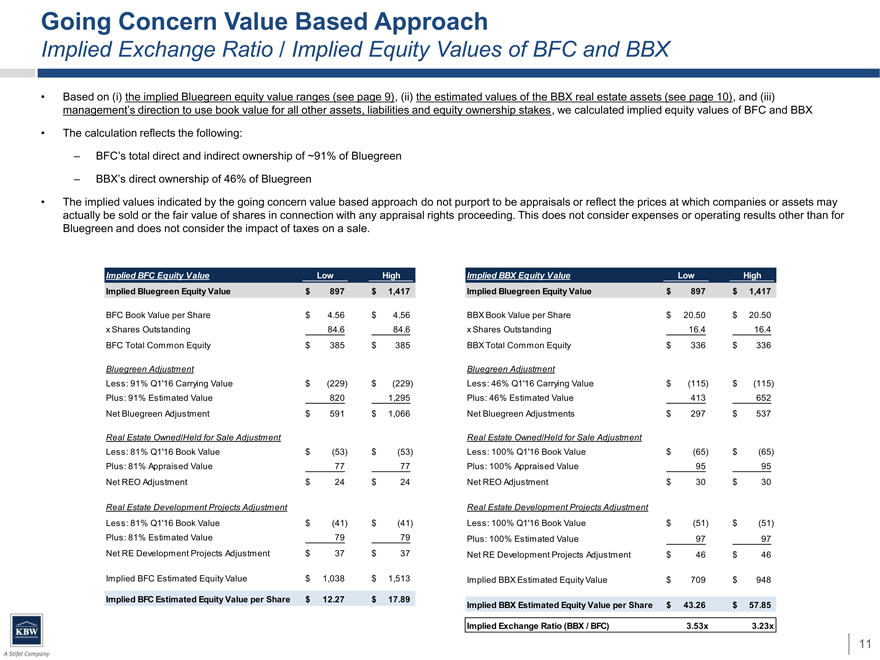
Going Concern Value Based Approach
Implied Exchange Ratio / Implied Equity Values of BFC and BBX
Based on (i) the implied Bluegreen equity value ranges (see page 9), (ii) the estimated values of the BBX real estate assets (see page 10), and (iii) management’s direction to use book value for all other assets, liabilities and equity ownership stakes , we calculated implied equity values of BFC and BBX
The calculation reflects the following:
BFC’s total direct and indirect ownership of ~91% of Bluegreen
BBX’s direct ownership of 46% of Bluegreen
The implied values indicated by the going concern value based approach do not purport to be appraisals or reflect the prices at which companies or assets may actually be sold or the fair value of shares in connection with any appraisal rights proceeding. This does not consider expenses or operating results other than for Bluegreen and does not consider the impact of taxes on a sale.
Implied BFC Equity Value Low HighImplied BBX Equity ValueLowHigh
Implied Bluegreen Equity Value $ 897 $ 1,417Implied Bluegreen Equity Value$ 897$ 1,417
BFC Book Value per Share $ 4.56 $ 4.56BBX Book Value per Share$ 20.50$ 20.50
x Shares Outstanding 84.6 84.6x Shares Outstanding16.416.4
BFC Total Common Equity $ 385 $ 385BBX Total Common Equity$ 336$ 336
Bluegreen Adjustment Bluegreen Adjustment
Less: 91% Q1’16 Carrying Value $ (229) $ (229)Less: 46% Q1’16 Carrying Value$ (115)$ (115)
Plus: 91% Estimated Value 820 1,295Plus: 46% Estimated Value413652
Net Bluegreen Adjustment $ 591 $ 1,066Net Bluegreen Adjustments$ 297$ 537
Real Estate Owned/Held for Sale Adjustment Real Estate Owned/Held for Sale Adjustment
Less: 81% Q1’16 Book Value $ (53) $ (53)Less: 100% Q1’16 Book Value$ (65)$ (65)
Plus: 81% Appraised Value 7777Plus: 100% Appraised Value9595
Net REO Adjustment $24$ 24Net REO Adjustment$30$ 30
Real Estate Development Projects Adjustment Real Estate Development Projects Adjustment
Less: 81% Q1’16 Book Value $ (41) $ (41)Less: 100% Q1’16 Book Value$ (51)$ (51)
Plus: 81% Estimated Value 7979Plus: 100% Estimated Value9797
Net RE Development Projects Adjustment $37$ 37Net RE Development Projects Adjustment$46$ 46
Implied BFC Estimated Equity Value $ 1,038 $ 1,513Implied BBX Estimated Equity Value$ 709$ 948
Implied BFC Estimated Equity Value per Share $ 12.27 $ 17.89
Implied BBX Estimated Equity Value per Share$ 43.26$ 57.85
Implied Exchange Ratio (BBX / BFC)3.53x3.23x
11
|
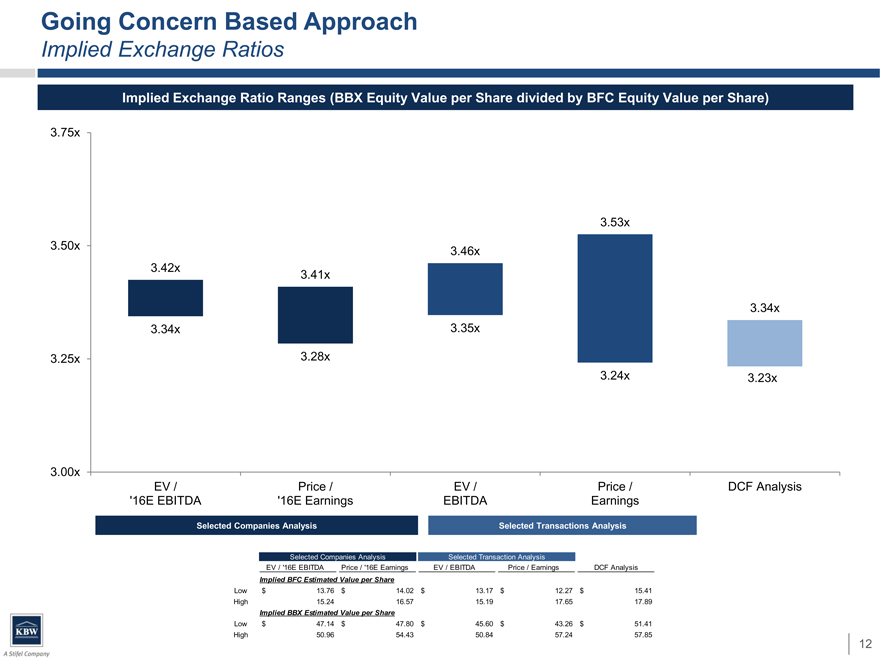
Going Concern Based Approach
Implied Exchange Ratios
Implied Exchange Ratio Ranges (BBX Equity Value per Share divided by BFC Equity Value per Share)
3.75x
3.53x
3.50x 3.46x
3.42x 3.41x
3.34x
3.34x 3.35x
3.25x 3.28x
3.24x3.23x
3.00x
EV / Price /EV /Price /DCF Analysis
‘16E EBITDA ’16E EarningsEBITDAEarnings
Selected Companies Analysis Selected Transactions Analysis
Selected Companies AnalysisSelected Transaction Analysis
EV / ‘16E EBITDAPrice / ‘16E EarningsEV / EBITDAPrice / EarningsDCF Analysis
Implied BFC Estimated Value per Share
Low $13.76$14.02$13.17$12.27$15.41
High 15.2416.5715.1917.6517.89
Implied BBX Estimated Value per Share
Low $47.14$47.80$45.60$43.26$51.41
High 50.9654.4350.8457.2457.85
12
|
Going Concern Value Based Approach: Supporting Detail
|
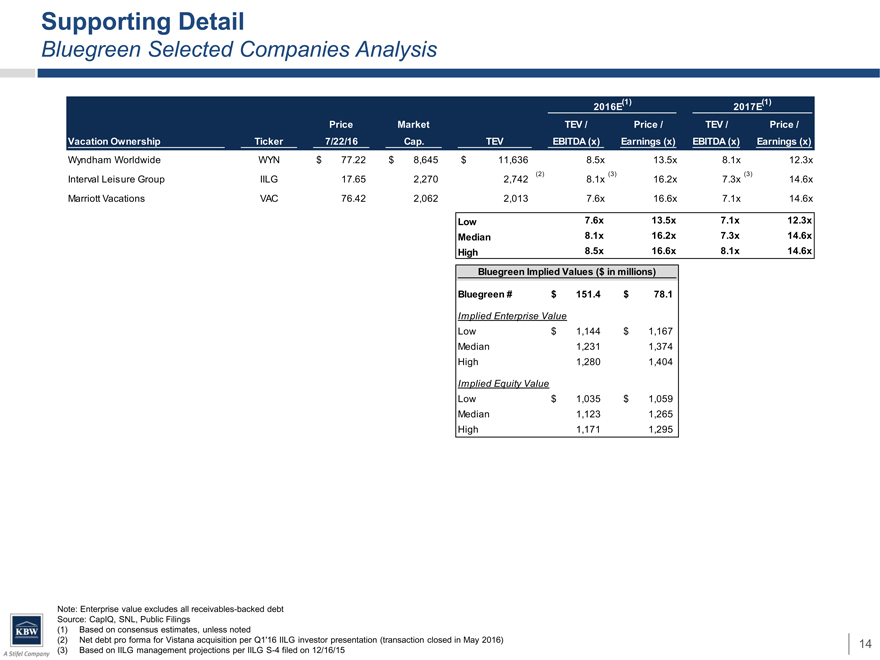
Supporting Detail
Bluegreen Selected Companies Analysis
2016E(1)2017E(1)
PriceMarketTEV /Price /TEV /Price /
Vacation Ownership Ticker 7/22/16Cap.TEVEBITDA (x)Earnings (x)EBITDA (x)Earnings (x)
Wyndham Worldwide WYN $ 77.22$ 8,645$11,6368.5x13.5x8.1x12.3x
Interval Leisure Group IILG 17.652,2702,742 (2)8.1x (3)16.2x7.3x (3)14.6x
Marriott Vacations VAC 76.422,0622,0137.6x16.6x7.1x14.6x
Low7.6x13.5x7.1x12.3x
Median8.1x16.2x7.3x14.6x
High8.5x16.6x8.1x14.6x
Bluegreen Implied Values ($in millions)
Bluegreen #$151.4$78.1
Implied Enterprise Value
Low$1,144$1,167
Median1,2311,374
High1,2801,404
Implied Equity Value
Low$1,035$1,059
Median1,1231,265
High1,1711,295
Note: Enterprise value excludes all receivables-backed debt Source: CapIQ, SNL, Public Filings (1) Based on consensus estimates, unless noted
(2) Net debt pro forma for Vistana acquisition per Q1’16 IILG investor presentation (transaction closed in May 2016) (3) Based on IILG management projections per IILG S-4 filed on 12/16/15
14
|
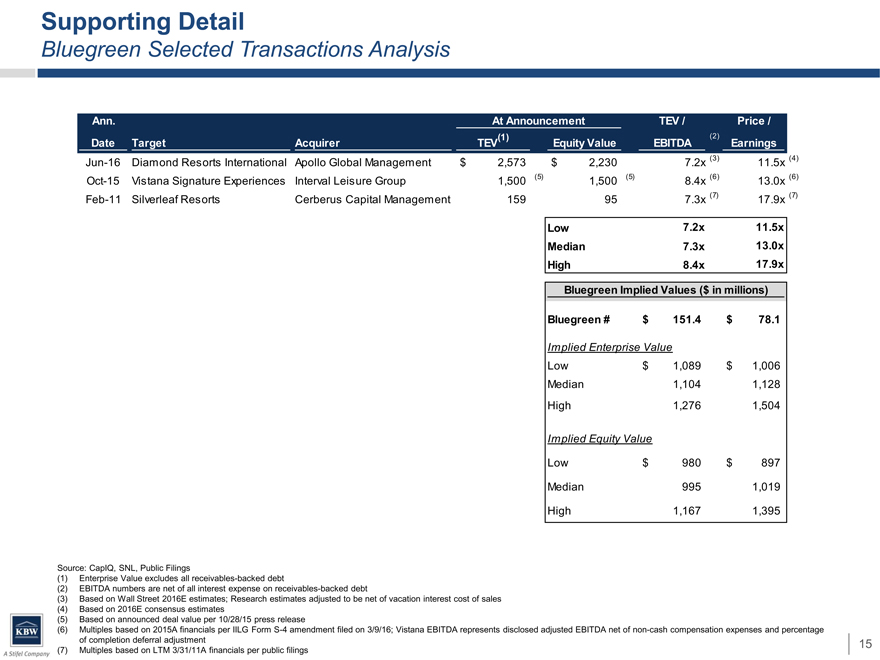
Supporting Detail
Bluegreen Selected Transactions Analysis
Ann. At AnnouncementTEV /Price /
(1)(2)
Date Target AcquirerTEVEquity ValueEBITDAEarnings
Jun-16 Diamond Resorts International Apollo Global Management$2,573$2,2307.2x(3)11.5x(4)
Oct-15 Vistana Signature Experiences Interval Leisure Group1,500(5)1,500 (5)8.4x(6)13.0x(6)
Feb-11 Silverleaf Resorts Cerberus Capital Management159957.3x(7)17.9x(7)
Low7.2x11.5x
Median7.3x13.0x
High8.4x17.9x
Bluegreen Implied Values ($in millions)
Bluegreen #$151.4$ 78.1
Implied Enterprise Value
Low$1,089$ 1,006
Median1,1041,128
High1,2761,504
Implied Equity Value
Low$980$ 897
Median9951,019
High1,1671,395
Source: CapIQ, SNL, Public Filings
(1) Enterprise Value excludes all receivables-backed debt
(2) EBITDA numbers are net of all interest expense on receivables-backed debt
(3) Based on Wall Street 2016E estimates; Research estimates adjusted to be net of vacation interest cost of sales (4) Based on 2016E consensus estimates (5) Based on announced deal value per 10/28/15 press release
(6) Multiples based on 2015A financials per IILG Form S-4 amendment filed on 3/9/16; Vistana EBITDA represents disclosed adjusted EBITDA net of non-cash compensation expenses and percentage of completion deferral adjustment (7) Multiples based on LTM 3/31/11A financials per public filings
15
|
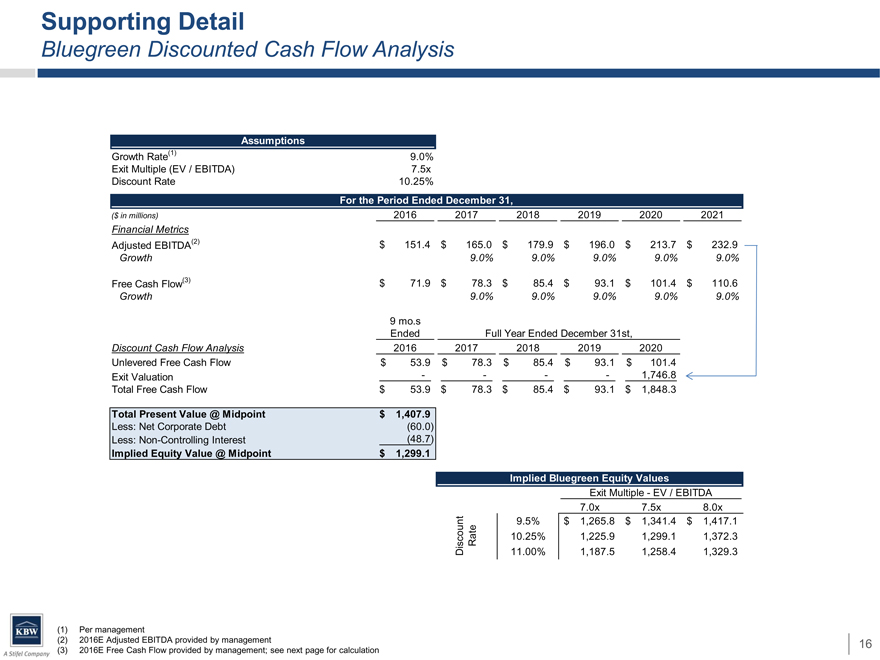
Supporting Detail
Bluegreen Discounted Cash Flow Analysis
Assumptions
Growth Rate(1) 9.0%
Exit Multiple (EV / EBITDA) 7.5x
Discount Rate 10.25%
For the Period Ended December 31,
($ in millions) 201620172018201920202021
Financial Metrics
Adjusted EBITDA(2) $151.4$165.0$179.9$196.0$213.7$232.9
Growth 9.0%9.0%9.0%9.0%9.0%
Free Cash Flow(3) $71.9$78.3$85.4$93.1$101.4$110.6
Growth 9.0%9.0%9.0%9.0%9.0%
9 mo.s
EndedFull Year Ended December 31st,
Discount Cash Flow Analysis 3/31/2016 20162017201820192020
Unlevered Free Cash Flow $53.9$78.3$85.4$93.1$101.4
Exit Valuation ----1,746.8
Total Free Cash Flow 0 $53.9$78.3$85.4$93.1$1,848.3
Total Present Value @ Midpoint $1,407.9
Less: Net Corporate Debt (60.0)
Less: Non-Controlling Interest (48.7)
Implied Equity Value @ Midpoint $1,299.1
Implied Bluegreen Equity Values
Exit Multiple—EV / EBITDA
$1,299.17.0x7.5x8.0x
unt9.5%$1,265.8$1,341.4$1,417.1
sco Rate10.25%1,225.91,299.11,372.3
Di11.00%1,187.51,258.41,329.3
Per management
2016E Adjusted EBITDA provided by management
2016E Free Cash Flow provided by management; see next page for calculation
16
|
Supporting Detail
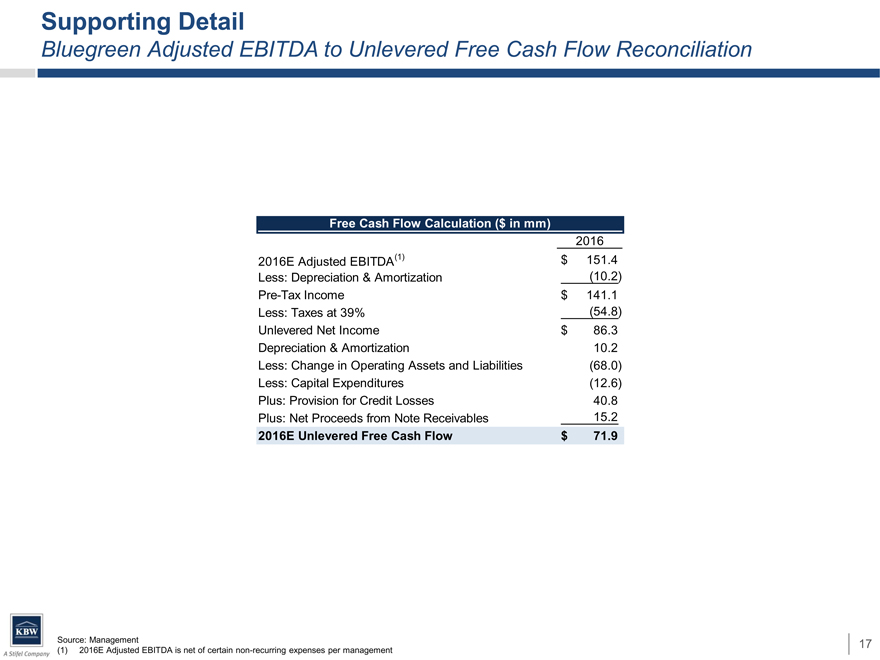
Bluegreen Adjusted EBITDA to Unlevered Free Cash Flow Reconciliation
Free Cash Flow Calculation ($ in mm)
2016
2016E Adjusted EBITDA(1) $ 151.4
Less: Depreciation & Amortization (10.2)
Pre-Tax Income $ 141.1
Less: Taxes at 39% (54.8)
Unlevered Net Income $ 86.3
Depreciation & Amortization 10.2
Less: Change in Operating Assets and Liabilities (68.0)
Less: Capital Expenditures (12.6)
Plus: Provision for Credit Losses 40.8
Plus: Net Proceeds from Note Receivables 15.2
2016E Unlevered Free Cash Flow $ 71.9
Source: Management
(1) 2016E Adjusted EBITDA is net of certain non-recurring expenses per management
17
|
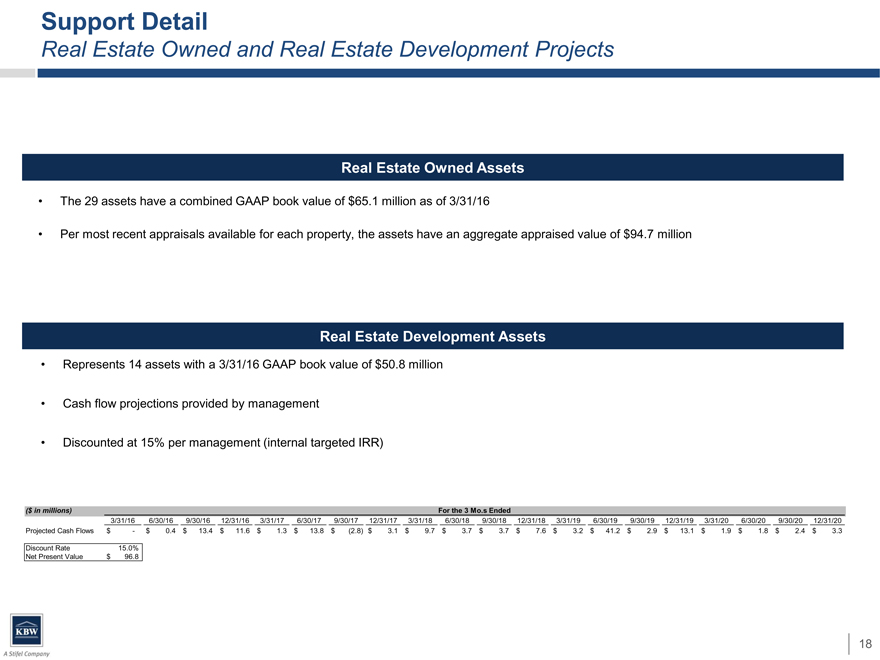
Support Detail
Real Estate Owned and Real Estate Development Projects
Real Estate Owned Assets
The 29 assets have a combined GAAP book value of $65.1 million as of 3/31/16
Per most recent appraisals available for each property, the assets have an aggregate appraised value of $94.7 million
Real Estate Development Assets
Represents 14 assets with a 3/31/16 GAAP book value of $50.8 million
Cash flow projections provided by management
Discounted at 15% per management (internal targeted IRR)
($ in millions) For the 3 Mo.s Ended
3/31/166/30/169/30/16 12/31/16 3/31/176/30/179/30/17 12/31/17 3/31/186/30/189/30/18 12/31/18 3/31/196/30/199/30/19 12/31/193/31/206/30/209/30/2012/31/20
Projected Cash Flows $-$ 0.4$ 13.4 $ 11.6 $ 1.3$ 13.8$ (2.8) $ 3.1 $ 9.7$ 3.7$ 3.7 $ 7.6 $ 3.2$ 41.2$ 2.9 $ 13.1$ 1.9$ 1.8$ 2.4$ 3.3
Discount Rate 15.0%
Net Present Value $96.8
18
|
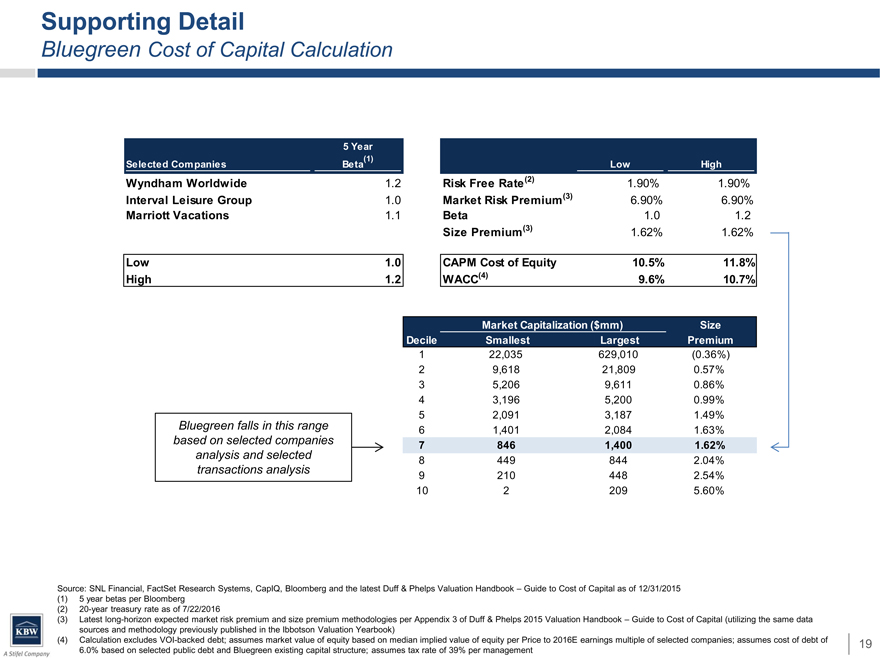
Supporting Detail
Bluegreen Cost of Capital Calculation
5 Year
Selected Companies Beta(1) LowHigh
Wyndham Worldwide 1.2Risk Free Rate (2)1.90%1.90%
Interval Leisure Group 1.0Market Risk Premium(3)6.90%6.90%
Marriott Vacations 1.1Beta1.01.2
Size Premium(3)1.62%1.62%
Low 1.0CAPM Cost of Equity10.5%11.8%
High 1.2WACC(4)9.6%10.7%
Market Capitalization ($mm)Size
DecileSmallestLargestPremium
122,035629,010(0.36%)
29,61821,8090.57%
35,2069,6110.86%
43,1965,2000.99%
52,0913,1871.49%
Bluegreen falls in this range 61,4012,0841.63%
based on selected companies 78461,4001.62%
analysis and selected 84498442.04%
transactions analysis 92104482.54%
1022095.60%
Source: SNL Financial, FactSet Research Systems, CapIQ, Bloomberg and the latest Duff & Phelps Valuation Handbook – Guide to Cost of Capital as of 12/31/2015
(1)
5 year betas per Bloomberg
(2)
20-year treasury rate as of 7/22/2016
(3)
Latest long-horizon expected market risk premium and size premium methodologies per Appendix 3 of Duff & Phelps 2015 Valuation Handbook – Guide to Cost of Capital (utilizing the same data
sources and methodology previously published in the Ibbotson Valuation Yearbook)
(4)
Calculation excludes VOI-backed debt; assumes market value of equity based on median implied value of equity per Price to 2016E earnings multiple of selected companies; assumes cost of debt of
6.0% based on selected public debt and Bluegreen existing capital structure; assumes tax rate of 39% per management
19
|

Book Value Based Approach
|
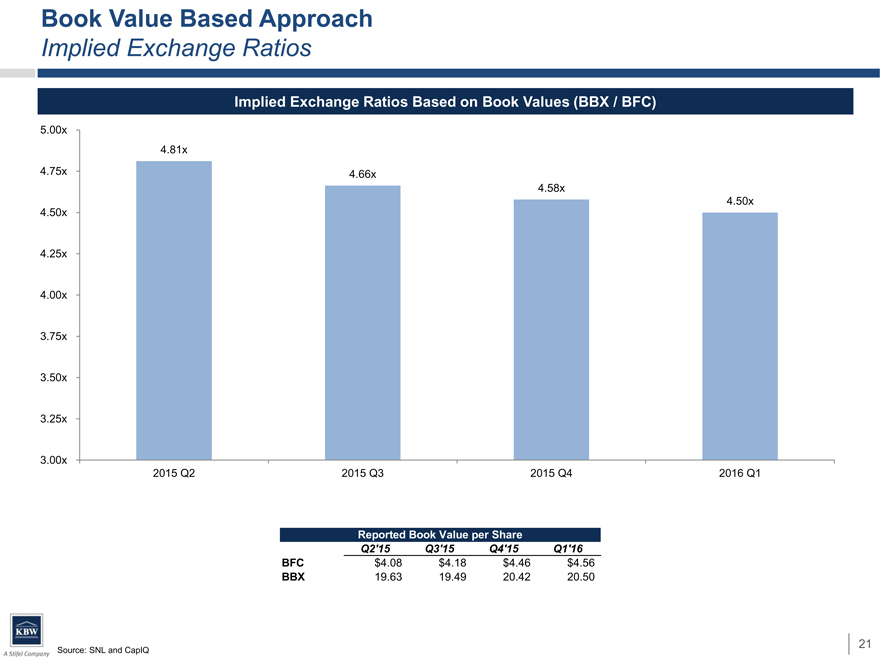
Book Value Based Approach
Implied Exchange Ratios
Implied Exchange Ratios Based on Book Values (BBX / BFC)
5.00x
4.81x
4.75x 4.66x
4.58x
4.50x
4.50x
4.25x
4.00x
3.75x
3.50x
3.25x
3.00x
2015 Q2 2015 Q32015 Q42016 Q1
Reported Book Value per Share
Q2’15Q3’15Q4’15Q1’16
BFC$4.08$4.18$4.46$4.56
BBX19.6319.4920.4220.50
Source: SNL and CapIQ
21
|
BFC and BBX Public Stock Price Based Approach
|
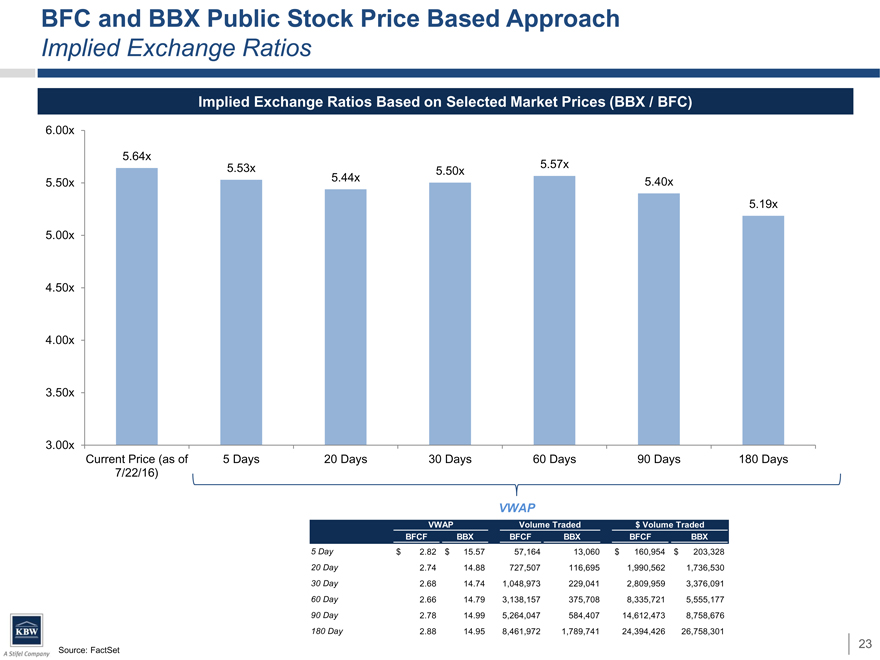
BFC and BBX Public Stock Price Based Approach
Implied Exchange Ratios
Implied Exchange Ratios Based on Selected Market Prices (BBX / BFC)
6.00x
5.64x
5.53x5.50x5.57x
5.50x 5.44x5.40x
5.19x
5.00x
4.50x
4.00x
3.50x
3.00x
Current Price (as of 5 Days20 Days30 Days60 Days90 Days180 Days
7/22/16)
VWAP
VWAPVolume Traded$ Volume Traded
BFCFBBXBFCFBBXBFCFBBX
5 Day$ 2.82 $15.5757,16413,060$ 160,954 $203,328
20 Day2.7414.88727,507116,6951,990,5621,736,530
30 Day2.6814.741,048,973229,0412,809,9593,376,091
60 Day2.6614.793,138,157375,7088,335,7215,555,177
90 Day2.7814.995,264,047584,40714,612,4738,758,676
180 Day2.8814.958,461,9721,789,74124,394,42626,758,301
Source: FactSet
23
|

Summary of Approaches
|
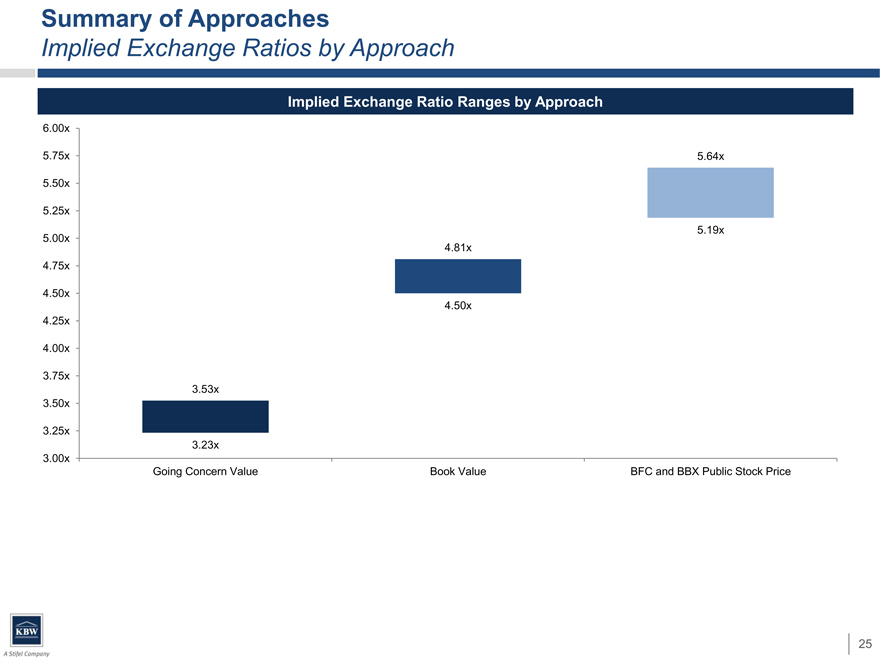
Summary of Approaches
Implied Exchange Ratios by Approach
Implied Exchange Ratio Ranges by Approach
6.00x
5.75x 5.64x
5.50x
5.25x
5.19x
5.00x
4.81x
4.75x
4.50x
4.50x
4.25x
4.00x
3.75x
3.53x
3.50x
3.25x
3.23x
3.00x
Going Concern Value Book ValueBFC and BBX Public Stock Price
25