Lehman Brothers CEO Energy/Power Conference Sheraton New York Hotel September 4-6, 2007 Exhibit 99.2

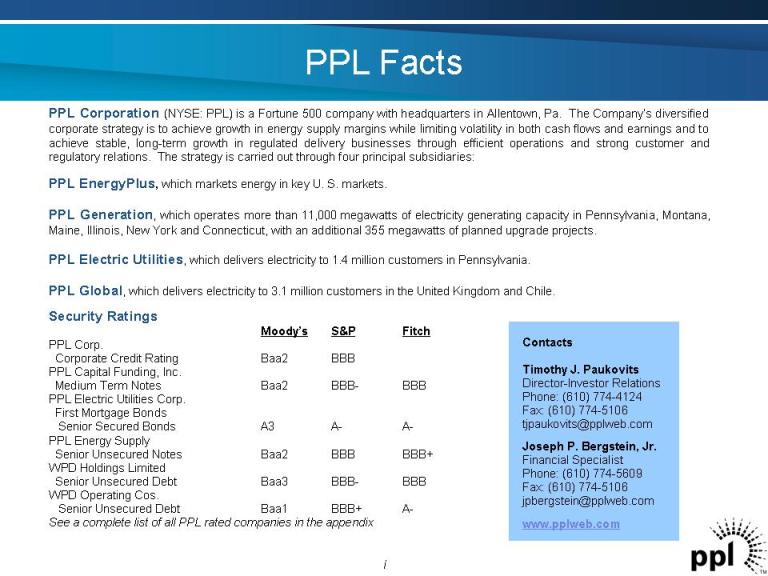
PPL Corporation (NYSE: PPL) is a Fortune 500 company with headquarters in Allentown, Pa. The Company’s diversified corporate strategy is to achieve growth in energy supply margins while limiting volatility in both cash flows and earnings and to achieve stable, long-term growth in regulated delivery businesses through efficient operations and strong customer and regulatory relations. The strategy is carried out through four principal subsidiaries: PPL EnergyPlus, which markets energy in key U. S. markets. PPL Generation, which operates more than 11,000 megawatts of electricity generating capacity in Pennsylvania, Montana, Maine, Illinois, New York and Connecticut, with an additional 355 megawatts of planned upgrade projects. PPL Electric Utilities, which delivers electricity to 1.4 million customers in Pennsylvania. PPL Global, which delivers electricity to 3.1 million customers in the United Kingdom and Chile. Security Ratings Moody’s S&P Fitch PPL Corp. Corporate Credit Rating Baa2 BBB PPL Capital Funding, Inc. Medium Term Notes Baa2 BBB-BBB PPL Electric Utilities Corp. First Mortgage Bonds Senior Secured Bonds A3 A-A- PPL Energy Supply Senior Unsecured Notes Baa2 BBB BBB+ WPD Holdings Limited Senior Unsecured Debt Baa3 BBB-BBB WPD Operating Cos. Senior Unsecured Debt Baa1 BBB+ A- See a complete list of all PPL rated companies in the appendix Contacts Timothy J. Paukovits Director-Investor Relations Phone: (610) 774-4124 Fax: (610) 774-5106 tjpaukovits@pplweb.com Joseph P. Bergstein, Jr. Financial Specialist Phone: (610) 774-5609 Fax: (610) 774-5106 jpbergstein@pplweb.com www.pplweb.com PPL Facts i
PPL Facts (cont.) Financial and Operating Information Note: See Appendix for the reconciliation of reported earnings per share and earnings from ongoing operations. ii(Unaudited) ($ in millions, except per share amounts) 12 Months Ended June 2007 June 2006 Common Equity $5,369 $4,890 Preferred Equity 301 301 Short-Term Debt 96 44 Long-Term Debt 7,584 6,939 Total Capitalization $13,350 $12,174 Total Assets $20,006 $18,339 Operating Revenues $6,442 $6,033 Reported Earnings Per Share -Diluted $2.45 $2.19 Earnings Per Share From Ongoing Operations – Diluted $2.32 $2.29 Market Price Per Share $46.79 $32.30 Book Value Per Share $13.95 $12.84 ROE – Reported 18.52% 18.58% ROE – Earnings From Ongoing Operations 17.49% 19.11% Common Shares Outstanding (thousands) End of Period 384,925 380,813 Average – Diluted 388,664 385,418 Annualized Dividend Rate $1.22 $1.10 Dividend Payout -Diluted, using annualized dividends Reported Earnings Per Share 50% 50% Earnings Per Share From Ongoing Operations 53% 48% Electric Energy Sales – Domestic (millions of kWh) Retail Deliveries 37,522 36,994 Retail Supply 39,622 39,121 Wholesale Supply East 18,327 21,340 West 13,467 13,840 Net System Capacity (thousands of KW) 11,556 11,556

Cautionary Statements And Factors That May Affect Future Results Any statements made in this presentation about future operating results or other future events are forward-looking statements under the Safe Harbor Provisions of the Private Securities Litigation Reform Act of 1995. Actual results may differ materially from such forward-looking statements. A discussion of factors that could cause actual results or events to vary is contained in the Appendix to this presentation and in the Company’s SEC filings. 1

Growing Shareowner Value • Continued focus on execution of our current growth plan • Extract additional value from our energy marketing operations • Multi-faceted expansion of the generation portfolio • Complete previously announced divestiture plans 2
Optimize Energy Marketing • Expand marketing capabilities • Active participation in energy and commodity markets • Manage market, operational and financial risks 3
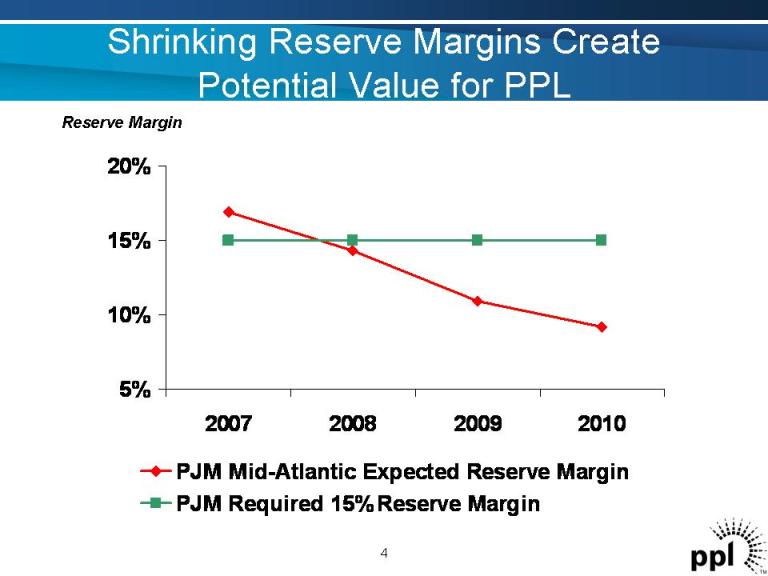
Shrinking Reserve Margins Create Potential Value for PPL Reserve Margin 4 5% 10% 15% 20% 2007 2008 2009 2010 PJM Mid-Atlantic Expected Reserve Margin PJM Required 15% Reserve Margin
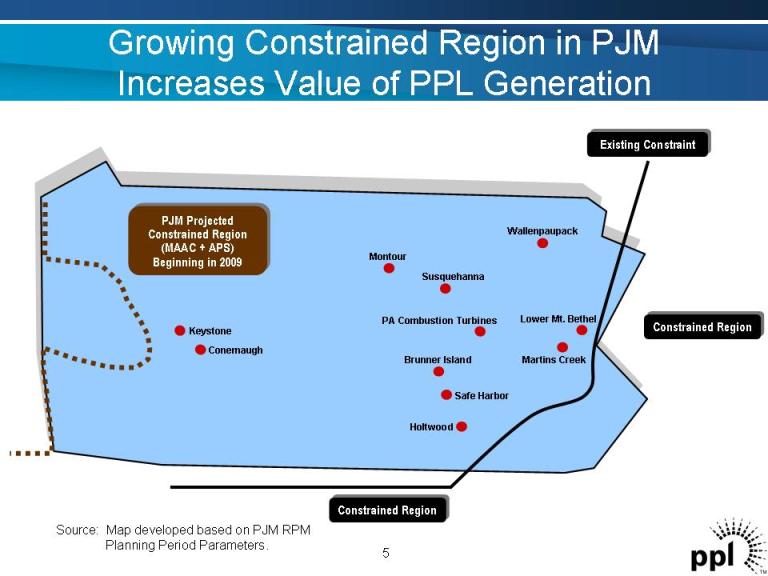
Growing Constrained Region in PJM Increases Value of PPL Generation 5 Constrained Region Constrained Region Montour Brunner Island Holtwood Wallenpaupack Martins Creek Keystone Conemaugh Safe Harbor Lower Mt. Bethel PA Combustion Turbines Susquehanna Existing Constraint PJM Projected Constrained Region (MAAC + APS) Beginning in 2009 Source: Map developed based on PJM RPM Planning Period Parameters.
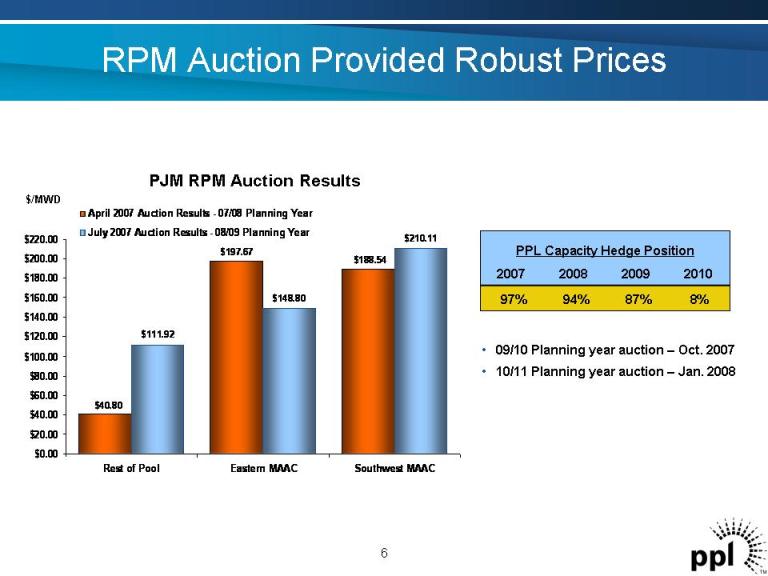
RPM Auction Provided Robust Prices 6 $111.92 $148.80 $210.11 $188.54 $197.67 $40.80 $0.00 $20.00 $40.00 $60.00 $80.00 $100.00 $120.00 $140.00 $160.00 $180.00 $200.00 $220.00 Rest of Pool Eastern MAAC Southwest MAAC April 2007 Auction Results - 07/08 Planning Year July 2007 Auction Results - 08/09 Planning Year $/MWD PJM RPM Auction Results • 09/10 Planning year auction – Oct. 2007 • 10/11 Planning year auction – Jan. 2008 PPL Capacity Hedge Position 8%87%94%97% 2010 2009 2008 2007
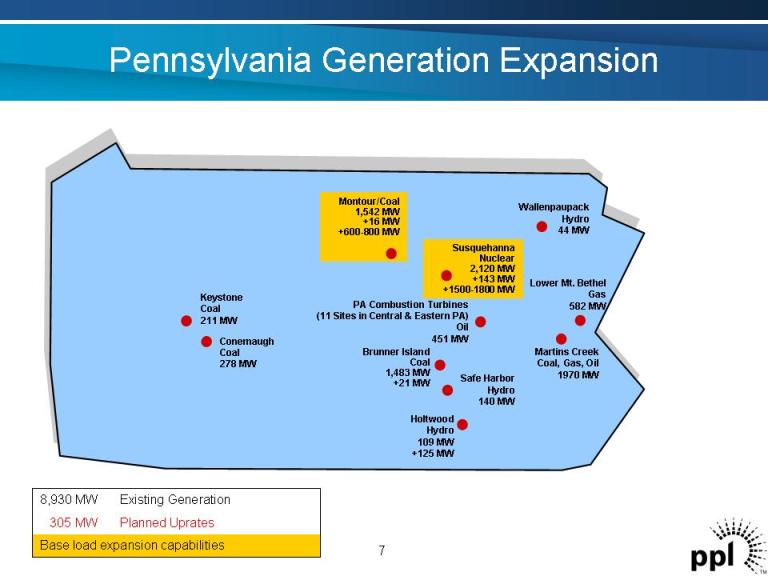
Pennsylvania Generation Expansion Montour/Coal1,542 MW +16 MW +600-800 MW Brunner Island Coal 1,483 MW +21 MW Holtwood Hydro 109 MW +125 MW Wallenpaupack Hydro 44 MW Martins Creek Coal, Gas, Oil 1970 MW Keystone Coal 211 MW Conemaugh Coal 278 MW Safe Harbor Hydro 140 MW Lower Mt. Bethel Gas 582 MWPA Combustion Turbines (11 Sites in Central & Eastern PA) Oil 451 MW Susquehanna Nuclear 2,120 MW +143 MW +1500-1800 MW 7Base load expansion capabilities Planned Uprates 305 MW Existing Generation 8,930 MW
Expanding Renewable Energy Portfolio • Currently there are not enough renewable energy credits in the market • Plan to invest $100 million to develop renewable projects over next five years – Included in current capex program • Contracts in place with renewable energy facilities 8
PPL EU Completed First RFP for 2010 • Solicitation for 850 MWs of residential and small commercial and industrial load • PUC approval of winning bids received July 26, 2007 • Based on first solicitation results, residential bills could increase by approximately 28% • Second solicitation bids due October 1, PUC approval expected October 4 9
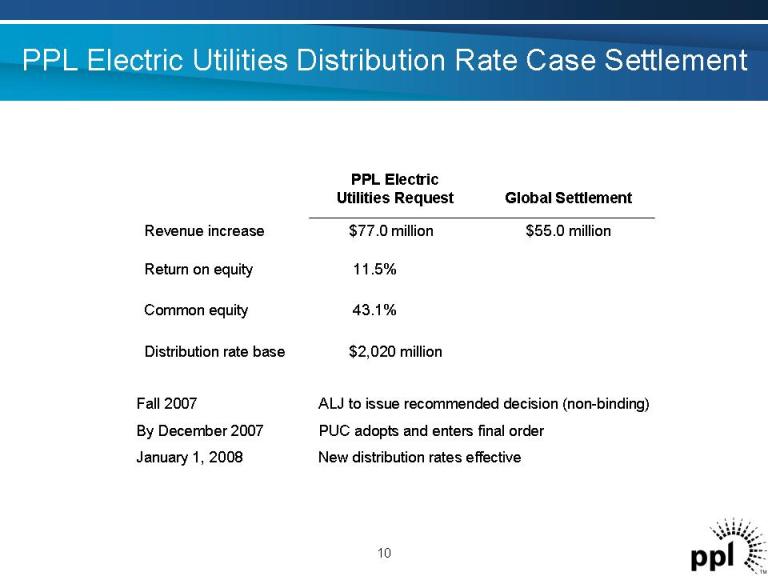
PPL Electric Utilities Distribution Rate Case Settlement $2,020 million Distribution rate base 43.1%Common equity 11.5%Return on equity $55.0 million$77.0 million Revenue increase Global Settlement PPL Electric Utilities Request 10 Fall 2007 ALJ to issue recommended decision (non-binding) By December 2007 PUC adopts and enters final order January 1, 2008 New distribution rates effective
PA Energy Legislation Update • Two energy-related bills recently enacted – HB1203 – Alternative Energy Portfolio Standard Act – HB1530 – Electric Choice and Competition Act • Amendments allow voluntary contracts between EDCs and industrial customers; • Allow EDC ownership of generation to serve large industrial customers 11
Special Session on Energy • Begins September 17 and runs concurrently with regular legislative session • Remaining components of Governor's Energy Strategy to be addressed – Funding for alternative energy (asurcharge on customers’ bills) – Conservation and demand management – Governor proposed “least cost portfolio” – A liquid fuels standard 12
PPL Electric Utilities Initiatives • Complete the transition from generation rate caps in ways that foster trust and confidence • Rate design strategies • Energy efficiency and DSM programs • Education and outreach 13
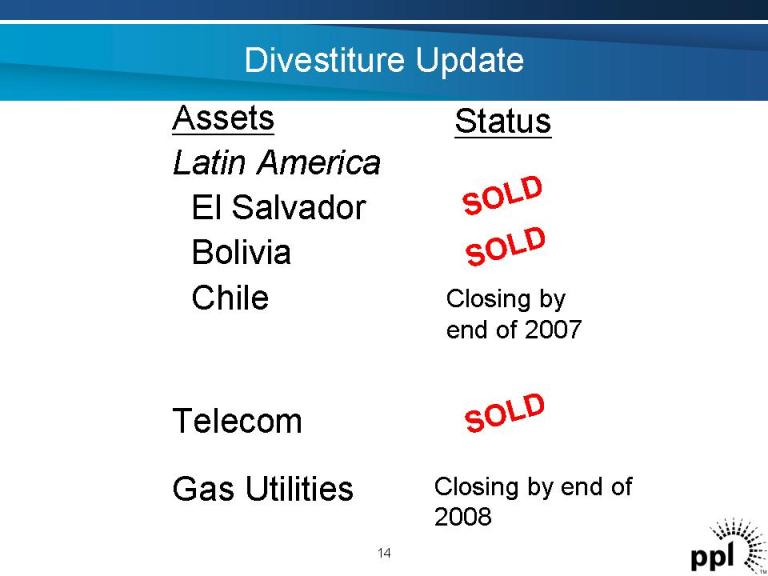
Divestiture Update Assets Latin America El Salvador Bolivia Chile Telecom Gas Utilities Status SOLD SOLD Closing by end of 2007 SOLD Closing by end of 2008 14
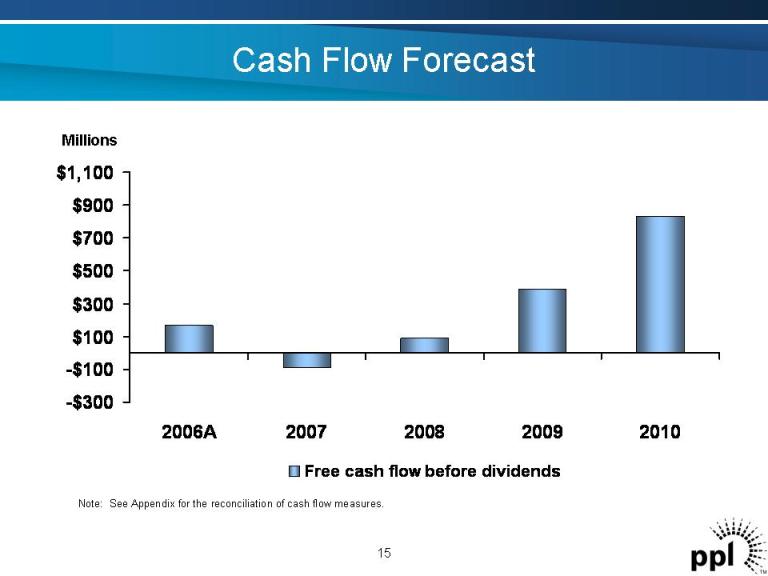
Cash Flow Forecast Millions -$300 -$100 $100 $300 $500 $700 $900 $1,100 2006A 2007 2008 2009 2010 Free cash flow before dividends 15 Note: See Appendix for the reconciliation of cash flow measures.
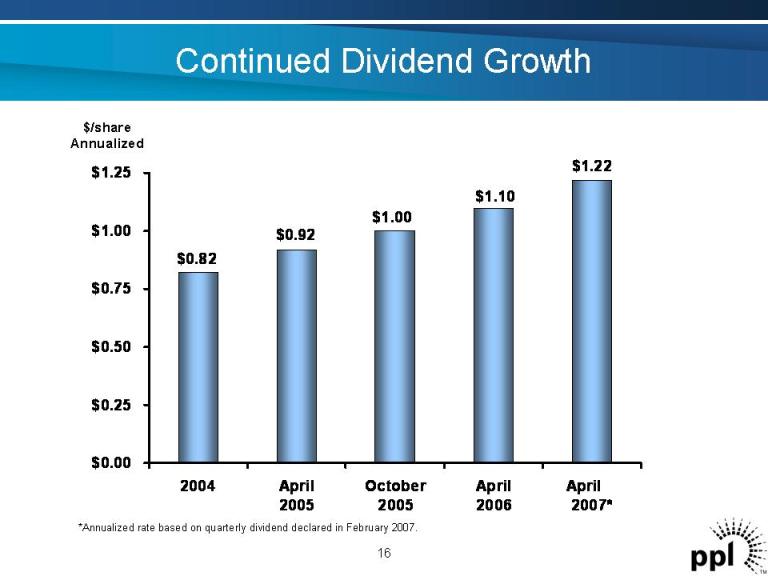
$0.82 $0.92 $1.00 $1.10 $1.22 $0.00 $0.25 $0.50 $0.75 $1.00 $1.25 2004 April 2005 October 2005 April 2006 April 2007* $/share Annualized Continued Dividend Growth 16 *Annualized rate based on quarterly dividend declared in February 2007.
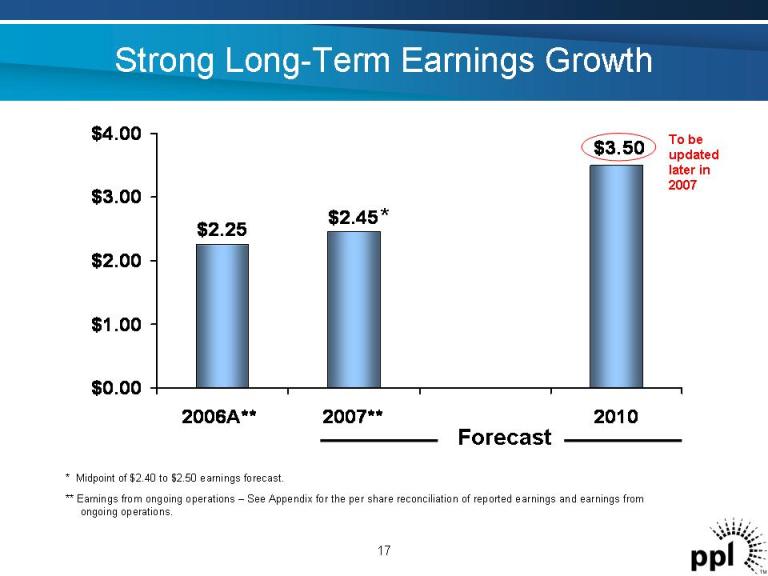
Strong Long-Term Earnings Growth 17 * Forecast $3.50 $2.45 $2.25 $0.00 $1.00 $2.00 $3.00 $4.00 2006A** 2007** 2010 To be updated later in 2007 ** Earnings from ongoing operations – See Appendix for the per share reconciliation of reported earnings and earnings from ongoing operations. * Midpoint of $2.40 to $2.50 earnings forecast.
PPL

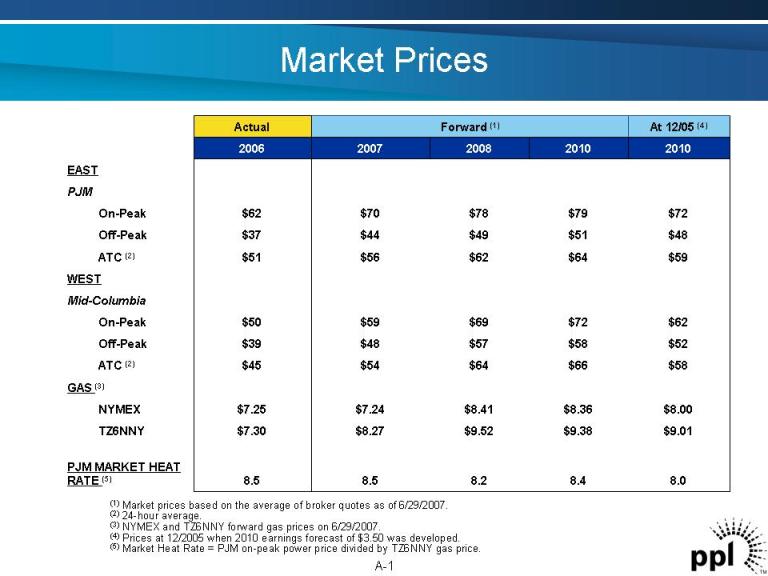
Market Prices EAST PJM On-Peak Off-Peak ATC (2) WEST Mid-Columbia On-Peak Off-Peak ATC (2) GAS (3) NYMEX TZ6NNY PJM MARKET HEAT RATE (5) Actual Forward (1) At 12/05 (4) 2006 2007 2008 2010 2010 8.5 $7.30 $7.25 $45 $39 $50 $51 $37 $62 8.08.48.28.5 $9.01$9.38$9.52$8.27 $8.00$8.36$8.41$7.24 $58$66$64$54 $52$58$57$48 $62$72$69$59 $59$64$62$56 $48$51$49$44 $72$79$78$70 (1) Market prices based on the average of broker quotes as of 6/29/2007. (2) 24-hour average. (3) NYMEX and TZ6NNY forward gas prices on 6/29/2007. (4) Prices at 12/2005 when 2010 earnings forecast of $3.50 was developed. (5) Market Heat Rate = PJM on-peak power price divided by TZ6NNY gas price. A-1
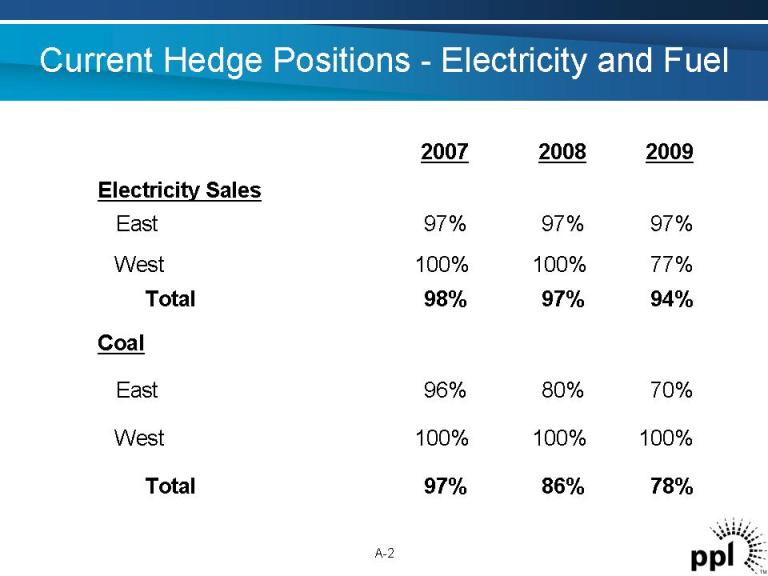
Current Hedge Positions -Electricity and Fuel A-2 78%86%97%Total Coal 70%80%96%East 100%100%100%West 94%97%98%Total 77%100%100%West 97%97%97%East Electricity Sales 200920082007
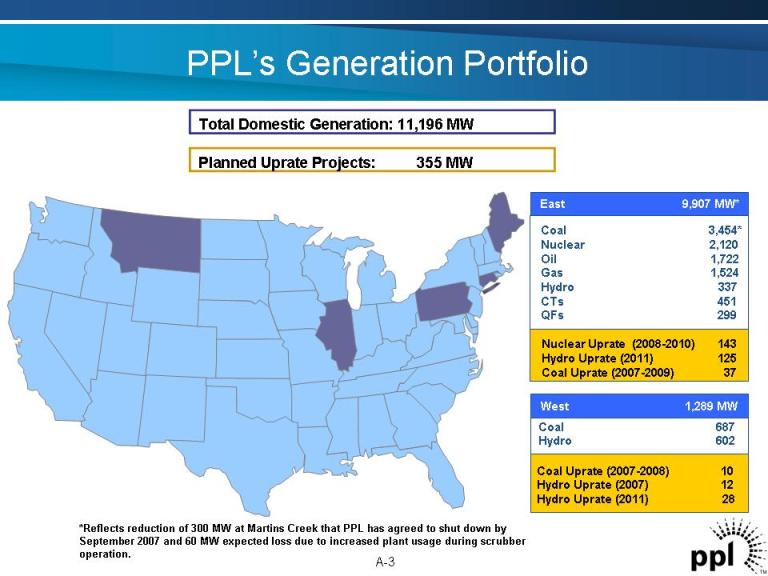
PPL’s Generation Portfolio Total Domestic Generation: 11,196 MW Planned Uprate Projects: 355 MW *Reflects reduction of 300 MW at Martins Creek that PPL has agreed to shut down by September 2007 and 60 MW expected loss due to increased plant usage during scrubber operation. A-3 Coal 3,454* Nuclear 2,120 Oil 1,722 Gas 1,524 Hydro 337 CTs 451 QFs 299 East 9,907 MW* Nuclear Uprate (2008-2010) 143 Hydro Uprate (2011) 125 Coal Uprate (2007-2009) 37 Coal 687 Hydro 602 West 1,289 MW Coal Uprate (2007-2008) 10 Hydro Uprate (2007) 12 Hydro Uprate (2011) 28
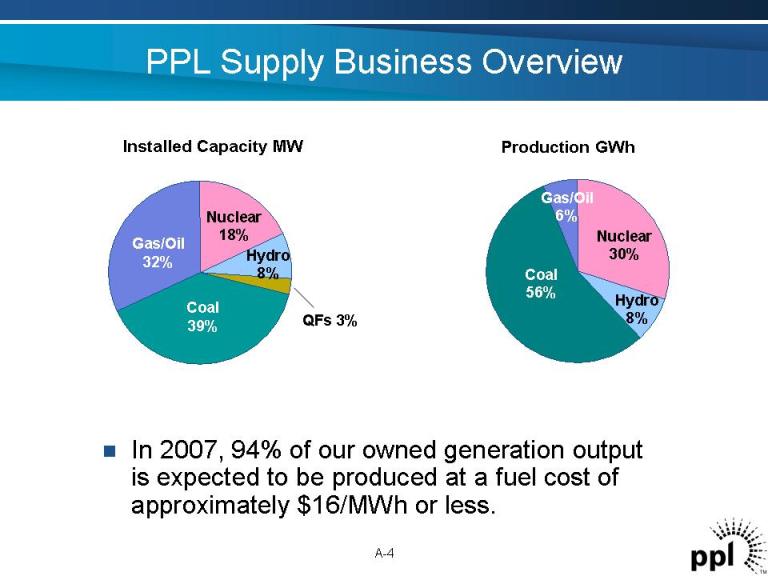
..In 2007, 94% of our owned generation output is expected to be produced at a fuel cost of approximately $16/MWh or less. PPL Supply Business Overview Production GWh A-4 Gas/Oil 32% Coal 39% Nuclear 18% Hydro 8% QFs 3% Installed Capacity MW Gas/Oil 6% Coal 56% Nuclear 30% Hydro 8%
Proactive Coal Supply Management Supports Growth in Margins Projected 2007 Coal Supply • Supply region diversity • Fleet trains (1600 cars) • Average delivered costs – 4%-5% annual increase 2006 to 2010 A-5 Central PA 16% PRB 6% Montana Mine-mouth 21% Central Appalachia 12% Southwest PA 45%

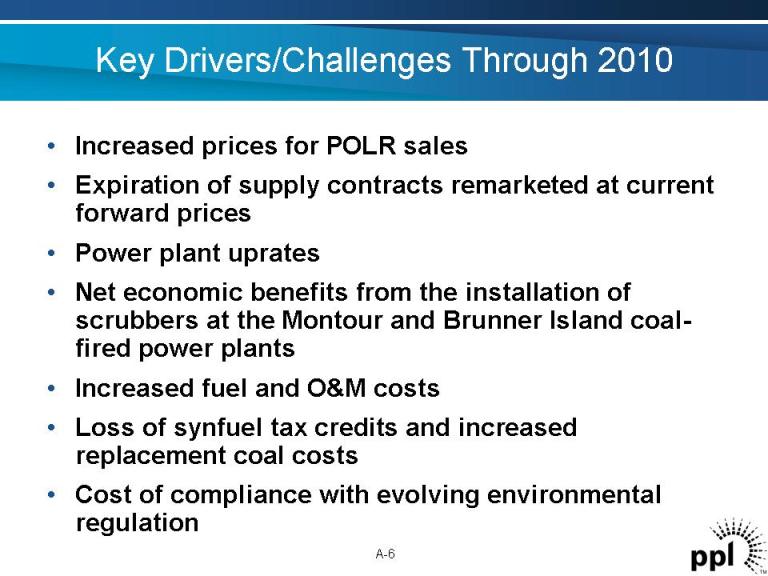
Key Drivers/Challenges Through 2010 • Increased prices for POLR sales • Expiration of supply contracts remarketed at current forward prices • Power plant uprates • Net economic benefits from the installation of scrubbers at the Montour and Brunner Island coal- fired power plants • Increased fuel and O&M costs • Loss of synfuel tax credits and increased replacement coal costs • Cost of compliance with evolving environmental regulation A-6
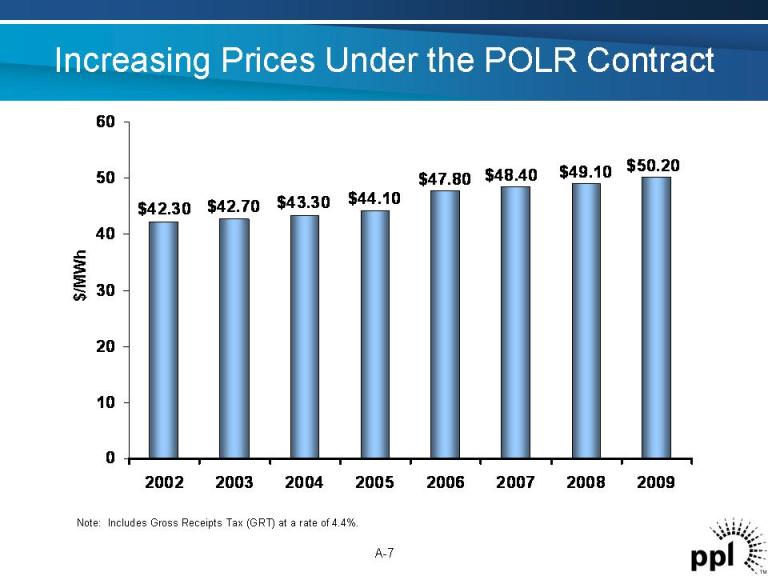
Increasing Prices Under the POLR Contract $42.30 $42.70 $43.30 $44.10 $47.80 $48.40 $49.10 $50.20 0 10 20 30 40 50 60 2002 2003 2004 2005 2006 2007 2008 2009 $/MWh A-7 Note: Includes Gross Receipts Tax (GRT) at a rate of 4.4%.
Scrubbers Expected to be Completed on Budget and on Schedule Montour Unit #2 Absorber A-8 Q2-09Brunner Island 1 & 2 Q4-08Brunner Island 3 Q2-08Montour 2 Q1-08Montour 1 In-Service Dates

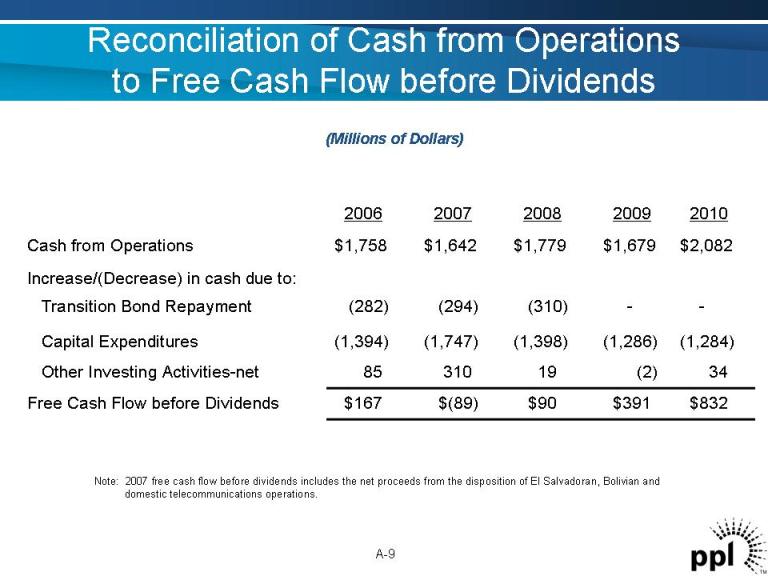
Reconciliation of Cash from Operations to Free Cash Flow before Dividends (Millions of Dollars) A-9 $832$391$90$(89)$167Free Cash Flow before Dividends 34(2)1931085Other Investing Activities-net (1,284)(1,286)(1,398)(1,747)(1,394)Capital Expenditures --(310)(294)(282)Transition Bond Repayment Increase/(Decrease) in cash due to: $2,082$1,679$1,779$1,642$1,758Cash from Operations 20102009200820072006 Note: 2007 free cash flow before dividends includes the net proceeds from the disposition of El Salvadoran, Bolivian and domestic telecommunications operations.
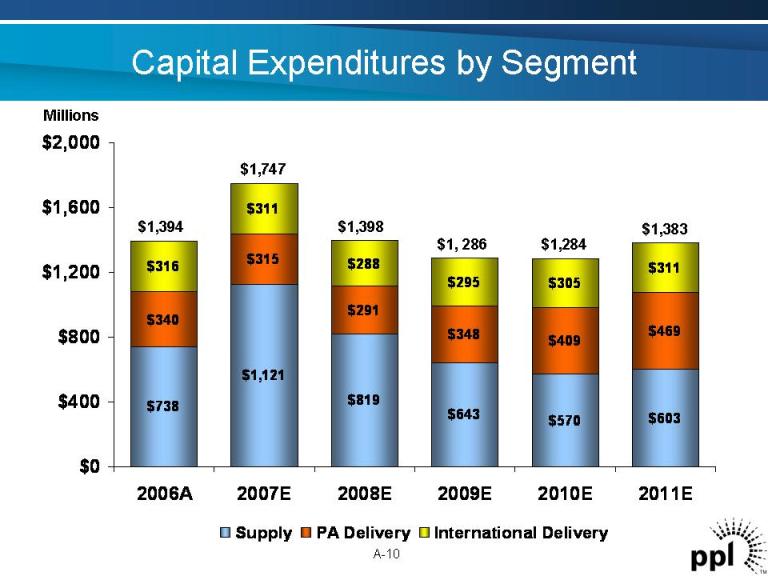
Millions $738 $1,121 $819 $643 $570 $603 $340 $315 $291 $348 $409 $469 $316 $311 $288 $295 $305 $311 $0 $400 $800 $1,200 $1,600 $2,000 2006A 2007E 2008E 2009E 2010E 2011E Supply PA Delivery International Delivery $1,394 $1,284 $1,383$1, 286 $1,398 $1,747 Capital Expenditures by Segment A-10
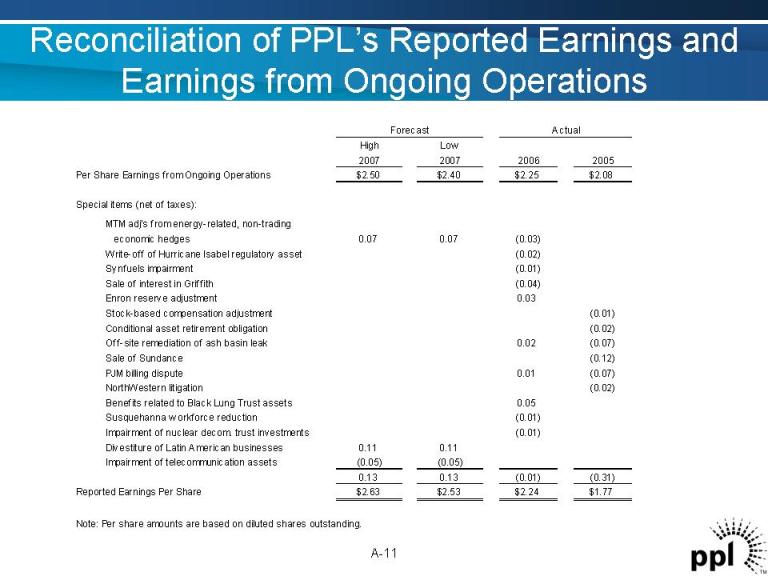
Reconciliation of PPL’s Reported Earnings and Earnings from Ongoing Operations High Low 2007 2007 2006 2005 Per Share Earnings from Ongoing Operations $2.50 $2.40 $2.25 $2.08 Special items (net of taxes): economic hedges 0.07 0.07 (0.03) Write-off of Hurricane Isabel regulatory asset (0.02) Synfuels impairment (0.01) Sale of interest in Griffith (0.04) Enron reserve adjustment 0.03 Stock-based compensation adjustment (0.01) Conditional asset retirement obligation (0.02) Off-site remediation of ash basin leak 0.02 (0.07) Sale of Sundance (0.12) PJM billing dispute 0.01 (0.07) NorthWestern litigation (0.02) Benefits related to Black Lung Trust assets 0.05 Susquehanna w workforce reduction (0.01) Impairment of nuclear decom. trust investments (0.01) Divestiture of Latin American businesses 0.11 0.11 Impairment of telecommunication assets (0.05) (0.05) 0.13 0.13 (0.01) (0.31) Reported Earnings Per Share $2.63 $2.53 $2.24 $1.77 Note: Per share amounts are based on diluted shares outstanding. Forecast MTM adj's from energy-related, non-trading Actual A-11
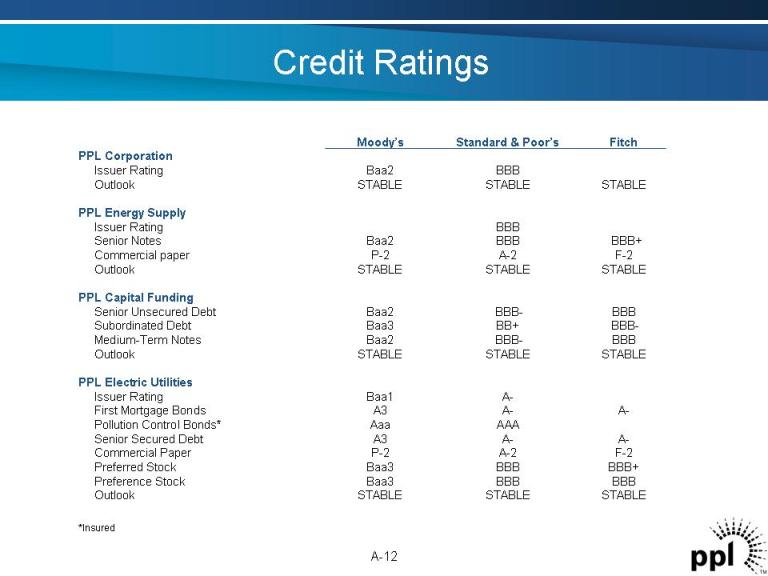
Credit Ratings A-12 STABLE STABLE STABLE Outlook A-A-A3Senior Secured Debt F-2A-2P-2Commercial Paper BBB+ BBBBaa3Preferred Stock A-Baa1Issuer Rating A-A-A3First Mortgage Bonds AAAAaaPollution Control Bonds* BBBBBBBaa3Preference Stock PPL Electric Utilities BBBBBB-Baa2Senior Unsecured Debt BBB-BB+ Baa3Subordinated Debt BBBBBB-Baa2Medium-Term Notes STABLE STABLE STABLE Outlook PPL Capital Funding BBBIssuer Rating BBB+ BBBBaa2Senior Notes F-2A-2P-2Commercial paper STABLE STABLE STABLE Outlook PPL Energy Supply STABLE STABLE STABLE Outlook BBBBaa2Issuer Rating PPL Corporation FitchStandard & Poor’s Moody’s *Insured
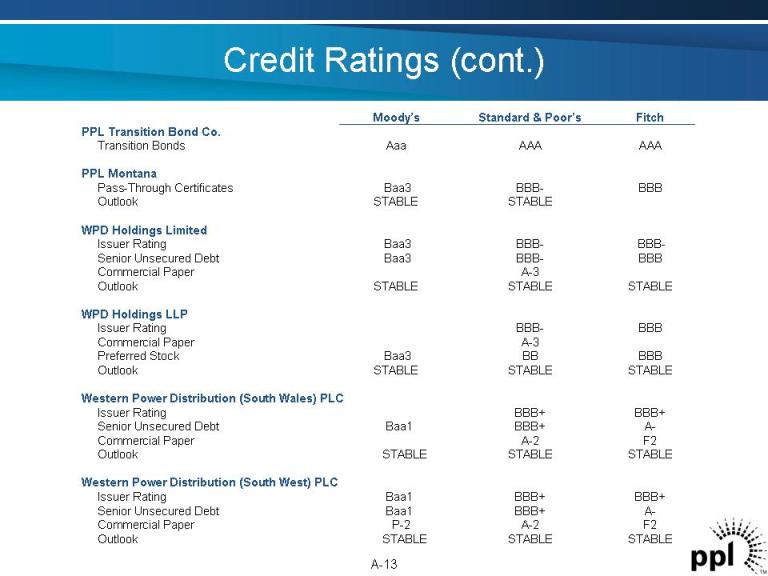
Credit Ratings (cont.) A-13 A-3Commercial Paper BBB+ BBB+ Baa1Issuer Rating A-BBB+ Baa1Senior Unsecured Debt F2A-2P-2Commercial Paper STABLE STABLE STABLE Outlook Western Power Distribution (South West) PLC BBB+ BBB+ Issuer Rating A-BBB+ Baa1Senior Unsecured Debt F2A-2Commercial Paper STABLE STABLE STABLE Outlook Western Power Distribution (South Wales) PLC STABLE STABLE STABLE Outlook STABLE STABLE STABLE Outlook BBBBBBaa3Preferred Stock BBBBBB-Issuer Rating WPD Holdings LLP BBB-BBB-Baa3Issuer Rating BBBBBB-Baa3Senior Unsecured Debt A-3Commercial Paper WPD Holdings Limited BBBBBB-Baa3Pass-Through Certificates STABLE STABLE Outlook PPL Montana AAAAAAAaaTransition Bonds PPL Transition Bond Co. FitchStandard & Poor’s Moody’s
Forward-Looking Information Statement A-14 Statements contained in this news release, including statements with respect to future earnings, energy prices, margins, sales and supply, marketing performance, growth, revenues, expenses, rates, cash flows, credit profile, financing, dividends, business disposition, corporate strategy, capital additions and expenditures, and generating capacity and performance, are “forward-looking statements” within the meaning of the federal securities laws. Although PPL Corporation believes that the expectations and assumptions reflected in these forward-looking statements are reasonable, these statements involve a number of risks and uncertainties, and actual results may differ materially from the results discussed in the statements. The following are among the important factors that could cause actual results to differ materially from the forward-looking statements: market demand and prices for energy, capacity and fuel; market prices for crude oil and the potential impact on the phaseout of synthetic fuel tax credits and synthetic fuel operations; weather conditions affecting generation production, customer energy usage and operating costs; competition in retail and wholesale power markets; liquidity of wholesale power markets; the effect of any business or industry restructuring; the profitability and liquidity, including access to capital markets and credit facilities of PPL Corporation and its subsidiaries; new accounting requirements or new interpretations or applications of existing requirements; operation and availability of existing generation facilities and operating costs; transmission and distribution system conditions and operating costs; current and future environmental conditions and requirements and the related costs of compliance, including environmental capital expenditures and emission allowance and other expenses; significant delays in the planned installation of pollution control equipment at certain coal-fired generating units in Pennsylvania due to weather conditions, contractor performance or other reasons; development of new projects, markets and technologies; performance of new ventures; asset acquisitions and dispositions; political, regulatory or economic conditions in states, regions or countries where PPL Corporation or its subsidiaries conduct business; any impact of hurricanes or other severe weather on PPL and its subsidiaries, including any impact on fuel prices; receipt of necessary governmental permits, approvals and rate relief; new state, federal or foreign legislation, including new tax legislation; state, federal and foreign regulatory developments; any impact of state, federal or foreign investigations applicable to PPL Corporation and its subsidiaries and the energy industry; capital markets conditions, including changes in interest rates, and decisions regarding capital structure; stock price performance of PPL Corporation; the market prices of equity securities and the impact on pension costs and resultant cash funding requirements for defined benefit pension plans; securities and credit ratings; disposition proceeds; foreign currency exchange rates; the outcome of litigation against PPL Corporation and its subsidiaries; potential effects of threatened or actual terrorism or war or other hostilities; and the commitments and liabilities of PPL Corporation and its subsidiaries. Any such forward-looking statements should be considered in light of such important factors and in conjunction with PPL Corporation’s Form 10-K and other reports on file with the Securities and Exchange Commission.
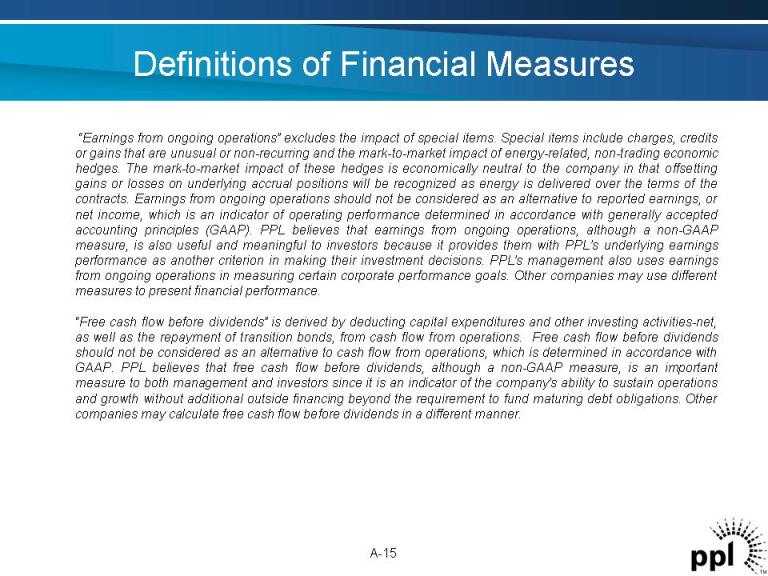
Definitions of Financial Measures A-15 “Earnings from ongoing operations” excludes the impact of special items. Special items include charges, credits or gains that are unusual or non-recurring and the mark-to-market impact of energy-related, non-trading economic hedges. The mark-to-market impact of these hedges is economically neutral to the company in that offsetting gains or losses on underlying accrual positions will be recognized as energy is delivered over the terms of the contracts. Earnings from ongoing operations should not be considered as an alternative to reported earnings, or net income, which is an indicator of operating performance determined in accordance with generally accepted accounting principles (GAAP). PPL believes that earnings from ongoing operations, although a non-GAAP measure, is also useful and meaningful to investors because it provides them with PPL’s underlying earnings performance as another criterion in making their investment decisions. PPL’s management also uses earnings from ongoing operations in measuring certain corporate performance goals. Other companies may use different measures to present financial performance. “Free cash flow before dividends” is derived by deducting capital expenditures and other investing activities-net, as well as the repayment of transition bonds, from cash flow from operations. Free cash flow before dividends should not be considered as an alternative to cash flow from operations, which is determined in accordance with GAAP. PPL believes that free cash flow before dividends, although a non-GAAP measure, is an important measure to both management and investors since it is an indicator of the company’s ability to sustain operations and growth without additional outside financing beyond the requirement to fund maturing debt obligations. Other companies may calculate free cash flow before dividends in a different manner.