Third Quarter Earnings Call October 31, 2007 Exhibit 99.2
Cautionary Statements And Factors That May Affect Future Results Any statements made in this presentation about future operating results or other future events are forward-looking statements under the Safe Harbor Provisions of the Private Securities Litigation Reform Act of 1995. Actual results may differ materially from such forward-looking statements. A discussion of factors that could cause actual results or events to vary is contained in the Appendix to this presentation and in the Company’s SEC filings. 1
Agenda • Third Quarter 2007 Earnings and Review of 2010 Earnings Forecast and Outlook • Third Quarter Segment Results, Revised Forecasts and Financial Overview • Operational Review, 2008 and 2010 Earnings Assumptions • Q&A J. H. Miller P. Farr W. H. Spence 2
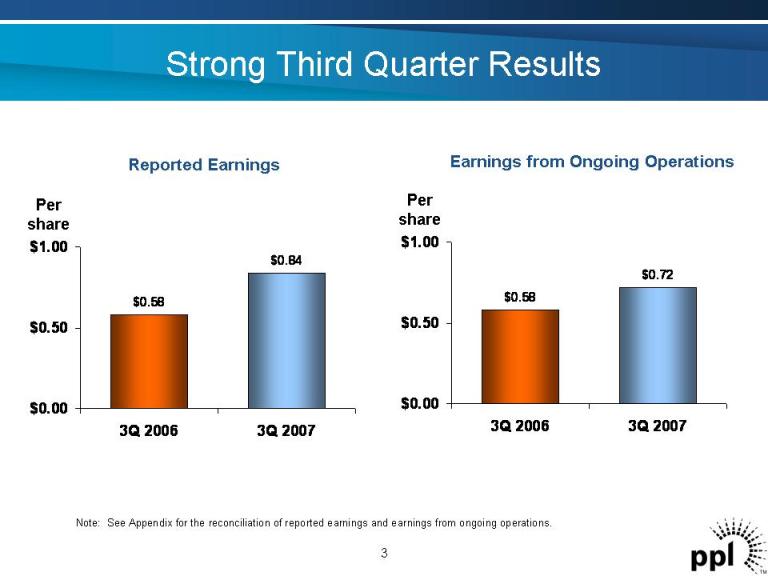
Strong Third Quarter Results Earnings from Ongoing Operations Per share $0.58 $0.72 $0.00 $0.50 $1.00 3Q 2006 3Q 2007 3 Note: See Appendix for the reconciliation of reported earnings and earnings from ongoing operations. Per share $0.58 $0.84 $0.00 $0.50 $1.00 3Q 2006 3Q 2007 Reported Earnings

Outstanding Year-to-Date Results Earnings from Ongoing Operations Per share $1.79 $2.00 $0.00 $0.50 $1.00 $1.50 $2.00 $2.50 YTD 2006 YTD 2007 4 Note: See Appendix for the reconciliation of reported earnings and earnings from ongoing operations. Per share $1.78 $2.25 $0.00 $0.50 $1.00 $1.50 $2.00 $2.50 YTD 2006 YTD 2007 Reported Earnings
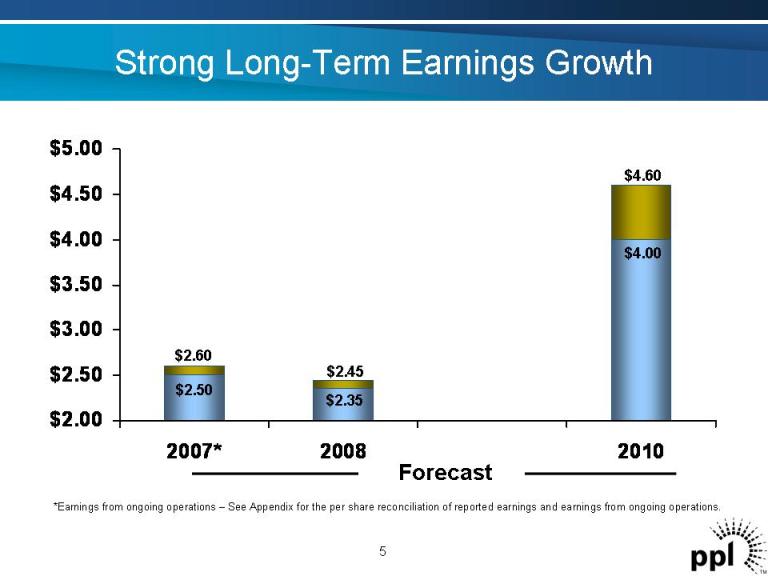
$2.00 $2.50 $3.00 $3.50 $4.00 $4.50 $5.00 2007* 2008 2010 Strong Long-Term Earnings Growth Forecast 5 *Earnings from ongoing operations – See Appendix for the per share reconciliation of reported earnings and earnings from ongoing operations. $2.60 $2.50 $2.35 $2.45 $4.00 $4.60
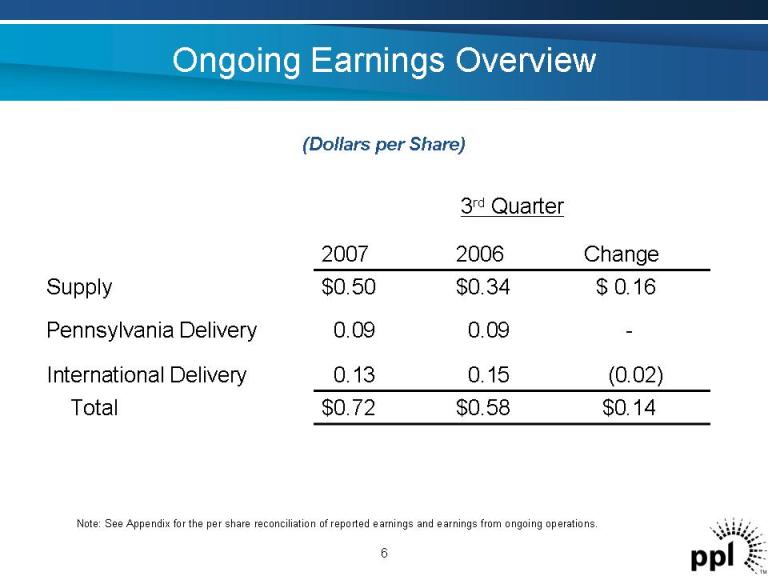
Ongoing Earnings Overview 3rd Quarter $0.14$0.58$0.72Total (0.02)0.150.13International Delivery -0.090.09Pennsylvania Delivery $ 0.16$0.34$0.50Supply Change20062007 (Dollars per Share) 6 Note: See Appendix for the per share reconciliation of reported earnings and earnings from ongoing operations.
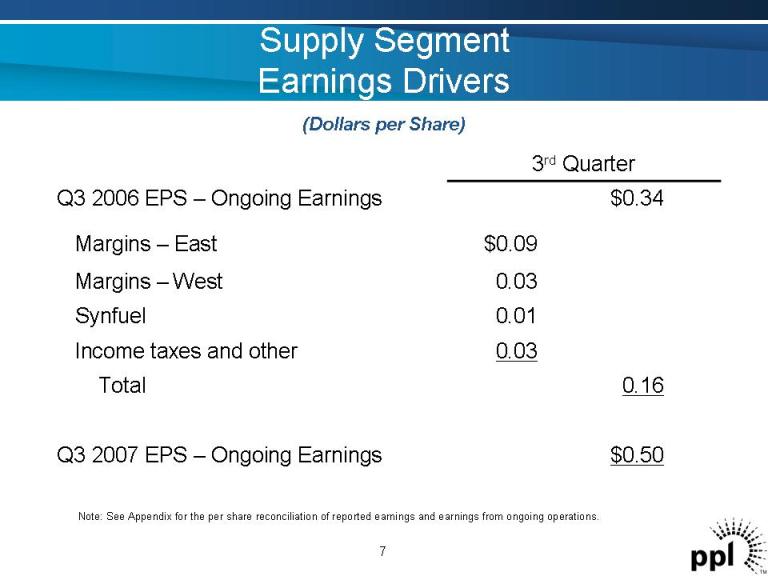
Supply Segment Earnings Drivers 0.01Synfuel 0.03Income taxes and other $0.50Q3 2007 EPS – Ongoing Earnings 0.16Total 0.03Margins – West $0.09Margins – East $0.34Q3 2006 EPS – Ongoing Earnings 3rd Quarter (Dollars per Share) Note: See Appendix for the per share reconciliation of reported earnings and earnings from ongoing operations. 7
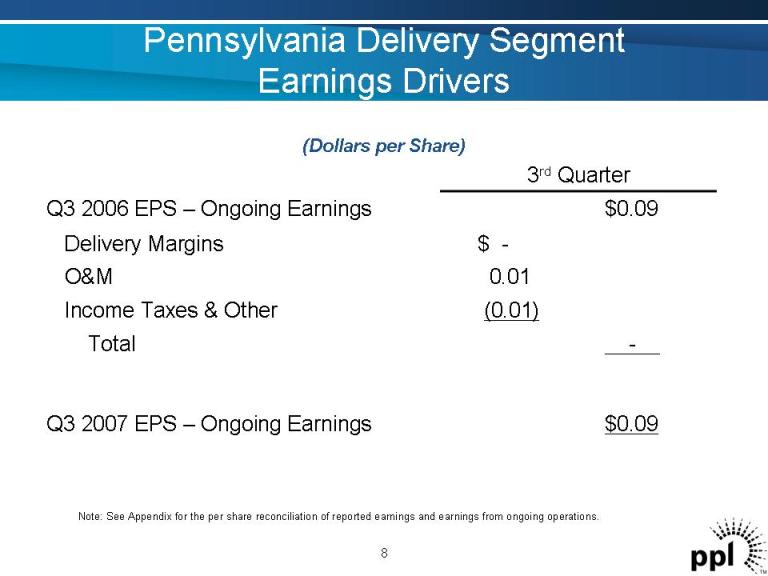
Pennsylvania Delivery Segment Earnings Drivers $0.09Q3 2007 EPS – Ongoing Earnings -Total (0.01)Income Taxes & Other 0.01O&M $ -Delivery Margins $0.09Q3 2006 EPS – Ongoing Earnings 3rd Quarter 8 (Dollars per Share) Note: See Appendix for the per share reconciliation of reported earnings and earnings from ongoing operations.
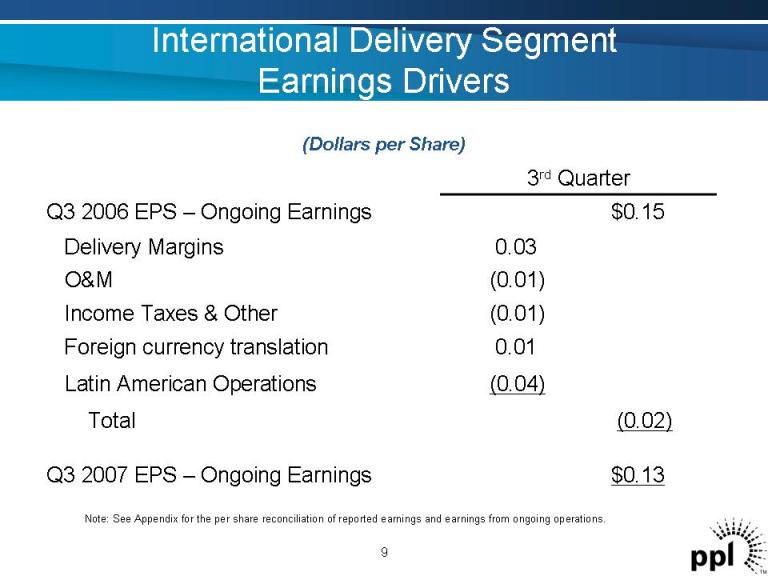
International Delivery Segment Earnings Drivers (0.04)Latin American Operations 0.01Foreign currency translation $0.13Q3 2007 EPS – Ongoing Earnings (0.02)Total (0.01)Income Taxes & Other (0.01)O&M 0.03Delivery Margins $0.15Q3 2006 EPS – Ongoing Earnings 3rd Quarter (Dollars per Share) 9 Note: See Appendix for the per share reconciliation of reported earnings and earnings from ongoing operations.
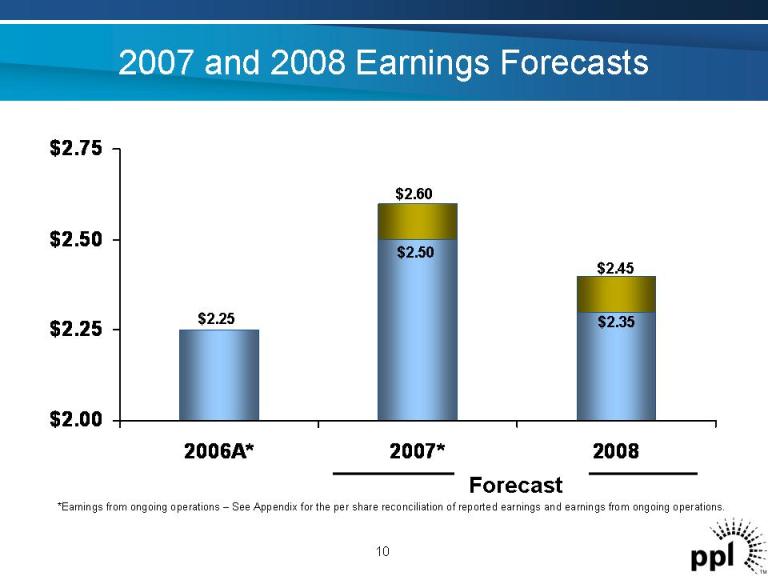
$2.00 $2.25 $2.50 $2.75 2006A* 2007* 2008 2007 and 2008 Earnings Forecasts Forecast 10 *Earnings from ongoing operations – See Appendix for the per share reconciliation of reported earnings and earnings from ongoing operations. $2.25 $2.50 $2.60 $2.35 $2.45
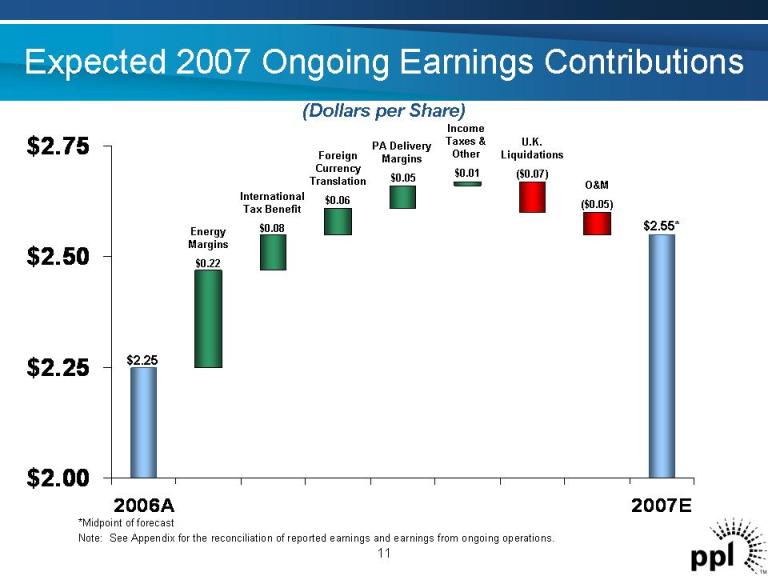
Expected 2007 Ongoing Earnings Contributions (Dollars per Share) 11 *Midpoint of forecast Note: See Appendix for the reconciliation of reported earnings and earnings from ongoing operations. $2.00 $2.25 $2.50 $2.75 2006A 2007E $2.25 Energy Margins $0.22 U.K. Liquidations ($0.07) O&M ($0.05) International Tax Benefit $0.08 $2.55* Foreign Currency Translation $0.06 PA Delivery Margins $0.05 Income Taxes & Other $0.01
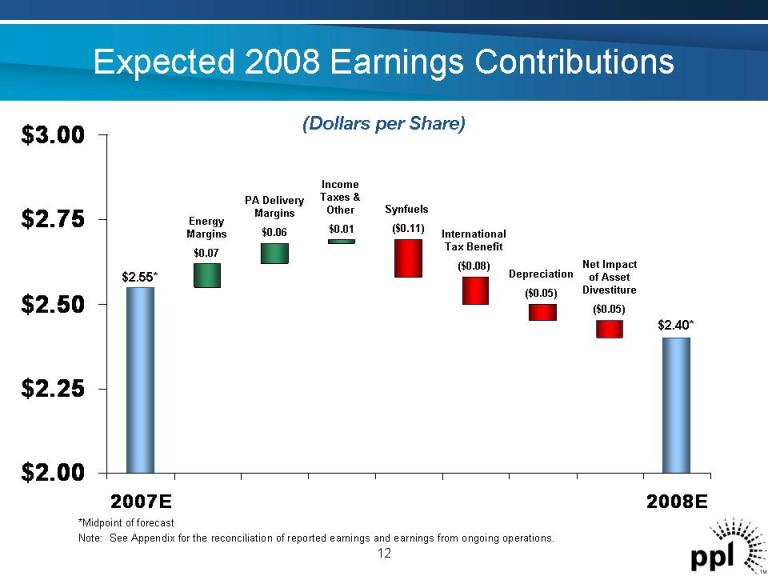
Expected 2008 Earnings Contributions (Dollars per Share) 12 *Midpoint of forecast Note: See Appendix for the reconciliation of reported earnings and earnings from ongoing operations. $2.00 $2.25 $2.50 $2.75 $3.00 2007E 2008E $2.55* PA Delivery Margins $0.06 Depreciation ($0.05) $2.40* Energy Margins $0.07 Synfuels ($0.11) International Tax Benefit ($0.08) Net Impact of Asset Divestiture ($0.05) Income Taxes & Other $0.01
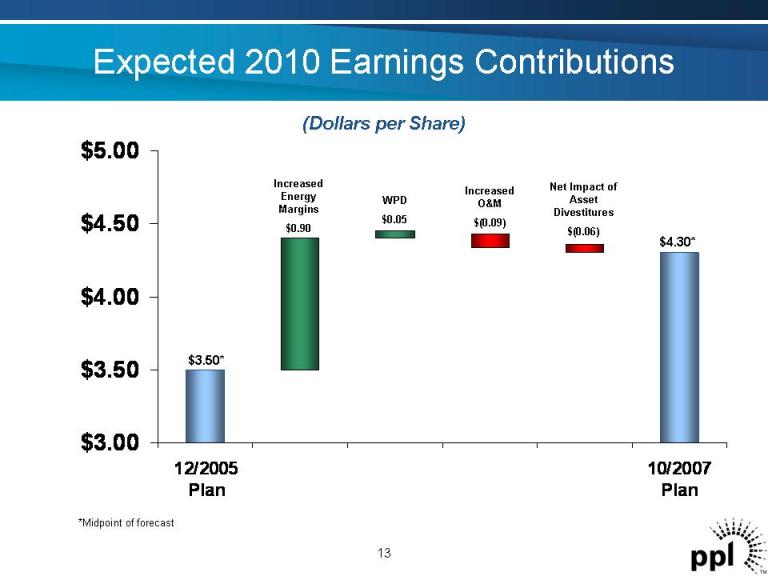
Expected 2010 Earnings Contributions (Dollars per Share) 13 *Midpoint of forecast $3.00 $3.50 $4.00 $4.50 $5.00 12/2005 Plan 10/2007 Plan $3.50* Increased Energy Margins $0.90 $4.30* Net Impact of Asset Divestitures $(0.06) WPD $0.05 Increased O&M $(0.09)

Cash Flow Forecast Millions -$300 -$100 $100 $300 $500 $700 $900 2006A 2007 2008 2009 2010 Free cash flow before dividends 14 Note: See Appendix for the reconciliation of cash flow measures.
Operational Update – Delivery Segment • Reached a settlement agreement on distribution rate increase; approval recommended by PUC Judge • Completed two solicitations for one-third of 2010 generation supply • Designing options to help customers mitigate price increases • Divesting of gas and propane delivery businesses 15
PPL EU Completed Second RFP for 2010 • Solicitation for 850 MWs of residential and small commercial and industrial load • PUC approval of winning bids received October 4, 2007 • Based on two solicitation results, residential bills could increase by approximately 34.5% • Third solicitation bids due March 24, 2008, PUC approval expected March 27, 2008 16
PPL Electric Utilities Customer Initiatives • Complete the transition from generation rate caps • Rate design strategies • Energy efficiency and DSM programs • Education and outreach • Proposal to smooth impact of rate cap expiration 17
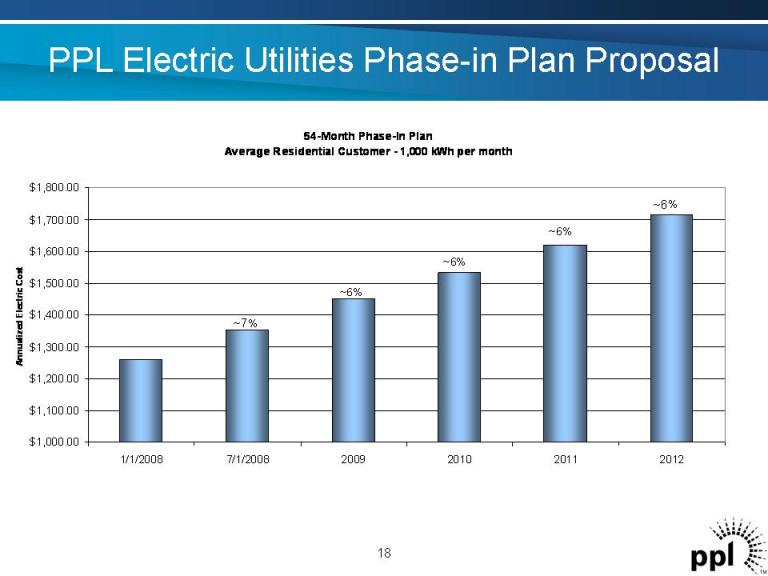
PPL Electric Utilities Phase-in Plan Proposal 18 54-Month Phase-In Plan Average Residential Customer - 1,000 kWh per month $1,000.00 $1,100.00 $1,200.00 $1,300.00 $1,400.00 $1,500.00 $1,600.00 $1,700.00 $1,800.00 1/1/2008 7/1/2008 2009 2010 2011 2012 Annualized Electric Cost ~6% ~6% ~7% ~6% ~6%

Operational Update – Supply Segment • Scrubbers expected to be completed on schedule and on budget • Generation uprates continue to progress • PJM completed 2009/2010 planning year RPM auction • Divestiture of non-core businesses • Asset expansion 19
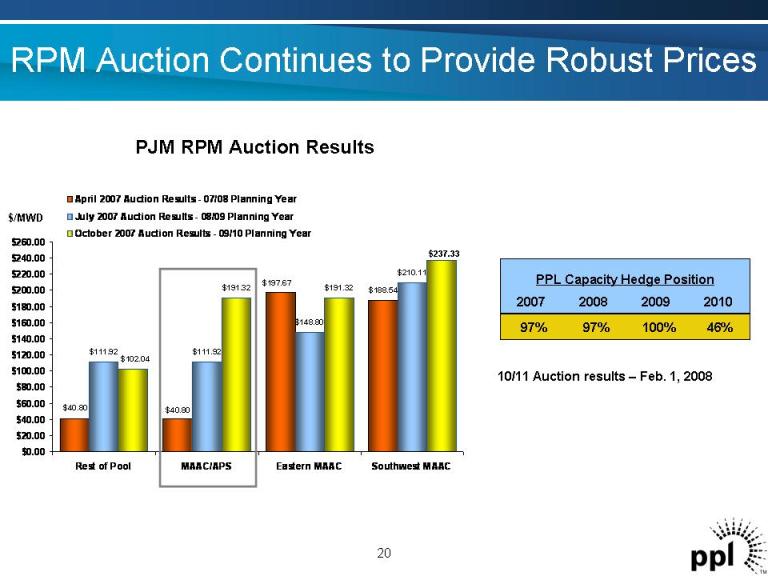
$188.54 $111.92 $111.92 $148.80 $210.11 $40.80 $40.80 $197.67 $191.32 $191.32 $102.04 $0.00 $20.00 $40.00 $60.00 $80.00 $100.00 $120.00 $140.00 $160.00 $180.00 $200.00 $220.00 $240.00 $260.00 Rest of Pool MAAC/APS Eastern MAAC Southwest MAAC April 2007 Auction Results - 07/08 Planning Year July 2007 Auction Results - 08/09 Planning Year October 2007 Auction Results - 09/10 Planning Year RPM Auction Continues to Provide Robust Prices 20 PJM RPM Auction Results 10/11 Auction results – Feb. 1, 2008 PPL Capacity Hedge Position 46%100%97% 97% 2010200920082007 $/MWD $237.33
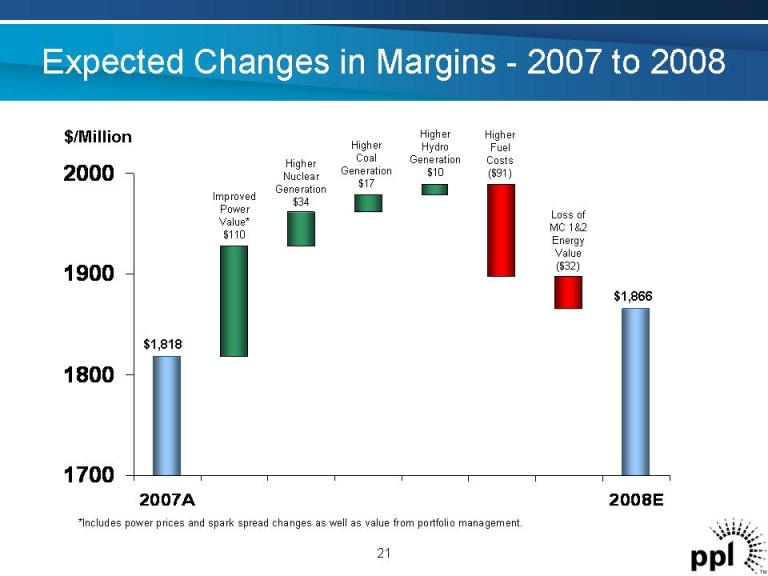
Expected Changes in Margins -2007 to 2008 21 *Includes power prices and spark spread changes as well as value from portfolio management. 1700 1800 1900 2000 2007A 2008E $1,818 $1,866 Improved Power Value* $110 Higher Nuclear Generation $34 Higher Coal Generation $17 Higher Hydro Generation $10 Higher Fuel Costs ($91) Loss of MC 1&2 Energy Value ($32) $/Million
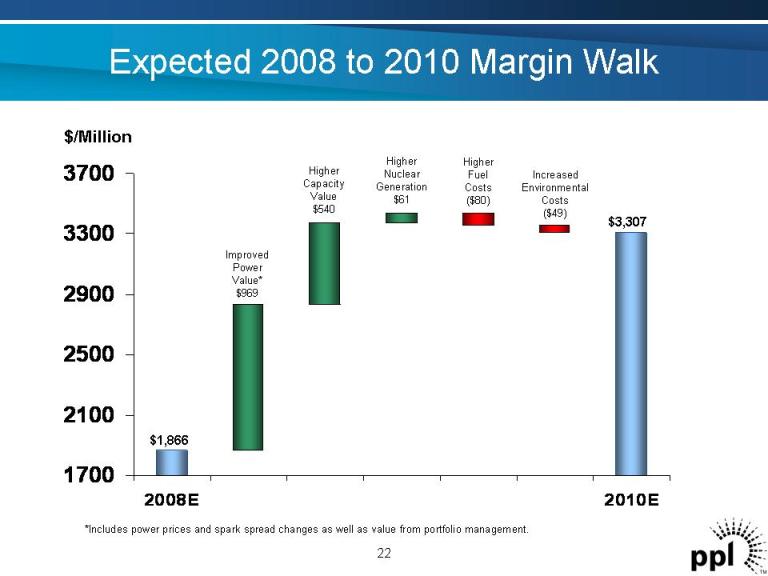
Expected 2008 to 2010 Margin Walk 22 1700 2100 2500 2900 3300 3700 2008E 2010E $1,866 $3,307 Improved Power Value* $969 Higher Capacity Value $540 Higher Nuclear Generation ��$61 Higher Fuel Costs ($80) Increased Environmental Costs ($49) *Includes power prices and spark spread changes as well as value from portfolio management. $/Million
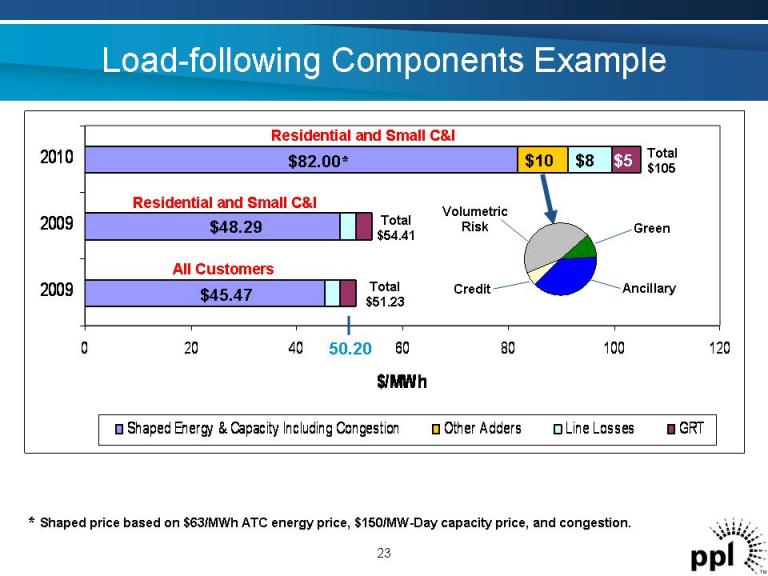
0 20 40 60 80 100 120 2009 2009 2010 $/MWh Shaped Energy & Capacity Including Congestion Other Adders Line Losses GRT Load-following Components Example 23 Total $105 $82.00* $45.47 Total $51.23 * Shaped price based on $63/MWh ATC energy price, $150/MW-Day capacity price, and congestion. $48.29 Total $54.41 Residential and Small C&I Residential and Small C&I All Customers 50.20 $10 Volumetric Risk Credit Ancillary Green $8 $5
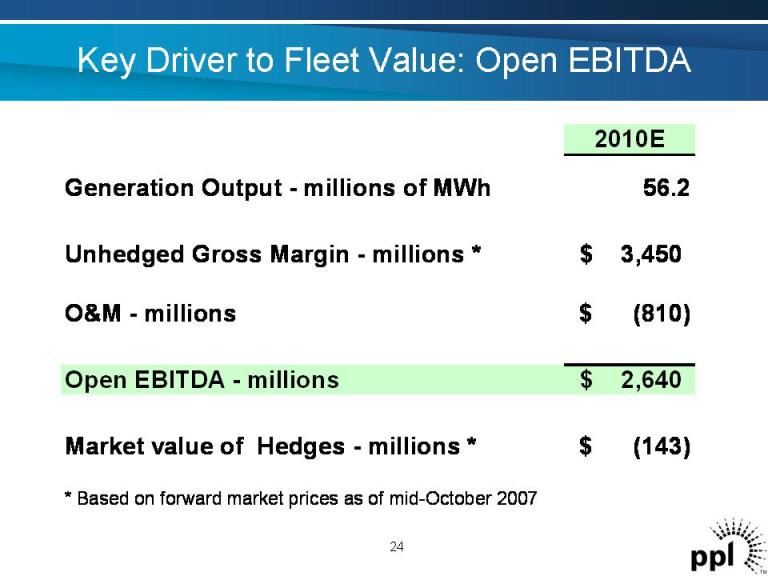
Key Driver to Fleet Value: Open EBITDA 24 2010E Generation Output - millions of MWh 56.2 Unhedged Gross Margin - millions * 3,450 $ O&M - millions (810) $ Open EBITDA - millions 2,640 $ Market value of Hedges - millions * (143) $ * Based on forward market prices as of mid-October 2007
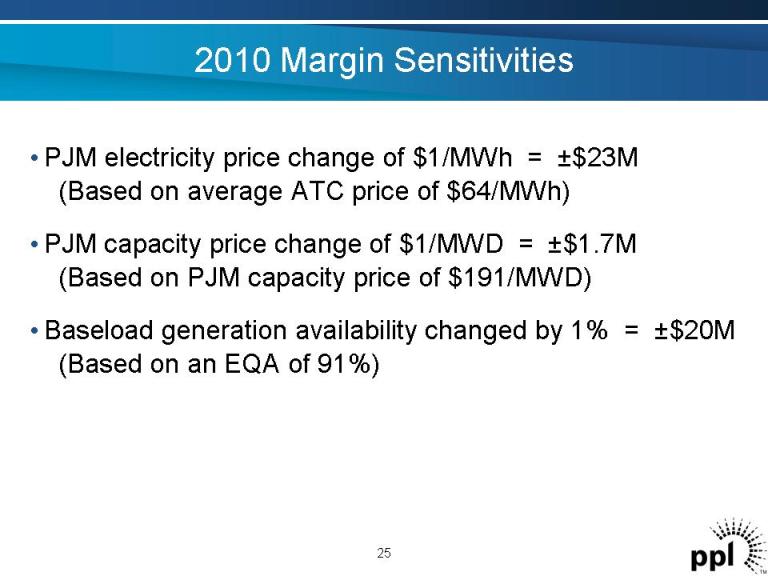
2010 Margin Sensitivities • PJM electricity price change of $1/MWh = ±$23M (Based on average ATC price of $64/MWh) • PJM capacity price change of $1/MWD = ±$1.7M (Based on PJM capacity price of $191/MWD) • Baseload generation availability changed by 1% = ±$20M (Based on an EQA of 91%) 25

PPL
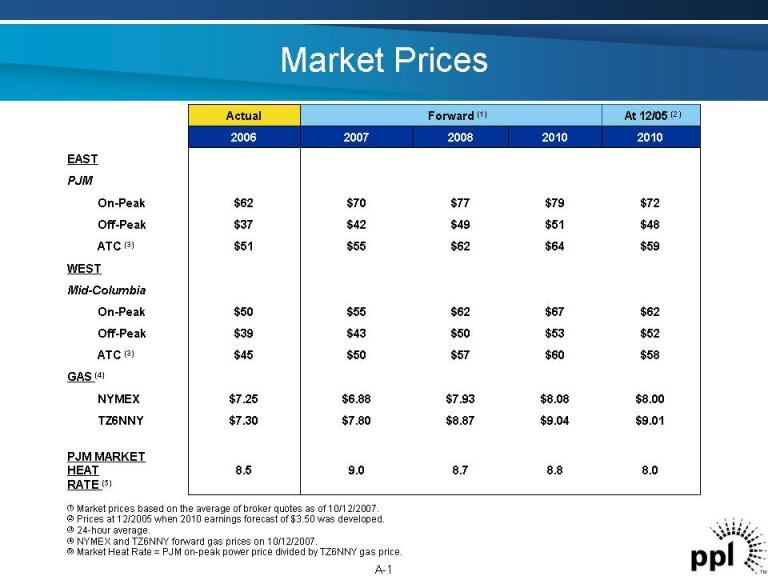
Market Prices EAST PJM On-Peak Off-Peak ATC (3) WEST Mid-Columbia On-Peak Off-Peak ATC (3) GAS (4) NYMEX TZ6NNY PJM MARKET HEAT RATE (5) Actual Forward (1) At 12/05 (2) 2006 2007 2008 2010 2010 8.5 $7.30 $7.25 $45 $39 $50 $51 $37 $62 8.0 $9.01 $8.00 $58 $52 $62 $59 $48 $72 8.88.79.0 $9.04$8.87$7.80 $8.08$7.93$6.88 $60$57$50 $53$50$43 $67$62$55 $64$62$55 $51$49$42 $79$77$70 (1) Market prices based on the average of broker quotes as of 10/12/2007. (2) Prices at 12/2005 when 2010 earnings forecast of $3.50 was developed. (3) 24-hour average. (4) NYMEX and TZ6NNY forward gas prices on 10/12/2007. (5) Market Heat Rate = PJM on-peak power price divided by TZ6NNY gas price. A-1
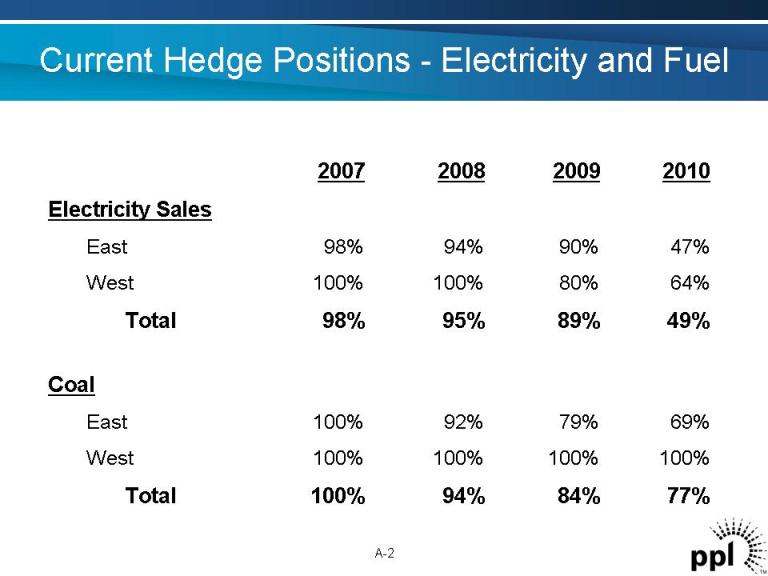
Current Hedge Positions -Electricity and Fuel A-2 2007 2008 2009 2010 Electricity Sales East 98% 94% 90% 47% West 100% 100% 80% 64% Total 98% 95% 89% 49% Coal East 100% 92% 79% 69% West 100% 100% 100% 100% Total 100% 94% 84% 77%
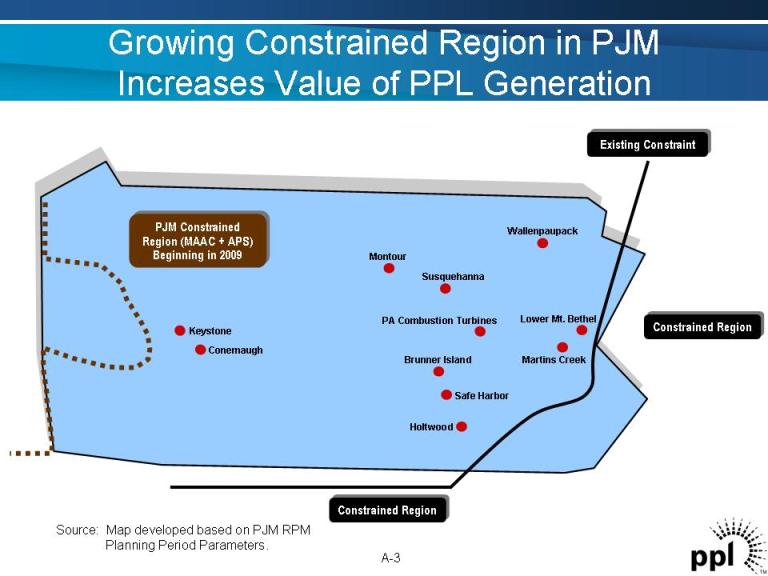
Growing Constrained Region in PJM Increases Value of PPL Generation Constrained Region Constrained Region Montour Brunner Island Holtwood Wallenpaupack Martins Creek Keystone Conemaugh Safe Harbor Lower Mt. Bethel PA Combustion Turbines Susquehanna Existing Constraint PJM Constrained Region (MAAC + APS) Beginning in 2009 Source: Map developed based on PJM RPM Planning Period Parameters. A-3
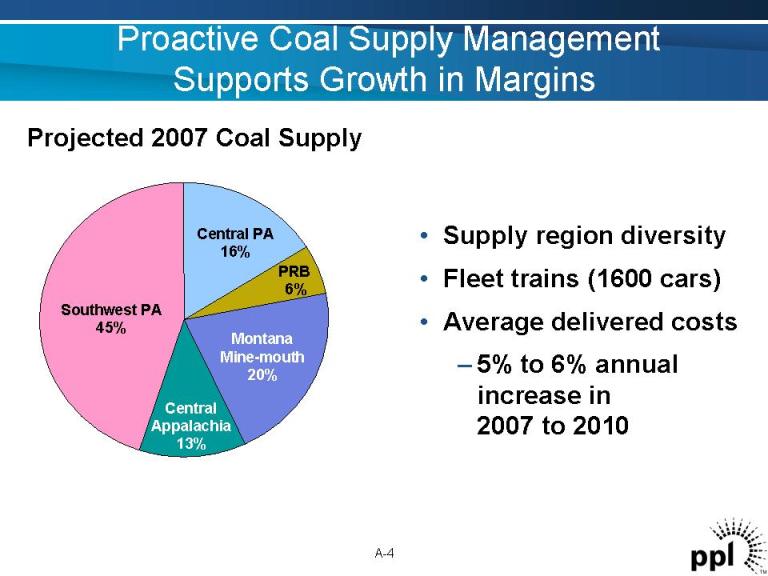
Proactive Coal Supply Management Supports Growth in Margins Projected 2007 Coal Supply • Supply region diversity • Fleet trains (1600 cars) • Average delivered costs – 5% to 6% annual increase in 2007 to 2010 A-4 Central PA 16% PRB 6% Montana Mine-mouth 20% Central Appalachia 13% Southwest PA 45%
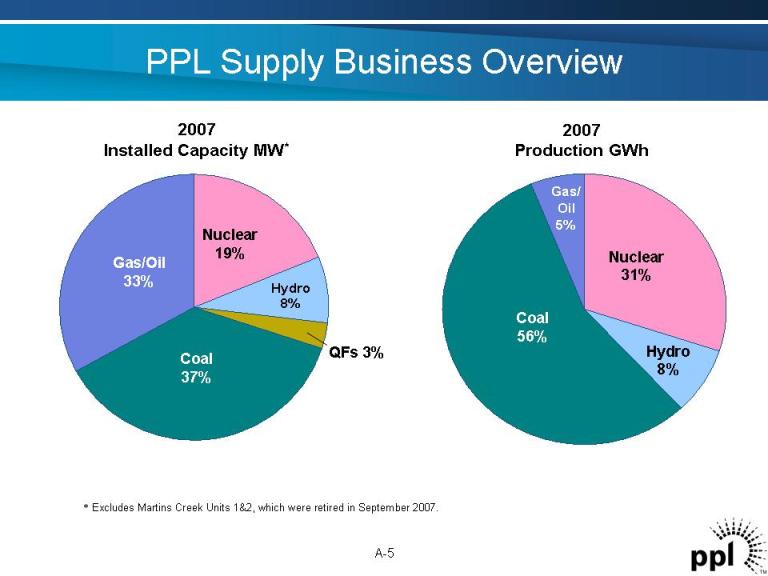
PPL Supply Business Overview 2007 Production GWh A-5 Gas/Oil 33% Coal 37% Nuclear 19% Hydro8% QFs 3% 2007 Installed Capacity MW* Gas/ Oil 5% Coal 56% Nuclear 31% Hydro 8% *Excludes Martins Creek Units 1&2, which were retired in September 2007.
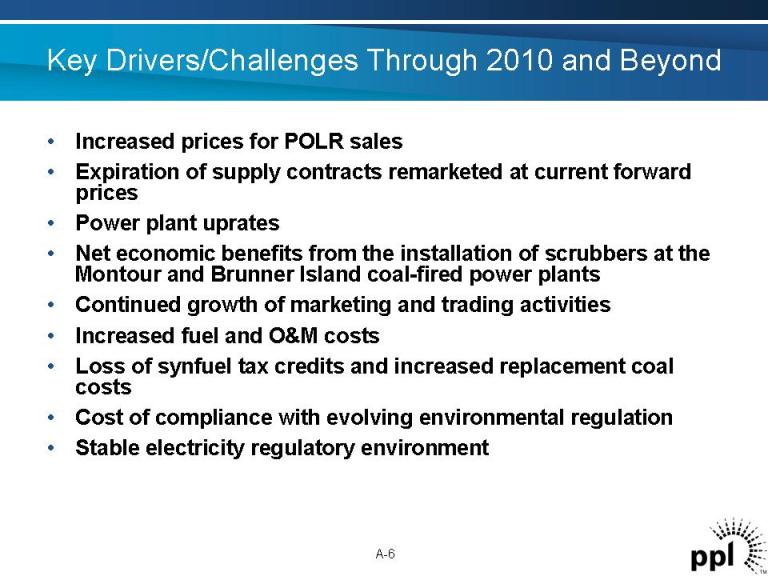
Key Drivers/Challenges Through 2010 and Beyond • Increased prices for POLR sales • Expiration of supply contracts remarketed at current forward prices • Power plant uprates • Net economic benefits from the installation of scrubbers at the Montour and Brunner Island coal-fired power plants • Continued growth of marketing and trading activities • Increased fuel and O&M costs • Loss of synfuel tax credits and increased replacement coal costs • Cost of compliance with evolving environmental regulation • Stable electricity regulatory environment A-6
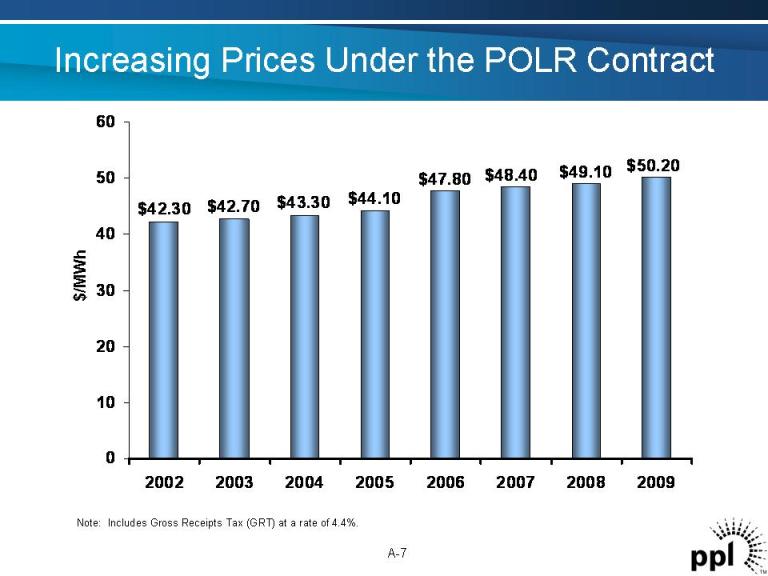
Increasing Prices Under the POLR Contract $42.30 $42.70 $43.30 $44.10 $47.80 $48.40 $49.10 $50.20 0 10 20 30 40 50 60 2002 2003 2004 2005 2006 2007 2008 2009 $/MWh A-7 Note: Includes Gross Receipts Tax (GRT) at a rate of 4.4%.
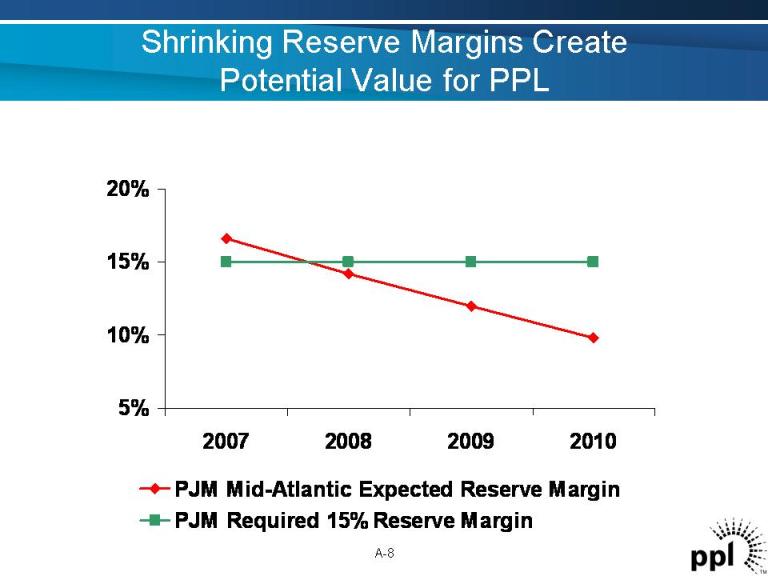
Shrinking Reserve Margins Create Potential Value for PPL 5% 10% 15% 20% 2007 2008 2009 2010 PJM Mid-Atlantic Expected Reserve Margin PJM Required 15% Reserve Margin A-8
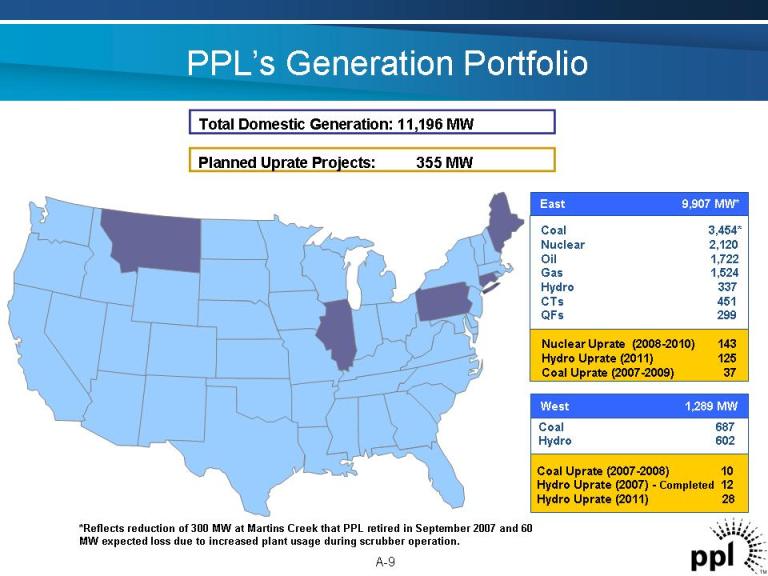
PPL’s Generation Portfolio Total Domestic Generation: 11,196 MW Planned Uprate Projects: 355 MW *Reflects reduction of 300 MW at Martins Creek that PPL retired in September 2007 and 60 MW expected loss due to increased plant usage during scrubber operation. A-9 Coal 3,454* Nuclear 2,120 Oil 1,722 Gas 1,524 Hydro 337 CTs 451 QFs 299 East 9,907 MW* Nuclear Uprate (2008-2010) 143 Hydro Uprate (2011) 125 Coal Uprate (2007-2009) 37 Coal 687 Hydro 602 West 1,289 MW Coal Uprate (2007-2008) 10 Hydro Uprate (2007) -Completed 12 Hydro Uprate (2011) 28

Scrubbers Expected to be Completed on Budget and on Schedule Montour Unit #2 Absorber A-10 Q2-09Brunner Island 1 & 2 Q4-08Brunner Island 3 Q2-08Montour 2 Q1-08Montour 1 Scheduled In-Service Dates
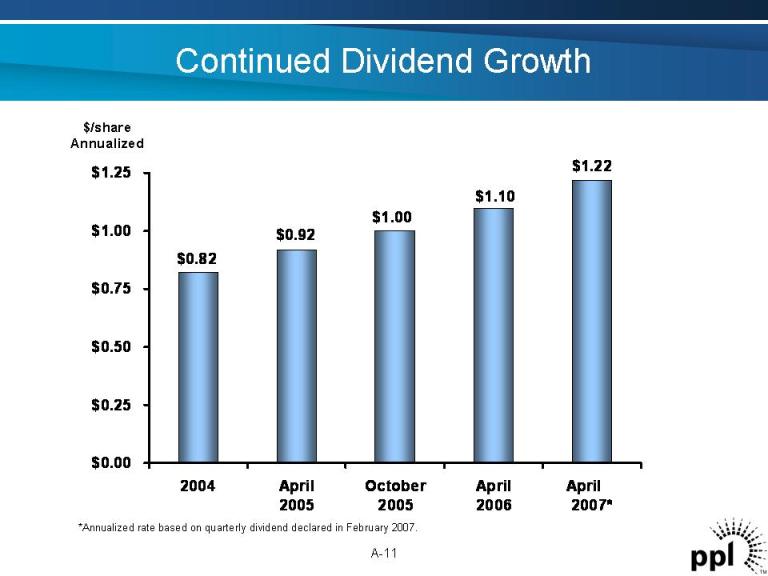
$0.82 $0.92 $1.00 $1.10 $1.22 $0.00 $0.25 $0.50 $0.75 $1.00 $1.25 2004 April 2005 October 2005 April 2006 April 2007* $/share Annualized Continued Dividend Growth A-11 *Annualized rate based on quarterly dividend declared in February 2007.
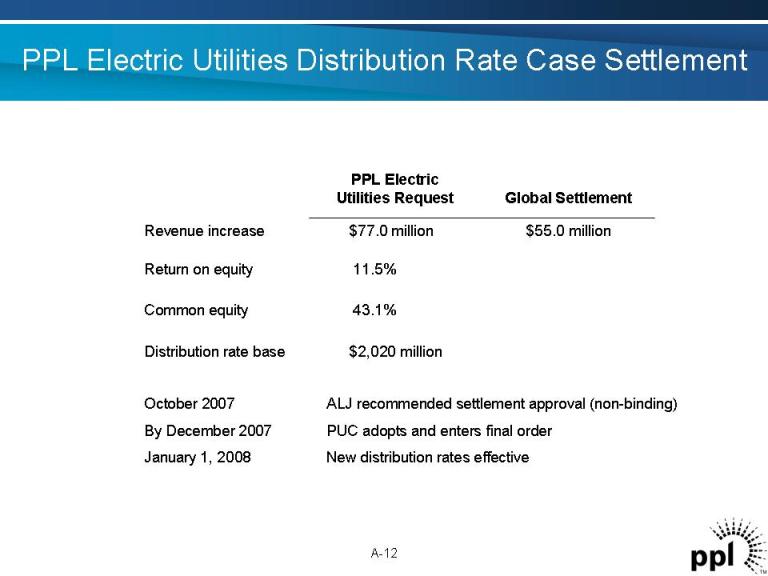
PPL Electric Utilities Distribution Rate Case Settlement $2,020 million Distribution rate base 43.1%Common equity 11.5%Return on equity $55.0 million$77.0 million Revenue increase Global Settlement PPL Electric Utilities Request A-12 October 2007 ALJ recommended settlement approval (non-binding) By December 2007 PUC adopts and enters final order January 1, 2008 New distribution rates effective
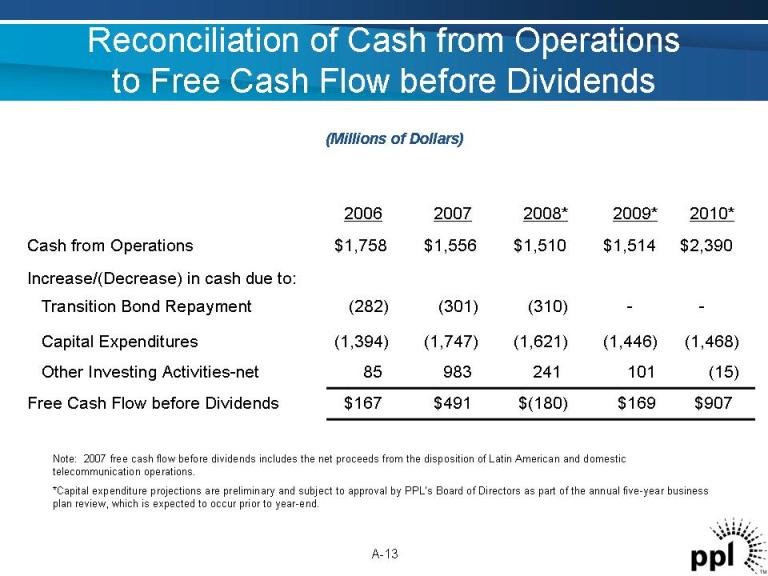
Reconciliation of Cash from Operations to Free Cash Flow before Dividends (Millions of Dollars) A-13 $907$169$(180)$491$167Free Cash Flow before Dividends (15)10124198385Other Investing Activities-net (1,468)(1,446)(1,621)(1,747)(1,394)Capital Expenditures --(310)(301)(282)Transition Bond Repayment Increase/(Decrease) in cash due to: $2,390$1,514$1,510$1,556$1,758Cash from Operations 2010*2009*2008*20072006 Note: 2007 free cash flow before dividends includes the net proceeds from the disposition of Latin American and domestic telecommunication operations. *Capital expenditure projections are preliminary and subject to approval by PPL’s Board of Directors as part of the annual five-year business plan review, which is expected to occur prior to year-end.
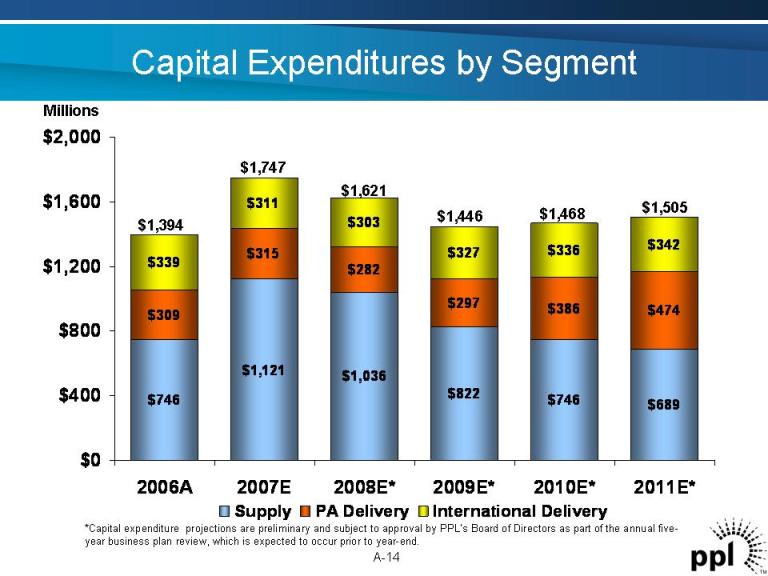
Millions $746 $1,121 $1,036 $822 $746 $689 $309 $315 $282 $297 $386 $474 $339 $311 $303 $327 $336 $342 $0 $400 $800 $1,200 $1,600 $2,000 2006A 2007E 2008E* 2009E* 2010E* 2011E* Supply PA Delivery International Delivery $1,394 $1,468 $1,505$1,446 $1,621 $1,747 Capital Expenditures by Segment A-14 *Capital expenditure projections are preliminary and subject to approval by PPL’s Board of Directors as part of the annual five- year business plan review, which is expected to occur prior to year-end.
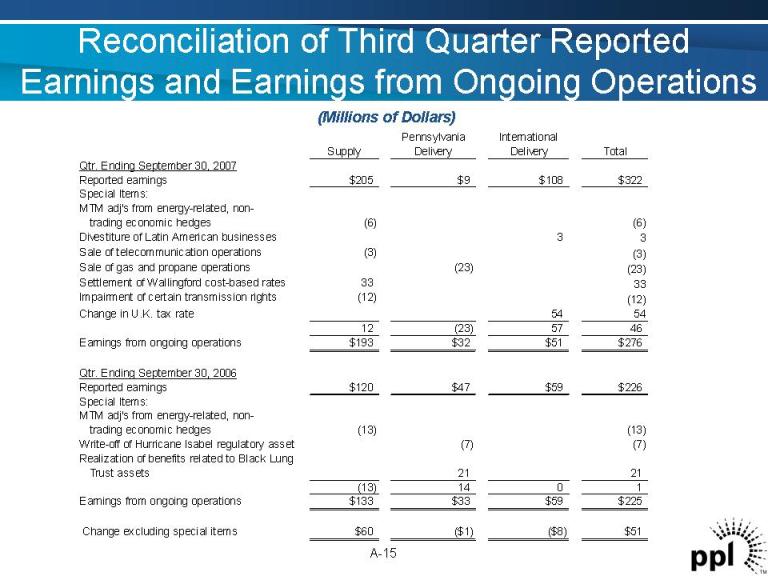
Reconciliation of Third Quarter Reported Earnings and Earnings from Ongoing Operations A-15 (Millions of Dollars) Pennsylvania International Supply Delivery Delivery Total Qtr. Ending September 30, 2007 Reported earnings $205 $9 $108 $322 Special Items: MTM adj's from energy-related, nontrading economic hedges (6) (6) Divestiture of Latin American businesses 3 3 Sale of telecommunication operations (3) (3) Sale of gas and propane operations (23) (23) Settlement of Wallingford cost-based rates 33 33 Impairment of certain transmission rights (12) (12) Change in U.K. tax rate 54 54 12 (23) 57 46 Earnings from ongoing operations $193 $32 $51 $276 Qtr. Ending September 30, 2006 Reported earnings $120 $47 $59 $226 Special Items: MTM adj's from energy-related, nontrading economic hedges (13) (13) Write-off of Hurricane Isabel regulatory asset (7) (7) Realization of benefits related to Black Lung Trust assets 21 21 (13) 14 0 1 Earnings from ongoing operations $133 $33 $59 $225 Change excluding special items $60 ($1) ($8) $51
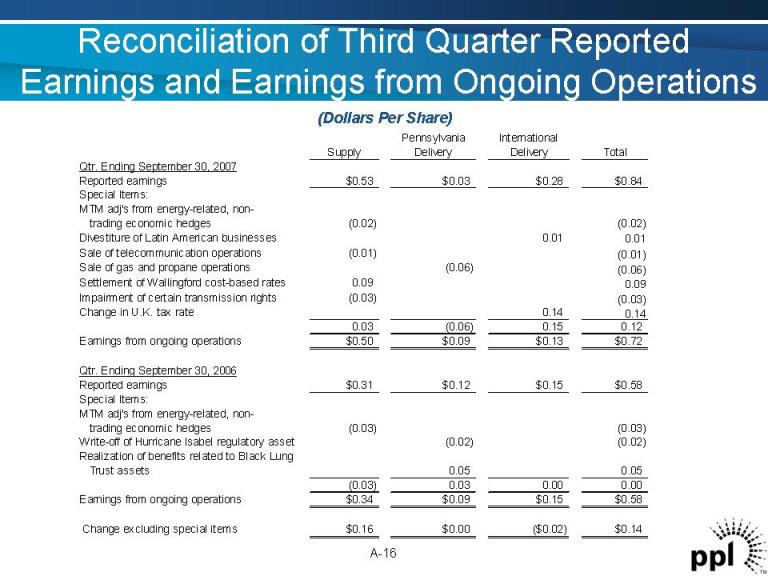
Reconciliation of Third Quarter Reported Earnings and Earnings from Ongoing Operations A-16 Pennsylvania International Supply Delivery Delivery Total Qtr. Ending September 30, 2007 Reported earnings $0.53 $0.03 $0.28 $0.84 Special Items: MTM adj's from energy-related, nontrading economic hedges (0.02) (0.02) Divestiture of Latin American businesses 0.01 0.01 Sale of telecommunication operations (0.01) (0.01) Sale of gas and propane operations (0.06) (0.06) Settlement of Wallingford cost-based rates 0.09 0.09 Impairment of certain transmission rights (0.03) (0.03) Change in U.K. tax rate 0.14 0.14 0.03 (0.06) 0.15 0.12 Earnings from ongoing operations $0.50 $0.09 $0.13 $0.72 Qtr. Ending September 30, 2006 Reported earnings $0.31 $0.12 $0.15 $0.58 Special Items: MTM adj's from energy-related, nontrading economic hedges (0.03) (0.03) Write-off of Hurricane Isabel regulatory asset (0.02) (0.02) Realization of benefits related to Black Lung Trust assets 0.05 0.05 (0.03) 0.03 0.00 0.00 Earnings from ongoing operations $0.34 $0.09 $0.15 $0.58 Change excluding special items $0.16 $0.00 ($0.02) $0.14 (Dollars Per Share)
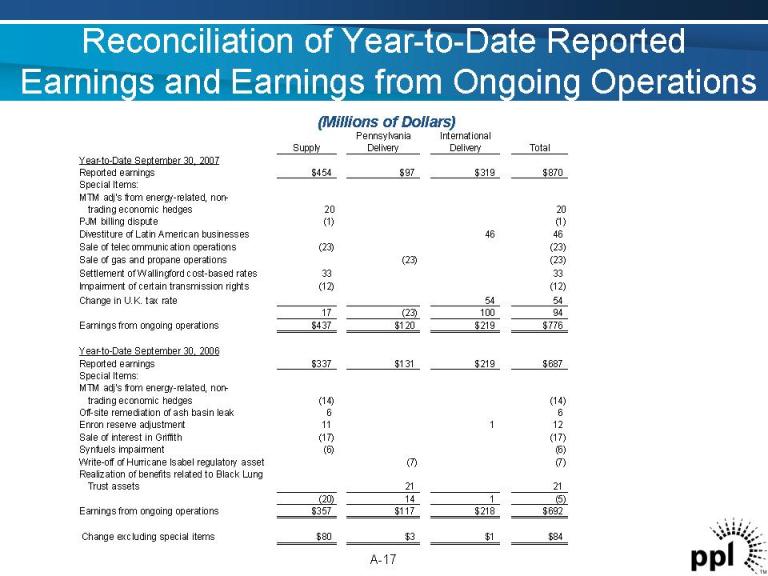
Reconciliation of Year-to-Date Reported Earnings and Earnings from Ongoing Operations A-17 (Millions of Dollars) Pennsylvania International Supply Delivery Delivery Total Year-to-Date September 30, 2007 Reported earnings $454 $97 $319 $870 Special Items: MTM adj's from energy-related, nontrading economic hedges 20 20 PJM billing dispute (1) (1) Divestiture of Latin American businesses 46 46 Sale of telecommunication operations (23) (23) Sale of gas and propane operations (23) (23) Settlement of Wallingford cost-based rates 33 33 Impairment of certain transmission rights (12) (12) Change in U.K. tax rate 54 54 17 (23) 100 94 Earnings from ongoing operations $437 $120 $219 $776 Year-to-Date September 30, 2006 Reported earnings $337 $131 $219 $687 Special Items: MTM adj's from energy-related, nontrading economic hedges (14) (14) Off-site remediation of ash basin leak 6 6 Enron reserve adjustment 11 1 12 Sale of interest in Griffith (17) (17) Synfuels impairment (6) (6) Write-off of Hurricane Isabel regulatory asset (7) (7) Realization of benefits related to Black Lung Trust assets 21 21 (20) 14 1 (5) Earnings from ongoing operations $357 $117 $218 $692 Change excluding special items $80 $3 $1 $84
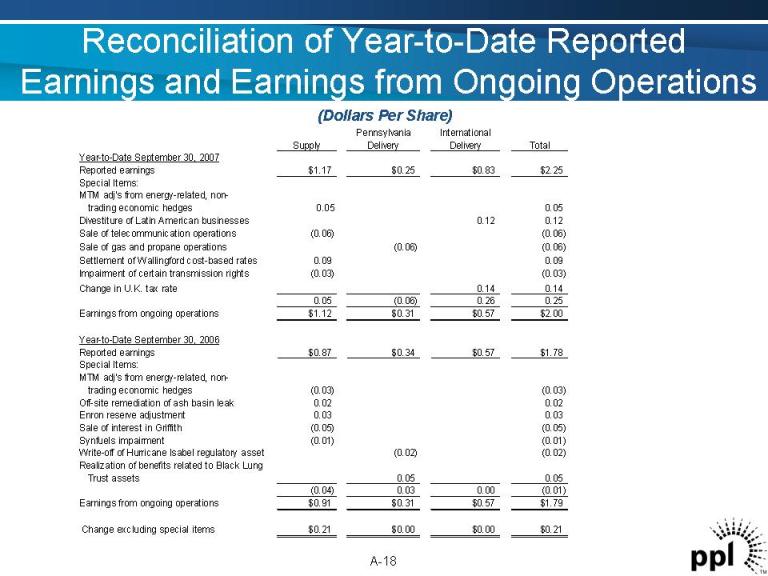
Reconciliation of Year-to-Date Reported Earnings and Earnings from Ongoing Operations A-18 Pennsylvania International Supply Delivery Delivery Total Year-to-Date September 30, 2007 Reported earnings $1.17 $0.25 $0.83 $2.25 Special Items: MTM adj's from energy-related, nontrading economic hedges 0.05 0.05 Divestiture of Latin American businesses 0.12 0.12 Sale of telecommunication operations (0.06) (0.06) Sale of gas and propane operations (0.06) (0.06) Settlement of Wallingford cost-based rates 0.09 0.09 Impairment of certain transmission rights (0.03) (0.03) Change in U.K. tax rate 0.14 0.14 0.05 (0.06) 0.26 0.25 Earnings from ongoing operations $1.12 $0.31 $0.57 $2.00 Year-to-Date September 30, 2006 Reported earnings $0.87 $0.34 $0.57 $1.78 Special Items: MTM adj's from energy-related, nontrading economic hedges (0.03) (0.03) Off-site remediation of ash basin leak 0.02 0.02 Enron reserve adjustment 0.03 0.03 Sale of interest in Griffith (0.05) (0.05) Synfuels impairment (0.01) (0.01) Write-off of Hurricane Isabel regulatory asset (0.02) (0.02) Realization of benefits related to Black Lung Trust assets 0.05 0.05 (0.04) 0.03 0.00 (0.01) Earnings from ongoing operations $0.91 $0.31 $0.57 $1.79 Change excluding special items $0.21 $0.00 $0.00 $0.21 (Dollars Per Share)
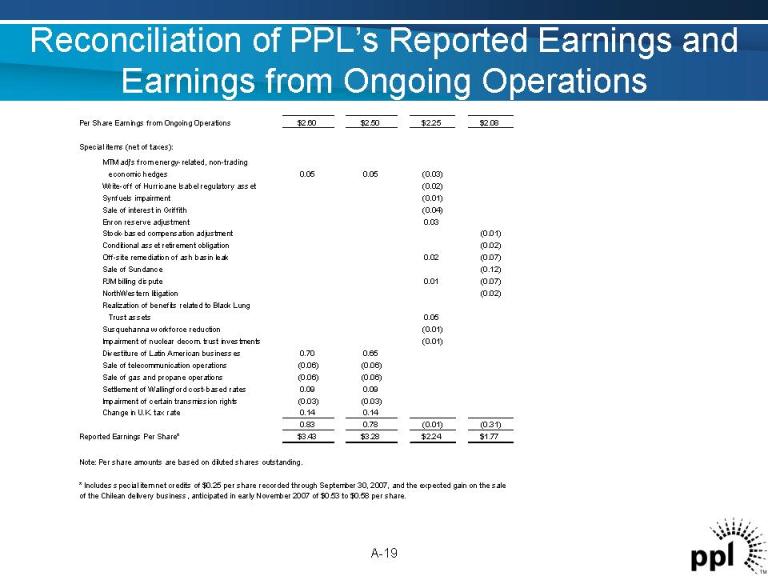
Reconciliation of PPL’s Reported Earnings and Earnings from Ongoing Operations High Low 2007 2007 2006 2005 Per Share Earnings from Ongoing Operations $2.60 $2.50 $2.25 $2.08 Special items (net of taxes): economic hedges 0.05 0.05 (0.03) Write-off of Hurricane Isabel regulatory asset (0.02) Synfuels impairment (0.01) Sale of interest in Griffith (0.04) Enron reserve adjustment 0.03 Stock-based compensation adjustment (0.01) Conditional asset retirement obligation (0.02) Off-site remediation of ash basin leak 0.02 (0.07) Sale of Sundance (0.12) PJM billing dispute 0.01 (0.07) NorthWestern litigation (0.02) Realization of benefits related to Black Lung Trust assets 0.05 Susquehanna workforce reduction (0.01) Impairment of nuclear decom. trust investments (0.01) Divestiture of Latin American businesses 0.70 0.65 Sale of telecommunication operations (0.06) (0.06) Sale of gas and propane operations (0.06) (0.06) Settlement of Wallingford cost-based rates 0.09 0.09 Impairment of certain transmission rights (0.03) (0.03) Change in U.K. tax rate 0.14 0.14 0.83 0.78 (0.01) (0.31) Reported Earnings Per Share* $3.43 $3.28 $2.24 $1.77 Note: Per share amounts are based on diluted shares outstanding. Forecast MTM adj's from energy-related, non-trading Actual * Includes special item net credits of $0.25 per share recorded through September 30, 2007, and the expected gain on the sale of the Chilean delivery business, anticipated in early November 2007 of $0.53 to $0.58 per share. A-19
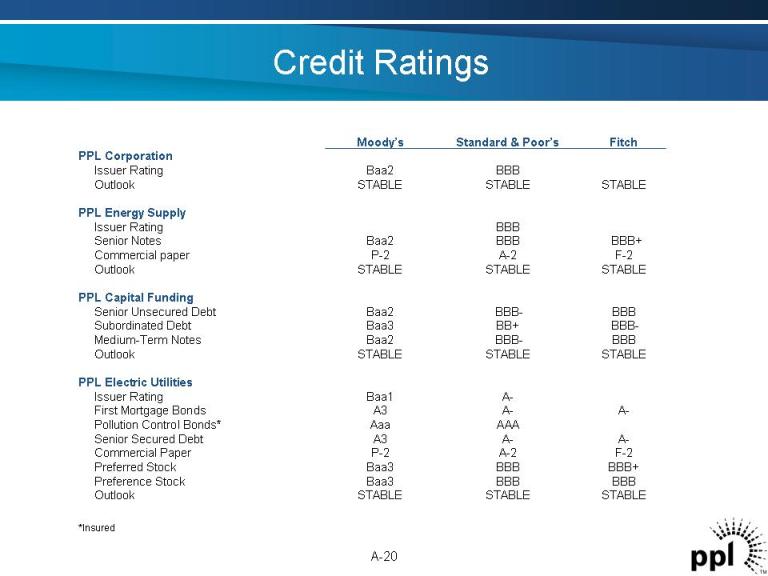
Credit Ratings A-20 STABLE STABLE STABLE Outlook AAA3Senior Secured Debt F-2A-2P-2Commercial Paper BBB+ BBBBaa3Preferred Stock ABaa1Issuer Rating AAA3First Mortgage Bonds AAAAaa Pollution Control Bonds* BBBBBBBaa3Preference Stock PPL Electric Utilities BBBBBBBaa2Senior Unsecured Debt BBBBB+ Baa3Subordinated Debt BBBBBBBaa2Medium- Term Notes STABLE STABLE STABLE Outlook PPL Capital Funding BBB Issuer Rating BBB+ BBBBaa2Senior Notes F-2A-2P-2Commercial paper STABLE STABLE STABLE Outlook PPL Energy Supply STABLE STABLE STABLE Outlook BBBBaa2Issuer Rating PPL Corporation Fitch Standard & Poor’s Moody’s *Insured

Credit Ratings (cont.) A-21 A-3Commercial Paper ABBB+ Baa1Senior Unsecured Debt F2A-2P-2Commercial Paper STABLE STABLE STABLE Outlook BBB+ BBB+ Baa1Issuer Rating ABBB+ Baa1Senior Unsecured Debt F2A-2Commercial Paper STABLE STABLE STABLE Outlook Western Power Distribution (South West) PLC BBB+ BBB+ Issuer Rating Western Power Distribution (South Wales) PLC STABLE STABLE STABLE Outlook STABLE STABLE STABLE Outlook BBBBBB-Issuer Rating WPD Holdings LLP BBBBBBBaa3Issuer Rating BBBBBBBaa3Senior Unsecured Debt A-3Commercial Paper WPD Holdings Limited BBBBBBBaa3Pass- Through Certificates STABLE STABLE Outlook PPL Montana AAAAAAAaa Transition Bonds PPL Transition Bond Co. Fitch Standard & Poor’s Moody’s
Forward-Looking Information Statement Statements contained in this news release, including statements with respect to future earnings, energy prices, margins, sales and supply, marketing performance, growth, revenues, expenses, rates, regulation, cash flows, credit profile, financing, dividends, business disposition, corporate strategy, capital additions and expenditures, and generating capacity and performance, are “forward-looking statements” within the meaning of the federal securities laws. Although PPL Corporation believes that the expectations and assumptions reflected in these forward-looking statements are reasonable, these statements involve a number of risks and uncertainties, and actual results may differ materially from the results discussed in the statements. The following are among the important factors that could cause actual results to differ materially from the forward-looking statements: market demand and prices for energy, capacity and fuel; market prices for crude oil and the potential impact on the phaseout of synthetic fuel tax credits and synthetic fuel operations; weather conditions affecting generation production, customer energy usage and operating costs; competition in retail and wholesale power markets; liquidity of wholesale power markets; the effect of any business or industry restructuring; the profitability and liquidity, including access to capital markets and credit facilities of PPL Corporation and its subsidiaries; new accounting requirements or new interpretations or applications of existing requirements; operation and availability of existing generation facilities and operating costs; transmission and distribution system conditions and operating costs; current and future environmental conditions and requirements and the related costs of compliance, including environmental capital expenditures and emission allowance and other expenses; significant delays in the planned installation of pollution control equipment at certain coal-fired generating units in Pennsylvania due to weather conditions, contractor performance or other reasons; development of new projects, markets and technologies; performance of new ventures; asset acquisitions and dispositions; political, regulatory or economic conditions in states, regions or countries where PPL Corporation or its subsidiaries conduct business; any impact of hurricanes or other severe weather on PPL and its subsidiaries, including any impact on fuel prices; receipt of necessary governmental permits, approvals and rate relief; new state, federal or foreign legislation, including new tax legislation; state, federal and foreign regulatory developments; any impact of state, federal or foreign investigations applicable to PPL Corporation and its subsidiaries and the energy industry; capital markets conditions, including changes in interest rates, and decisions regarding capital structure; stock price performance of PPL Corporation; the market prices of equity securities and the impact on pension costs and resultant cash funding requirements for defined benefit pension plans; securities and credit ratings; disposition proceeds; foreign currency exchange rates; the outcome of litigation against PPL Corporation and its subsidiaries; potential effects of threatened or actual terrorism or war or other hostilities; and the commitments and liabilities of PPL Corporation and its subsidiaries. Any such forward-looking statements should be considered in light of such important factors and in conjunction with PPL Corporation’s Form 10-K and other reports on file with the Securities and Exchange Commission. A-22
Definitions of Financial Measures A-23 “Earnings from ongoing operations” excludes the impact of special items. Special items include charges, credits or gains that are unusual or non-recurring and the mark-to-market impact of energy-related, non-trading economic hedges. The mark-to-market impact of these hedges is economically neutral to the company in that offsetting gains or losses on underlying accrual positions will be recognized as energy is delivered over the terms of the contracts. Earnings from ongoing operations should not be considered as an alternative to reported earnings, or net income, which is an indicator of operating performance determined in accordance with generally accepted accounting principles (GAAP). PPL believes that earnings from ongoing operations, although a non-GAAP measure, is also useful and meaningful to investors because it provides them with PPL’s underlying earnings performance as another criterion in making their investment decisions. PPL’s management also uses earnings from ongoing operations in measuring certain corporate performance goals. Other companies may use different measures to present financial performance. “Free cash flow before dividends” is derived by deducting capital expenditures and other investing activities-net, as well as the repayment of transition bonds, from cash flow from operations. Free cash flow before dividends should not be considered as an alternative to cash flow from operations, which is determined in accordance with GAAP. PPL believes that free cash flow before dividends, although a non-GAAP measure, is an important measure to both management and investors since it is an indicator of the company’s ability to sustain operations and growth without additional outside financing beyond the requirement to fund maturing debt obligations. Other companies may calculate free cash flow before dividends in a different manner.