Second Quarter Earnings Call August 1, 2008 Exhibit 99.2
Cautionary Statements And Factors That May Affect Future Results Any statements made in this presentation about future operating results or other future events are forward-looking statements under the Safe Harbor Provisions of the Private Securities Litigation Reform Act of 1995. Actual results may differ materially from such forward-looking statements. A discussion of factors that could cause actual results or events to vary is contained in the Appendix to this presentation and in the Company’s SEC filings. 1
Agenda • Second Quarter 2008 Earnings and Review of 2008 and 2010 Earnings Forecast and Outlook • Second Quarter Segment Results and Financial Overview • Operational Review • Q&A J. H. Miller P. A. Farr W. H. Spence 2
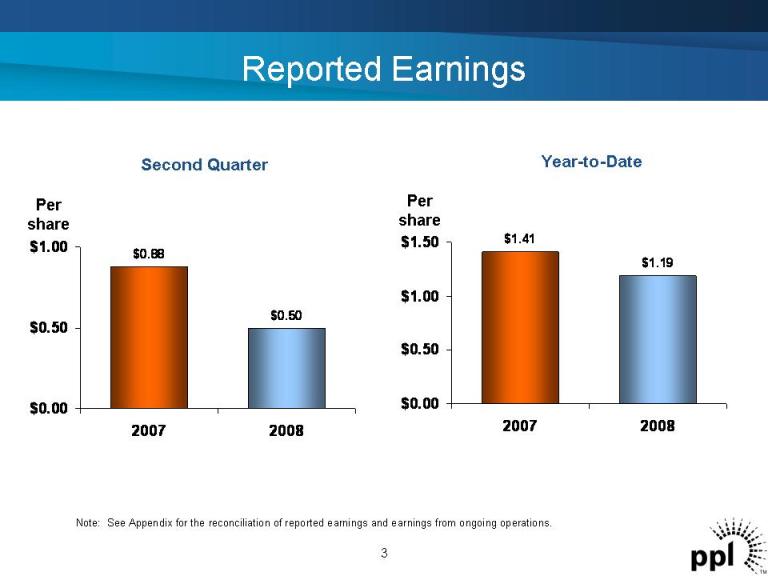
Reported Earnings Year-to-Date Per share $1.41 $1.19 $0.00 $0.50 $1.00 $1.50 2007 2008 3 Note: See Appendix for the reconciliation of reported earnings and earnings from ongoing operations. Per share $0.88 $0.50 $0.00 $0.50 $1.00 2007 2008 Second Quarter
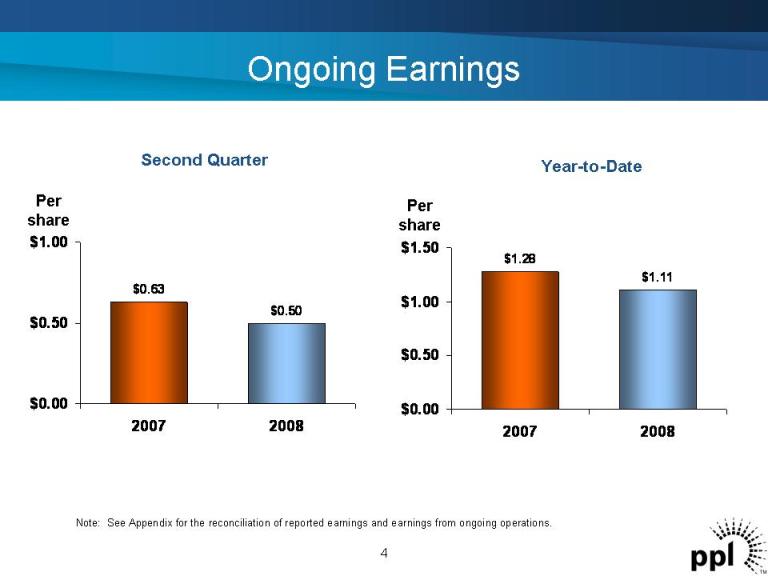
Ongoing Earnings Year-to-Date Per share $1.28 $1.11 $0.00 $0.50 $1.00 $1.50 2007 2008 4 Note: See Appendix for the reconciliation of reported earnings and earnings from ongoing operations. Per share $0.63 $0.50 $0.00 $0.50 $1.00 2007 2008 Second Quarter
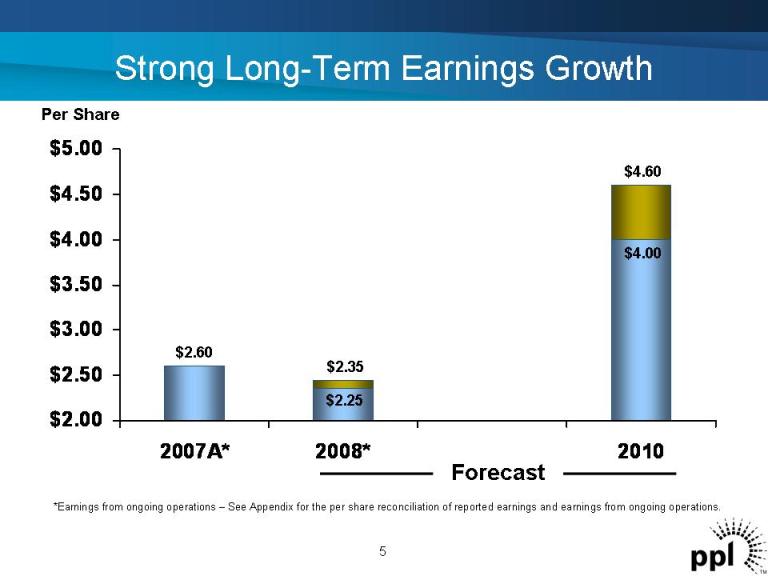
$2.00 $2.50 $3.00 $3.50 $4.00 $4.50 $5.00 2007A* 2008* 2010 Strong Long-Term Earnings Growth Forecast 5 *Earnings from ongoing operations – See Appendix for the per share reconciliation of reported earnings and earnings from ongoing operations. $2.60 $2.25 $2.35 $4.00 $4.60 Per Share
Pennsylvania Update • Energy Fund approved • Conservation, DSM postponed until Fall • Procurement and mitigation also postponed; PPL Electric procurement plan for 2010 on schedule • Legislature returns September 15 6
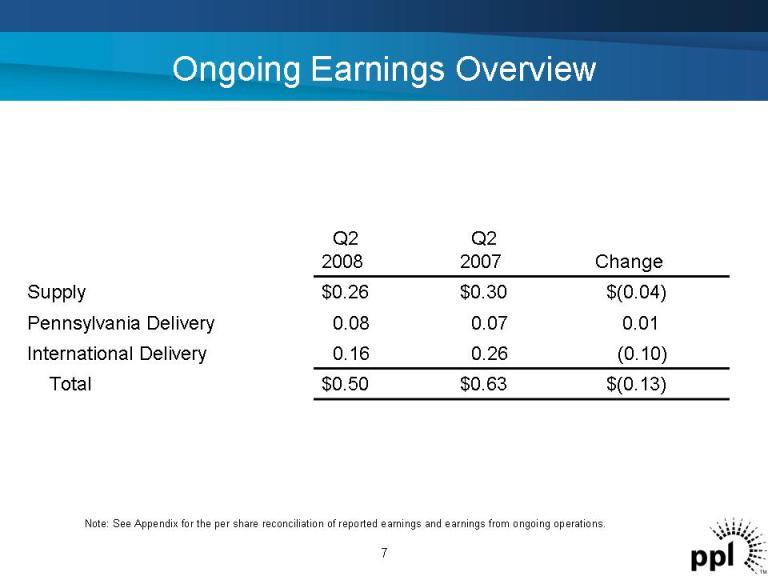
Ongoing Earnings Overview $(0.13)$0.63$0.50Total (0.10)0.260.16International Delivery 0.010.070.08Pennsylvania Delivery $(0.04)$0.30$0.26Supply Change Q2 2007 Q2 2008 7 Note: See Appendix for the per share reconciliation of reported earnings and earnings from ongoing operations.
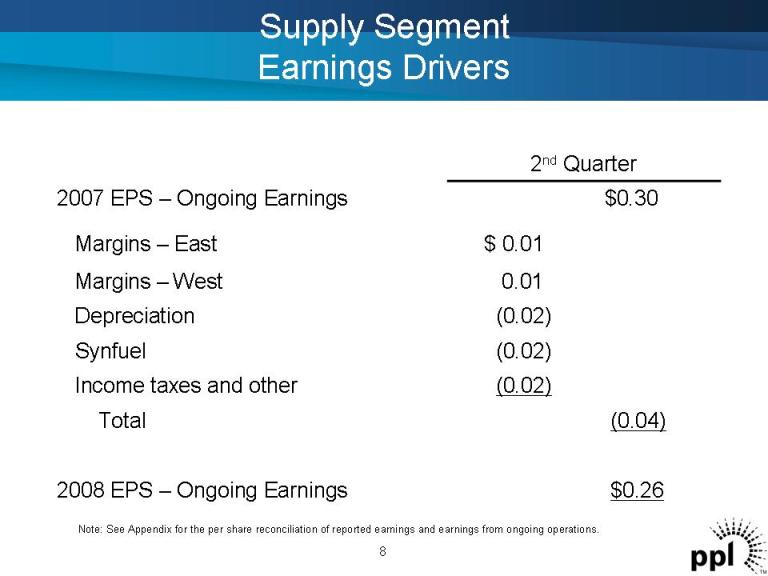
Supply Segment Earnings Drivers (0.02)Depreciation (0.02)Synfuel (0.02)Income taxes and other $0.262008 EPS – Ongoing Earnings (0.04)Total 0.01Margins – West $ 0.01Margins – East $0.302007 EPS – Ongoing Earnings 2nd Quarter Note: See Appendix for the per share reconciliation of reported earnings and earnings from ongoing operations. 8
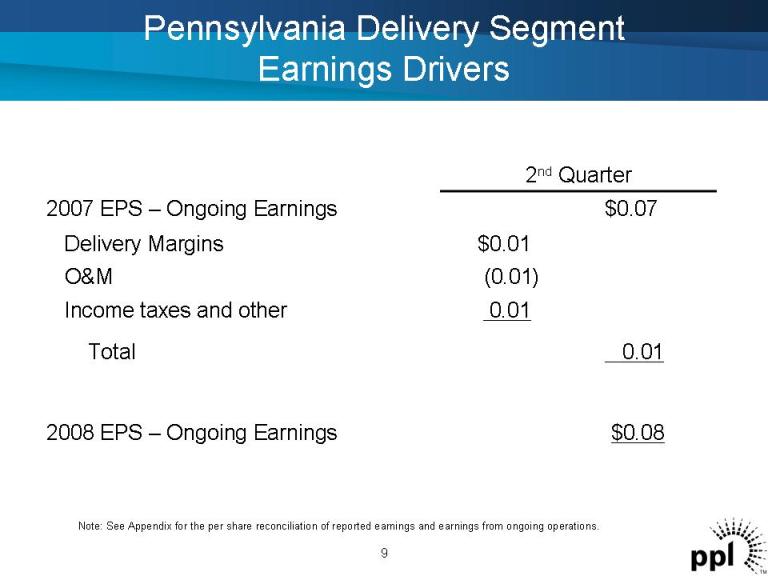
Pennsylvania Delivery Segment Earnings Drivers 0.01Income taxes and other $0.082008 EPS – Ongoing Earnings 0.01Total (0.01)O&M $0.01Delivery Margins $0.072007 EPS – Ongoing Earnings 2nd Quarter 9 Note: See Appendix for the per share reconciliation of reported earnings and earnings from ongoing operations.
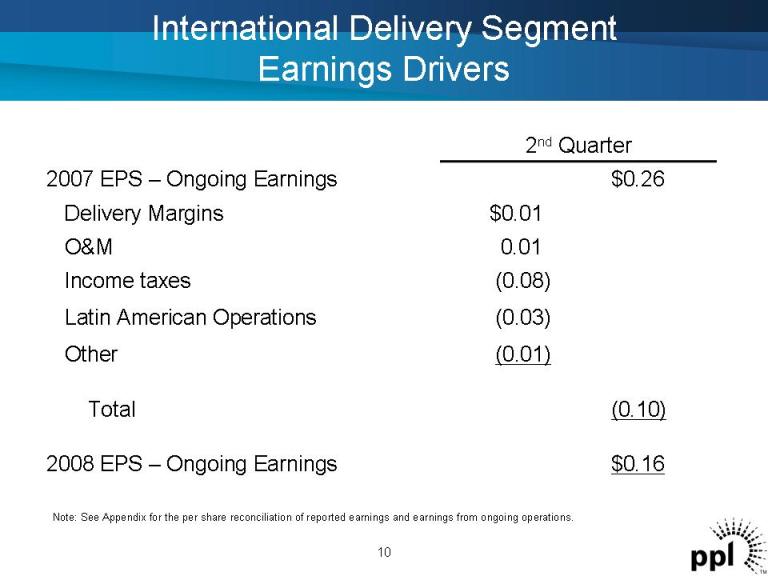
International Delivery Segment Earnings Drivers (0.01)Other (0.03)Latin American Operations $0.162008 EPS – Ongoing Earnings (0.10)Total (0.08)Income taxes 0.01O&M $0.01Delivery Margins $0.262007 EPS – Ongoing Earnings 2nd Quarter 10 Note: See Appendix for the per share reconciliation of reported earnings and earnings from ongoing operations.
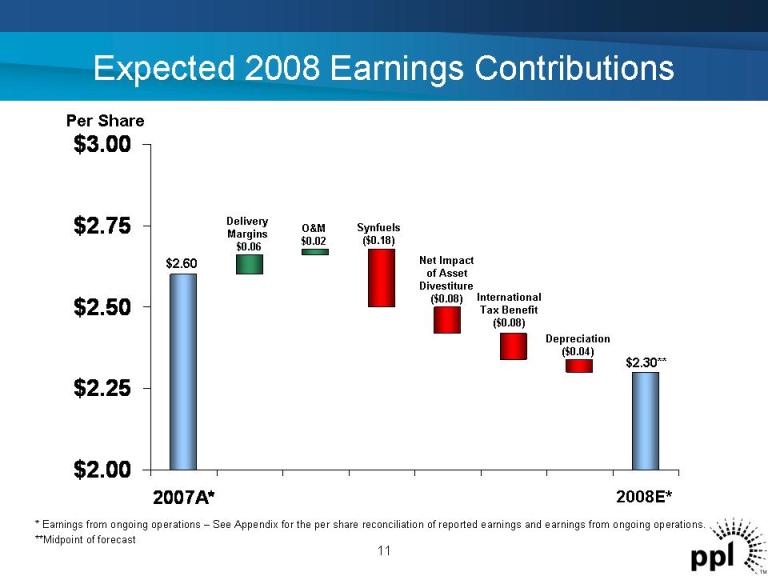
Expected 2008 Earnings Contributions 11 * Earnings from ongoing operations – See Appendix for the per share reconciliation of reported earnings and earnings from ongoing operations. **Midpoint of forecast $2.00 $2.25 $2.50 $2.75 $3.00 2007A* Per Share $2.60 Net Impact of Asset Divestiture ($0.08) O&M $0.02 International Tax Benefit ($0.08) $2.30** Depreciation ($0.04) Delivery Margins $0.06 Synfuels ($0.18) 2008E*
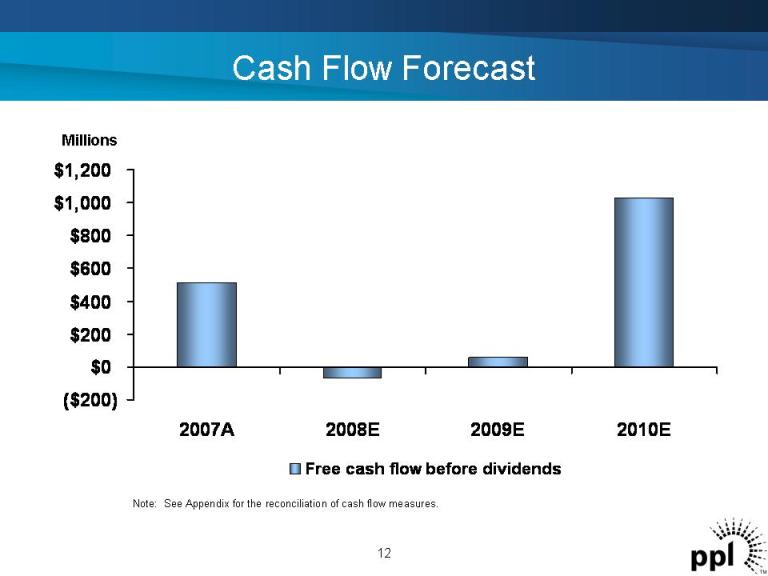
Cash Flow Forecast Millions ($200) $0 $200 $400 $600 $800 $1,000 $1,200 2007A 2008E 2009E 2010E Free cash flow before dividends 12 Note: See Appendix for the reconciliation of cash flow measures.
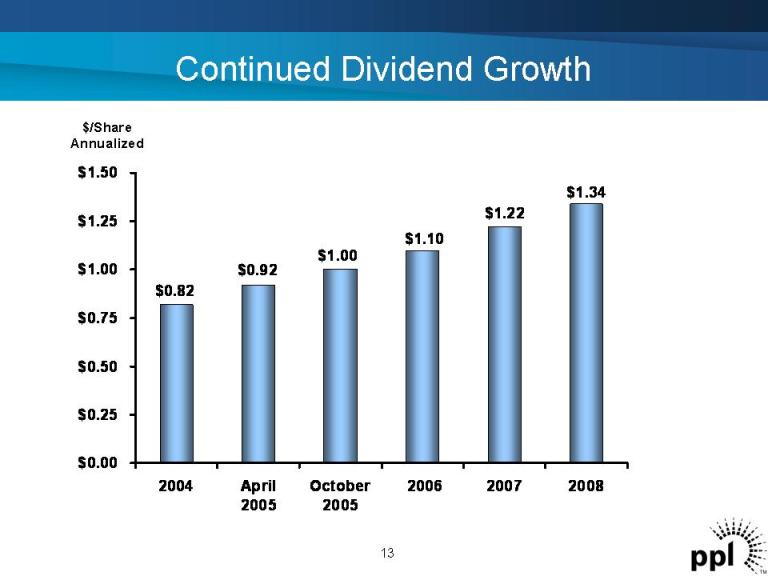
$0.82 $0.92 $1.00 $1.10 $1.22 $1.34 $0.00 $0.25 $0.50 $0.75 $1.00 $1.25 $1.50 2004 April 2005 October 2005 2006 2007 2008 $/Share Annualized Continued Dividend Growth 13
Implications of CAIR Ruling • DC Circuit Court decision invalidated U.S. EPA Eastern U.S. NOx/SO2 Reduction Program – Eliminates required additional reductions in sulfur dioxide in 2010 and 2015 – Annual NOx program vacated • Companies re-evaluating financial and operational implications – Scrubber and SCR investment decisions – Variable cost of operating scrubbers vs. market price 14
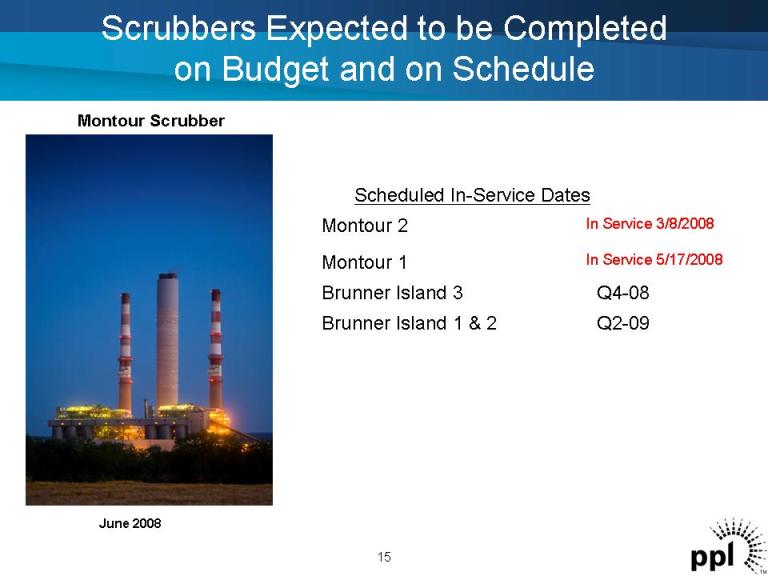
Scrubbers Expected to be Completed on Budget and on Schedule Q2-09Brunner Island 1 & 2 Q4-08Brunner Island 3 In Service 5/17/2008Montour 1 In Service 3/8/2008 Montour 2 Scheduled In-Service Dates Montour Scrubber 15 June 2008
Power Market Update • Natural gas and power prices have declined • Global demand for coal keeps upward pressure on U.S. coal prices • Emission allowance markets are still absorbing the negative implications of the DC Court ruling • Long-term fundamental market drivers support increasing value for generation 16
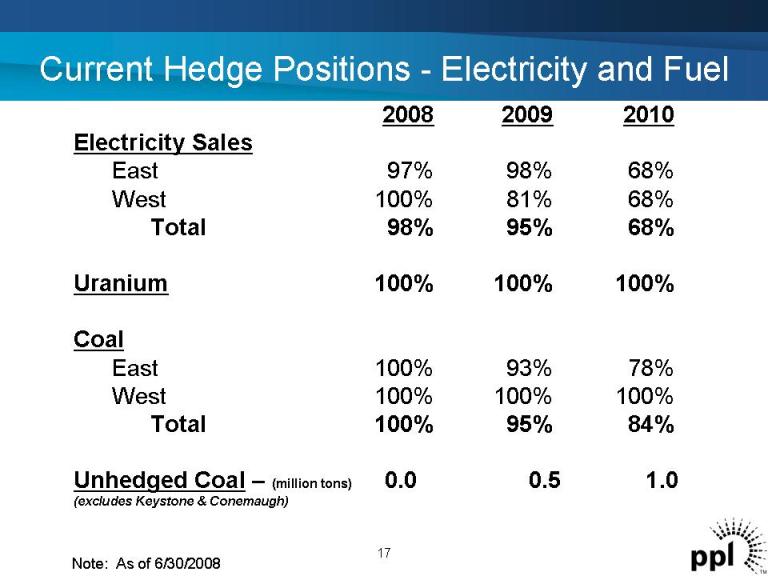
Current Hedge Positions -Electricity and Fuel 17 2008 2009 2010 Electricity Sales East 97% 98% 68% West 100% 81% 68% Total 98% 95% 68% Uranium 100% 100% 100% Coal East 100% 93% 78% West 100% 100% 100% Total 100% 95% 84% Unhedged Coal – (million tons) 0 0.5 1.0 (excludes Keystone & Conemaugh) Note: As of 6/30/2008
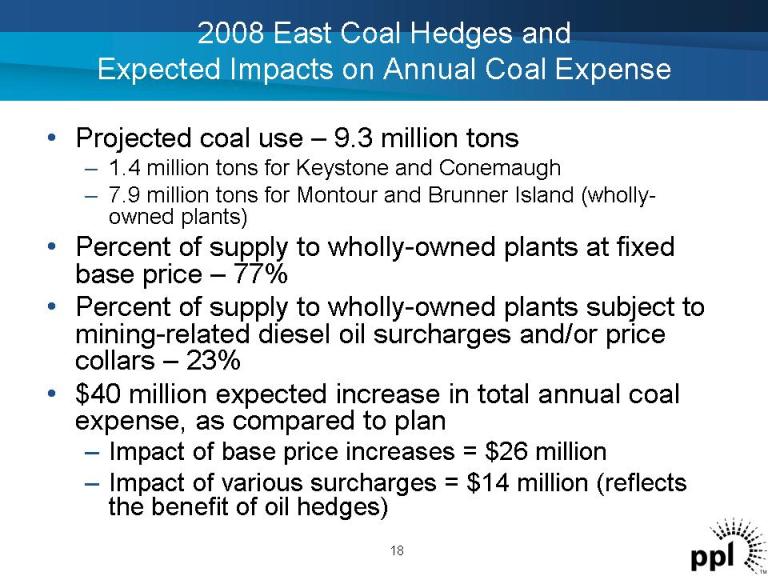
2008 East Coal Hedges and Expected Impacts on Annual Coal Expense • Projected coal use – 9.3 million tons – 1.4 million tons for Keystone and Conemaugh – 7.9 million tons for Montour and Brunner Island (wholly- owned plants) • Percent of supply to wholly-owned plants at fixed base price – 77% • Percent of supply to wholly-owned plants subject to mining-related diesel oil surcharges and/or price collars – 23% • $40 million expected increase in total annual coal expense, as compared to plan – Impact of base price increases = $26 million – Impact of various surcharges = $14 million (reflects the benefit of oil hedges) 18
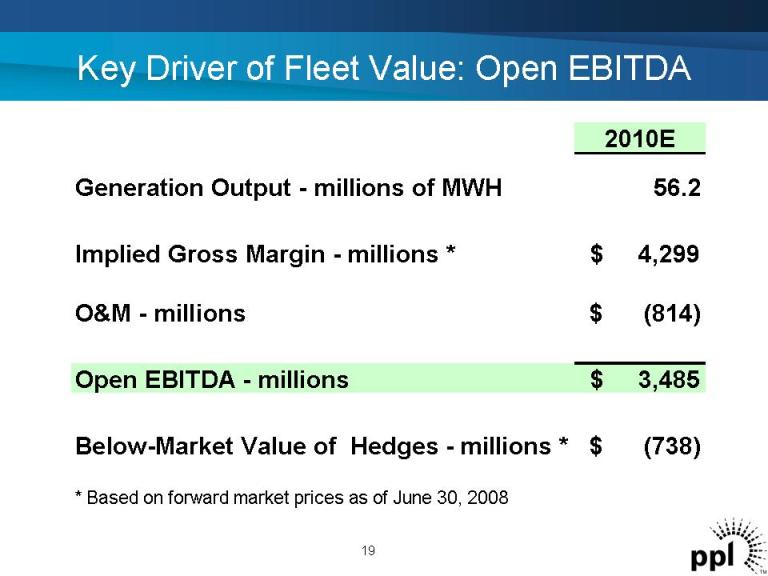
Key Driver of Fleet Value: Open EBITDA 19 2010E Generation Output -millions of MWH 56.2 Implied Gross Margin -millions * 4,299 $ O&M - -millions (814) $ Open EBITDA -millions $ 3,485 Below-Market Value of Hedges -millions * (738) $ * Based on forward market prices as of June 30, 2008
PPL
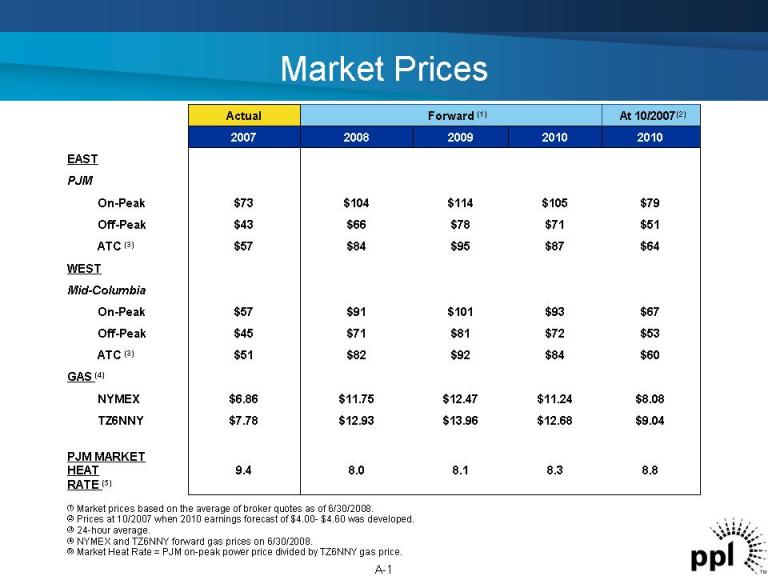
Market Prices EAST PJM On-Peak Off-Peak ATC (3) WEST Mid-Columbia On-Peak Off-Peak ATC (3) GAS (4) NYMEX TZ6NNY PJM MARKET HEAT RATE (5) Actual Forward (1) At 10/2007(2) 2007 2008 2009 2010 2010 9.4 $7.78 $6.86 $51 $45 $57 $57 $43 $73 8.8 $9.04 $8.08 $60 $53 $67 $64 $51 $79 8.38.18.0 $12.68$13.96$12.93 $11.24$12.47$11.75 $84$92$82 $72$81$71 $93$101$91 $87$95$84 $71$78$66 $105$114$104 (1) Market prices based on the average of broker quotes as of 6/30/2008. (2) Prices at 10/2007 when 2010 earnings forecast of $4.00-$4.60 was developed. (3) 24-hour average. (4) NYMEX and TZ6NNY forward gas prices on 6/30/2008. (5) Market Heat Rate = PJM on-peak power price divided by TZ6NNY gas price. A-1
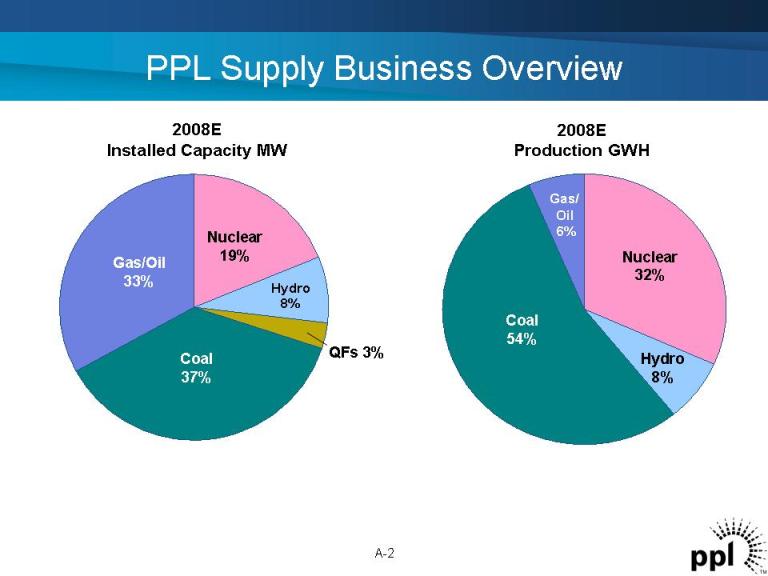
PPL Supply Business Overview 2008E Production GWH A-2 Gas/Oil 33% Coal 37% Nuclear 19% Hydro8% QFs 3% 2008E Installed Capacity MW Gas/ Oil 6% Coal 54% Nuclear 32% Hydro 8%
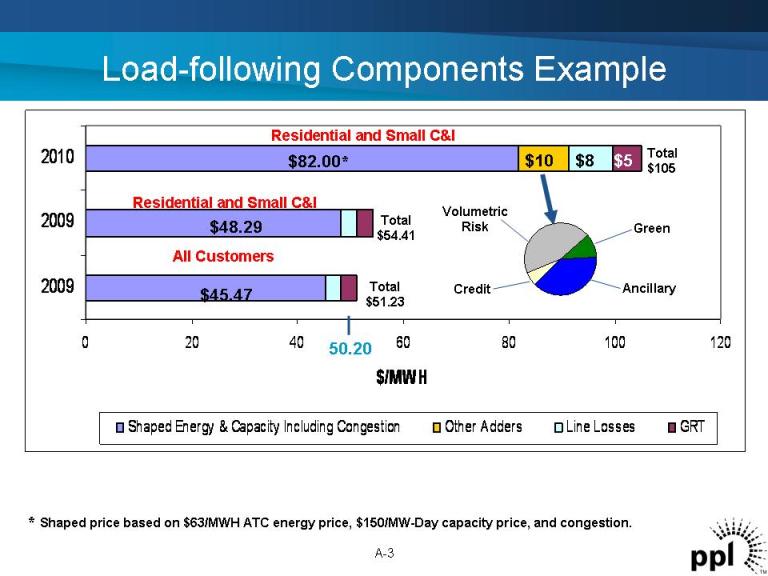
��0 20 40 60 80 100 120 2009 2009 2010 $/MWH Shaped Energy & Capacity Including Congestion Other Adders Line Losses GRT Load-following Components Example A-3 Total $105 $82.00* $45.47 Total $51.23 * Shaped price based on $63/MWH ATC energy price, $150/MW-Day capacity price, and congestion. $48.29 Total $54.41 Residential and Small C&I Residential and Small C&I All Customers 50.20 $10 Volumetric Risk Credit Ancillary Green $8 $5

PPL’s Generation Portfolio Total Domestic Generation: 11,358 MW Planned Uprate Projects: 331 MW * Reflects reduction of 60 MW expected loss due to increased plant usage during scrubber operation. Coal 3,483* Nuclear 2,117 Oil 1,795 Gas 1,503 Hydro 343 CTs 474 QFs 356 East 10,071 MW* Coal 683 Hydro 604 West 1,287 MW Coal Uprate (2008) 6 Hydro Uprate (2011) 28 Nuclear Uprate (2008-2010) 143 Hydro Uprate (2009, 2011) 128 Coal Uprate (2008-2009) 26 * A-4
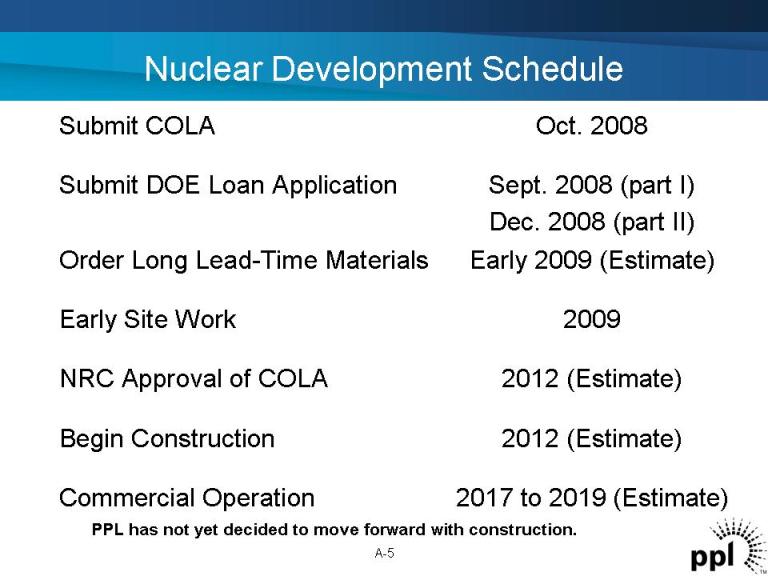
Nuclear Development Schedule Early 2009 (Estimate)Order Long Lead-Time Materials 2017 to 2019 (Estimate)Commercial Operation 2012 (Estimate)Begin Construction 2012 (Estimate)NRC Approval of COLA 2009Early Site Work Sept. 2008 (part I) Dec. 2008 (part II) Submit DOE Loan Application Oct. 2008Submit COLA PPL has not yet decided to move forward with construction. A-5
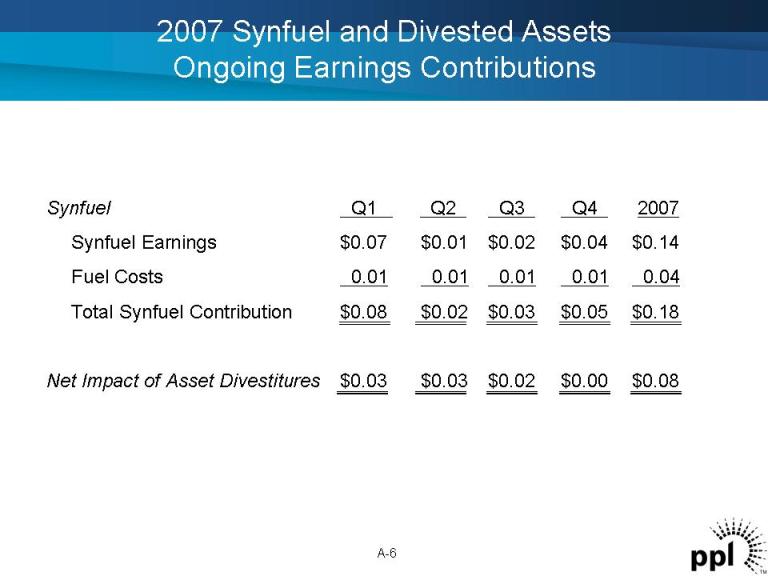
2007 Synfuel and Divested Assets Ongoing Earnings Contributions A-6 Synfuel Q1 Q2 Q3 Q4 2007 Synfuel Earnings $0.07 $0.01 $0.02 $0.04 $0.14 Fuel Costs 0.01 0.01 0.01 0.01 0.04 Total Synfuel Contribution $0.08 $0.02 $0.03 $0.05 $0.18 Net Impact of Asset Divestitures $0.03 $0.03 $0.02 $0.00 $0.08
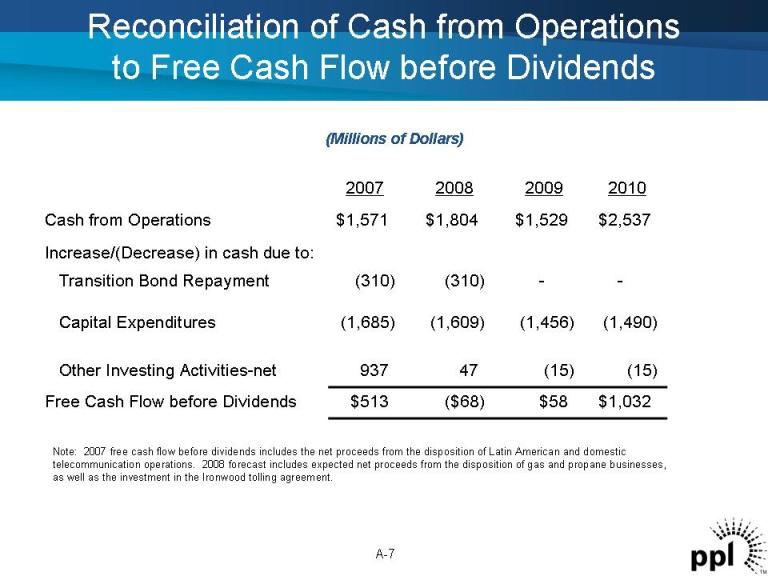
Reconciliation of Cash from Operations to Free Cash Flow before Dividends (Millions of Dollars) A-7 $1,032$58($68)$513Free Cash Flow before Dividends (15)(15)47937Other Investing Activities-net (1,490)(1,456)(1,609)(1,685)Capital Expenditures --(310)(310)Transition Bond Repayment Increase/(Decrease) in cash due to: $2,537$1,529$1,804$1,571Cash from Operations 2010200920082007 Note: 2007 free cash flow before dividends includes the net proceeds from the disposition of Latin American and domestic telecommunication operations. 2008 forecast includes expected net proceeds from the disposition of gas and propane businesses, as well as the investment in the Ironwood tolling agreement.
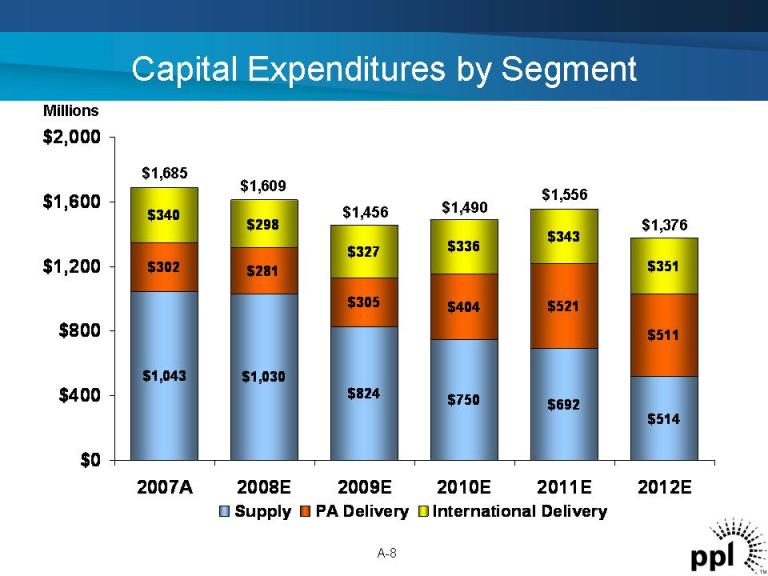
Millions $1,043 $1,030 $824 $750 $692 $514 $302 $281 $305 $404 $521 $511 $340 $298 $327 $336 $343 $351 $0 $400 $800 $1,200 $1,600 $2,000 2007A 2008E 2009E 2010E 2011E 2012E Supply PA Delivery International Delivery $1,685 $1,556 $1,376 $1,490$1,456 $1,609 Capital Expenditures by Segment A-8
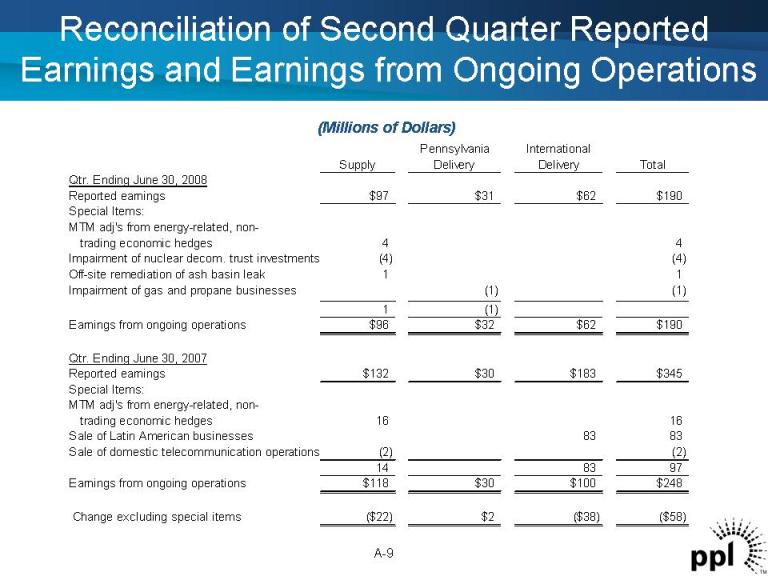
Reconciliation of Second Quarter Reported Earnings and Earnings from Ongoing Operations A-9 (Millions of Dollars) Pennsylvania International Supply Delivery Delivery Total Qtr. Ending June 30, 2008 Reported earnings $97 $31 $62 $190 Special Items: MTM adj's from energy-related, non- trading economic hedges 4 4 Impairment of nuclear decom. trust investments (4) (4) Off-site remediation of ash basin leak 1 1 Impairment of gas and propane businesses (1) (1) 1 (1) Earnings from ongoing operations $96 $32 $62 $190 Qtr. Ending June 30, 2007 Reported earnings $132 $30 $183 $345 Special Items: MTM adj's from energy-related, non- trading economic hedges 16 16 Sale of Latin American businesses 83 83 Sale of domestic telecommunication operations (2) (2) 14 83 97 Earnings from ongoing operations $118 $30 $100 $248 Change excluding special items ($22) $2 ($38) ($58)
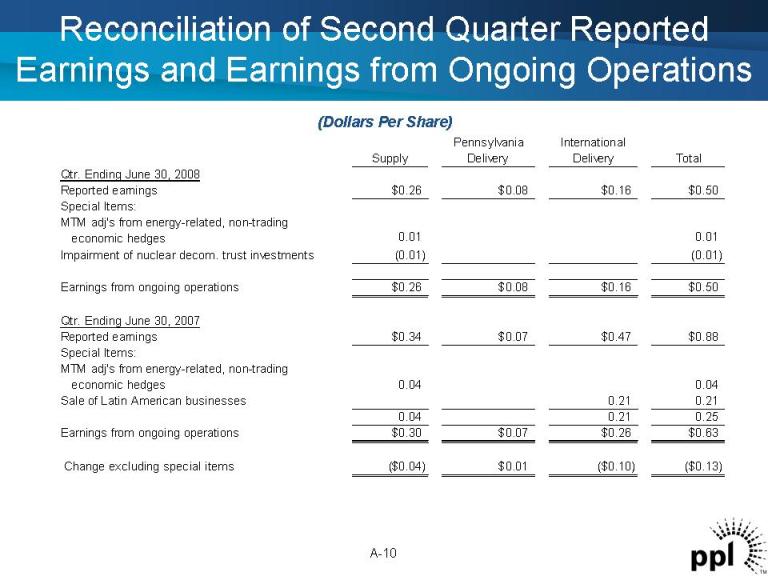
Pennsylvania International Supply Delivery Delivery Total Qtr. Ending June 30, 2008 Reported earnings $0.26 $0.08 $0.16 $0.50 Special Items: MTM adj's from energy-related, non-trading economic hedges 0.01 0.01 Impairment of nuclear decom. trust investments (0.01) (0.01) Earnings from ongoing operations $0.26 $0.08 $0.16 $0.50 Qtr. Ending June 30, 2007 Reported earnings $0.34 $0.07 $0.47 $0.88 Special Items: MTM adj's from energy-related, non-trading economic hedges 0.04 0.04 Sale of Latin American businesses 0.21 0.21 0.04 0.21 0.25 Earnings from ongoing operations $0.30 $0.07 $0.26 $0.63 Change excluding special items ($0.04) $0.01 ($0.10) ($0.13) Reconciliation of Second Quarter Reported Earnings and Earnings from Ongoing Operations A-10 (Dollars Per Share)
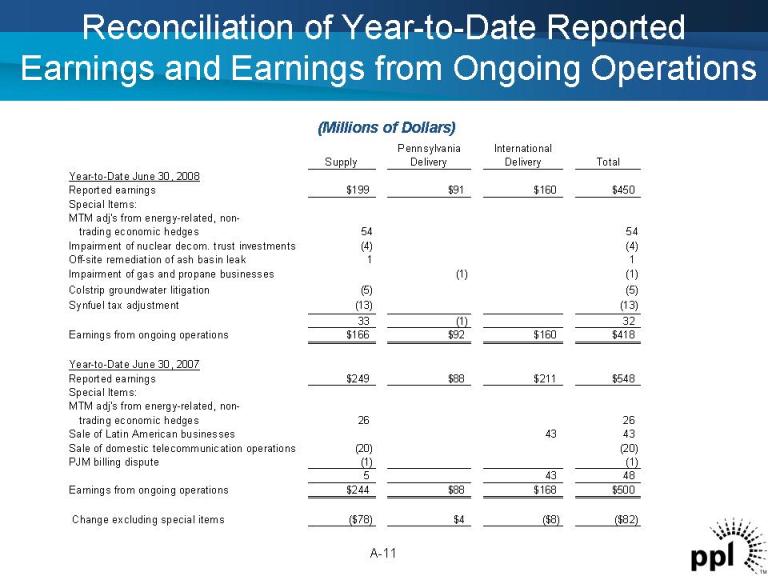
Reconciliation of Year-to-Date Reported Earnings and Earnings from Ongoing Operations A-11 (Millions of Dollars) Pennsylvania International Supply Delivery Delivery Total Year-to-Date June 30, 2008 Reported earnings $199 $91 $160 $450 Special Items: MTM adj's from energy-related, non- trading economic hedges 54 54 Impairment of nuclear decom. trust investments (4) (4) Off-site remediation of ash basin leak 1 1 Impairment of gas and propane businesses (1) (1) Colstrip groundwater litigation (5) (5) Synfuel tax adjustment (13) (13) 33 (1) 32 Earnings from ongoing operations $166 $92 $160 $418 Year-to-Date June 30, 2007 Reported earnings $249 $88 $211 $548 Special Items: MTM adj's from energy-related, non- trading economic hedges 26 26 Sale of Latin American businesses 43 43 Sale of domestic telecommunication operations (20) (20) PJM billing dispute (1) (1) 5 43 48 Earnings from ongoing operations $244 $88 $168 $500 Change excluding special items ($78) $4 ($8) ($82)
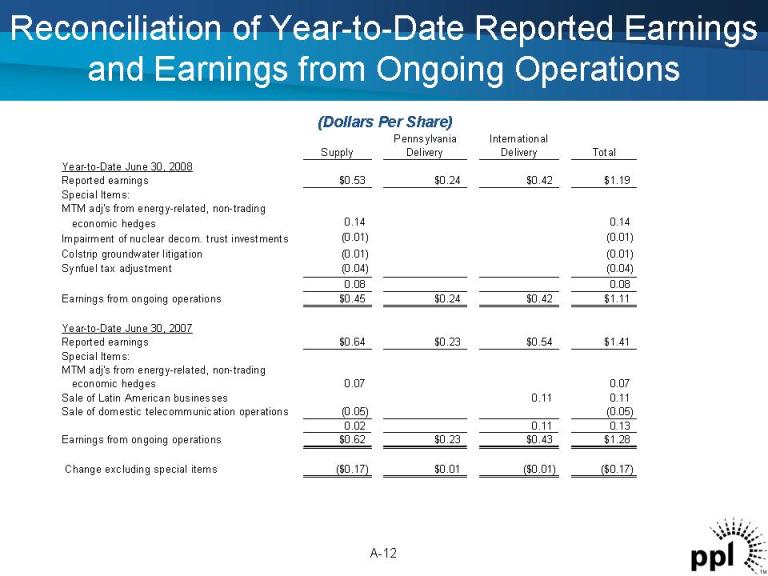
Pennsylvania International Supply Delivery Delivery Total Year-to-Date June 30, 2008 Reported earnings $0.53 $0.24 $0.42 $1.19 Special Items: MTM adj's from energy-related, non-trading economic hedges 0.14 0.14 Impairment of nuclear decom. trust investments (0.01) (0.01) Colstrip groundwater litigation (0.01) (0.01) Synfuel tax adjustment (0.04) (0.04) 0.08 0.08 Earnings from ongoing operations $0.45 $0.24 $0.42 $1.11 Year-to-Date June 30, 2007 Reported earnings $0.64 $0.23 $0.54 $1.41 Special Items: MTM adj's from energy-related, non-trading economic hedges 0.07 0.07 Sale of Latin American businesses 0.11 0.11 Sale of domestic telecommunication operations (0.05) (0.05) 0.02 0.11 0.13 Earnings from ongoing operations $0.62 $0.23 $0.43 $1.28 Change excluding special items ($0.17) $0.01 ($0.01) ($0.17) Reconciliation of Year-to-Date Reported Earnings and Earnings from Ongoing Operations A-12 (Dollars Per Share)
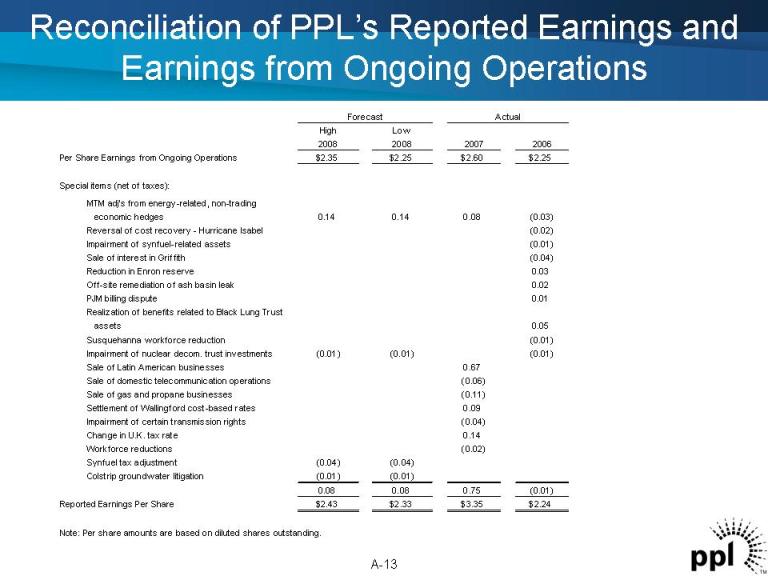
Reconciliation of PPL’s Reported Earnings and Earnings from Ongoing Operations High Low 2008 2008 2007 2006 Per Share Earnings from Ongoing Operations $2.35 $2.25 $2.60 $2.25 Special items (net of taxes): economic hedges 0.14 0.14 0.08 (0.03) Reversal of cost recovery - Hurricane Isabel (0.02) Impairment of synfuel-related assets (0.01) Sale of interest in Griffith (0.04) Reduction in Enron reserve 0.03 Off-site remediation of ash basin leak 0.02 PJM billing dispute 0.01 Realization of benefits related to Black Lung Trust assets 0.05 Susquehanna workforce reduction (0.01) Impairment of nuclear decom. trust investments (0.01) (0.01) (0.01) Sale of Latin American businesses 0.67 Sale of domestic telecommunication operations (0.06) Sale of gas and propane businesses (0.11) Settlement of Wallingford cost-based rates 0.09 Impairment of certain transmission rights (0.04) Change in U.K. tax rate 0.14 Workforce reductions (0.02) Synfuel tax adjustment (0.04) (0.04) Colstrip ground water litigation (0.01) (0.01) 0.08 0.08 0.75 (0.01) Reported Earnings Per Share $2.43 $2.33 $3.35 $2.24 Note: Per share amounts are based on diluted shares outstanding. Forecast MTM adj's from energy-related, non-trading Actual A-13
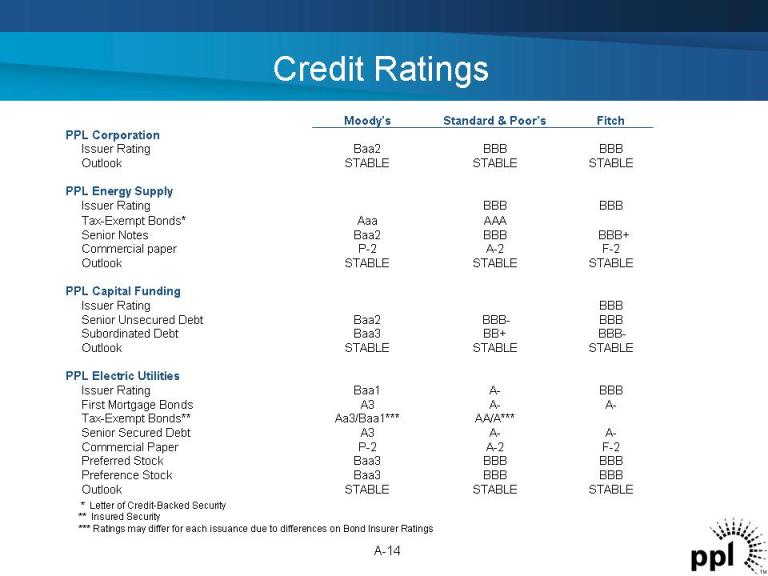
Credit Ratings A-14 BBB Issuer Rating AAA Aaa Tax-Exempt Bonds* STABLE STABLE STABLE Outlook A-A-A3Senior Secured Debt F-2A-2P-2Commercial Paper BBBBBBBaa3Preferred Stock BBBA-Baa1Issuer Rating A-A-A3First Mortgage Bonds AA/A*** Aa3/Baa1***Tax-Exempt Bonds** BBBBBBBaa3Preference Stock PPL Electric Utilities BBBBBB-Baa2Senior Unsecured Debt BBB-BB+ Baa3Subordinated Debt STABLE STABLE STABLE Outlook PPL Capital Funding BBB BBB Issuer Rating BBB+ BBBBaa2Senior Notes F-2A-2P-2Commercial paper STABLE STABLE STABLE Outlook PPL Energy Supply STABLE STABLE STABLE Outlook BBBBBBBaa2Issuer Rating PPL Corporation Fitch Standard & Poor’s Moody’s * Letter of Credit-Backed Security ** Insured Security *** Ratings may differ for each issuance due to differences on Bond Insurer Ratings
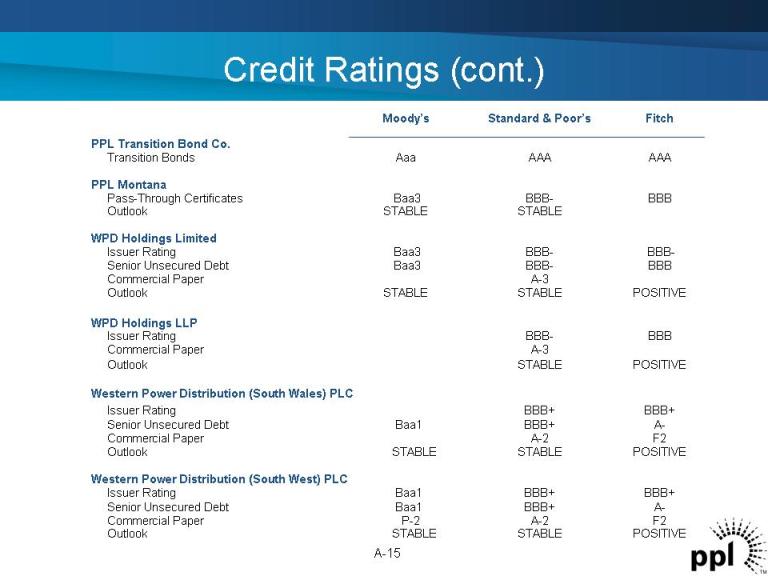
Credit Ratings (cont.) A-15 A-3Commercial Paper A-BBB+ Baa1Senior Unsecured Debt F2A-2P-2Commercial Paper POSITIVESTABLE STABLE Outlook BBB+ BBB+ Baa1Issuer Rating A-BBB+ Baa1Senior Unsecured Debt F2A-2Commercial Paper POSITIVESTABLE STABLE Outlook Western Power Distribution (South West) PLC BBB+ BBB+ Issuer Rating Western Power Distribution (South Wales) PLC POSITIVESTABLE STABLE Outlook POSITIVESTABLE Outlook BBBBBB-Issuer Rating WPD Holdings LLP BBB-BBB-Baa3Issuer Rating BBBBBB-Baa3Senior Unsecured Debt A-3Commercial Paper WPD Holdings Limited BBBBBB-Baa3Pass-Through Certificates STABLE STABLE Outlook PPL Montana AAA AAA Aaa Transition Bonds PPL Transition Bond Co. Fitch Standard & Poor’s Moody’s

Forward-Looking Information Statement A-16 Statements contained in this presentation, including statements with respect to future earnings, energy prices, margins, sales and supply, marketing performance, growth, revenues, expenses, rates, regulation, cash flows, credit profile, financing, dividends, business disposition, corporate strategy, capital additions and expenditures, and generating capacity and performance, are “forward-looking statements” within the meaning of the federal securities laws. Although PPL Corporation believes that the expectations and assumptions reflected in these forward-looking statements are reasonable, these statements involve a number of risks and uncertainties, and actual results may differ materially from the results discussed in the statements. The following are among the important factors that could cause actual results to differ materially from the forward-looking statements: market demand and prices for energy, capacity and fuel; weather conditions affecting customer energy usage and operating costs; competition in power markets; the effect of any business or industry restructuring; the profitability and liquidity of PPL Corporation and its subsidiaries; new accounting requirements or new interpretations or applications of existing requirements; operating performance of plants and other facilities; environmental conditions and requirements and the related costs of compliance, including environmental capital expenditures and emission allowance and other expenses; system conditions and operating costs; development of new projects, markets and technologies; performance of new ventures; asset acquisitions and dispositions; any impact of hurricanes or other severe weather on our business, including any impact on fuel prices; receipt of necessary government permits, approvals and rate relief; capital market conditions and decisions regarding capital structure; the impact of state, federal or foreign investigations applicable to PPL Corporation and its subsidiaries; the outcome of litigation against PPL Corporation and its subsidiaries; stock price performance; the market prices of equity securities and the impact on pension income and resultant cash funding requirements for defined benefit pension plans; the securities and credit ratings of PPL Corporation and its subsidiaries; political, regulatory or economic conditions in states, regions or countries where PPL Corporation or its subsidiaries conduct business, including any potential effects of threatened or actual terrorism or war or other hostilities; foreign exchange rates; new state, federal or foreign legislation, including new tax legislation; and the commitments and liabilities of PPL Corporation and its subsidiaries. Any such forward-looking statements should be considered in light of such important factors and in conjunction with PPL Corporation’s Form 10-K and other reports on file with the Securities and Exchange Commission.
Definitions of Financial Measures A-17 “Earnings from ongoing operations” excludes the impact of special items. Special items include charges, credits or gains that are unusual or nonrecurring. Special items also include the mark-to-market impact of energy-related, non-trading economic hedges and impairments of securities in PPL’s nuclear decommissioning trust funds. The mark-to-market impact of these hedges is economically neutral to the company because the mark-to-market gains or losses on the energy hedges will reverse as the hedging contracts settle in the future. Earnings from ongoing operations should not be considered as an alternative to reported earnings, or net income, which is an indicator of operating performance determined in accordance with generally accepted accounting principles (GAAP). PPL believes that earnings from ongoing operations, although a non-GAAP measure, is also useful and meaningful to investors because it provides them with PPL’s underlying earnings performance as another criterion in making their investment decisions. PPL’s management also uses earnings from ongoing operations in measuring certain corporate performance goals. Other companies may use different measures to present financial performance. “Free cash flow before dividends” is derived by deducting capital expenditures and other investing activities-net, as well as the repayment of transition bonds, from cash flow from operations. Free cash flow before dividends should not be considered as an alternative to cash flow from operations, which is determined in accordance with GAAP. PPL believes that free cash flow before dividends, although a non-GAAP measure, is an important measure to both management and investors since it is an indicator of the company’s ability to sustain operations and growth without additional outside financing beyond the requirement to fund maturing debt obligations. Other companies may calculate free cash flow before dividends in a different manner.