Lehman Brothers Power Conference September 3, 2008 Exhibit 99.2
Cautionary Statements And Factors That May Affect Future Results Any statements made in this presentation about future operating results or other future events are forward-looking statements under the Safe Harbor Provisions of the Private Securities Litigation Reform Act of 1995. Actual results may differ materially from such forward-looking statements. A discussion of factors that could cause actual results or events to vary is contained in the Appendix to this presentation and in the Company’s SEC filings. 1
Management Focus • Operational execution • Financial discipline • Strategic foresight • Delivering on promises • Growing shareowner value 2
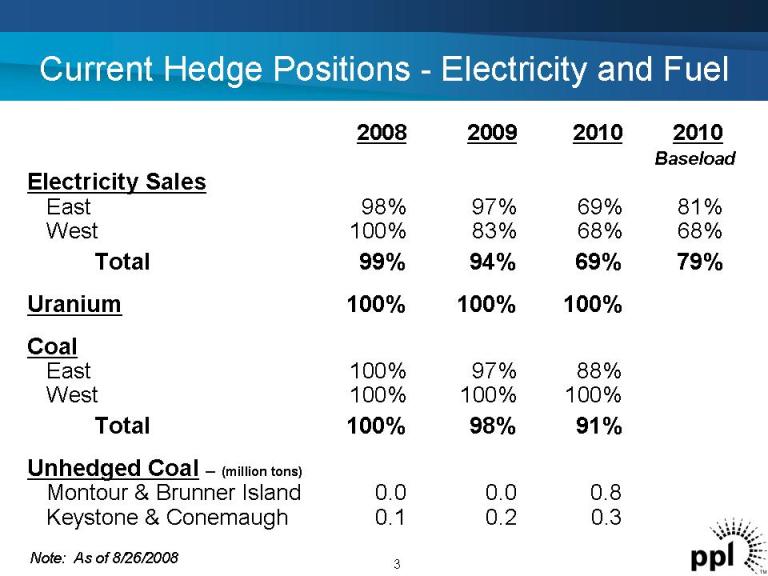
Current Hedge Positions -Electricity and Fuel 3 2008 2009 2010 2010 Baseload Electricity Sales East 98% 97% 69% 81% West 100% 83% 68% 68% Total 99% 94% 69% 79% Uranium 100% 100% 100% Coal East 100% 97% 88% West 100% 100% 100% Total 100% 98% 91% Unhedged Coal – (million tons) Montour & Brunner Island 0.0 0.0 0.8 Keystone & Conemaugh 0.1 0.2 0.3 Note: As of 8/26/2008
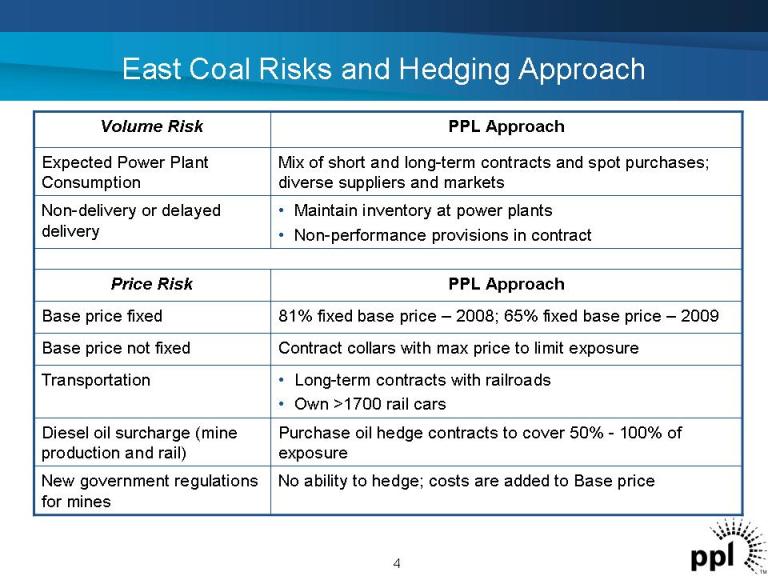
East Coal Risks and Hedging Approach Volume Risk PPL Approach Expected Power Plant Consumption Mix of short and long-term contracts and spot purchases; diverse suppliers and markets Non-delivery or delayed delivery • Maintain inventory at power plants • Non-performance provisions in contract Price Risk PPL Approach Base price fixed 81% fixed base price – 2008; 65% fixed base price – 2009 Base price not fixed Contract collars with max price to limit exposure Transportation • Long-term contracts with railroads • Own >1700 rail cars Diesel oil surcharge (mine production and rail) Purchase oil hedge contracts to cover 50% -100% of exposure New government regulations for mines No ability to hedge; costs are added to Base price 4
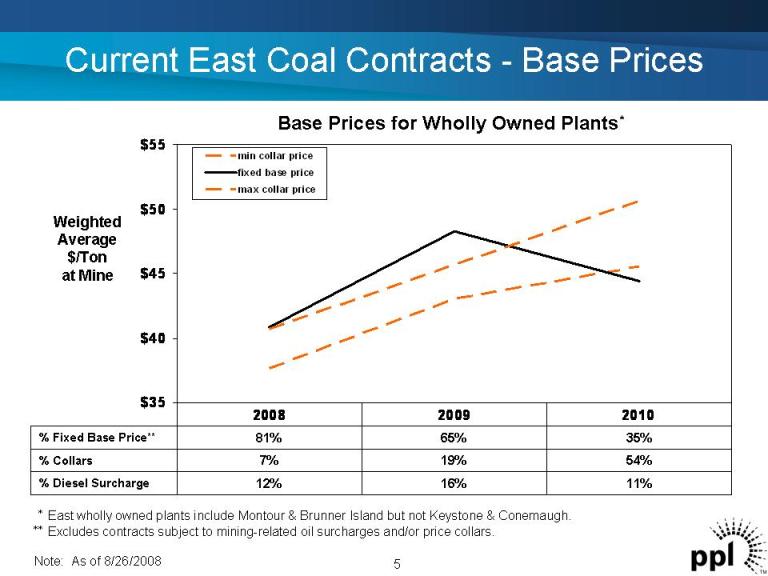
Current East Coal Contracts -Base Prices $35 $40 $45 $50 $55 min collar price fixed base price max collar price 2008 2009 2010 5 Weighted Average $/Ton at Mine Base Prices for Wholly Owned Plants* *East wholly owned plants include Montour & Brunner Island but not Keystone & Conemaugh. **Excludes contracts subject to mining-related oil surcharges and/or price collars. Note: As of 8/26/2008 11%16%12%% Diesel Surcharge 54%19%7%% Collars 35%65%81%% Fixed Base Price**
Expansion of Generation Portfolio • Acquired long-term tolling agreement of 664 MW natural-gas combined-cycle plant in PJM • Susquehanna Unit 1 uprate, phase 1, is now complete • Susquehanna Unit 2 uprate following Spring 2009 refueling outage • Progressing on other announced uprate and hydro expansion projects • Increased investment in renewable energy projects • Exploring the option of a new nuclear unit 6
Requirements for New Nuclear Development • Expansion of Federal loan guarantee program • Timely approval of reference COLA by NRC • Timely execution and cost performance from EdF on Flamanville Carbon legislation would enhance the potential economics 7
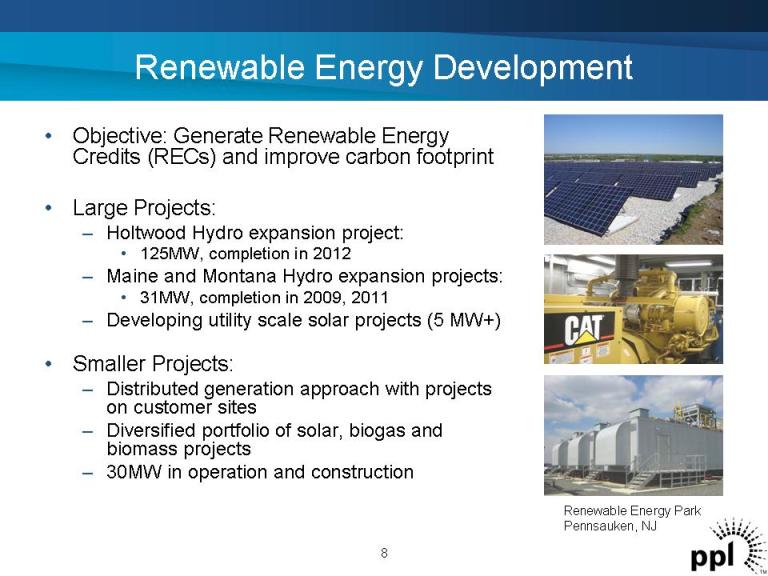
Renewable Energy Development • Objective: Generate Renewable Energy Credits (RECs) and improve carbon footprint • Large Projects: – Holtwood Hydro expansion project: • 125MW, completion in 2012 – Maine and Montana Hydro expansion projects: • 31MW, completion in 2009, 2011 – Developing utility scale solar projects (5 MW+) • Smaller Projects: – Distributed generation approach with projects on customer sites – Diversified portfolio of solar, biogas and biomass projects – 30MW in operation and construction Renewable Energy Park Pennsauken, NJ 8
Pennsylvania Update • PUC approved PPL Rate Stabilization Plan • House session scheduled September 15 – November 25 (16 working days) • Senate session scheduled September 16 – October 8 (9 working days) • Open energy issues that may be addressed – Conservation – Demand Side Management – Procurement – Mitigation • Next RFP bids for 2010 procurement due September 29 and PUC approval expected October 1 9
PPL Electric Utilities Procurement Plan for 2011 and Beyond • PPL filed procurement plan with PUC on August28; review expected to take seven months • Purchase electricity supply for 2011 to mid-2014four times a year, beginning 3Q 2009 • Solicit supply contracts for 12-and 24-month increments and spot purchases • For residential and small business customers – 90% of supply from fixed-price contracts, 10% from spot purchases • Large commercial and industrial customers supply purchased on hourly basis in open market 10

Transmission Expansion 11 Susquehanna-Roseland Line

$2.00 $2.50 $3.00 $3.50 $4.00 $4.50 $5.00 2007A* 2008* 2010 Long-Term Fundamentals Remain Intact Forecast 12 *Earnings from ongoing operations – See Appendix for the per share reconciliation of reported earnings and earnings from ongoing operations. $2.60 $2.17 $2.27 $4.00 $4.60 Per Share
PPL
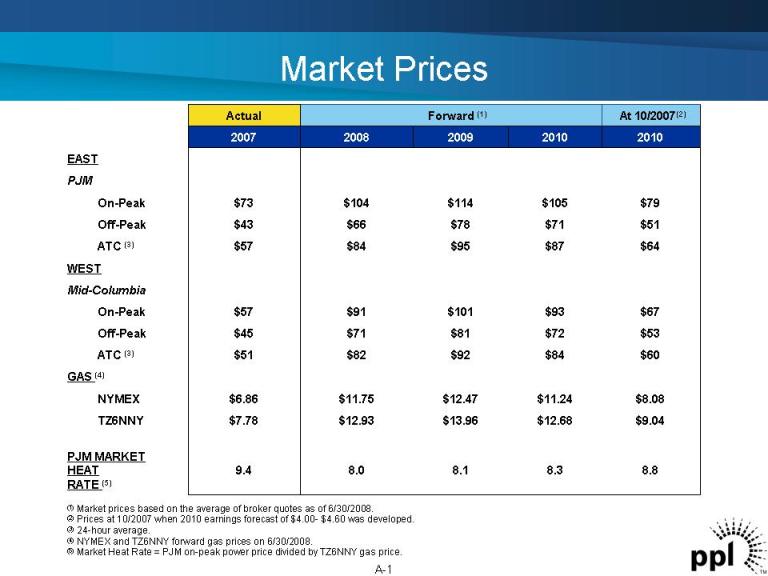
Market Prices EAST PJM On-Peak Off-Peak ATC (3) WEST Mid-Columbia On-Peak Off-Peak ATC (3) GAS (4) NYMEX TZ6NNY PJM MARKET HEAT RATE (5) Actual Forward (1) At 10/2007(2) 2007 2008 2009 2010 2010 9.4 $7.78 $6.86 $51 $45 $57 $57 $43 $73 8.8 $9.04 $8.08 $60 $53 $67 $64 $51 $79 8.38.18.0 $12.68$13.96$12.93 $11.24$12.47$11.75 $84$92$82 $72$81$71 $93$101$91 $87$95$84 $71$78$66 $105$114$104 (1) Market prices based on the average of broker quotes as of 6/30/2008. (2) Prices at 10/2007 when 2010 earnings forecast of $4.00-$4.60 was developed. (3) 24-hour average. (4) NYMEX and TZ6NNY forward gas prices on 6/30/2008. (5) Market Heat Rate = PJM on-peak power price divided by TZ6NNY gas price. A-1
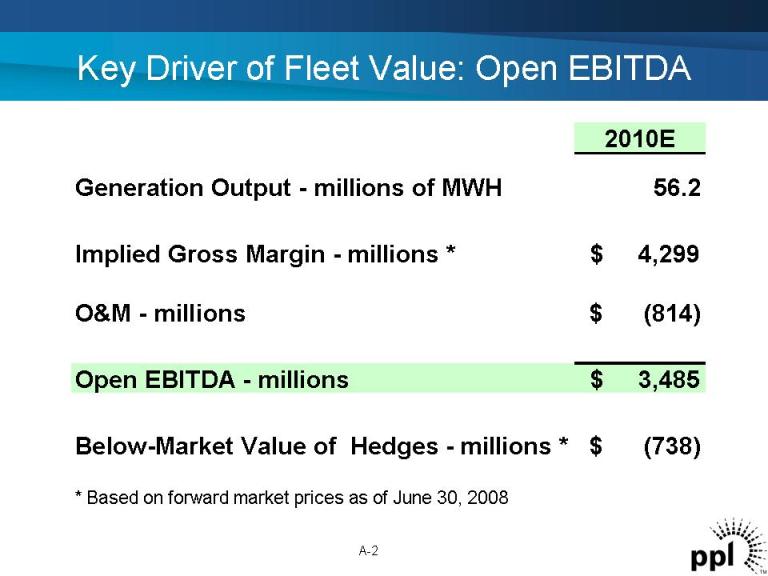
Key Driver of Fleet Value: Open EBITDA A-2 2010E Generation Output -millions of MWH 56.2 Implied Gross Margin -millions * 4,299 $ O&M - -millions (814) $ Open EBITDA -millions $ 3,485 Below-Market Value of Hedges -millions * (738) $ * Based on forward market prices as of June 30, 2008
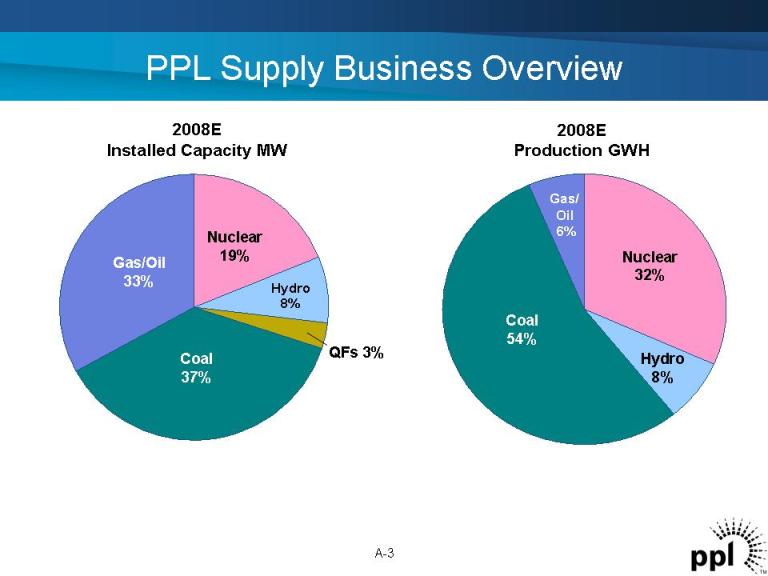 PPL Supply Business Overview 2008E Production GWH A-3 Gas/Oil 33% Coal 37% Nuclear 19% Hydro8% QFs 3% 2008E Installed Capacity MW Gas/ Oil 6% Coal 54% Nuclear 32% Hydro 8%
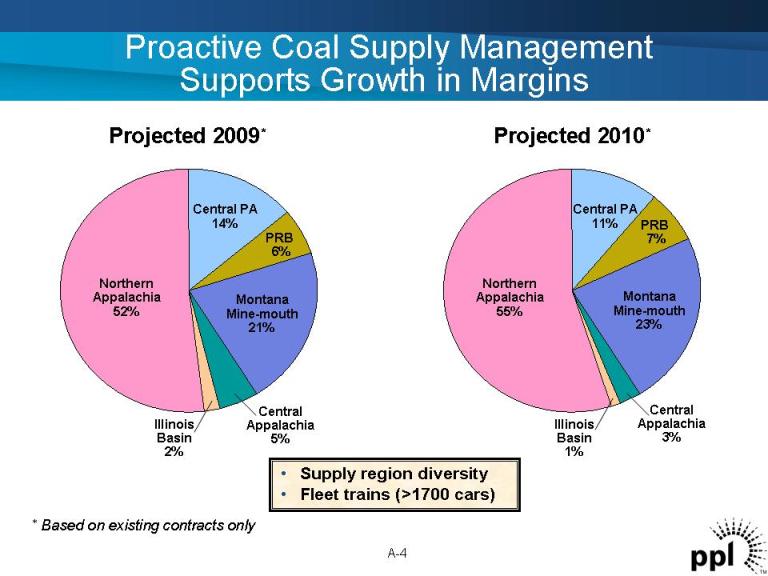
Proactive Coal Supply Management Supports Growth in Margins Projected 2009* Central PA 14% PRB 6% Montana Mine-mouth 21% Central Appalachia 5% Northern Appalachia52% Illinois Basin 2% A-4 • Supply region diversity • Fleet trains (>1700 cars) Central PA 11% PRB 7% Montana Mine-mouth 23% Central Appalachia 3% Northern Appalachia55% Illinois Basin 1% Projected 2010* *Based on existing contracts only
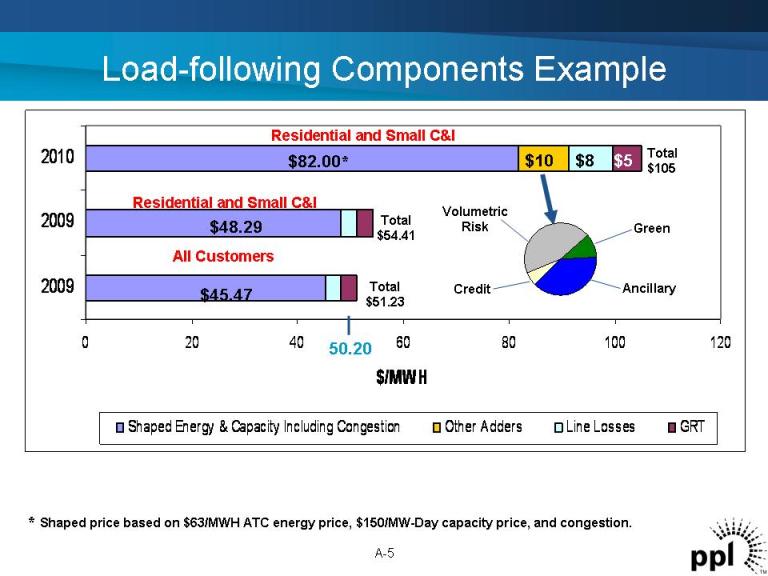
0 20 40 60 80 100 120 2009 2009 2010 $/MWH Shaped Energy & Capacity Including Congestion Other Adders Line Losses GRT Load-following Components Example A-5 Total $105 $82.00* $45.47 Total $51.23 * Shaped price based on $63/MWH ATC energy price, $150/MW-Day capacity price, and congestion. $48.29 Total $54.41 Residential and Small C&I Residential and Small C&I All Customers 50.20 $10 Volumetric Risk Credit Ancillary Green $8 $5
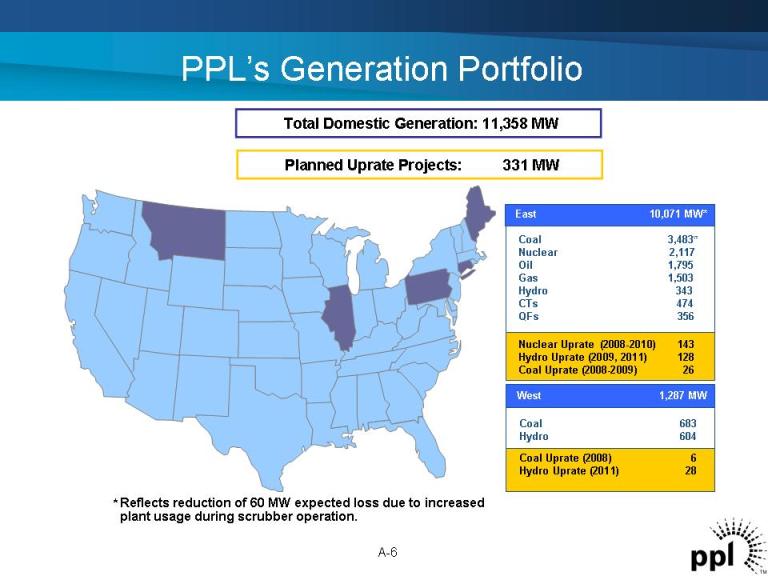
PPL’s Generation Portfolio Total Domestic Generation: 11,358 MW Planned Uprate Projects: 331 MW * Reflects reduction of 60 MW expected loss due to increased plant usage during scrubber operation. Coal 3,483* Nuclear 2,117 Oil 1,795 Gas 1,503 Hydro 343 CTs 474 QFs 356 East 10,071 MW* Coal 683 Hydro 604 West 1,287 MW Coal Uprate (2008) 6 Hydro Uprate (2011) 28 Nuclear Uprate (2008-2010) 143 Hydro Uprate (2009, 2011) 128 Coal Uprate (2008-2009) 26 * A-6
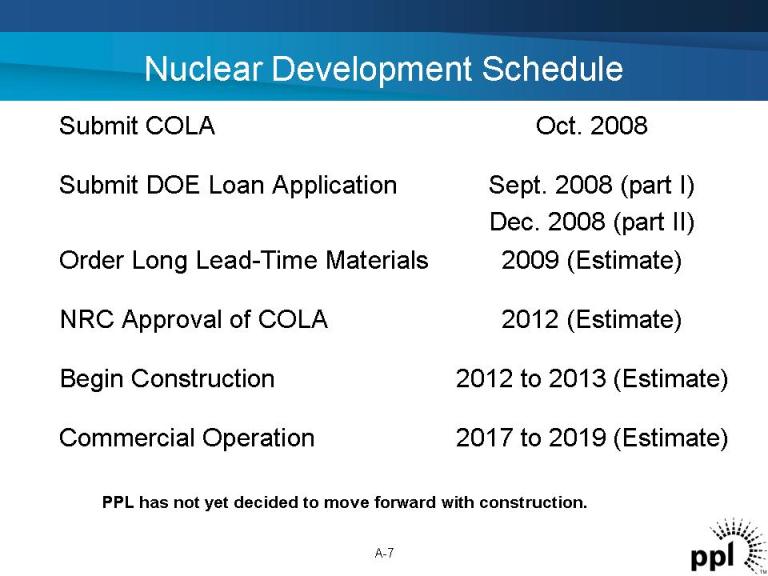
Nuclear Development Schedule 2009 (Estimate) Order Long Lead-Time Materials 2017 to 2019 (Estimate) Commercial Operation 2012 to 2013 (Estimate) Begin Construction 2012 (Estimate) NRC Approval of COLA Sept. 2008 (part I) Dec. 2008 (part II) Submit DOE Loan Application Oct. 2008Submit COLA PPL has not yet decided to move forward with construction. A-7
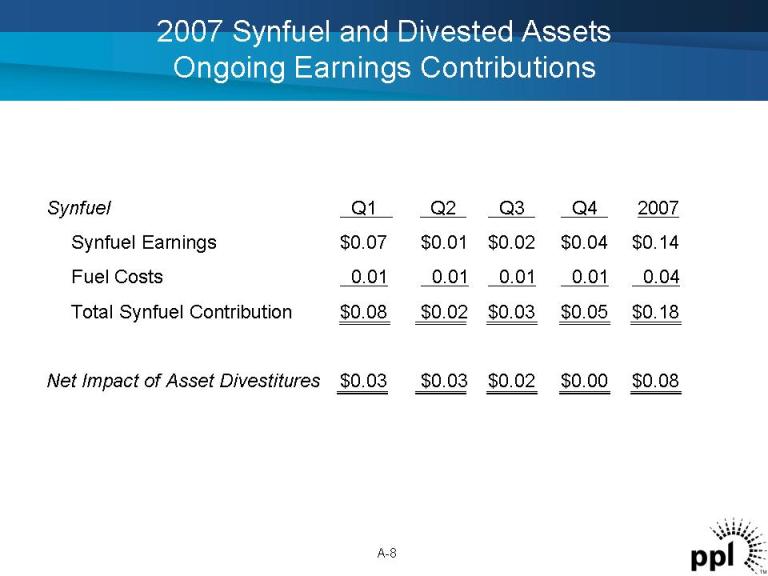
2007 Synfuel and Divested Assets Ongoing Earnings Contributions A-8 Synfuel Q1 Q2 Q3 Q4 2007 Synfuel Earnings $0.07 $0.01 $0.02 $0.04 $0.14 Fuel Costs 0.01 0.01 0.01 0.01 0.04 Total Synfuel Contribution $0.08 $0.02 $0.03 $0.05 $0.18 Net Impact of Asset Divestitures $0.03 $0.03 $0.02 $0.00 $0.08
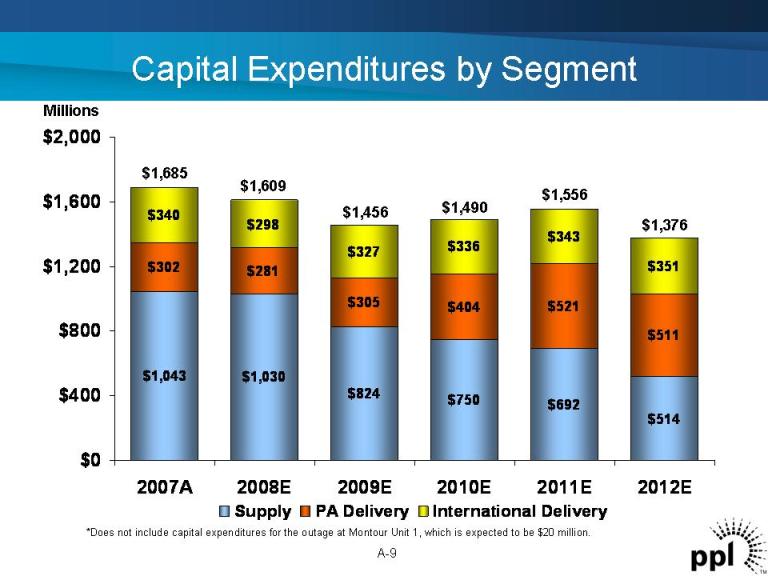
Millions $1,043 $1,030 $824 $750 $692 $514 $302 $281 $305 $404 $521 $511 $340 $298 $327 $336 $343 $351 $0 $400 $800 $1,200 $1,600 $2,000 2007A 2008E 2009E 2010E 2011E 2012E Supply PA Delivery International Delivery $1,685 $1,556 $1,376 $1,490$1,456 $1,609 Capital Expenditures by Segment A-9 *Does not include capital expenditures for the outage at Montour Unit 1, which is expected to be $20 million.
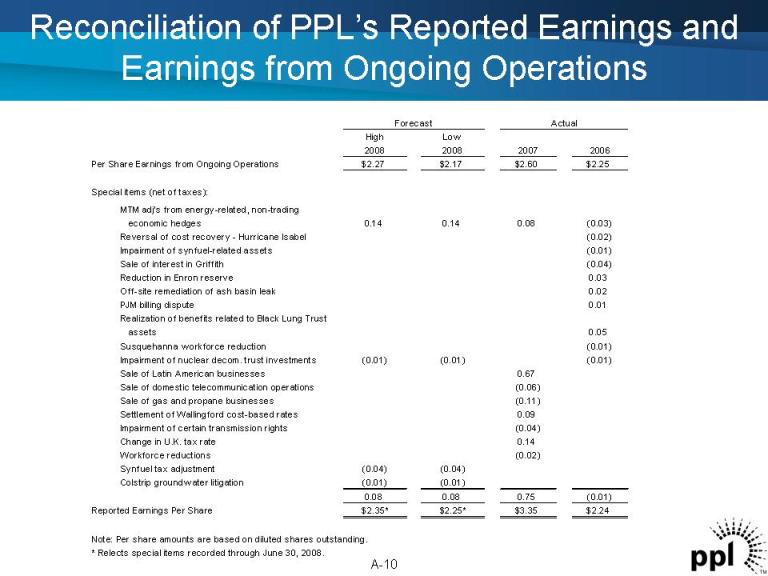
Reconciliation of PPL’s Reported Earnings and Earnings from Ongoing Operations A-10 High Low 2008 2008 2007 2006 Per Share Earnings from Ongoing Operations $2.27 $2.17 $2.60 $2.25 Special items (net of taxes): economic hedges 0.14 0.14 0.08 (0.03) Reversal of cost recovery - Hurricane Isabel (0.02) Impairment of synfuel-related assets (0.01) Sale of interest in Griffith (0.04) Reduction in Enron reserve 0.03 Off-site remediation of ash basin leak 0.02 PJM billing dispute 0.01 Realization of benefits related to Black Lung Trust assets 0.05 Susquehanna workforce reduction (0.01) Impairment of nuclear decom. trust investments (0.01) (0.01) (0.01) Sale of Latin American businesses 0.67 Sale of domestic telecommunication operations (0.06) Sale of gas and propane businesses (0.11) Settlement of Wallingford cost-based rates 0.09 Impairment of certain transmission rights (0.04) Change in U.K. tax rate 0.14 Workforce reductions (0.02) Synfuel tax adjustment (0.04) (0.04) Colstrip ground water litigation (0.01) (0.01) 0.08 0.08 0.75 (0.01) Reported Earnings Per Share $2.35 $2.25 $3.35 $2.24 Note: Per share amounts are based on diluted shares outstanding. Forecast MTM adj's from energy-related, non-trading Actual * * *Reflects special items recorded through June 30, 2008.
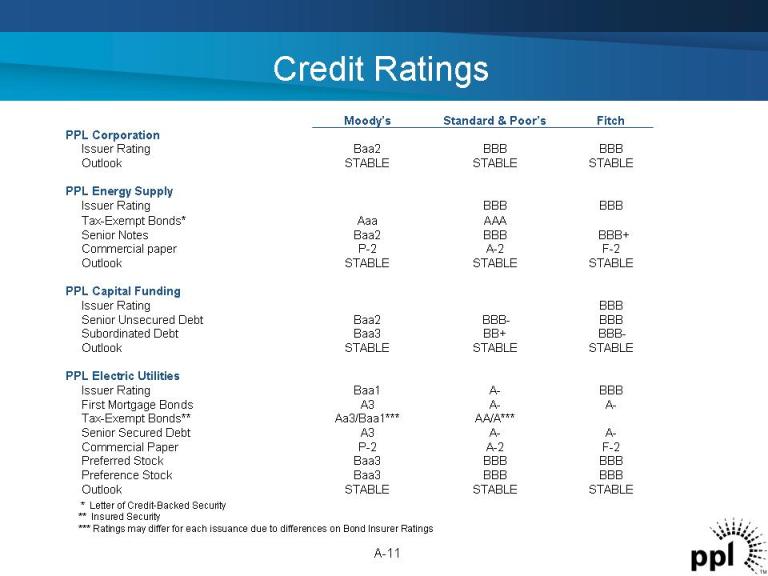
Credit Ratings A-11 BBB Issuer Rating AAAAaa Tax-Exempt Bonds* STABLE STABLE STABLE Outlook A-A-A3Senior Secured Debt F-2A-2P-2Commercial Paper BBBBBBBaa3Preferred Stock BBBA-Baa1Issuer Rating A-A-A3First Mortgage Bonds AA/A*** Aa3/Baa1***Tax-Exempt Bonds** BBBBBBBaa3Preference Stock PPL Electric Utilities BBBBBB-Baa2Senior Unsecured Debt BBB-BB+ Baa3Subordinated Debt STABLE STABLE STABLE Outlook PPL Capital Funding BBBBBB Issuer Rating BBB+ BBBBaa2Senior Notes F-2A-2P-2Commercial paper STABLE STABLE STABLE Outlook PPL Energy Supply STABLE STABLE STABLE Outlook BBBBBBBaa2Issuer Rating PPL Corporation Fitch Standard & Poor’s Moody’s * Letter of Credit-Backed Security ** Insured Security *** Ratings may differ for each issuance due to differences on Bond Insurer Ratings
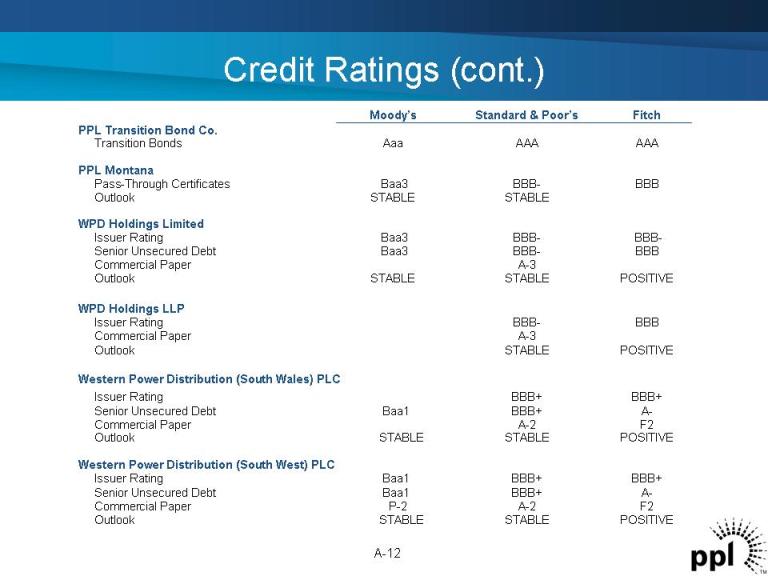
Credit Ratings (cont.) A-3 Commercial Paper A-BBB+ Baa1 Senior Unsecured Debt F2A-2P-2 Commercial Paper POSITIVE STABLE STABLE Outlook BBB+ BBB+ Baa1 Issuer Rating A-BBB+ Baa1 Senior Unsecured Debt F2A-2Commercial Paper POSITIVE STABLE STABLE Outlook Western Power Distribution (South West) PLC BBB+ BBB+ Issuer Rating Western Power Distribution (South Wales) PLC POSITIVE STABLE STABLE Outlook POSITIVE STABLE Outlook BBBBBB-Issuer Rating WPD Holdings LLP BBB-BBB-Baa3 Issuer Rating BBBBBB-Baa3 Senior Unsecured Debt A-3 Commercial Paper WPD Holdings Limited BBBBBB-Baa3 Pass-Through Certificates STABLE STABLE Outlook PPL Montana AAAAAAAaa Transition Bonds PPL Transition Bond Co. Fitch Standard & Poor’s Moody’s A-12
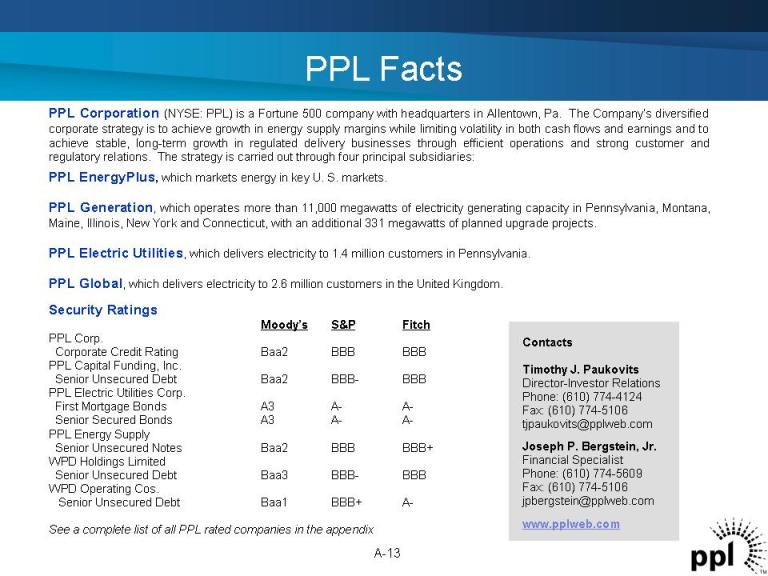
PPL Corporation (NYSE: PPL) is a Fortune 500 company with headquarters in Allentown, Pa. The Company’s diversified corporate strategy is to achieve growth in energy supply margins while limiting volatility in both cash flows and earnings and to achieve stable, long-term growth in regulated delivery businesses through efficient operations and strong customer and regulatory relations. The strategy is carried out through four principal subsidiaries: PPL EnergyPlus, which markets energy in key U. S. markets. PPL Generation, which operates more than 11,000 megawatts of electricity generating capacity in Pennsylvania, Montana, Maine, Illinois, New York and Connecticut, with an additional 331 megawatts of planned upgrade projects. PPL Electric Utilities, which delivers electricity to 1.4 million customers in Pennsylvania. PPL Global, which delivers electricity to 2.6 million customers in the United Kingdom. Security Ratings Moody’s S&P Fitch PPL Corp. Corporate Credit Rating Baa2 BBB BBB PPL Capital Funding, Inc. Senior Unsecured Debt Baa2 BBB-BBB PPL Electric Utilities Corp. First Mortgage Bonds A3 A-A- Senior Secured Bonds A3 A-A- PPL Energy Supply Senior Unsecured Notes Baa2 BBB BBB+ WPD Holdings Limited Senior Unsecured Debt Baa3 BBB-BBB WPD Operating Cos. Senior Unsecured Debt Baa1 BBB+ A- See a complete list of all PPL rated companies in the appendix Contacts Timothy J. Paukovits Director-Investor Relations Phone: (610) 774-4124 Fax: (610) 774-5106 tjpaukovits@pplweb.com Joseph P. Bergstein, Jr. Financial Specialist Phone: (610) 774-5609 Fax: (610) 774-5106 jpbergstein@pplweb.com www.pplweb.com PPL Facts iA-13
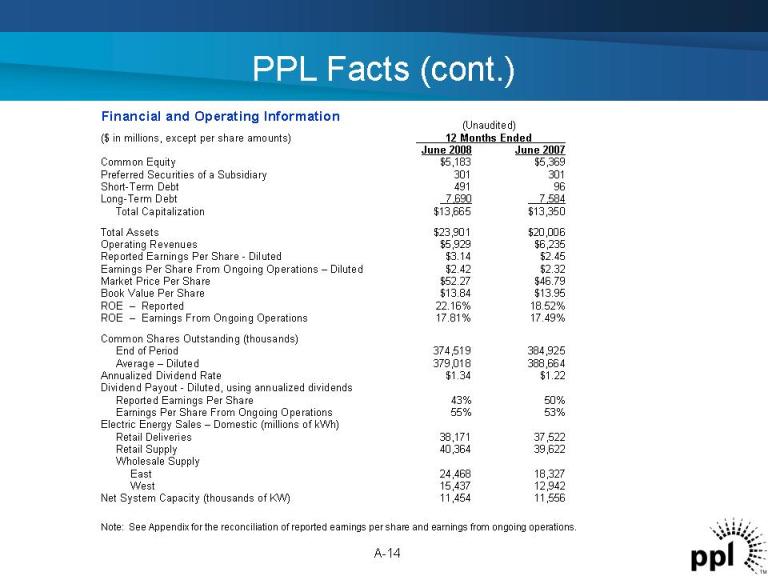
PPL Facts (cont.) Financial and Operating Information Note: See Appendix for the reconciliation of reported earnings per share and earnings from ongoing operations. ii (Unaudited) ($ in millions, except per share amounts) 12 Months Ended June 2008 June 2007 Common Equity $5,183 $5,369 Preferred Securities of a Subsidiary 301 301 Short-Term Debt 491 96 Long-Term Debt 7,690 7,584 Total Capitalization $13,665 $13,350 Total Assets $23,901 $20,006 Operating Revenues $5,929 $6,235 Reported Earnings Per Share -Diluted $3.14 $2.45 Earnings Per Share From Ongoing Operations – Diluted $2.42 $2.32 Market Price Per Share $52.27 $46.79 Book Value Per Share $13.84 $13.95 ROE – Reported 22.16% 18.52% ROE – Earnings From Ongoing Operations 17.81% 17.49% Common Shares Outstanding (thousands) End of Period 374,519 384,925 Average – Diluted 379,018 388,664 Annualized Dividend Rate $1.34 $1.22 Dividend Payout -Diluted, using annualized dividends Reported Earnings Per Share 43% 50% Earnings Per Share From Ongoing Operations 55% 53% Electric Energy Sales – Domestic (millions of kWh) Retail Deliveries 38,171 37,522 Retail Supply 40,364 39,622 Wholesale Supply East 24,468 18,327 West 15,437 12,942 Net System Capacity (thousands of KW) 11,454 11,556 A-14
 Forward-Looking Information Statement A-15 Statements contained in this presentation, including statements with respect to future earnings, energy prices, margins, sales and supply, marketing performance, growth, revenues, expenses, rates, regulation, cash flows, credit profile, financing, dividends, business disposition, corporate strategy, capital additions and expenditures, and generating capacity and performance, are “forward-looking statements” within the meaning of the federal securities laws. Although PPL Corporation believes that the expectations and assumptions reflected in these forward-looking statements are reasonable, these statements involve a number of risks and uncertainties, and actual results may differ materially from the results discussed in the statements. The following are among the important factors that could cause actual results to differ materially from the forward-looking statements: market demand and prices for energy, capacity and fuel; weather conditions affecting customer energy usage and operating costs; competition in power markets; the effect of any business or industry restructuring; the profitability and liquidity of PPL Corporation and its subsidiaries; new accounting requirements or new interpretations or applications of existing requirements; operating performance of plants and other facilities; environmental conditions and requirements and the related costs of compliance, including environmental capital expenditures and emission allowance and other expenses; system conditions and operating costs; development of new projects, markets and technologies; performance of new ventures; asset acquisitions and dispositions; any impact of hurricanes or other severe weather on our business, including any impact on fuel prices; receipt of necessary government permits, approvals and rate relief; capital market conditions and decisions regarding capital structure; the impact of state, federal or foreign investigations applicable to PPL Corporation and its subsidiaries; the outcome of litigation against PPL Corporation and its subsidiaries; stock price performance; the market prices of equity securities and the impact on pension income and resultant cash funding requirements for defined benefit pension plans; the securities and credit ratings of PPL Corporation and its subsidiaries; political, regulatory or economic conditions in states, regions or countries where PPL Corporation or its subsidiaries conduct business, including any potential effects of threatened or actual terrorism or war or other hostilities; foreign exchange rates; new state, federal or foreign legislation, including new tax legislation; and the commitments and liabilities of PPL Corporation and its subsidiaries. Any such forward-looking statements should be considered in light of such important factors and in conjunction with PPL Corporation’s Form 10-K and other reports on file with the Securities and Exchange Commission.
  Definitions of Financial Measures A-16 “Earnings from ongoing operations” excludes the impact of special items. Special items include charges, credits or gains that are unusual or nonrecurring. Special items also include the mark-to-market impact of energy-related, non-trading economic hedges and impairments of securities in PPL’s nuclear decommissioning trust funds. The mark-to-market impact of these hedges is economically neutral to the company because the mark-to-market gains or losses on the energy hedges will reverse as the hedging contracts settle in the future. Earnings from ongoing operations should not be considered as an alternative to reported earnings, or net income, which is an indicator of operating performance determined in accordance with generally accepted accounting principles (GAAP). PPL believes that earnings from ongoing operations, although a non-GAAP measure, is also useful and meaningful to investors because it provides them with PPL’s underlying earnings performance as another criterion in making their investment decisions. PPL’s management also uses earnings from ongoing operations in measuring certain corporate performance goals. Other companies may use different measures to present financial performance. “Free cash flow before dividends” is derived by deducting capital expenditures and other investing activities-net, as well as the repayment of transition bonds, from cash flow from operations. Free cash flow before dividends should not be considered as an alternative to cash flow from operations, which is determined in accordance with GAAP. PPL believes that free cash flow before dividends, although a non-GAAP measure, is an important measure to both management and investors since it is an indicator of the company’s ability to sustain operations and growth without additional outside financing beyond the requirement to fund maturing debt obligations. Other companies may calculate free cash flow before dividends in a different manner.