Third Quarter Earnings Call November 4, 2008 Exhibit 99.2
Cautionary Statements And Factors That May Affect Future Results Any statements made in this presentation about future operating results or other future events are forward-looking statements under the Safe Harbor Provisions of the Private Securities Litigation Reform Act of 1995. Actual results may differ materially from such forward-looking statements. A discussion of factors that could cause actual results or events to vary is contained in the Appendix to this presentation and in the Company’s SEC filings. 1

Agenda • Third Quarter 2008 Earnings and Review of 2008, 2009 and 2010 Earnings Forecast and Outlook • Third Quarter Segment Results and Financial Overview • Operational Review • Q&A J. H. Miller P. A. Farr W. H. Spence 2
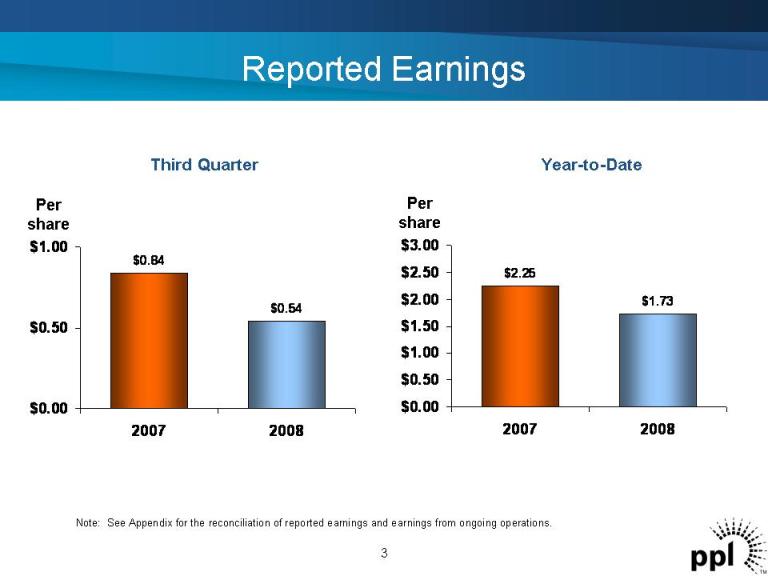
Reported Earnings Year-to-Date Per share $2.25 $1.73 $0.00 $0.50 $1.00 $1.50 $2.00 $2.50 $3.00 2007 2008 3 Note: See Appendix for the reconciliation of reported earnings and earnings from ongoing operations. Per share $0.84 $0.54 $0.00 $0.50 $1.00 2007 2008 Third Quarter

Ongoing Earnings Year-to-Date Per share $2.00 $1.56 $0.00 $0.50 $1.00 $1.50 $2.00 $2.50 2007 2008 4 Note: See Appendix for the reconciliation of reported earnings and earnings from ongoing operations. Per share $0.72 $0.45 $0.00 $0.50 $1.00 2007 2008 Third Quarter
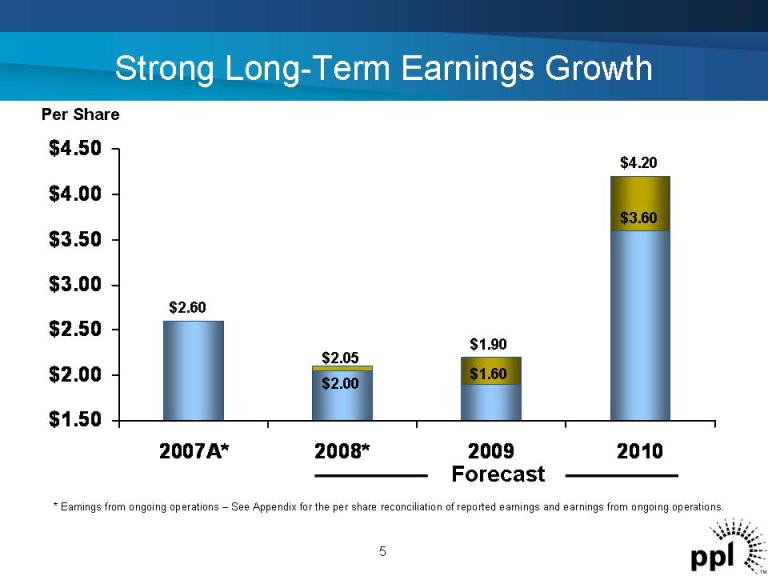
$1.50 $2.00 $2.50 $3.00 $3.50 $4.00 $4.50 2007A* 2008* 2009 2010 Strong Long-Term Earnings Growth Forecast 5 * Earnings from ongoing operations – See Appendix for the per share reconciliation of reported earnings and earnings from ongoing operations. $2.60 $2.05 $4.20 Per Share $1.90 $1.60 $3.60 $2.00
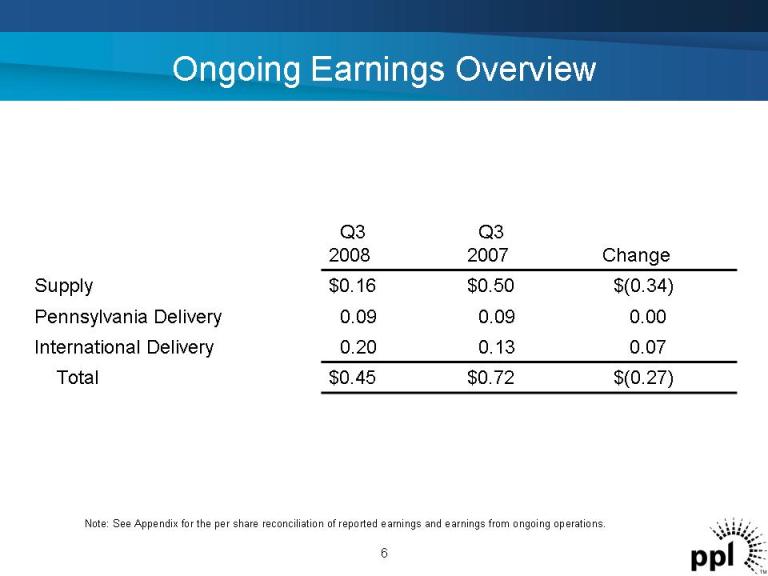
Ongoing Earnings Overview $(0.27)$0.72$0.45Total 0.070.130.20International Delivery 0.000.090.09Pennsylvania Delivery $(0.34)$0.50$0.16Supply Change Q3 2007 Q3 2008 6 Note: See Appendix for the per share reconciliation of reported earnings and earnings from ongoing operations.
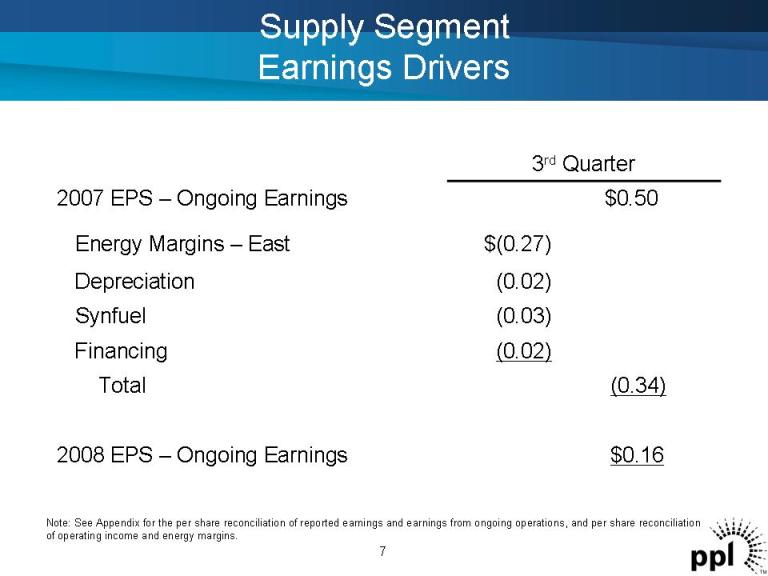
Supply Segment Earnings Drivers (0.02)Depreciation (0.03)Synfuel (0.02)Financing $0.162008 EPS – Ongoing Earnings (0.34)Total $(0.27)Energy Margins – East $0.502007 EPS – Ongoing Earnings 3rd Quarter Note: See Appendix for the per share reconciliation of reported earnings and earnings from ongoing operations, and per share reconciliation of operating income and energy margins. 7
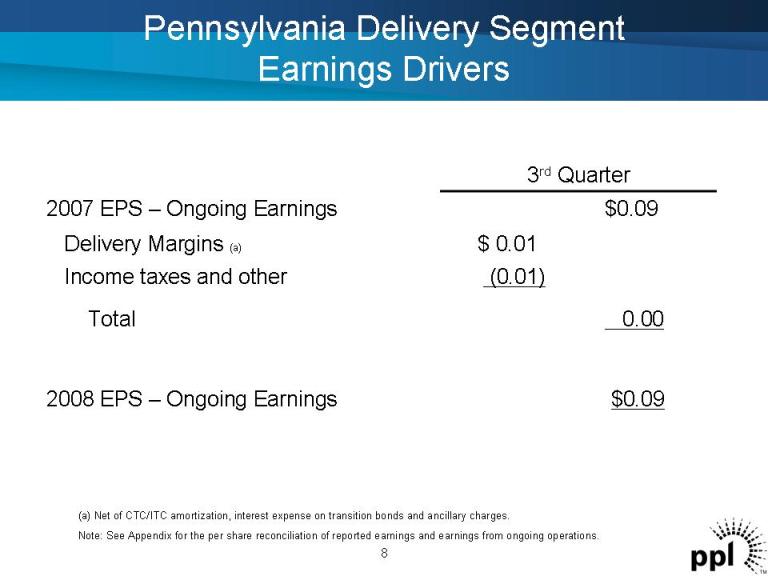
Pennsylvania Delivery Segment Earnings Drivers (0.01)Income taxes and other $0.092008 EPS – Ongoing Earnings 0.00Total $ 0.01Delivery Margins (a) $0.092007 EPS – Ongoing Earnings 3rd Quarter 8 (a) Net of CTC/ITC amortization, interest expense on transition bonds and ancillary charges. Note: See Appendix for the per share reconciliation of reported earnings and earnings from ongoing operations.
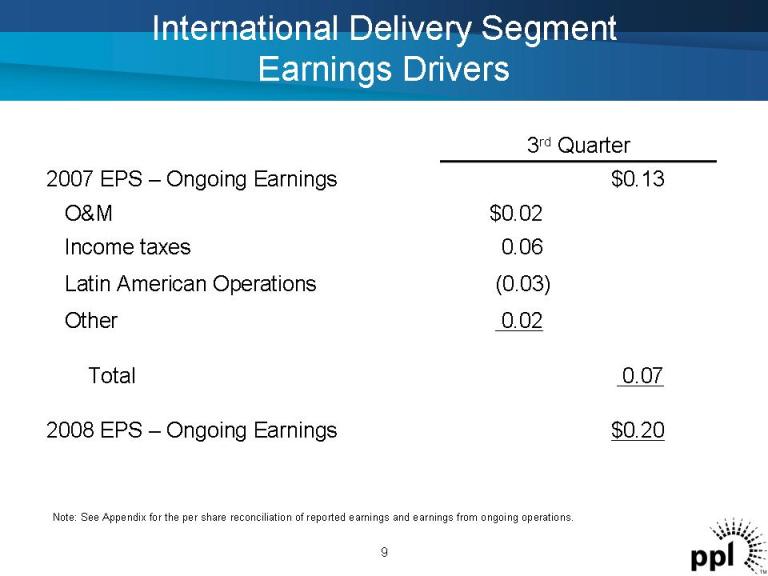
International Delivery Segment Earnings Drivers 0.02Other (0.03)Latin American Operations $0.202008 EPS – Ongoing Earnings 0.07Total 0.06Income taxes $0.02O&M $0.132007 EPS – Ongoing Earnings 3rd Quarter 9 Note: See Appendix for the per share reconciliation of reported earnings and earnings from ongoing operations.
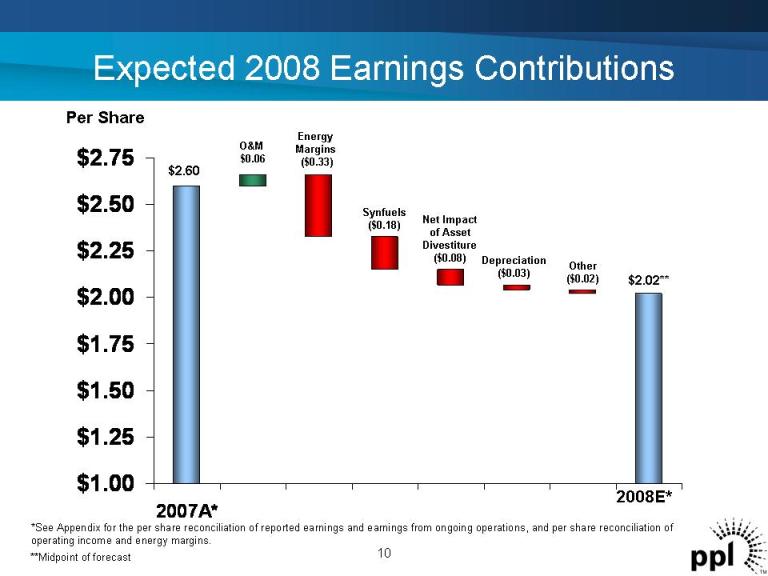
Expected 2008 Earnings Contributions 10 *See Appendix for the per share reconciliation of reported earnings and earnings from ongoing operations, and per share reconciliation of operating income and energy margins. $1.00 $1.25 $1.50 $1.75 $2.00 $2.25 $2.50 $2.75 2007A* Per Share $2.60 Net Impact of Asset Divestiture ($0.08) Other ($0.02) $2.02** Depreciation ($0.03) Energy Margins ($0.33) Synfuels ($0.18) 2008E* O&M $0.06 **Midpoint of forecast
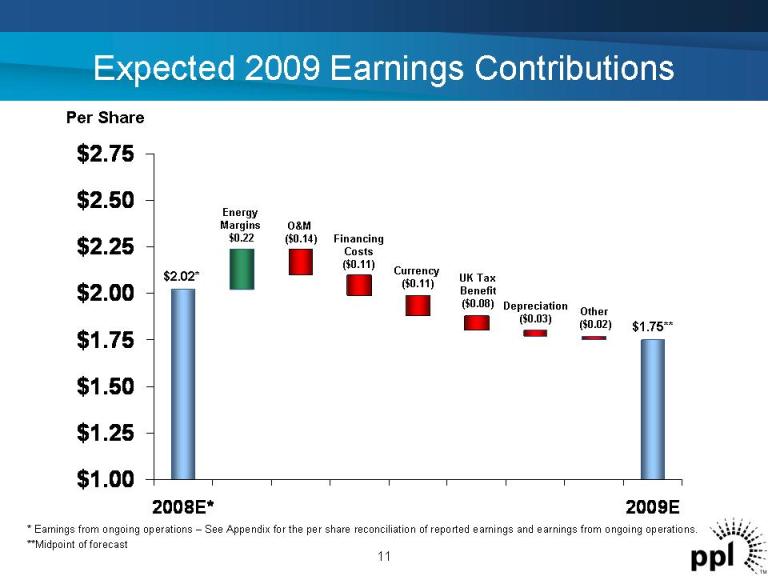
$1.00 $1.25 $1.50 $1.75 $2.00 $2.25 $2.50 $2.75 2008E* 2009E Expected 2009 Earnings Contributions 11 * Earnings from ongoing operations – See Appendix for the per share reconciliation of reported earnings and earnings from ongoing operations. **Midpoint of forecast Per Share $2.02* Financing Costs ($0.11) Depreciation ($0.03) $1.75** UK Tax Benefit ($0.08) Energy Margins $0.22 O&M ($0.14) Currency ($0.11) Other ($0.02)
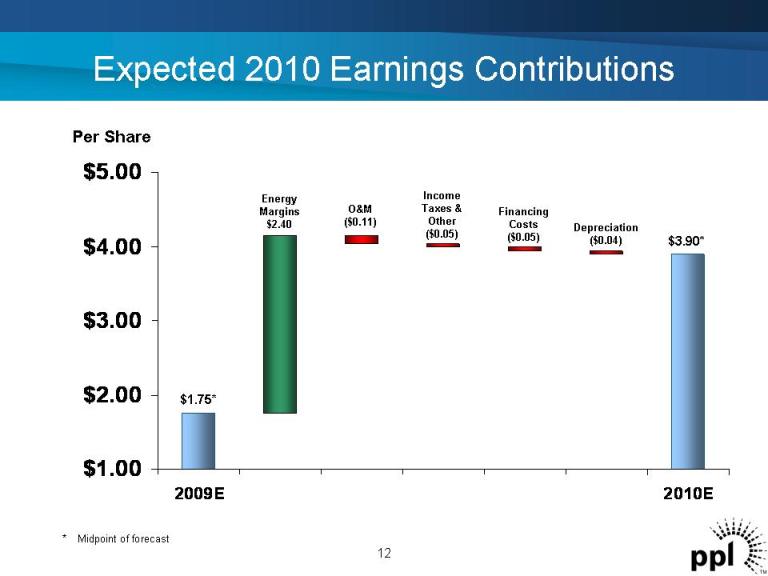
$1.00 $2.00 $3.00 $4.00 $5.00 2009E 2010E Expected 2010 Earnings Contributions 12 * Midpoint of forecast $1.75* Energy Margins $2.40 $3.90* O&M ($0.11) Income Taxes & Other ($0.05) Depreciation ($0.04) Per Share Financing Costs ($0.05)
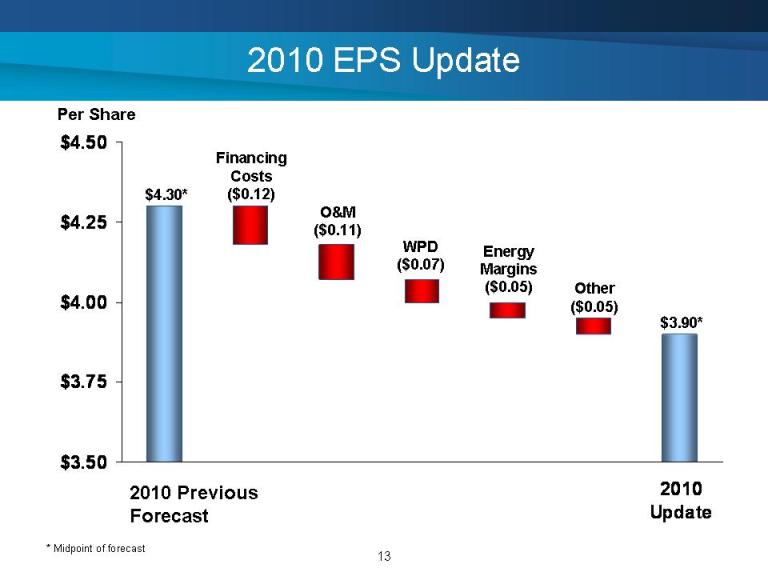
2010 EPS Update $3.50 $3.75 $4.00 $4.25 $4.50 2010 Update $4.30* WPD ($0.07) Financing Costs ($0.12) $3.90* O&M ($0.11) Other ($0.05) 2010 Previous Forecast * Midpoint of forecast 13 Energy Margins ($0.05) Per Share
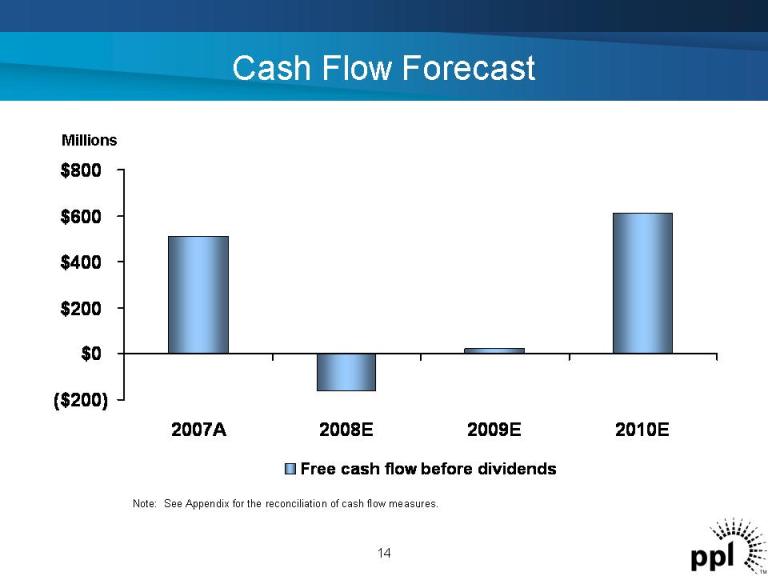
Cash Flow Forecast Millions ($200) $0 $200 $400 $600 $800 2007A 2008E 2009E 2010E Free cash flow before dividends 14 Note: See Appendix for the reconciliation of cash flow measures.
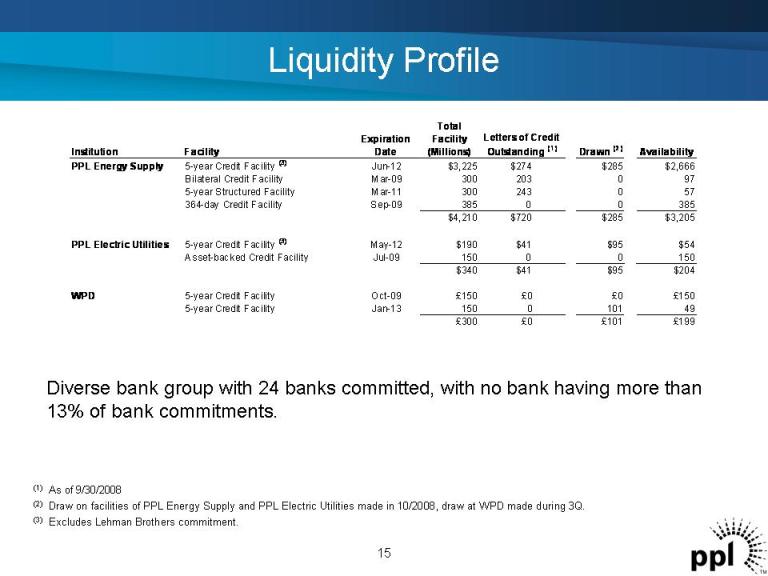
Liquidity Profile (1) As of 9/30/2008 Diverse bank group with 24 banks committed, with no bank having more than 13% of bank commitments. 15 (2) Draw on facilities of PPL Energy Supply and PPL Electric Utilities made in 10/2008, draw at WPD made during 3Q. Institution Facility Expiration Date Total Facility (Millions) Letters of Credit Outstanding (1) Drawn (2) Availability PPL Energy Supply 5-year Credit Facility (3) Jun-12 $3,225 $274 $285 $2,666 Bilateral Credit Facility Mar-09 300 203 0 97 5-year Structured Facility Mar-11 300 243 0 57 364-day Credit Facility Sep-09 385 0 0 385 $4,210 $720 $285 $3,205 PPL Electric Utilities 5-year Credit Facility (3) May-12 $190 $41 $95 $54 Asset-backed Credit Facility Jul-09 150 0 0 150 $340 $41 $95 $204 WPD 5-year Credit Facility Oct-09 £150 £0 £0 £150 5-year Credit Facility Jan-13 150 0 101 49 £300 £0 £101 £199 (3) Excludes Lehman Brothers commitment.
PPL Energy Supply Collateral Profile (Millions of Dollars) 16 - 500 1,000 1,500 2,000 2,500 3,000 3,500 4,000 4,500 5,000 Jun- 07 Jul-07 Aug- 07 Sep- 07 Oct- 07 Nov- 07 Dec- 07 Jan- 08 Feb- 08 Mar- 08 Apr- 08 May- 08 Jun- 08 Jul-08 Aug- 08 Sep- 08 Available Credit Capacity Cash posted Letters of Credit
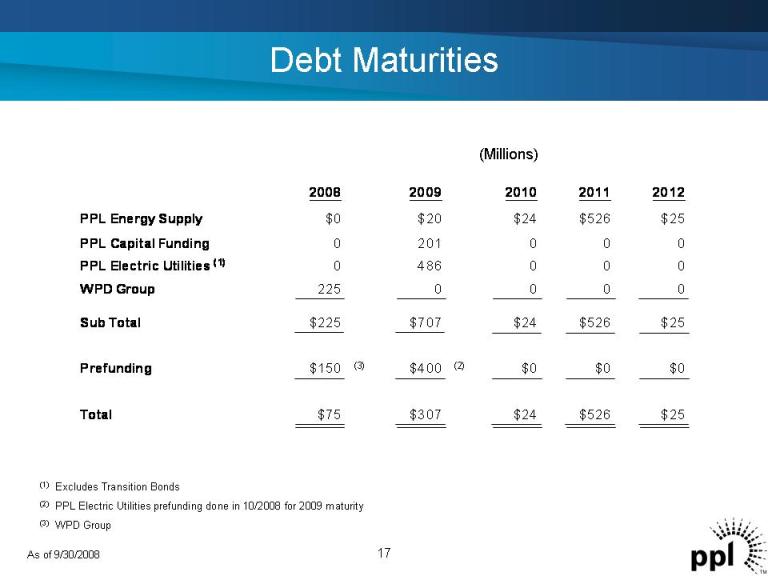
Debt Maturities (1) Excludes Transition Bonds (2) PPL Electric Utilities prefunding done in 10/2008 for 2009 maturity (3) WPD Group As of 9/30/2008 17 2008 2009 2010 2011 2012 PPL Energy Supply $0 $20 $24 $526 $25 PPL Capital Funding 0 201 0 0 0 PPL Electric Utilities (1) 0 486 0 0 0 WPD Group 225 0 0 0 0 Sub Total $225 $707 $24 $526 $25 Prefunding $150 (3) $400 (2) $0 $0 $0 Total $75 $307 $24 $526 $25 (Millions)
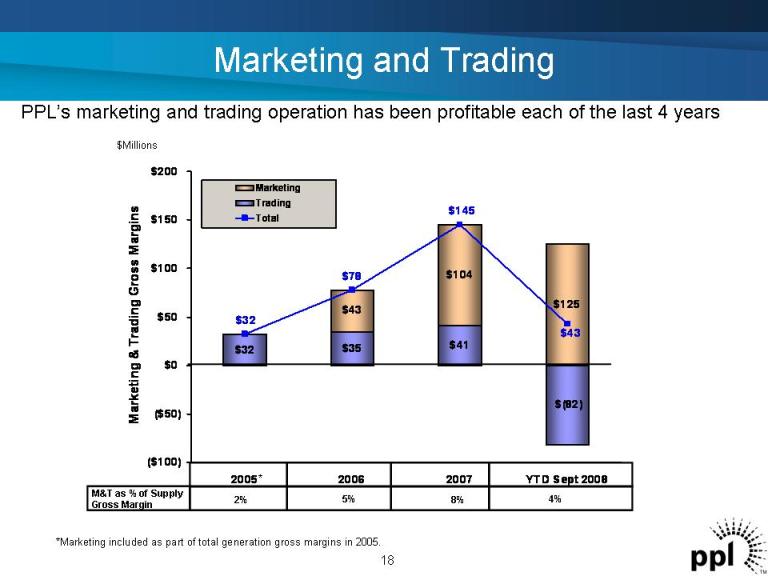
PPL’s marketing and trading operation has been profitable each of the last 4 years 18 Marketing and Trading *Marketing included as part of total generation gross margins in 2005. $32 $35 $41 $(82) $43 $104 $125 $145 $78 $32 $43 ($100) ($50) $0 $50 $100 $150 $200 2005 2006 2007 YTD Sept 2008 Marketing & Trading Gross Margins Marketing Trading Total $Millions 2% 5% 8% 4%M&T as % of Supply Gross Margin *
Repair Work at Montour Cooling Tower 19

Current Hedge Positions -Electricity and Fuel 2008 2009 2010 2011 2012 Electricity Sales East 99% 96% 76% 43% 23% West 100% 91% 75% 65% 44% Total 99% 95% 76% 46% 26% Uranium 100% 100% 100% 100% 100% Coal East 100% 98% 89% 78% 59% West 100% 100% 100% 86% 77% Total 100% 98% 92% 80% 64% Unhedged Coal – million tons Brunner & Montour 0.0 0.0 0.9 1.9 3.5 Keystone & Conemaugh 0.0 0.2 0.2 0.1 0.3 Note: As of 9/30/2008 20
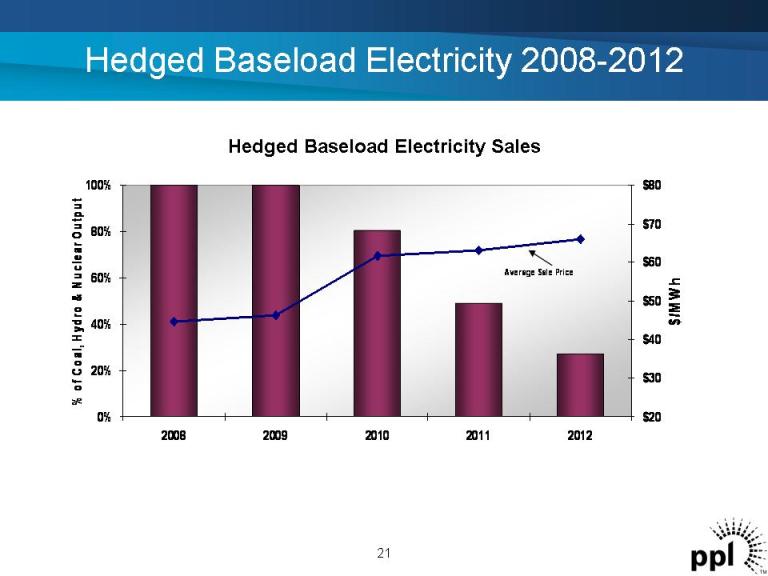
Hedged Baseload Electricity 2008-2012 Hedged Baseload Electricity Sales 0% 20% 40% 60% 80% 100% 2008 2009 2010 2011 2012 % of C o al, H hydro & N u clear Output $20 $30 $40 $50 $60 $70 $80 $/M W h Average Sale Price 21
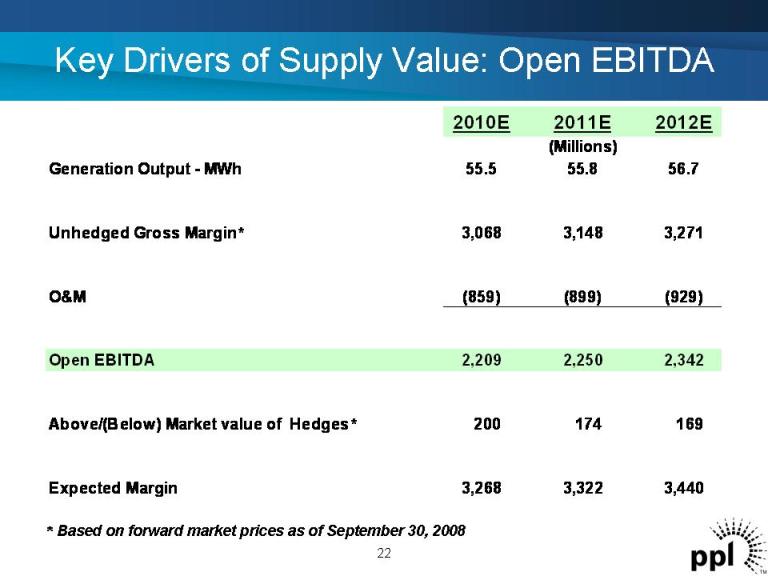
Key Drivers of Supply Value: Open EBITDA *Based on forward market prices as of September 30, 2008 2010E 2011E 2012E Generation Output - MWh 55.5 55.8 56.7 Unhedged Gross Margin*3,068 3,148 3,271 O&M (859) (899) (929) Open EBITDA 2,209 2,250 2,342 Above/(Below) Market value of Hedges* 200 174 169 Expected Margin 3,268 3,322 3,440 (Millions) 22
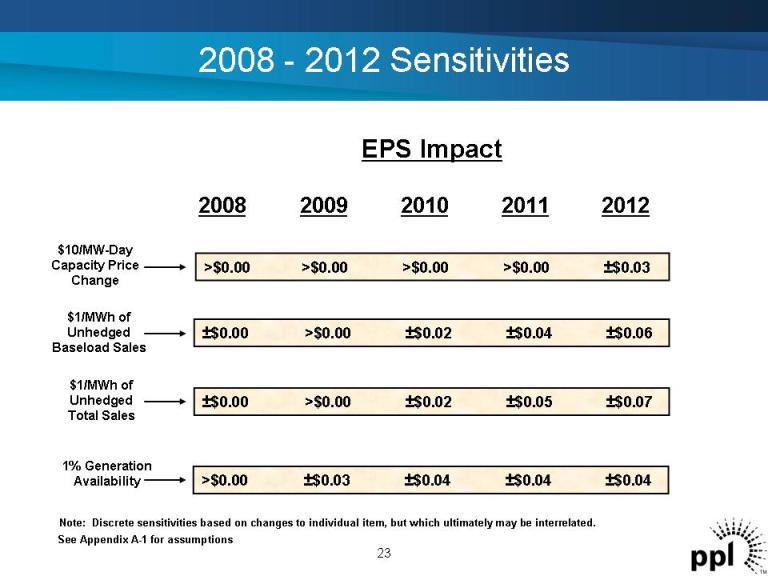
2008 - -2012 Sensitivities 2008 2009 2010 2011 2012 $10/MW-Day Capacity Price Change >$0.00 >$0.00 >$0.00 >$0.00 ±$0.03 $1/MWh of Unhedged Baseload Sales ±$0.00 >$0.00 ±$0.02 ±$0.04 ±$0.06 $1/MWh of Unhedged Total Sales ±$0.00 >$0.00 ±$0.02 ±$0.05 ±$0.07 1% Generation Availability >$0.00 ±$0.03 ±$0.04 ±$0.04 ±$0.04 EPS Impact See Appendix A-1 for assumptions 23 Note: Discrete sensitivities based on changes to individual item, but which ultimately may be interrelated.

ppl
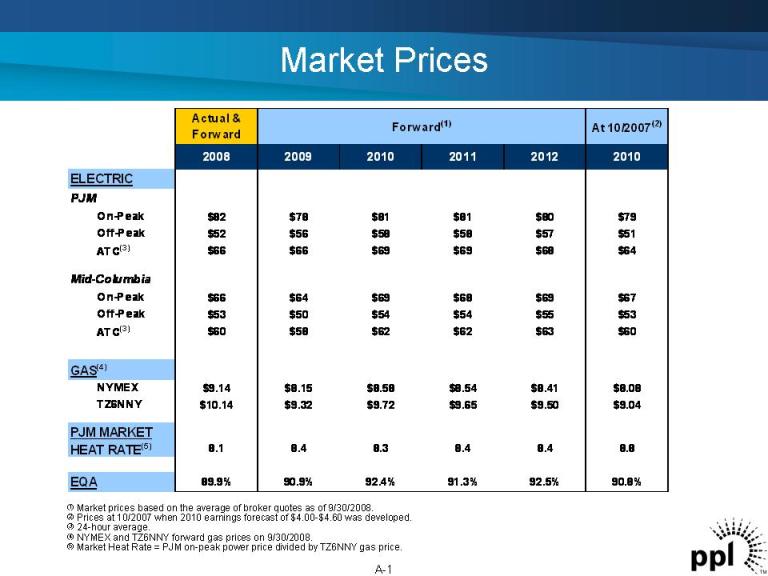
Market Prices (1) Market prices based on the average of broker quotes as of 9/30/2008. (2) Prices at 10/2007 when 2010 earnings forecast of $4.00-$4.60 was developed. (3) 24-hour average. (4) NYMEX and TZ6NNY forward gas prices on 9/30/2008. (5) Market Heat Rate = PJM on-peak power price divided by TZ6NNY gas price. A-1 Actual & Forward At 10/2007(2) 2008 2009 2010 2011 2012 2010 $82 $78 $81 $81 $80 $79 $52 $56 $58 $58 $57 $51 $66 $66 $69 $69 $68 $64 $66 $64 $69 $68 $69 $67 $53 $50 $54 $54 $55 $53 $60 $58 $62 $62 $63 $60 $9.14 $8.15 $8.58 $8.54 $8.41 $8.08 $10.14 $9.32 $9.72 $9.65 $9.50 $9.04 8.1 8.4 8.3 8.4 8.4 8.8 89.9% 90.9% 92.4% 91.3% 92.5% 90.8% EQA HEAT RATE(5) On-Peak Off-Peak ATC(3) NYMEX TZ6NNY GAS(4) PJM MARKET Mid-Columbia Forward(1) On-Peak Off-Peak ATC(3) ELECTRIC PJM
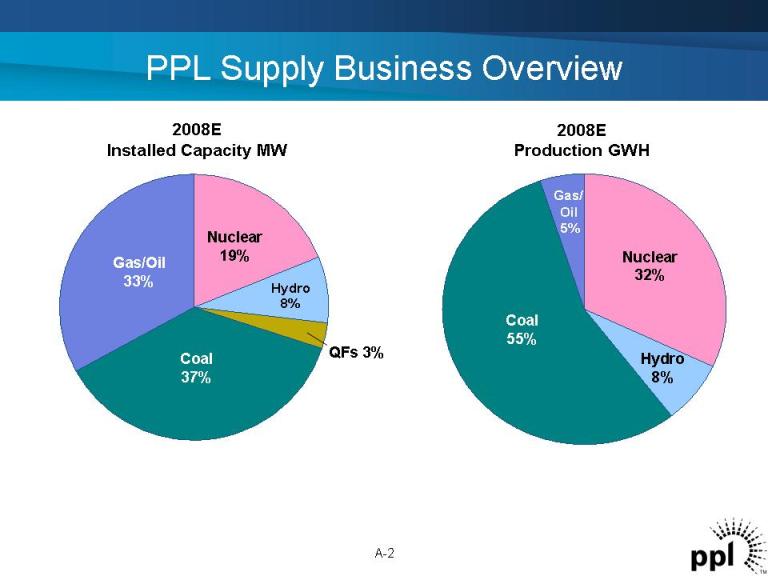
PPL Supply Business Overview 2008E Production GWH A-2 Gas/Oil 33% Coal 37% Nuclear 19% Hydro8% QFs 3% 2008E Installed Capacity MW Gas/ Oil 5% Coal 55% Nuclear 32% Hydro 8%
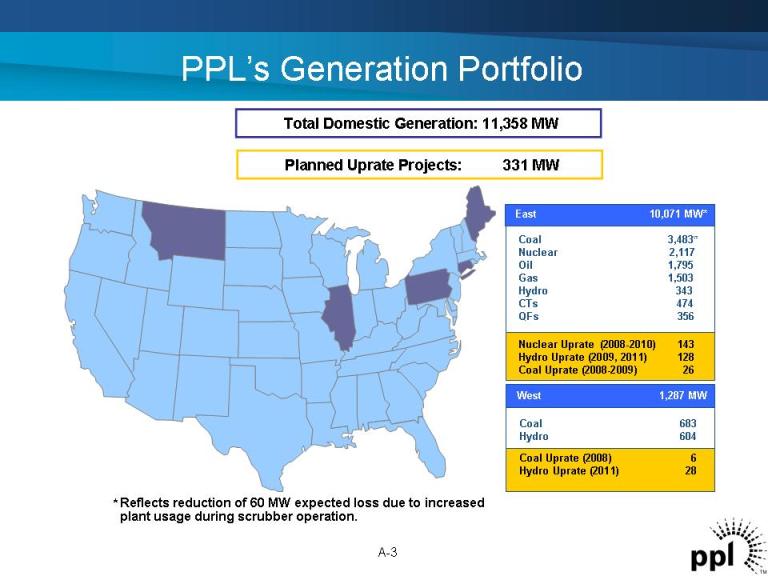
PPL’s Generation Portfolio Total Domestic Generation: 11,358 MW Planned Uprate Projects: 331 MW *Reflects reduction of 60 MW expected loss due to increased plant usage during scrubber operation. A-3 Coal 3,483* Nuclear 2,117 Oil 1,795 Gas 1,503 Hydro 343 CTs 474 QFs 356 East 10,071 MW* Coal 683 Hydro 604 West 1,287 MW Coal Uprate (2008) 6 Hydro Uprate (2011) 28 Nuclear Uprate (2008-2010) 143 Hydro Uprate (2009, 2011) 128 Coal Uprate (2008-2009) 26 *
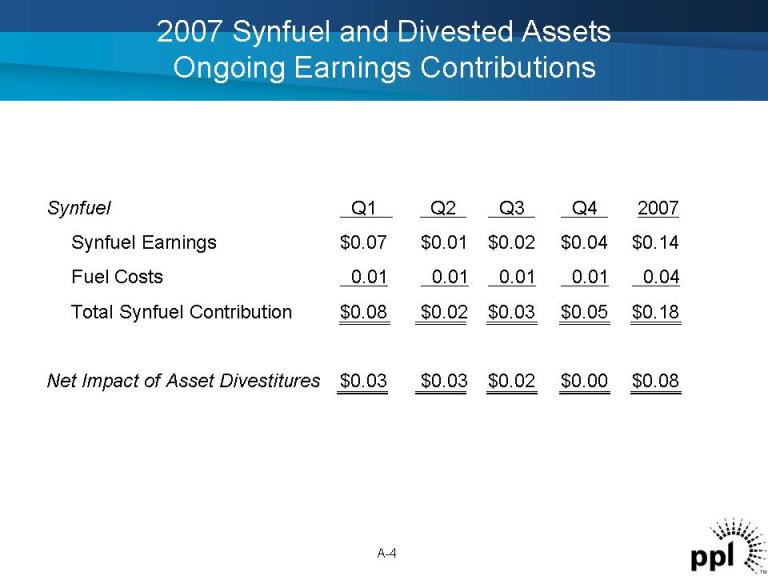
2007 Synfuel and Divested Assets Ongoing Earnings Contributions A-4 Synfuel Q1 Q2 Q3 Q4 2007 Synfuel Earnings $0.07 $0.01 $0.02 $0.04 $0.14 Fuel Costs 0.01 0.01 0.01 0.01 0.04 Total Synfuel Contribution $0.08 $0.02 $0.03 $0.05 $0.18 Net Impact of Asset Divestitures $0.03 $0.03 $0.02 $0.00 $0.08
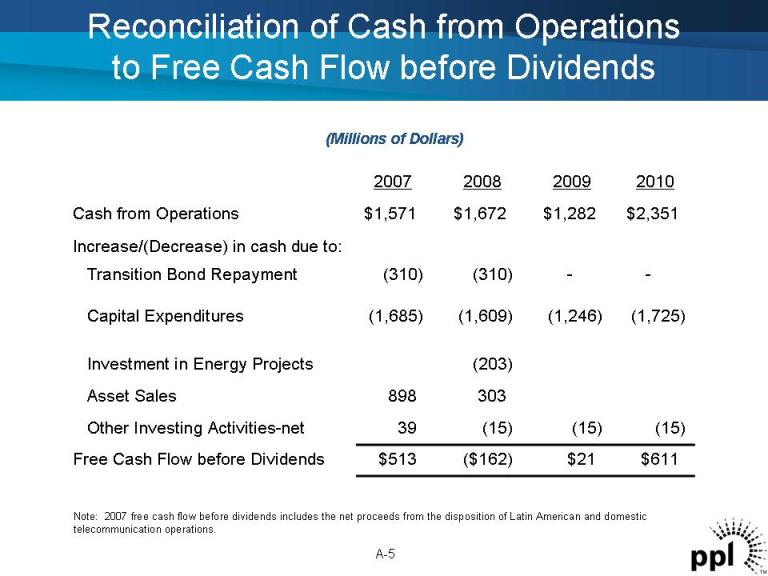
Reconciliation of Cash from Operations to Free Cash Flow before Dividends (Millions of Dollars) A-5 303898Asset Sales (203)Investment in Energy Projects $611$21($162)$513Free Cash Flow before Dividends (15)(15)(15)39Other Investing Activities-net (1,725)(1,246)(1,609)(1,685)Capital Expenditures --(310)(310)Transition Bond Repayment Increase/(Decrease) in cash due to: $2,351$1,282$1,672$1,571Cash from Operations 2010200920082007 Note: 2007 free cash flow before dividends includes the net proceeds from the disposition of Latin American and domestic telecommunication operations.
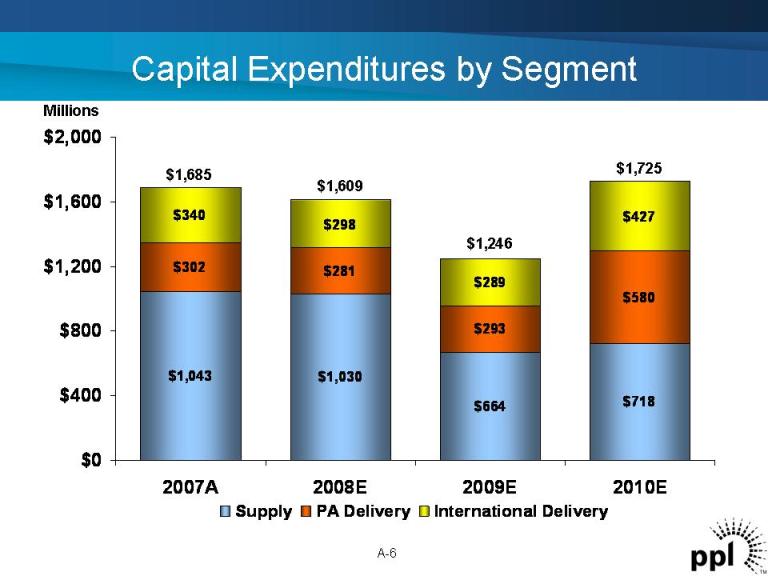
Millions $1,043 $1,030 $664 $718 $302 $281 $293 $580 $340 $298 $289 $427 $0 $400 $800 $1,200 $1,600 $2,000 2007A 2008E 2009E 2010E Supply PA Delivery International Delivery $1,685 $1,725 $1,246 $1,609 Capital Expenditures by Segment A-6
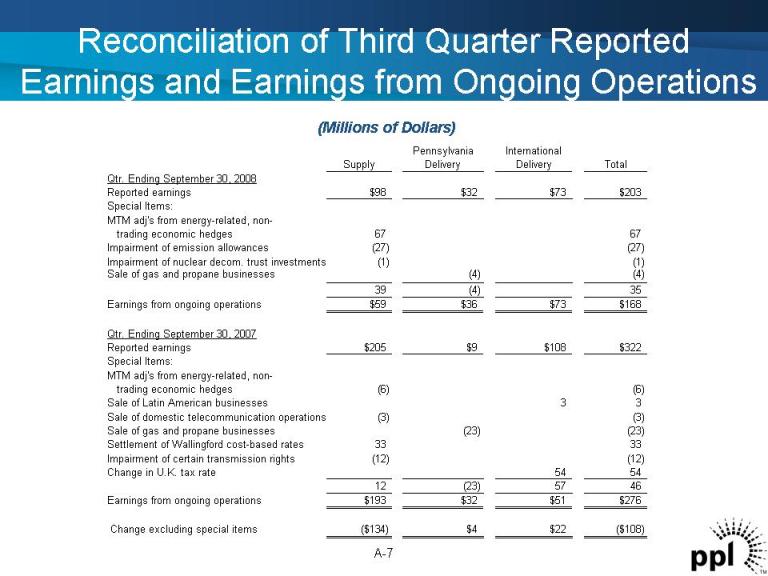
Reconciliation of Third Quarter Reported Earnings and Earnings from Ongoing Operations A-7 (Millions of Dollars) Pennsylvania International Supply Delivery Delivery Total Qtr. Ending September 30, 2008 Reported earnings $98 $32 $73 $203 Special Items: MTM adj's from energy-related, non- trading economic hedges 67 67 Impairment of emission allowances (27) (27) Impairment of nuclear decom. trust investments (1) (1) Sale of gas and propane businesses (4) (4) 39 (4) 35 Earnings from ongoing operations $59 $36 $73 $168 Qtr. Ending September 30, 2007 Reported earnings $205 $9 $108 $322 Special Items: MTM adj's from energy-related, non- trading economic hedges (6) (6) Sale of Latin American businesses 3 3 Sale of domestic telecommunication operations (3) (3) Sale of gas and propane businesses (23) (23) Settlement of Wallingford cost-based rates 33 33 Impairment of certain transmission rights (12) (12) Change in U.K. tax rate 54 54 12 (23) 57 46 Earnings from ongoing operations $193 $32 $51 $276 Change excluding special items ($134) $4 $22 ($108)
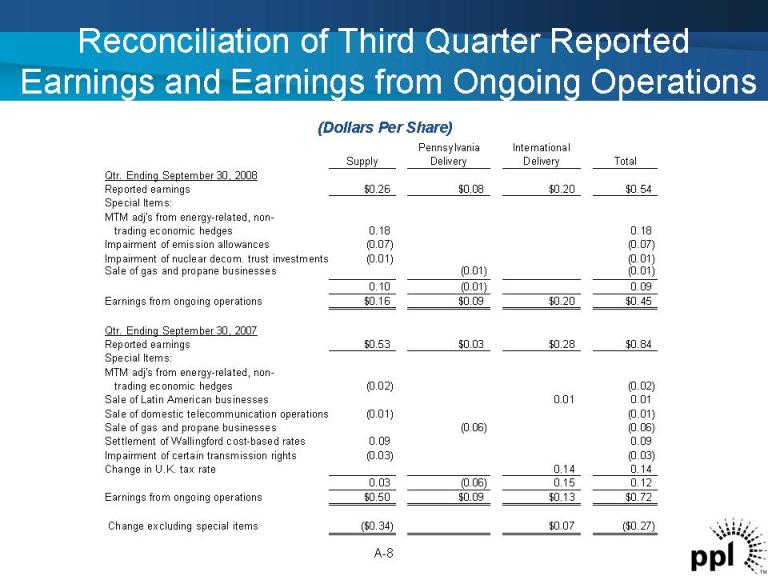
Reconciliation of Third Quarter Reported Earnings and Earnings from Ongoing Operations A-8 (Dollars Per Share) Pennsylvania International Supply Delivery Delivery Total Qtr. Ending September 30, 2008 Reported earnings $0.26 $0.08 $0.20 $0.54 Special Items: MTM adj's from energy-related, non- trading economic hedges 0.18 0.18 Impairment of emission allowances (0.07) (0.07) Impairment of nuclear decom. trust investments (0.01) (0.01) Sale of gas and propane businesses (0.01) (0.01) 0.10 (0.01) 0.09 Earnings from ongoing operations $0.16 $0.09 $0.20 $0.45 Qtr. Ending September 30, 2007 Reported earnings $0.53 $0.03 $0.28 $0.84 Special Items: MTM adj's from energy-related, non- trading economic hedges (0.02) (0.02) Sale of Latin American businesses 0.01 0.01 Sale of domestic telecommunication operations (0.01) (0.01) Sale of gas and propane businesses (0.06) (0.06) Settlement of Wallingford cost-based rates 0.09 0.09 Impairment of certain transmission rights (0.03) (0.03) Change in U.K. tax rate 0.14 0.14 0.03 (0.06) 0.15 0.12 Earnings from ongoing operations $0.50 $0.09 $0.13 $0.72 Change excluding special items ($0.34) $0.07 ($0.27)
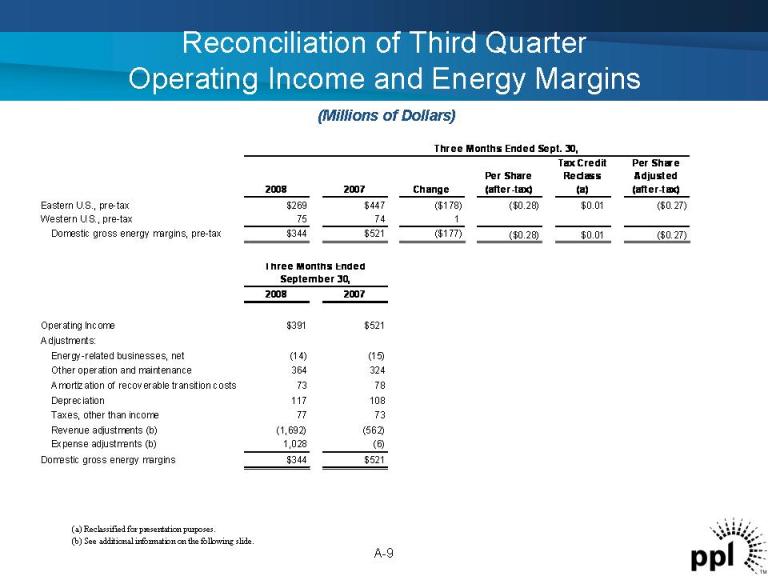
Reconciliation of Third Quarter Operating Income and Energy Margins A-9 2008 2007 Change Per Share (after-tax) Tax Credit Reclass (a) Per Share Adjusted (after-tax) Eastern U.S., pre-tax $269 $447 ($178) ($0.28) $0.01 ($0.27) Western U.S., pre-tax 75 74 1 Domestic gross energy margins, pre-tax $344 $521 ($177) ($0.28) $0.01 ($0.27) 2008 2007 Operating Income $391 $521 Adjustments: Energy-related businesses, net (14) (15) Other operation and maintenance 364 324 Amortization of recoverable transition costs 73 78 Depreciation 117 108 Taxes, other than income 77 73 Revenue adjustments (b) (1,692) (562) Expense adjustments (b) 1,028 (6) Domestic gross energy margins $344 $521 Three Months Ended Sept. 30, Three Months Ended September 30, (Millions of Dollars) (a) Reclassified for presentation purposes. (b) See additional information on the following slide.
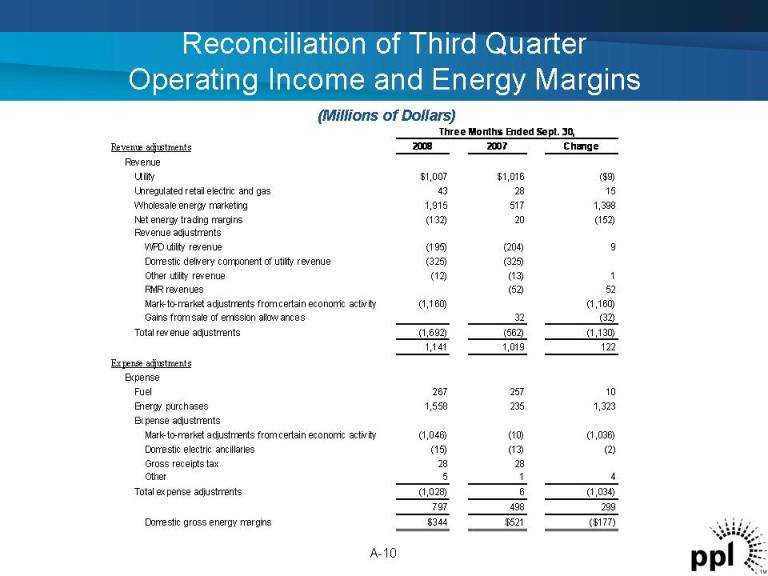
Reconciliation of Third Quarter Operating Income and Energy Margins A-10 Revenue adjustments 2008 2007 Change Revenue Utility $1,007 $1,016 ($9) Unregulated retail electric and gas 43 28 15 Wholesale energy marketing 1,915 517 1,398 Net energy trading margins (132) 20 (152) Revenue adjustments WPD utility revenue (195) (204) 9 Domestic delivery component of utility revenue (325) (325) Other utility revenue (12) (13) 1 RMR revenues (52) 52 Mark-to-market adjustments from certain economic activity (1,160) (1,160) Gains from sale of emission allowances 32 (32) Total revenue adjustments (1,692) (562) (1,130) 1,141 1,019 122 Expense adjustments Expense Fuel 267 257 10 Energy purchases 1,558 235 1,323 Expense adjustments Mark-to-market adjustments from certain economic activity (1,046) (10) (1,036) Domestic electric ancillaries (15) (13) (2) Gross receipts tax 28 28 Other 5 1 4 Total expense adjustments (1,028) 6 (1,034) 797 498 299 Domestic gross energy margins $344 $521 ($177) Three Months Ended Sept. 30, (Millions of Dollars)
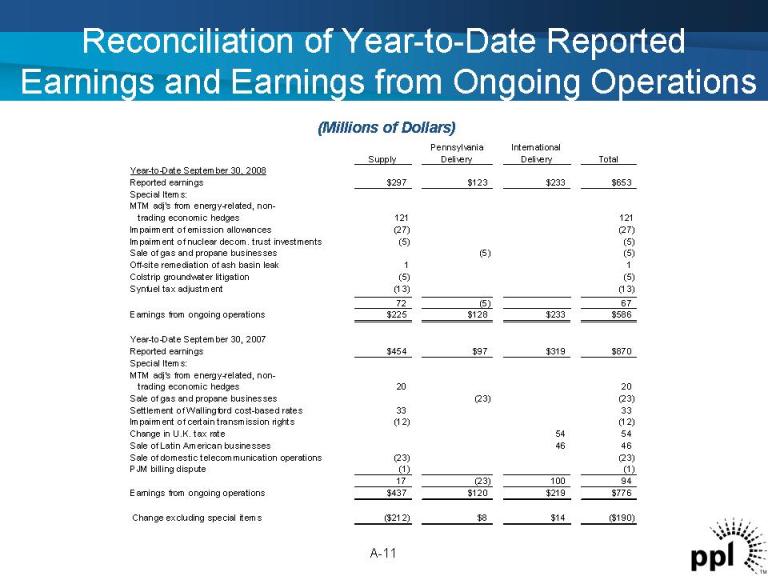
Reconciliation of Year-to-Date Reported Earnings and Earnings from Ongoing Operations A-11 (Millions of Dollars) Pennsylvania International Supply Delivery Delivery Total Year-to-Date September 30, 2008 Reported earnings $297 $123 $233 $653 Special Items: MTM adj's from energy-related, non- trading economic hedges 121 121 Impairment of emission allowances (27) (27) Impairment of nuclear decom. trust investments (5) (5) Sale of gas and propane businesses (5) (5) Off-site remediation of ash basin leak 1 1 Colstrip groundwater litigation (5) (5) Synfuel tax adjustment (13) (13) 72 (5) 67 Earnings from ongoing operations $225 $128 $233 $586 Year-to-Date September 30, 2007 Reported earnings $454 $97 $319 $870 Special Items: MTM adj's from energy-related, non- trading economic hedges 20 20 Sale of gas and propane businesses (23) (23) Settlement of Wallingford cost-based rates 33 33 Impairment of certain transmission rights (12) (12) Change in U.K. tax rate 54 54 Sale of Latin American businesses 46 46 Sale of domestic telecommunication operations (23) (23) PJM billing dispute (1) (1) 17 (23) 100 94 Earnings from ongoing operations $437 $120 $219 $776 Change excluding special items ($212) $8 $14 ($190)
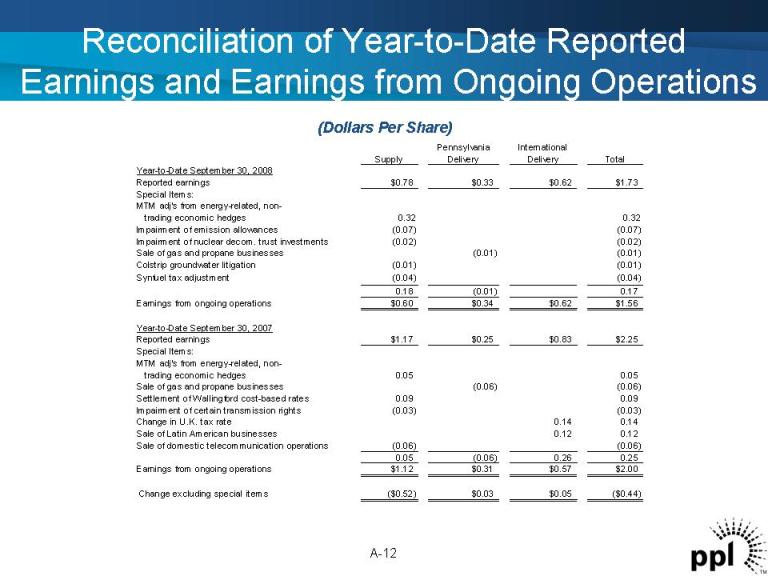
Reconciliation of Year-to-Date Reported Earnings and Earnings from Ongoing Operations A-12 (Dollars Per Share) Pennsylvania International Supply Delivery Delivery Total Year-to-Date September 30, 2008 Reported earnings $0.78 $0.33 $0.62 $1.73 Special Items: MTM adj's from energy-related, non- trading economic hedges 0.32 0.32 Impairment of emission allowances (0.07) (0.07) Impairment of nuclear decom. trust investments (0.02) (0.02) Sale of gas and propane businesses (0.01) (0.01) Colstrip groundwater litigation (0.01) (0.01) Synfuel tax adjustment (0.04) (0.04) 0.18 (0.01) 0.17 Earnings from ongoing operations $0.60 $0.34 $0.62 $1.56 Year-to-Date September 30, 2007 Reported earnings $1.17 $0.25 $0.83 $2.25 Special Items: MTM adj's from energy-related, non- trading economic hedges 0.05 0.05 Sale of gas and propane businesses (0.06) (0.06) Settlement of Wallingford cost-based rates 0.09 0.09 Impairment of certain transmission rights (0.03) (0.03) Change in U.K. tax rate 0.14 0.14 Sale of Latin American businesses 0.12 0.12 Sale of domestic telecommunication operations (0.06) (0.06) 0.05 (0.06) 0.26 0.25 Earnings from ongoing operations $1.12 $0.31 $0.57 $2.00 Change excluding special items ($0.52) $0.03 $0.05 ($0.44)
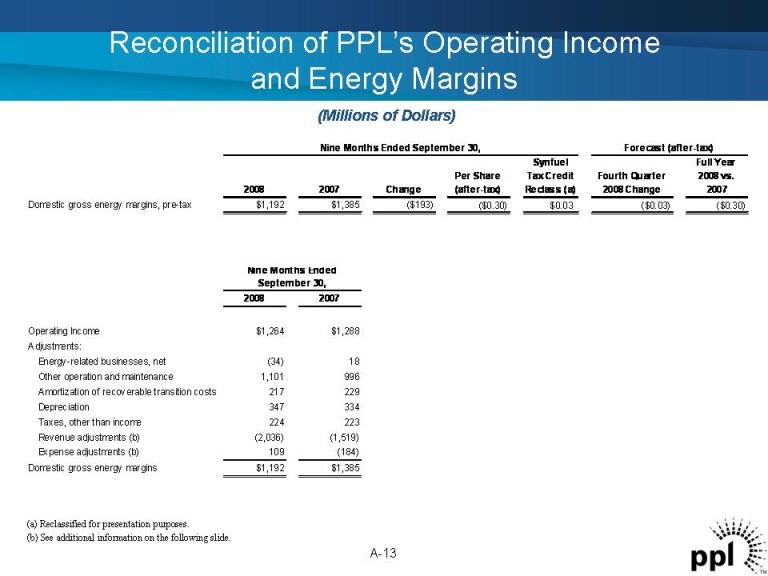
Reconciliation of PPL’s Operating Income and Energy Margins A-13 2008 2007 Change Per Share (after-tax) Synfuel Tax Credit Reclass (a) Fourth Quarter 2008 Change Full Year 2008 vs. 2007 Domestic gross energy margins, pre-tax $1,192 $1,385 ($193) ($0.30) $0.03 ($0.03) ($0.30) 2008 2007 Operating Income $1,264 $1,288 Adjustments: Energy-related businesses, net (34) 18 Other operation and maintenance 1,101 996 Amortization of recoverable transition costs 217 229 Depreciation 347 334 Taxes, other than income 224 223 Revenue adjustments (b) (2,036) (1,519) Expense adjustments (b) 109 (184) Domestic gross energy margins $1,192 $1,385 Forecast (after-tax) Nine Months Ended September 30, Nine Months Ended September 30, (Millions of Dollars) (a) Reclassified for presentation purposes. (b) See additional information on the following slide.
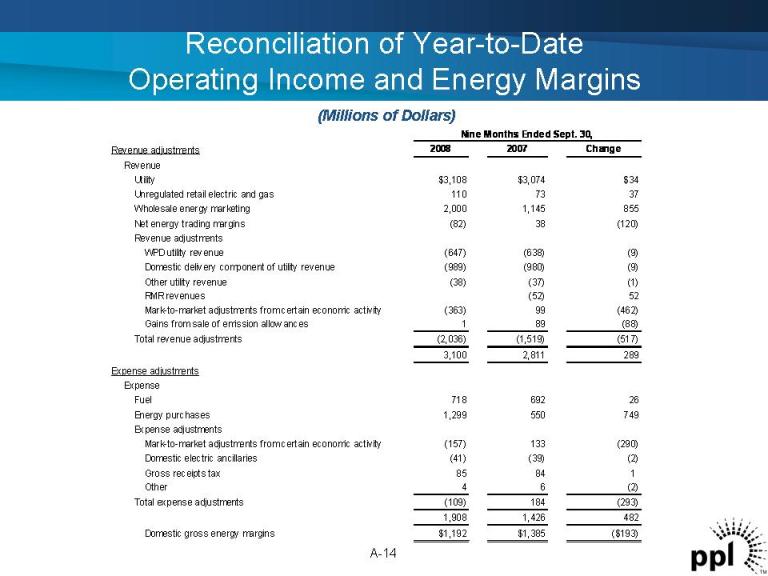
Reconciliation of Year-to-Date Operating Income and Energy Margins A-14 Revenue adjustments 2008 2007 Change Revenue Utility $3,108 $3,074 $34 Unregulated retail electric and gas 110 73 37 Wholesale energy marketing 2,000 1,145 855 Net energy trading margins (82) 38 (120) Revenue adjustments WPD utility revenue (647) (638) (9) Domestic delivery component of utility revenue (989) (980) (9) Other utility revenue (38) (37) (1) RMR revenues (52) 52 Mark-to-market adjustments from certain economic activity (363) 99 (462) Gains from sale of emission allowances 1 89 (88) Total revenue adjustments (2,036) (1,519) (517) 3,100 2,811 289 Expense adjustments Expense Fuel 718 692 26 Energy purchases 1,299 550 749 Expense adjustments Mark-to-market adjustments from certain economic activity (157) 133 (290) Domestic electric ancillaries (41) (39) (2) Gross receipts tax 85 84 1 Other 4 6 (2) Total expense adjustments (109) 184 (293) 1,908 1,426 482 Domestic gross energy margins $1,192 $1,385 ($193) Nine Months Ended Sept. 30, (Millions of Dollars)
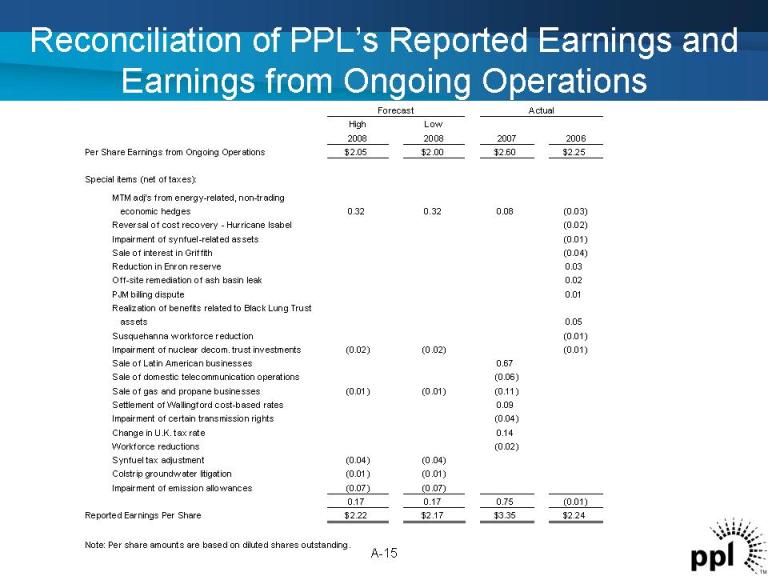
Reconciliation of PPL’s Reported Earnings and Earnings from Ongoing Operations High Low 2008 2008 2007 2006 Per Share Earnings from Ongoing Operations $2.05 $2.00 $2.60 $2.25 Special items (net of taxes): economic hedges 0.32 0.32 0.08 (0.03) Reversal of cost recovery - Hurricane Isabel (0.02) Impairment of synfuel-related assets (0.01) Sale of interest in Griffith (0.04) Reduction in Enron reserve 0.03 Off-site remediation of ash basin leak 0.02 PJM billing dispute 0.01 Realization of benefits related to Black Lung Trust assets 0.05 Susquehanna workforce reduction (0.01) Impairment of nuclear decom. trust investments (0.02) (0.02) (0.01) Sale of Latin American businesses 0.67 Sale of domestic telecommunication operations (0.06) Sale of gas and propane businesses (0.01) (0.01) (0.11) Settlement of Wallingford cost-based rates 0.09 Impairment of certain transmission rights (0.04) Change in U.K. tax rate 0.14 Workforce reductions (0.02) Synfuel tax adjustment (0.04) (0.04) Colstrip groundwater litigation (0.01) (0.01) Impairment of emission allowances (0.07) (0.07) 0.17 0.17 0.75 (0.01) Reported Earnings Per Share $2.22 $2.17 $3.35 $2.24 Note: Per share amounts are based on diluted shares outstanding. MTM adj's from energy-related, non-trading Actual Forecast A-15
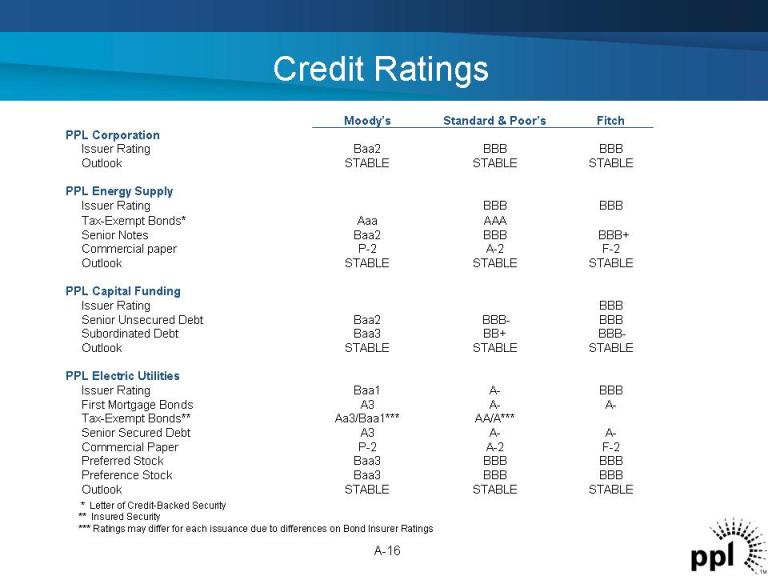
Credit Ratings A-16 BBB Issuer Rating AAA Aaa Tax-Exempt Bonds* STABLE STABLE STABLE Outlook A-A-A3Senior Secured Debt F-2A-2P-2Commercial Paper BBBBBBBaa3Preferred Stock BBBA-Baa1Issuer Rating A-A-A3First Mortgage Bonds AA/A*** Aa3/Baa1***Tax-Exempt Bonds** BBBBBBBaa3Preference Stock PPL Electric Utilities BBBBBB-Baa2Senior Unsecured Debt BBB-BB+ Baa3Subordinated Debt STABLE STABLE STABLE Outlook PPL Capital Funding BBB BBB Issuer Rating BBB+ BBBBaa2Senior Notes F-2A-2P-2Commercial paper STABLE STABLE STABLE Outlook PPL Energy Supply STABLE STABLE STABLE Outlook BBBBBBBaa2Issuer Rating PPL Corporation Fitch Standard & Poor’s Moody’s * Letter of Credit-Backed Security ** Insured Security *** Ratings may differ for each issuance due to differences on Bond Insurer Ratings
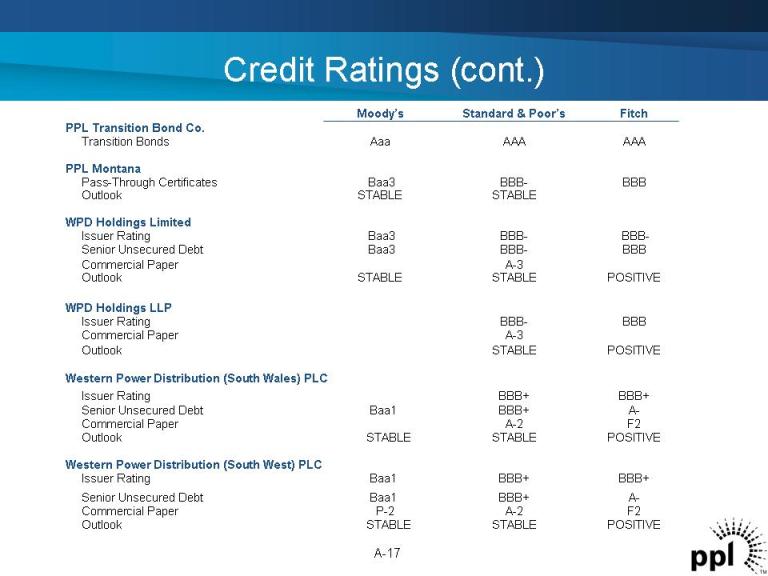
Credit Ratings (cont.) A-17 A-3Commercial Paper A-BBB+ Baa1Senior Unsecured Debt F2A-2P-2Commercial Paper POSITIVE STABLE STABLE Outlook BBB+ BBB+ Baa1Issuer Rating A-BBB+ Baa1Senior Unsecured Debt F2A-2Commercial Paper POSITIVE STABLE STABLE Outlook Western Power Distribution (South West) PLC BBB+ BBB+ Issuer Rating Western Power Distribution (South Wales) PLC POSITIVE STABLE STABLE Outlook POSITIVE STABLE Outlook BBB BBB-Issuer Rating WPD Holdings LLP BBB-BBB-Baa3Issuer Rating BBBBBB-Baa3Senior Unsecured Debt A-3Commercial Paper WPD Holdings Limited BBBBBB-Baa3Pass-Through Certificates STABLE STABLE Outlook PPL Montana AAA AAA Aaa Transition Bonds PPL Transition Bond Co. Fitch Standard & Poor’s Moody’s
Forward-Looking Information Statement A-18 Statements contained in this presentation, including statements with respect to future earnings, energy prices, margins, sales and supply, marketing performance, growth, revenues, expenses, rates, regulation, cash flows, credit profile, financing, dividends, business disposition, corporate strategy, capital additions and expenditures, and generating capacity and performance, are “forward-looking statements” within the meaning of the federal securities laws. Although PPL Corporation believes that the expectations and assumptions reflected in these forward-looking statements are reasonable, these statements involve a number of risks and uncertainties, and actual results may differ materially from the results discussed in the statements. The following are among the important factors that could cause actual results to differ materially from the forward-looking statements: market demand and prices for energy, capacity and fuel; weather conditions affecting customer energy usage and operating costs; competition in power markets; the effect of any business or industry restructuring; the profitability and liquidity of PPL Corporation and its subsidiaries; new accounting requirements or new interpretations or applications of existing requirements; operating performance of plants and other facilities; environmental conditions and requirements and the related costs of compliance, including environmental capital expenditures and emission allowance and other expenses; system conditions and operating costs; development of new projects, markets and technologies; performance of new ventures; asset acquisitions and dispositions; any impact of hurricanes or other severe weather on our business, including any impact on fuel prices; receipt of necessary government permits, approvals and rate relief; capital market conditions and decisions regarding capital structure; the impact of state, federal or foreign investigations applicable to PPL Corporation and its subsidiaries; the outcome of litigation against PPL Corporation and its subsidiaries; stock price performance; the market prices of equity securities and the impact on pension income and resultant cash funding requirements for defined benefit pension plans; the securities and credit ratings of PPL Corporation and its subsidiaries; political, regulatory or economic conditions in states, regions or countries where PPL Corporation or its subsidiaries conduct business, including any potential effects of threatened or actual terrorism or war or other hostilities; foreign exchange rates; new state, federal or foreign legislation, including new tax legislation; and the commitments and liabilities of PPL Corporation and its subsidiaries. Any such forward-looking statements should be considered in light of such important factors and in conjunction with PPL Corporation’s Form 10-K and other reports on file with the Securities and Exchange Commission.
“Earnings from ongoing operations” excludes the impact of special items. Special items include charges, credits or gains that are unusual or nonrecurring. Special items also include the mark-to-market impact of energy-related, non-trading economic hedges and impairments of securities in PPL’s nuclear decommissioning trust funds. The mark-to-market impact of these hedges is economically neutral to the company because the mark-to-market gains or losses on the energy hedges will reverse as the hedging contracts settle in the future. Earnings from ongoing operations should not be considered as an alternative to reported earnings, or net income, which is an indicator of operating performance determined in accordance with generally accepted accounting principles (GAAP). PPL believes that earnings from ongoing operations, although a non- GAAP measure, is also useful and meaningful to investors because it provides them with PPL’s underlying earnings performance as another criterion in making their investment decisions. PPL’s management also uses earnings from ongoing operations in measuring certain corporate performance goals. Other companies may use different measures to present financial performance. “Free cash flow before dividends” is derived by deducting capital expenditures and other investing activities-net, as well as the repayment of transition bonds, from cash flow from operations. Free cash flow before dividends should not be considered as an alternative to cash flow from operations, which is determined in accordance with GAAP. PPL believes that free cash flow before dividends, although a non-GAAP measure, is an important measure to both management and investors since it is an indicator of the company’s ability to sustain operations and growth without additional outside financing beyond the requirement to fund maturing debt obligations. Other companies may calculate free cash flow before dividends in a different manner. "Domestic Gross Energy Margins" is intended to supplement the investors' understanding of PPL’s domestic non-trading and trading activities by combining applicable income statement line items and related adjustments to calculate a single financial measure. PPL believes that "Domestic Gross Energy Margins" is useful and meaningful to investors because it provides them with the results of PPL's domestic non-trading and trading activities as another criterion in making their investment decisions. "Domestic Gross Energy Margins" is not intended to replace "Operating Income," which is determined in accordance with GAAP, as an indicator of overall operating performance. PPL's management also uses "Domestic Gross Energy Margins" in measuring certain corporate performance goals used in determining variable compensation. Other companies may use different measures to present the results of their non-trading and trading activities. Definitions of Financial Measures A-19