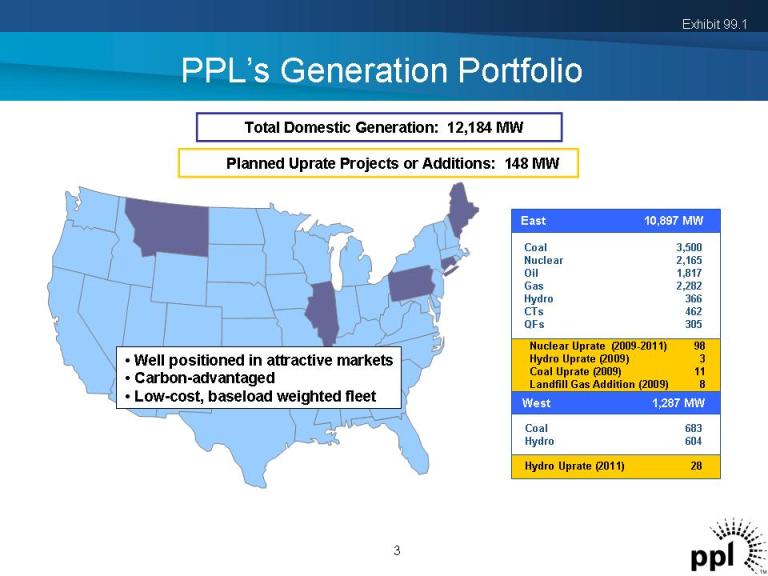
PPL’s Generation Portfolio Total Domestic Generation: 12,184 MW Planned Uprate Projects or Additions: 148 MW • Well positioned in attractive markets • Carbon-advantaged • Low-cost, baseload weighted fleet 3 Exhibit 99.1 Coal 3,500 Nuclear 2,165 Oil 1,817 Gas 2,282 Hydro 366 CTs 462 QFs 305 Coal 683 Hydro 604 West 1,287 MW Hydro Uprate (2011) 28 Nuclear Uprate (2009-2011) 98 Hydro Uprate (2009) 3 Coal Uprate (2009) 11 Landfill Gas Addition (2009) 8 East 10,897 MW
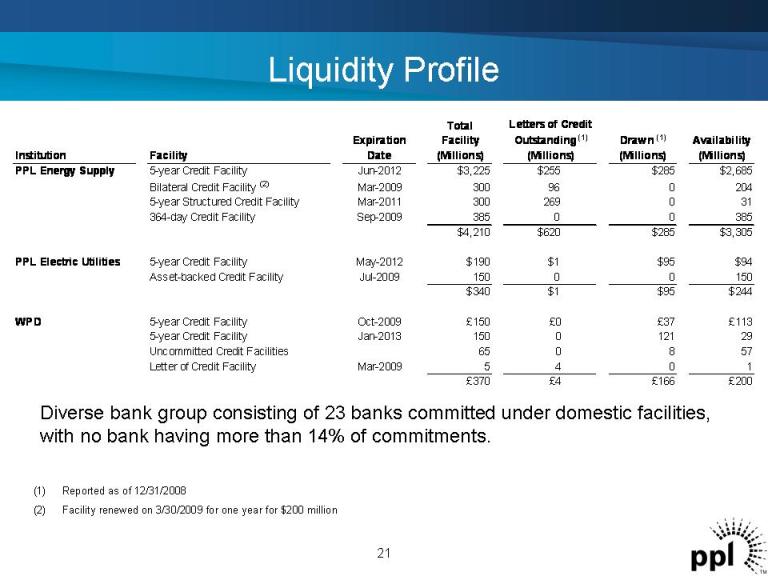
Liquidity Profile (1) Reported as of 12/31/2008 (2) Facility renewed on 3/30/2009 for one year for $200 million Diverse bank group consisting of 23 banks committed under domestic facilities, with no bank having more than 14% of commitments. 21 Institution Facility Expiration Date Total Facility (Millions) Letters of Credit Outstanding (1) (Millions) Drawn (1) (Millions) Availability (Millions) PPL Energy Supply 5-year Credit Facility Jun-2012 $3,225 $255 $285 $2,685 Bilateral Credit Facility (2) Mar-2009 300 96 0 204 5-year Structured Credit Facility Mar-2011 300 269 0 31 364-day Credit Facility Sep-2009 385 0 0 385 $4,210 $620 $285 $3,305 PPL Electric Utilities 5-year Credit Facility May-2012 $190 $1 $95 $94 Asset-backed Credit Facility Jul-2009 150 0 0 150 $340 $1 $95 $244 WPD 5-year Credit Facility Oct-2009 £150 £0 £37 £113 5-year Credit Facility Jan-2013 150 0 121 29 Uncommitted Credit Facilities 65 0 8 57 Letter of Credit Facility Mar-2009 5 4 0 1 £370 £4 £166 £200