Second Quarter Earnings Call August 4, 2009 Exhibit 99.2
Cautionary Statements and Factors That May Affect Future Results Any statements made in this presentation about future operating results or other future events are forward-looking statements under the Safe Harbor Provisions of the Private Securities Litigation Reform Act of 1995. Actual results may differ materially from such forward-looking statements. A discussion of factors that could cause actual results or events to vary is contained in the Appendix to this presentation and in the Company’s SEC filings. 1

Agenda • Second Quarter 2009 Earnings, 2009 and 2010 Earnings Forecast and Outlook • Segment Results and Financial Overview • Operational Review • Q&A J. H. Miller P. A. Farr W. H. Spence 2
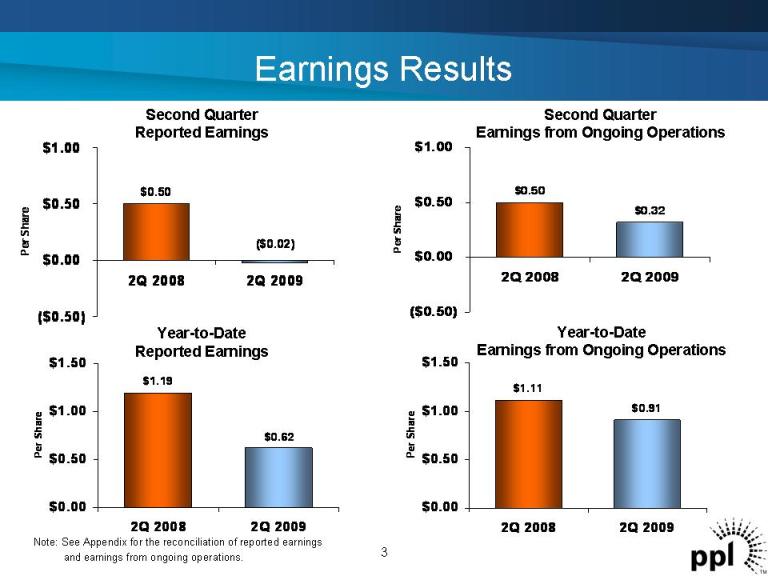
Earnings Results Second Quarter Earnings from Ongoing Operations $0.50 $0.32 ($0.50) $0.00 $0.50 $1.00 2Q 2008 2Q 2009 Per Share $0.50 ($0.02) ($0.50) $0.00 $0.50 $1.00 2Q 2008 2Q 2009 Per Share Second Quarter Reported Earnings Note: See Appendix for the reconciliation of reported earnings and earnings from ongoing operations. $1.19 $0.62 $0.00 $0.50 $1.00 $1.50 2Q 2008 2Q 2009 Per Share $1.11 $0.91 $0.00 $0.50 $1.00 $1.50 2Q 2008 2Q 2009 Per Share Year-to-Date Reported Earnings Year-to-Date Earnings from Ongoing Operations 3
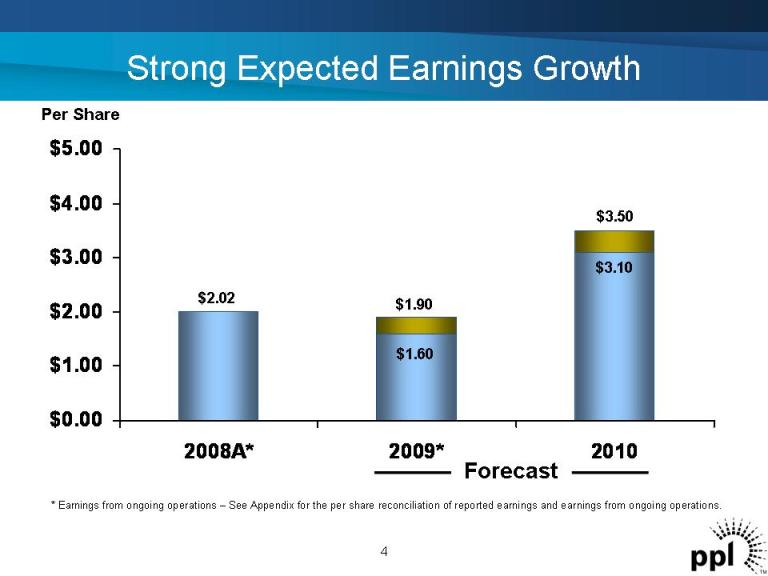
$0.00 $1.00 $2.00 $3.00 $4.00 $5.00 2008A* 2009* 2010 Strong Expected Earnings Growth Forecast 4 * Earnings from ongoing operations – See Appendix for the per share reconciliation of reported earnings and earnings from ongoing operations. $2.02 $3.50 Per Share $1.90 $1.60 $3.10
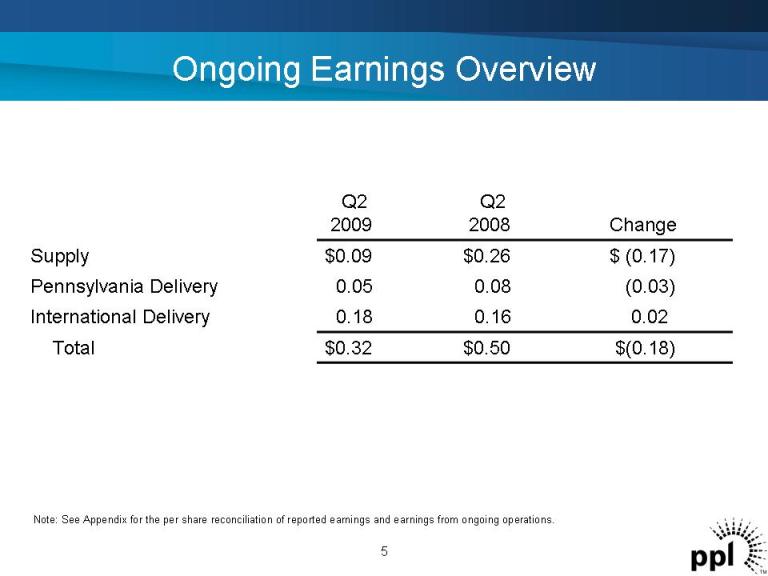
Ongoing Earnings Overview $(0.18)$0.50$0.32Total 0.020.160.18International Delivery (0.03)0.080.05Pennsylvania Delivery $ (0.17)$0.26$0.09Supply Change Q2 2008 Q2 2009 5 Note: See Appendix for the per share reconciliation of reported earnings and earnings from ongoing operations.
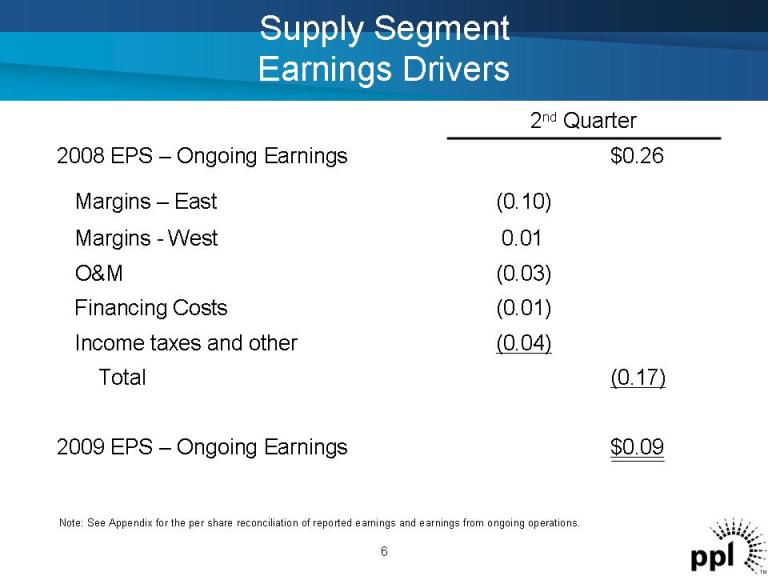
Supply Segment Earnings Drivers (0.04)Income taxes and other 0.01Margins - -West (0.03)O&M (0.01)Financing Costs $0.092009 EPS – Ongoing Earnings (0.17)Total (0.10)Margins – East $0.262008 EPS – Ongoing Earnings 2nd Quarter Note: See Appendix for the per share reconciliation of reported earnings and earnings from ongoing operations. 6
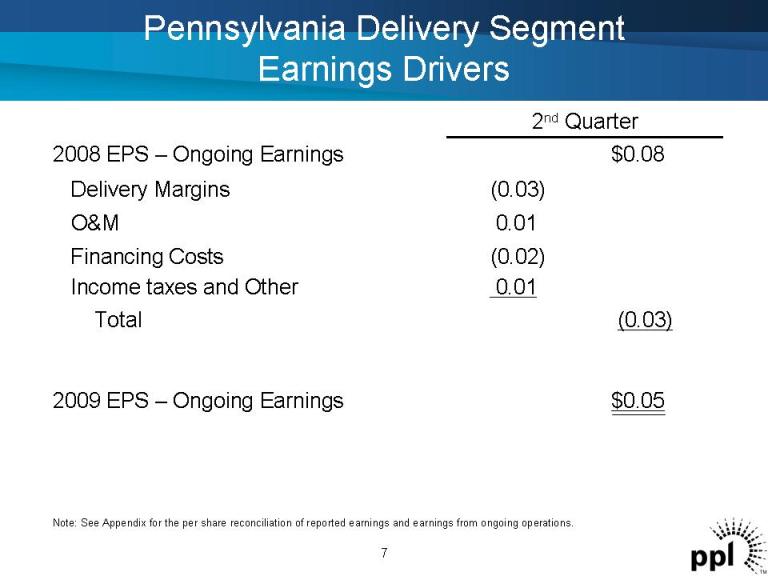
Pennsylvania Delivery Segment Earnings Drivers (0.03)Delivery Margins $0.052009 EPS – Ongoing Earnings (0.03)Total (0.02) 0.01 Financing Costs Income taxes and Other 0.01O&M $0.082008 EPS – Ongoing Earnings 2nd Quarter 7 Note: See Appendix for the per share reconciliation of reported earnings and earnings from ongoing operations.
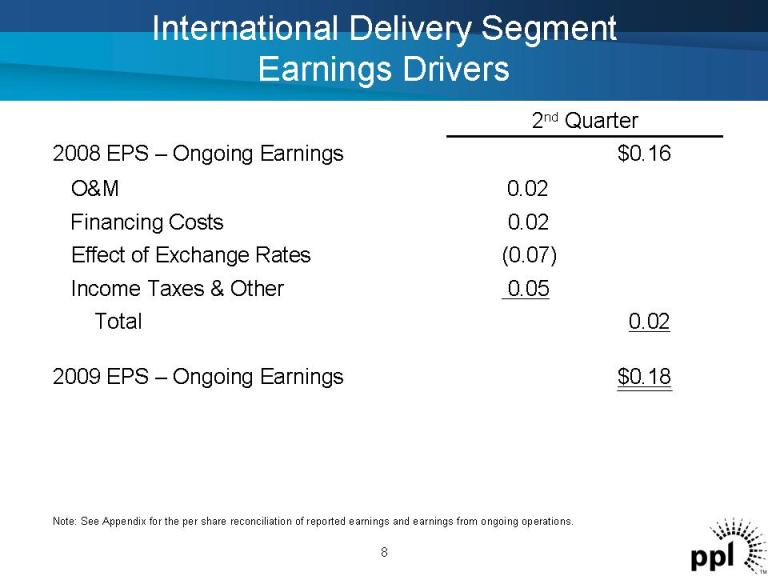
International Delivery Segment Earnings Drivers (0.07)Effect of Exchange Rates 0.02Financing Costs $0.182009 EPS – Ongoing Earnings 0.02Total 0.05Income Taxes & Other 0.02O&M $0.162008 EPS – Ongoing Earnings 2nd Quarter 8 Note: See Appendix for the per share reconciliation of reported earnings and earnings from ongoing operations.

$0.00 $1.00 $2.00 $3.00 $4.00 $5.00 2008A* 2009* 2010 Strong Expected Earnings Growth Forecast 9 * Earnings from ongoing operations – See Appendix for the per share reconciliation of reported earnings and earnings from ongoing operations. $2.02 $3.50 Per Share $1.90 $1.60 $3.10
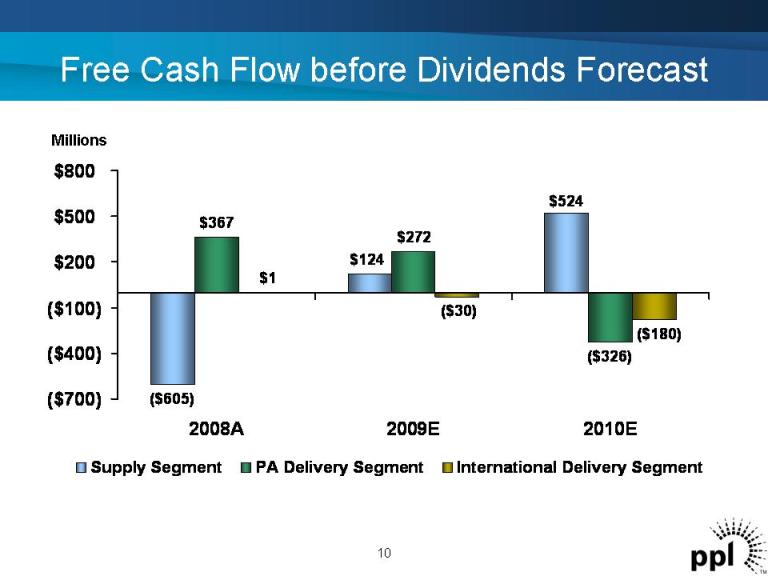
($605) $124 ($326) $524 $367 $272 ($30) ($180) $1 ($700) ($400) ($100) $200 $500 $800 2008A 2009E 2010E Supply Segment PA Delivery Segment International Delivery Segment Free Cash Flow before Dividends Forecast Millions 10
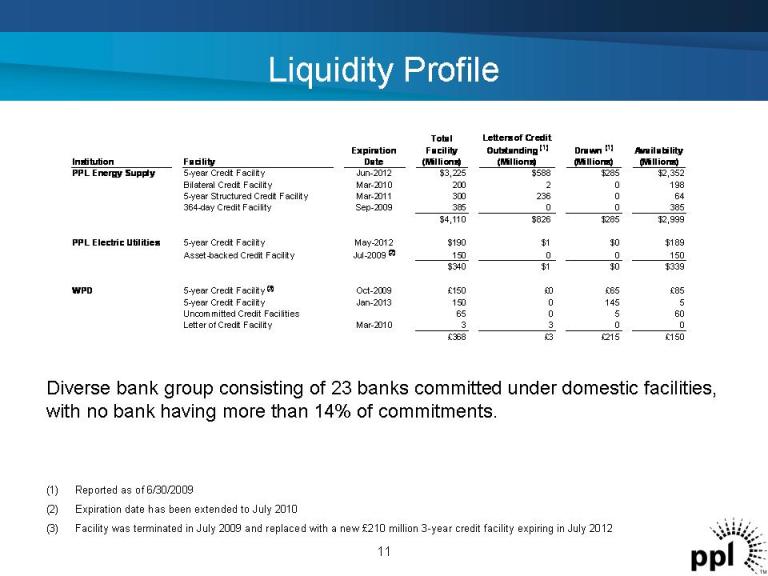
Liquidity Profile (1) Reported as of 6/30/2009 (2) Expiration date has been extended to July 2010 (3) Facility was terminated in July 2009 and replaced with a new £210 million 3-year credit facility expiring in July 2012 Diverse bank group consisting of 23 banks committed under domestic facilities, with no bank having more than 14% of commitments. 11 Institution Facility Expiration Date Total Facility (Millions) Letters of Credit Outstanding (1) (Millions) Drawn (1) (Millions) Availability (Millions) PPL Energy Supply 5-year Credit Facility Jun-2012 $3,225 $588 $285 $2,352 Bilateral Credit Facility Mar-2010 200 2 0 198 5-year Structured Credit Facility Mar-2011 300 236 0 64 364-day Credit Facility Sep-2009 385 0 0 385 $4,110 $826 $285 $2,999 PPL Electric Utilities 5-year Credit Facility May-2012 $190 $1 $0 $189 Asset-backed Credit Facility Jul-2009 (2) 150 0 0 150 $340 $1 $0 $339 WPD 5-year Credit Facility (3) Oct-2009 £150 £0 £65 £85 5-year Credit Facility Jan-2013 150 0 145 5 Uncommitted Credit Facilities 65 0 5 60 Letter of Credit Facility Mar-2010 3 3 0 0 £368 £3 £215 £150
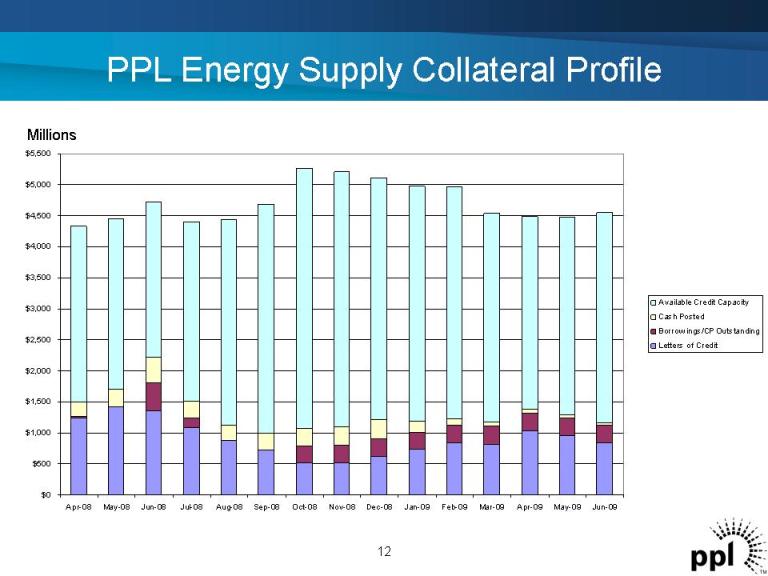
$0 $500 $1,000 $1,500 $2,000 $2,500 $3,000 $3,500 $4,000 $4,500 $5,000 $5,500 Apr-08 May-08 Jun-08 Jul-08 Aug-08 Sep-08 Oct-08 Nov-08 Dec-08 Jan-09 Feb-09 Mar-09 Apr-09 May-09 Jun-09 Available Credit Capacity Cash Posted Borrowings/CP Outstanding Letters of Credit PPL Energy Supply Collateral Profile Millions 12
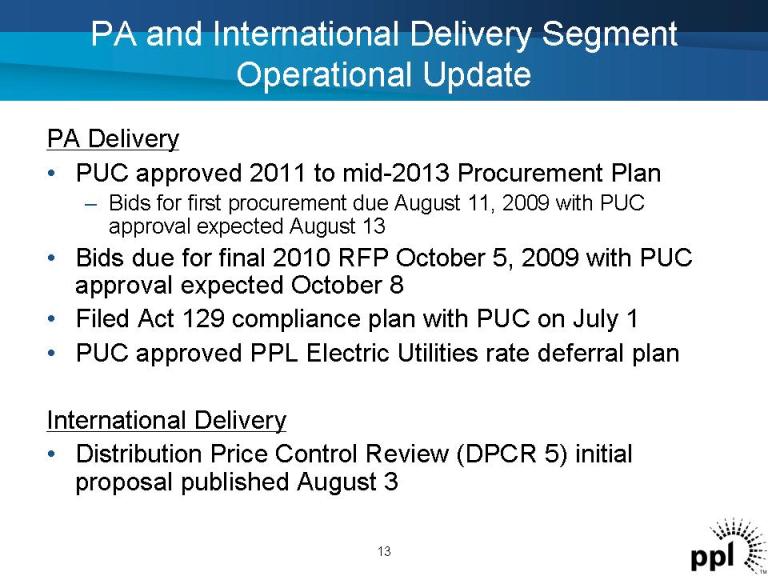
PA and International Delivery Segment Operational Update PA Delivery • PUC approved 2011 to mid-2013 Procurement Plan – Bids for first procurement due August 11, 2009 with PUC approval expected August 13 • Bids due for final 2010 RFP October 5, 2009 with PUC approval expected October 8 • Filed Act 129 compliance plan with PUC on July 1 • PUC approved PPL Electric Utilities rate deferral plan International Delivery • Distribution Price Control Review (DPCR 5) initial proposal published August 3 13
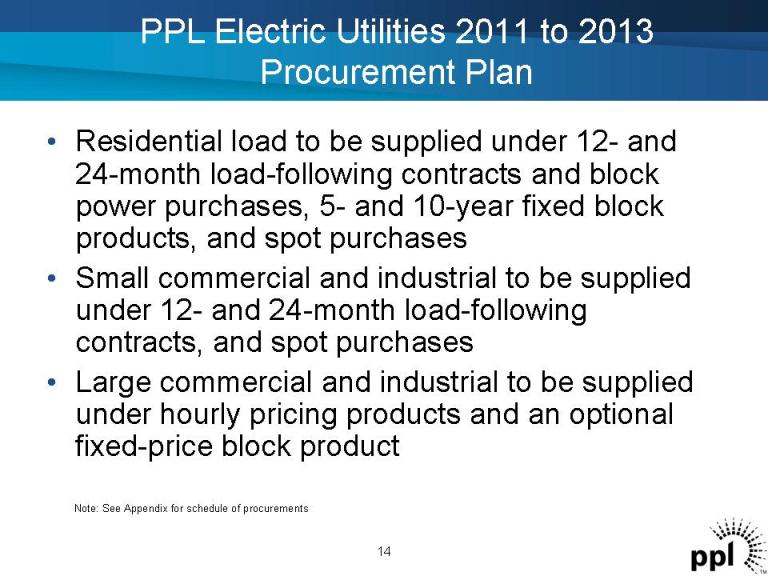
• Residential load to be supplied under 12-and 24-month load-following contracts and block power purchases, 5-and 10-year fixed block products, and spot purchases • Small commercial and industrial to be supplied under 12-and 24-month load-following contracts, and spot purchases • Large commercial and industrial to be supplied under hourly pricing products and an optional fixed-price block product PPL Electric Utilities 2011 to 2013 Procurement Plan 14 Note: See Appendix for schedule of procurements
Supply Segment Operational Update • Susquehanna Unit 2 uprate of 45 MW successfully completed • Agreements reached to sell non-core assets on Long Island and in Maine • Brunner Island Unit 3 scrubber went in service • Brunner Island Units 1 and 2 scrubber will be placed in service in the Fall 15
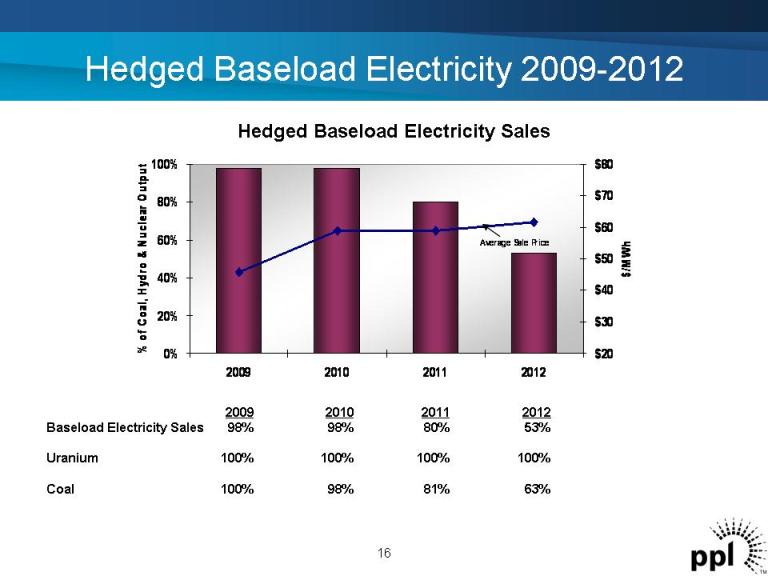
Hedged Baseload Electricity 2009-2012 Hedged Baseload Electricity Sales 0% 20% 40% 60% 80% 100% 2009 2010 2011 2012 % of C oal, H ydro & N uclear O utput$20 $30 $40 $50 $60 $70 $80 $/M W h Average Sale Price 16 2009 2010 2011 2012 Baseload Electricity Sales 98% 98% 80% 53% Uranium 100% 100% 100% 100% Coal 100% 98% 81% 63%

ppl
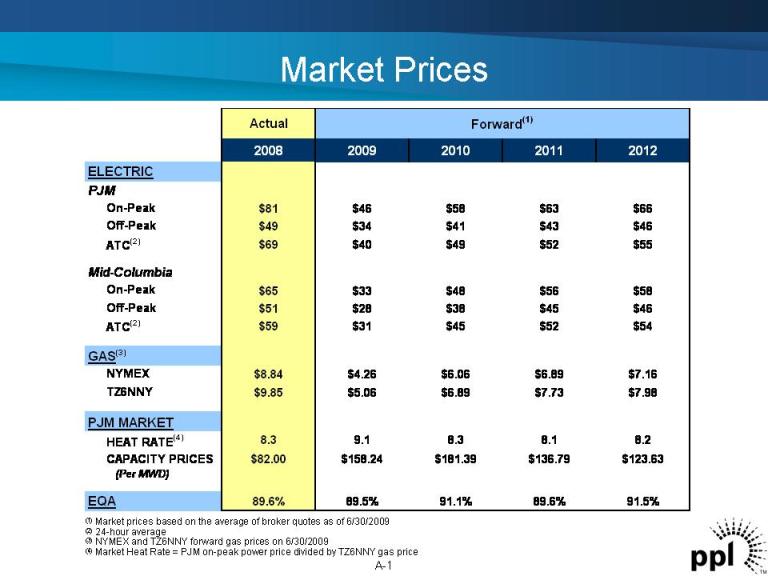
Market Prices ELECTRIC PJM On-Peak Off-Peak ATC(2) Mid-Columbia On-Peak Off-Peak ATC(2) GAS(3) NYMEX TZ6NNY PJM MARKET HEAT RATE(4) CAPACITY PRICES (Per MWD) EQA Actual 2008 2009 2010 2011 2012 $81 $46 $58 $63 $66 $49 $34 $41 $43 $46 $69 $40 $49 $52 $55 $65 $33 $48 $56 $58 $51 $28 $38 $45 $46 $59 $31 $45 $52 $54 $8.84 $4.26 $6.06 $6.89 $7.16 $9.85 $5.06 $6.89 $7.73 $7.98 8.3 9.1 8.3 8.1 8.2 $82.00 $158.24 $181.39 $136.79 $123.63 89.6% 89.5% 91.1% 89.6% 91.5% Forward(1) (1) Market prices based on the average of broker quotes as of 6/30/2009 (2) 24-hour average (3) NYMEX and TZ6NNY forward gas prices on 6/30/2009 (4) Market Heat Rate = PJM on-peak power price divided by TZ6NNY gas price A-1

Current Hedge Positions -Electricity and Fuel Note: As of 6/30/2009 A-2 2009 2010 2011 2012 Electricity Sales East 94% 91% 72% 45% West 94% 84% 81% 72% Total 94% 90% 73% 49% Uranium 100% 100% 100% 100% Coal East 100% 97% 79% 57% West 100% 100% 86% 77% Total 100% 98% 81% 63% Unhedged Coal – million tons Brunner & Montour 0.0 0.0 1.4 3.0 Keystone & Conemaugh 0.0 0.3 0.5 0.9
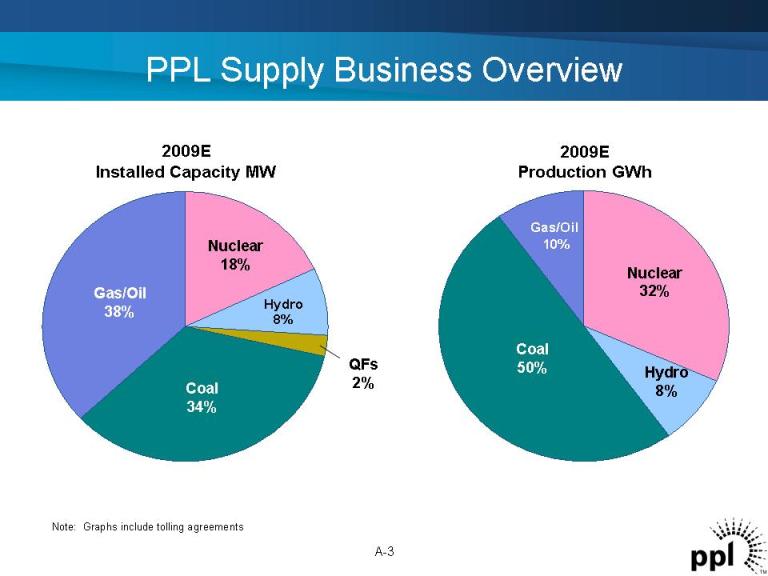
PPL Supply Business Overview 2009E Production GWh A-3 Gas/Oil 38% Coal 34% Nuclear 18% Hydro8% QFs 2% 2009E Installed Capacity MW Gas/Oil 10% Coal 50% Nuclear 32% Hydro 8% Note: Graphs include tolling agreements
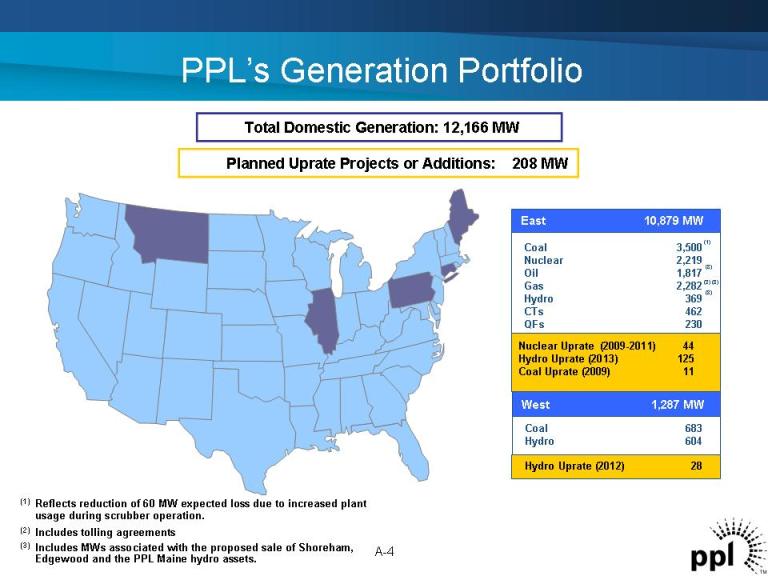
PPL’s Generation Portfolio Total Domestic Generation: 12,166 MW Planned Uprate Projects or Additions: 208 MW (1) Reflects reduction of 60 MW expected loss due to increased plant usage during scrubber operation. (2) Includes tolling agreements (3) Includes MWs associated with the proposed sale of Shoreham, Edgewood and the PPL Maine hydro assets. A-4 Coal 3,500 Nuclear 2,219 Oil 1,817 Gas 2,282 Hydro 369 CTs 462 QFs 230 Coal 683 Hydro 604 West 1,287 MW Hydro Uprate (2012) 28 Nuclear Uprate (2009-2011) 44 Hydro Uprate (2013) 125 Coal Uprate (2009) 11 (1) East 10,879 MW (2) (3) (3) (3)
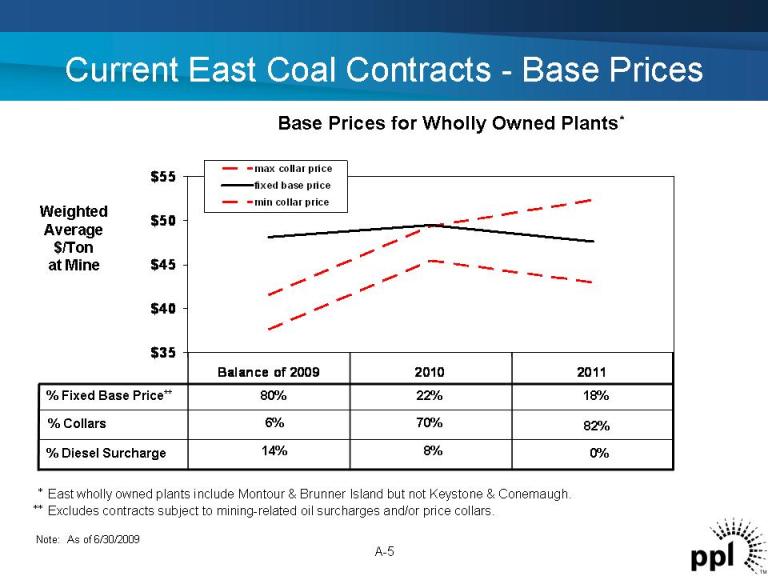
Current East Coal Contracts -Base Prices A-5 Base Prices for Wholly Owned Plants* *East wholly owned plants include Montour & Brunner Island but not Keystone & Conemaugh. **Excludes contracts subject to mining-related oil surcharges and/or price collars. Note: As of 6/30/2009 $35 $40 $45 $50 $55 Balance of 2009 2010 2011 max collar price fixed base price min collar price Weighted Average $/Ton at Mine 8%14%% Diesel Surcharge 82%70%6%% Collars 22%80%% Fixed Base Price**18% 0%
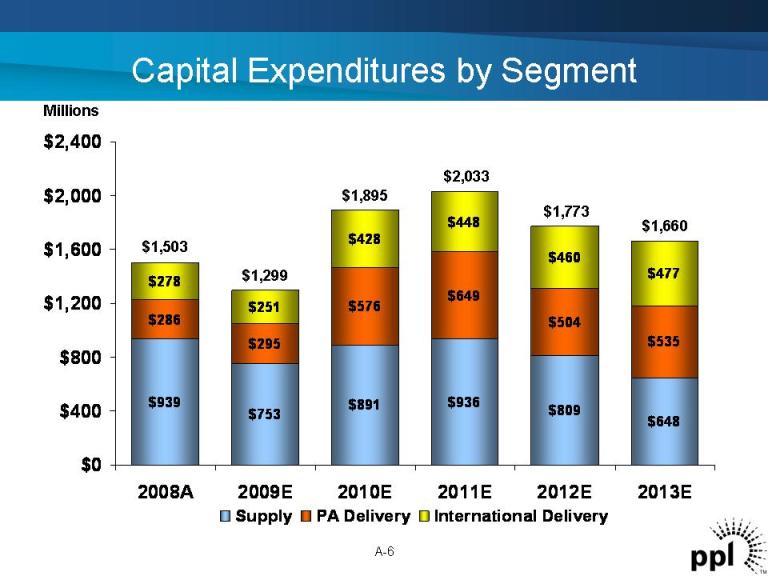
Millions $939 $753 $891 $936 $809 $648 $286 $295 $576 $649 $504 $535 $278 $251 $428 $448 $460 $477 $0 $400 $800 $1,200 $1,600 $2,000 $2,400 2008A 2009E 2010E 2011E 2012E 2013E Supply PA Delivery International Delivery $1,503 $2,033 $1,895 $1,299 Capital Expenditures by Segment $1,773 $1,660 A-6
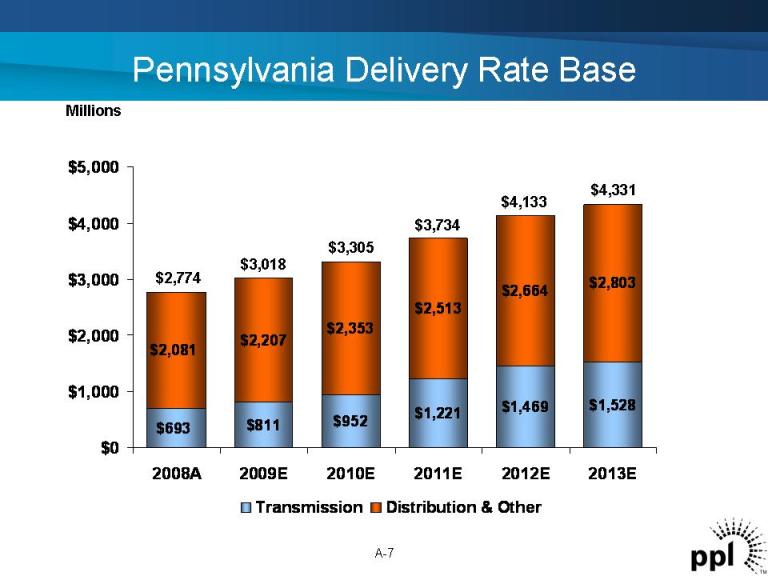
Millions $693 $811 $952 $1,221 $1,469 $1,528 $2,081 $2,207 $2,353 $2,513 $2,664 $2,803 $0 $1,000 $2,000 $3,000 $4,000 $5,000 2008A 2009E 2010E 2011E 2012E 2013E Transmission Distribution & Other Pennsylvania Delivery Rate Base $3,018 $3,305 $3,734 $4,133 $4,331 $2,774 A-7

PPL Electric Utilities 2011 to 2013 Procurement Plan Schedule • Due dates for bids: August 11, 2009 July 19, 2011 October 20, 2009 October 18, 2011 January 19, 2010 January 9, 2012 April 20, 2010 April 3, 2012 July 20, 2010 July 17, 2012 October 19, 2010 October 16, 2012 April 18, 2011 January 22, 2013 A-8
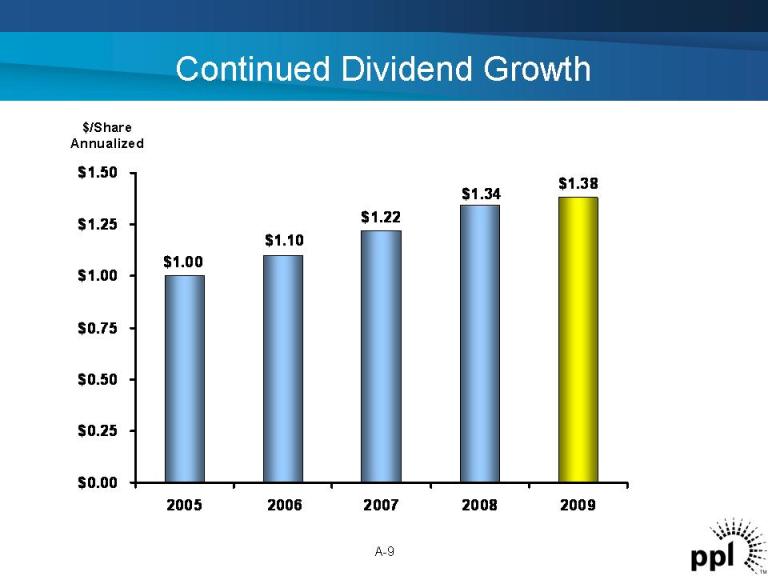
$1.00 $1.10 $1.22 $1.34 $1.38 $0.00 $0.25 $0.50 $0.75 $1.00 $1.25 $1.50 2005 2006 2007 2008 2009 $/Share Annualized Continued Dividend Growth A-9
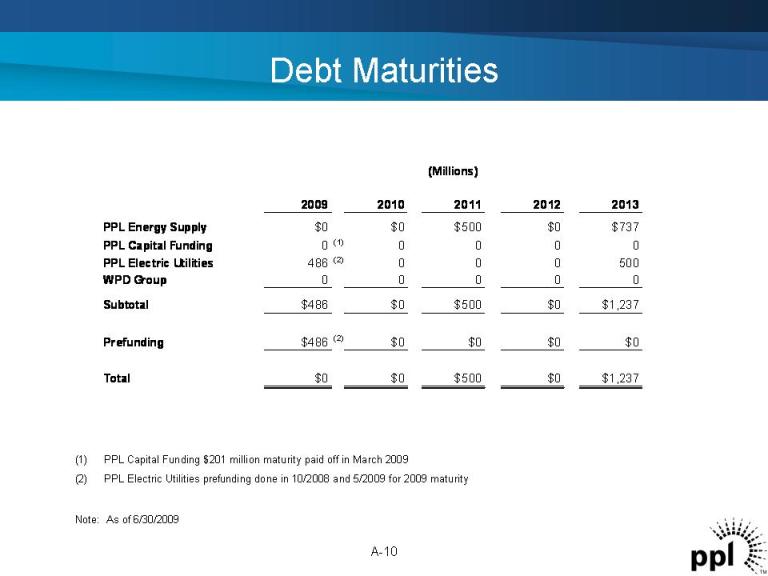
Debt Maturities (1) PPL Capital Funding $201 million maturity paid off in March 2009 (2) PPL Electric Utilities prefunding done in 10/2008 and 5/2009 for 2009 maturity Note: As of 6/30/2009 A-10 2009 2010 2011 2012 2013 PPL Energy Supply $0 $0 $500 $0 $737 PPL Capital Funding 0 (1) 0 0 0 0 PPL Electric Utilities 486 (2) 0 0 0 500 WPD Group 0 0 0 0 0 Subtotal $486 $0 $500 $0 $1,237 Prefunding $486 (2) $0 $0 $0 $0 Total $0 $0 $500 $0 $1,237 (Millions)
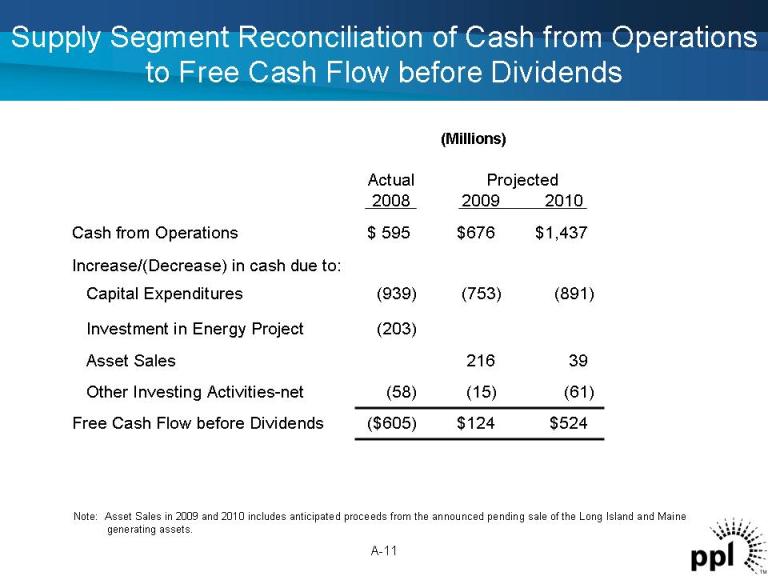
Supply Segment Reconciliation of Cash from Operations to Free Cash Flow before Dividends (Millions) A-11 39216Asset Sales (203)Investment in Energy Project $524$124($605)Free Cash Flow before Dividends (61)(15)(58)Other Investing Activities-net (891)(753)(939)Capital Expenditures Increase/(Decrease) in cash due to: $1,437$676$ 595Cash from Operations 201020092008 Actual Projected Note: Asset Sales in 2009 and 2010 includes anticipated proceeds from the announced pending sale of the Long Island and Maine generating assets.
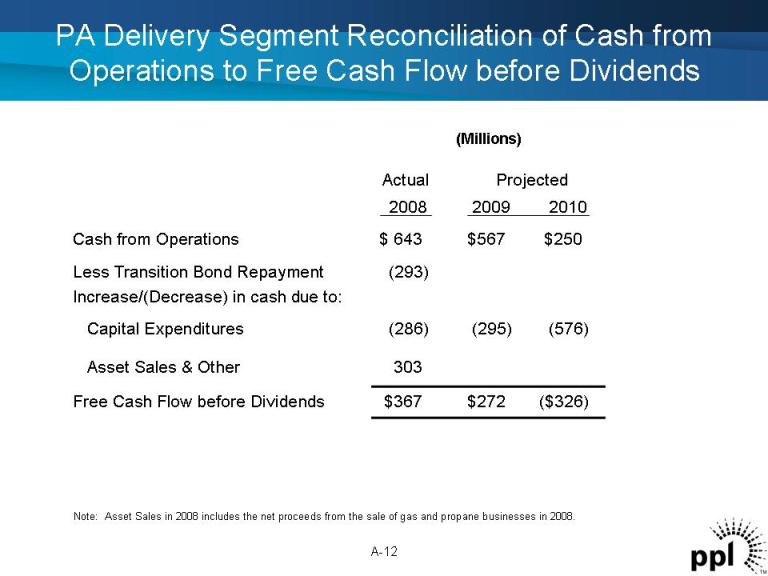
PA Delivery Segment Reconciliation of Cash from Operations to Free Cash Flow before Dividends (Millions) A-12 303Asset Sales & Other ($326)$272$367Free Cash Flow before Dividends (576)(295)(286)Capital Expenditures (293)Less Transition Bond Repayment Increase/(Decrease) in cash due to: $250$567$ 643Cash from Operations 201020092008 Note: Asset Sales in 2008 includes the net proceeds from the sale of gas and propane businesses in 2008. Actual Projected
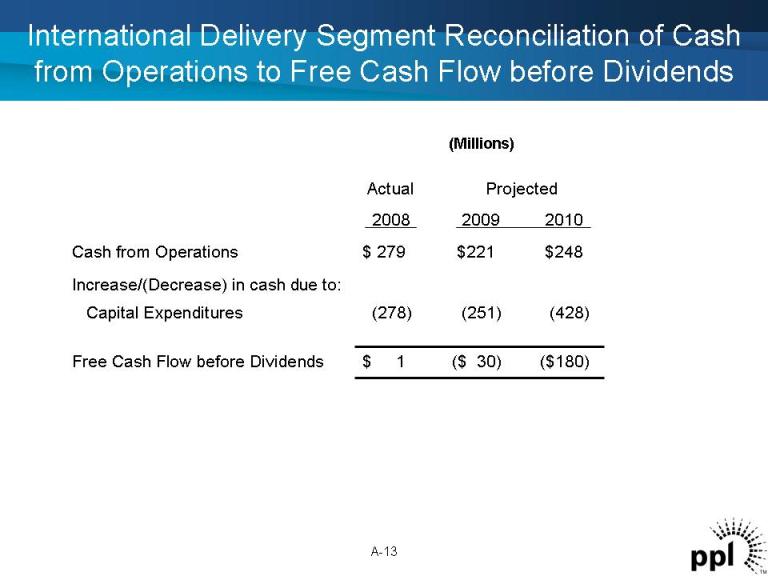
International Delivery Segment Reconciliation of Cash from Operations to Free Cash Flow before Dividends (Millions) A-13 ($180)($ 30)$ 1Free Cash Flow before Dividends (428)(251)(278)Capital Expenditures Increase/(Decrease) in cash due to: $248$221$ 279Cash from Operations 201020092008 Actual Projected
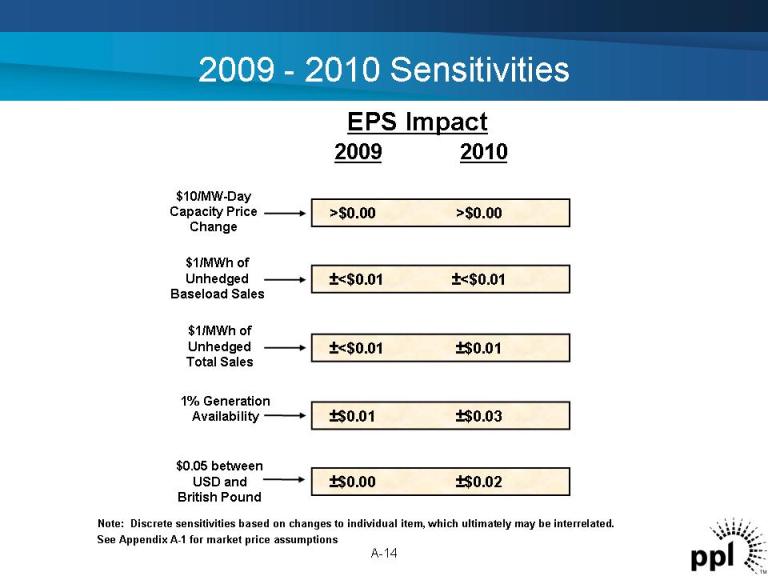
2009 - -2010 Sensitivities EPS Impact See Appendix A-1 for market price assumptions A-14 Note: Discrete sensitivities based on changes to individual item, which ultimately may be interrelated. 2009 2010 $10/MW-Day Capacity Price Change >$0.00 >$0.00 $1/MWh of Unhedged Baseload Sales ±<$0.01 ±<$0.01 $1/MWh of Unhedged Total Sales ±<$0.01 ±$0.01 1% Generation Availability ±$0.01 ±$0.03 $0.05 between USD and British Pound ±$0.00 ±$0.02
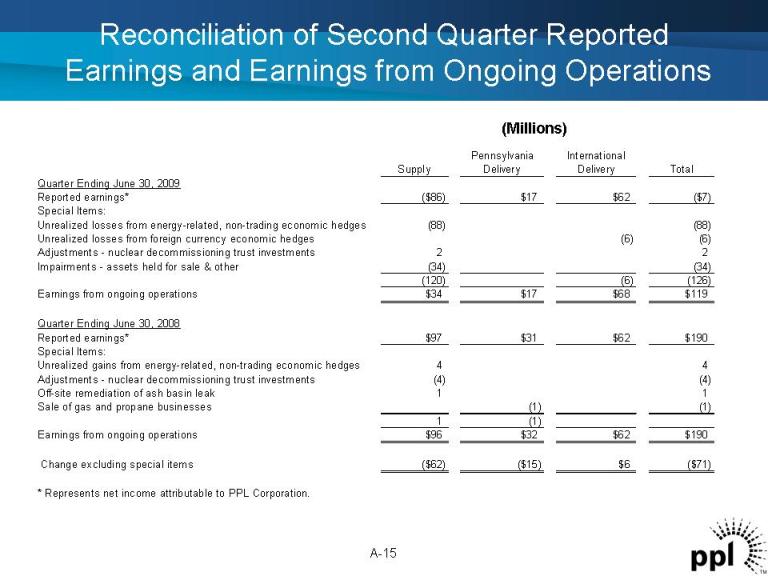
Reconciliation of Second Quarter Reported Earnings and Earnings from Ongoing Operations A-15 (Millions) Pennsylvania International Supply Delivery Delivery Total Quarter Ending June 30, 2009 Reported earnings* ($86) $17 $62 ($7) Special Items: Unrealized losses from energy-related, non-trading economic hedges (88) (88) Unrealized losses from foreign currency economic hedges (6) (6) Adjustments - nuclear decommissioning trust investments 2 2 Impairments - assets held for sale & other (34) (34) (120) (6) (126) Earnings from ongoing operations $34 $17 $68 $119 Quarter Ending June 30, 2008 Reported earnings* $97 $31 $62 $190 Special Items: Unrealized gains from energy-related, non-trading economic hedges 4 4 Adjustments - nuclear decommissioning trust investments (4) (4) Off-site remediation of ash basin leak 1 1 Sale of gas and propane businesses (1) (1) 1 (1) Earnings from ongoing operations $96 $32 $62 $190 Change excluding special items ($62) ($15) $6 ($71) * Represents net income attributable to PPL Corporation.
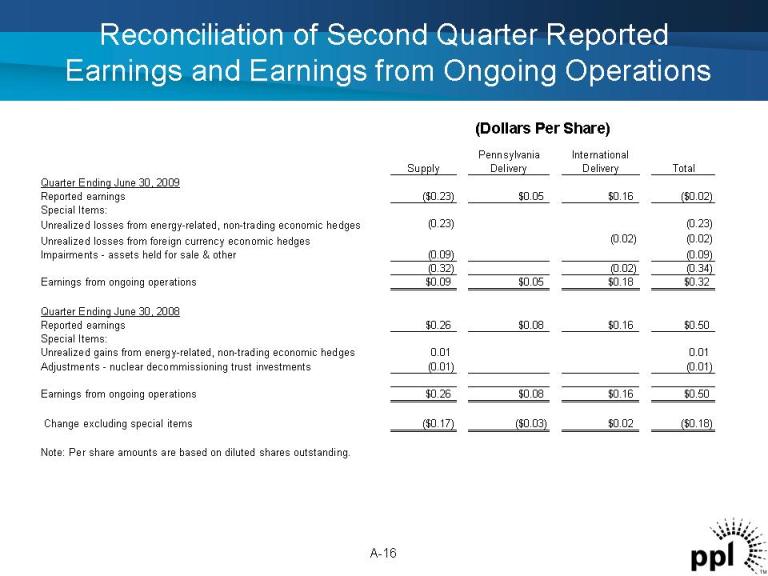
Reconciliation of Second Quarter Reported Earnings and Earnings from Ongoing Operations A-16 Pennsylvania International Supply Delivery Delivery Total Quarter Ending June 30, 2009 Reported earnings ($0.23) $0.05 $0.16 ($0.02) Special Items: Unrealized losses from energy-related, non-trading economic hedges (0.23) (0.23) Unrealized losses from foreign currency economic hedges (0.02) (0.02) Impairments - assets held for sale & other (0.09) (0.09) (0.32) (0.02) (0.34) Earnings from ongoing operations $0.09 $0.05 $0.18 $0.32 Quarter Ending June 30, 2008 Reported earnings $0.26 $0.08 $0.16 $0.50 Special Items: Unrealized gains from energy-related, non-trading economic hedges 0.01 0.01 Adjustments - nuclear decommissioning trust investments (0.01) (0.01) Earnings from ongoing operations $0.26 $0.08 $0.16 $0.50 Change excluding special items ($0.17) ($0.03) $0.02 ($0.18) Note: Per share amounts are based on diluted shares outstanding. (Dollars Per Share)
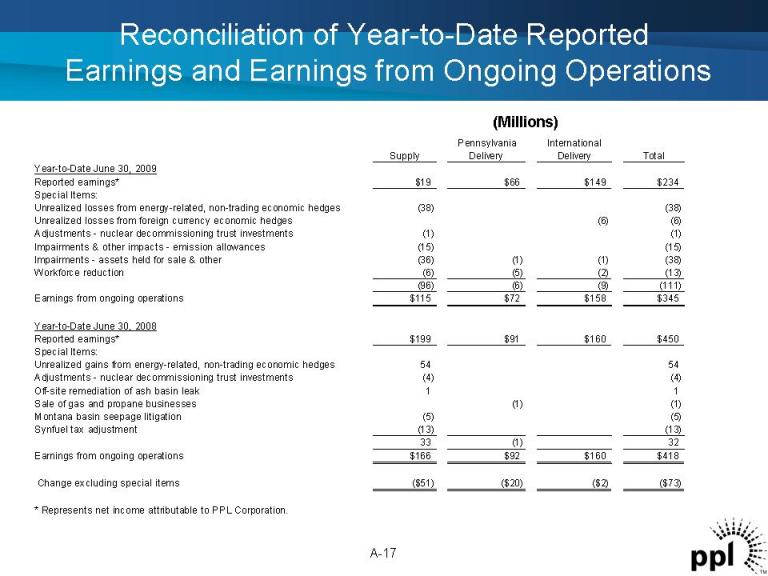
Reconciliation of Year-to-Date Reported Earnings and Earnings from Ongoing Operations A-17 (Millions) Pennsylvania International Supply Delivery Delivery Total Year-to-Date June 30, 2009 Reported earnings* $19 $66 $149 $234 Special Items: Unrealized losses from energy-related, non-trading economic hedges (38) (38) Unrealized losses from foreign currency economic hedges (6) (6) Adjustments - nuclear decommissioning trust investments (1) (1) Impairments & other impacts - emission allowances (15) (15) Impairments -assets held for sale & other (36) (1) (1) (38) Workforce reduction (6) (5) (2) (13) (96) (6) (9) (111) Earnings from ongoing operations $115 $72 $158 $345 Year-to-Date June 30, 2008 Reported earnings* $199 $91 $160 $450 Special Items: Unrealized gains from energy-related, non-trading economic hedges 54 54 Adjustments - nuclear decommissioning trust investments (4) (4) Off-site remediation of ash basin leak 1 1 Sale of gas and propane businesses (1) (1) Montana basin seepage litigation (5) (5) Synfuel tax adjustment (13) (13) 33 (1) 32 Earnings from ongoing operations $166 $92 $160 $418 Change excluding special items ($51) ($20) ($2) ($73) * Represents net income attributable to PPL Corporation.
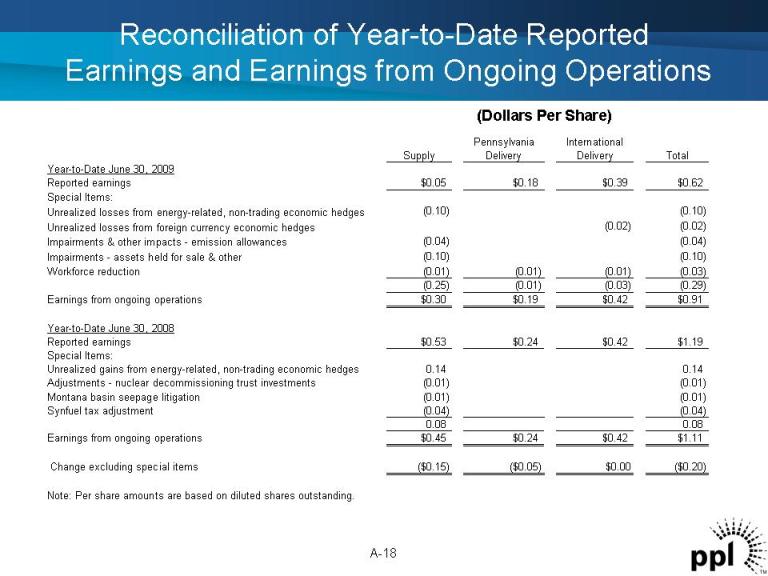
Reconciliation of Year-to-Date Reported Earnings and Earnings from Ongoing Operations A-18 Pennsylvania International Supply Delivery Delivery Total Year-to-Date June 30, 2009 Reported earnings $0.05 $0.18 $0.39 $0.62 Special Items: Unrealized losses from energy-related, non-trading economic hedges (0.10) (0.10) Unrealized losses from foreign currency economic hedges (0.02) (0.02) Impairments & other impacts - emission allowances (0.04) (0.04) Impairments - assets held for sale & other (0.10) (0.10) Workforce reduction (0.01) (0.01) (0.01) (0.03) (0.25) (0.01) (0.03) (0.29) Earnings from ongoing operations $0.30 $0.19 $0.42 $0.91 Year-to-Date June 30, 2008 Reported earnings $0.53 $0.24 $0.42 $1.19 Special Items: Unrealized gains from energy-related, non-trading economic hedges 0.14 0.14 Adjustments - nuclear decommissioning trust investments (0.01) (0.01) Montana basin seepage litigation (0.01) (0.01) Synfuel tax adjustment (0.04) (0.04) 0.08 0.08 Earnings from ongoing operations $0.45 $0.24 $0.42 $1.11 Change excluding special items ($0.15) ($0.05) $0.00 ($0.20) Note: Per share amounts are based on diluted shares outstanding. (Dollars Per Share)
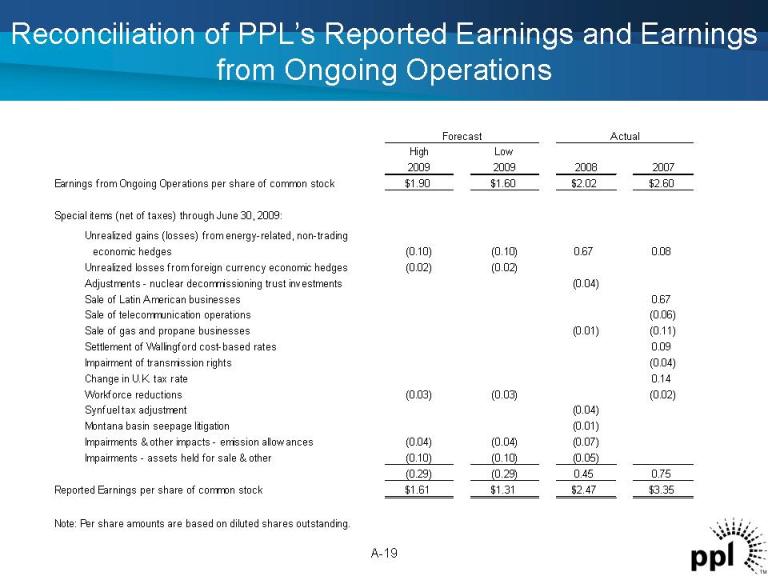
Reconciliation of PPL’s Reported Earnings and Earnings from Ongoing Operations High Low 2009 2009 2008 2007 Earnings from Ongoing Operations per share of common stock $1.90 $1.60 $2.02 $2.60 Special items (net of taxes) through June 30, 2009: economic hedges (0.10) (0.10) 0.67 0.08 Unrealized losses from foreign currency economic hedges (0.02) (0.02) Adjustments -nuclear decommissioning trust investments (0.04) Sale of Latin American businesses 0.67 Sale of telecommunication operations (0.06) Sale of gas and propane businesses (0.01) (0.11) Settlement of Wallingford cost-based rates 0.09 Impairment of transmission rights (0.04) Change in U.K. tax rate 0.14 Workforce reductions (0.03) (0.03) (0.02) Synfuel tax adjustment (0.04) Montana basin seepage litigation (0.01) Impairments & other impacts - emission allow ances (0.04) (0.04) (0.07) Impairments - assets held for sale & other (0.10) (0.10) (0.05) (0.29) (0.29) 0.45 0.75 Reported Earnings per share of common stock $1.61 $1.31 $2.47 $3.35 Note: Per share amounts are based on diluted shares outstanding. Unrealized gains (losses) from energy-related, non-trading Forecast Actual A-19
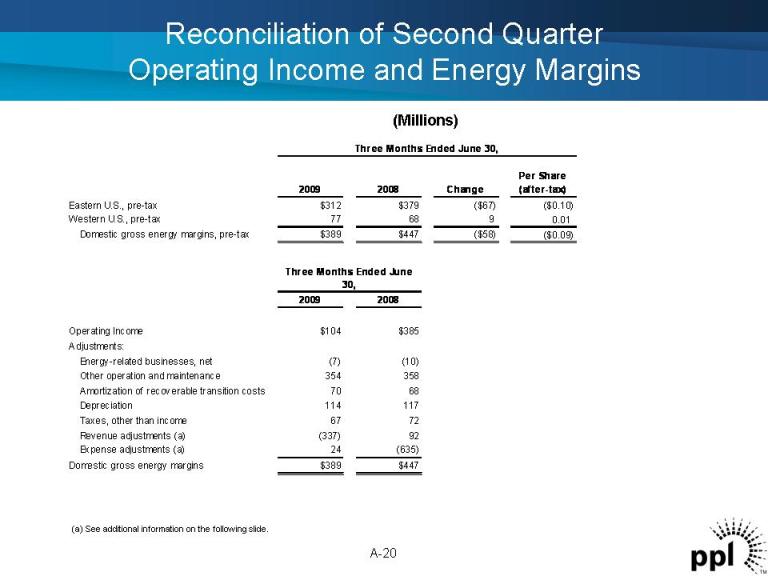
Reconciliation of Second Quarter Operating Income and Energy Margins A-20 2009 2008 Change Per Share (after-tax) Eastern U.S., pre-tax $312 $379 ($67) ($0.10) Western U.S., pre-tax 77 68 9 0.01 Domestic gross energy margins, pre-tax $389 $447 ($58) ($0.09) 2009 2008 Operating Income $104 $385 Adjustments: Energy-related businesses, net (7) (10) Other operation and maintenance 354 358 Amortization of recoverable transition costs 70 68 Depreciation 114 117 Taxes, other than income 67 72 Revenue adjustments (a) (337) 92 Expense adjustments (a) 24 (635) Domestic gross energy margins $389 $447 Three Months Ended June 30, Three Months Ended June 30, (Millions) (a) See additional information on the following slide.
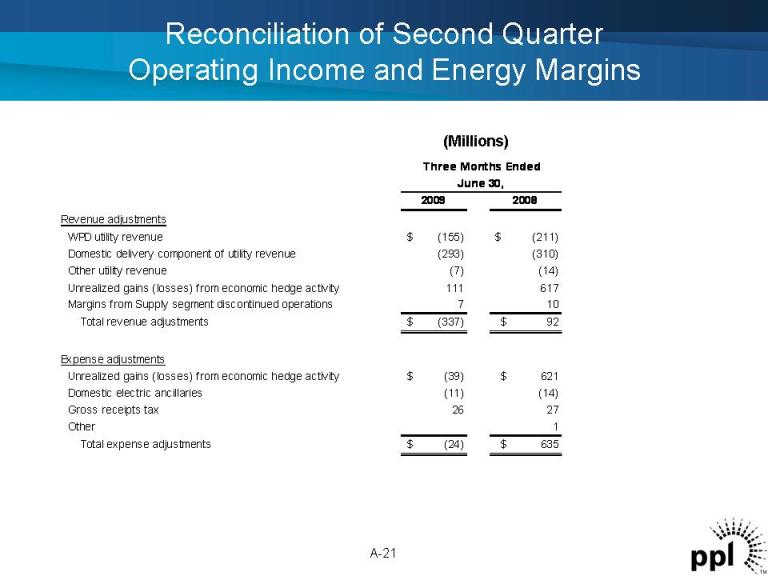
A-21 2009 2008 Revenue adjustments WPD utility revenue $ (155) $ (211) Domestic delivery component of utility revenue (293) (310) Other utility revenue (7) (14) Unrealized gains (losses) from economic hedge activity 111 617 Margins from Supply segment discontinued operations 7 10 Total revenue adjustments $ (337) $ 92 Expense adjustments Unrealized gains (losses) from economic hedge activity $ (39) $ 621 Domestic electric ancillaries (11) (14) Gross receipts tax 26 27 Other 1 Total expense adjustments $ (24) $ 635 June 30, Three Months Ended (Millions) Reconciliation of Second Quarter Operating Income and Energy Margins
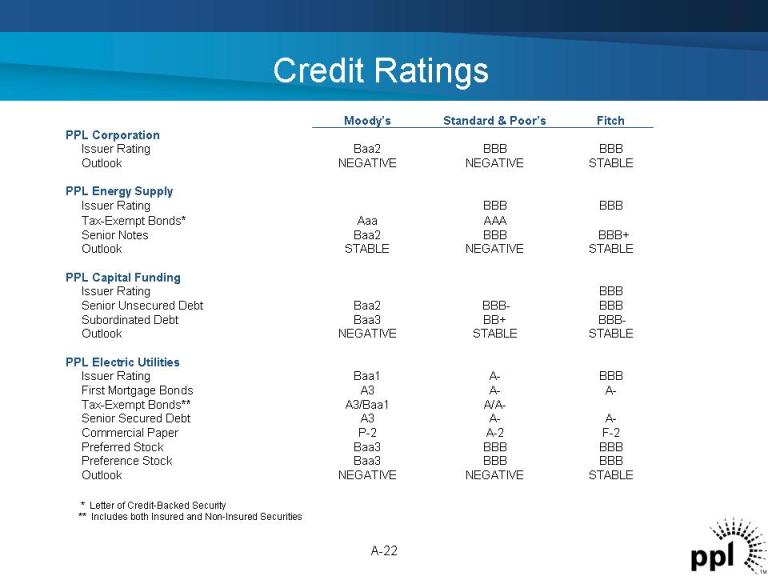
Credit Ratings A-22 BBB Issuer Rating AAAAaa Tax-Exempt Bonds* STABLE NEGATIVE NEGATIVE Outlook A-A-A3Senior Secured Debt F-2A-2P-2Commercial Paper BBBBBBBaa3Preferred Stock BBBA-Baa1Issuer Rating A-A-A3First Mortgage Bonds A/A-A3/Baa1Tax-Exempt Bonds** BBBBBBBaa3Preference Stock PPL Electric Utilities BBBBBB-Baa2Senior Unsecured Debt BBB-BB+ Baa3Subordinated Debt STABLE STABLE NEGATIVE Outlook PPL Capital Funding BBBBBB Issuer Rating BBB+ BBBBaa2Senior Notes STABLE NEGATIVE STABLE Outlook PPL Energy Supply STABLE NEGATIVE NEGATIVE Outlook BBBBBBBaa2Issuer Rating PPL Corporation Fitch Standard & Poor’s Moody’s * Letter of Credit-Backed Security ** Includes both Insured and Non-Insured Securities
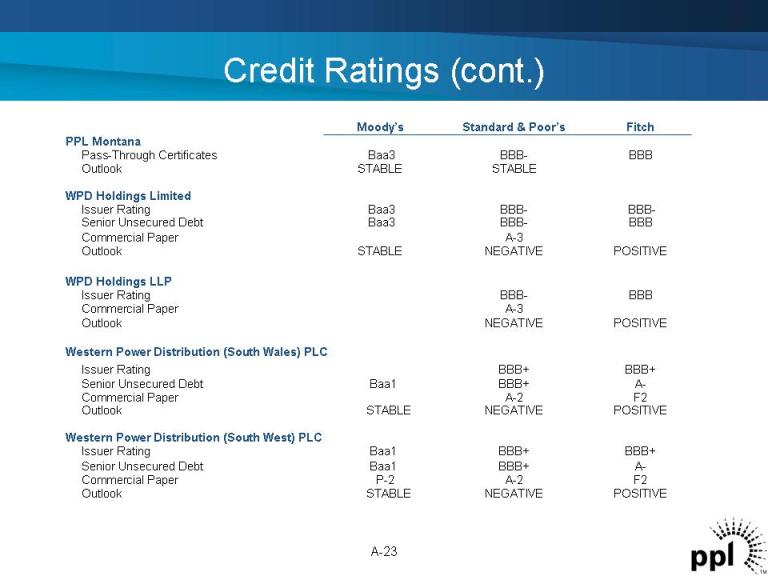
Credit Ratings (cont.) A-23 A-3Commercial Paper A-BBB+ Baa1Senior Unsecured Debt F2A-2P-2Commercial Paper POSITIVE NEGATIVE STABLE Outlook BBB+ BBB+ Baa1Issuer Rating A-BBB+ Baa1Senior Unsecured Debt F2A-2Commercial Paper POSITIVE NEGATIVE STABLE Outlook Western Power Distribution (South West) PLC BBB+ BBB+ Issuer Rating Western Power Distribution (South Wales) PLC POSITIVE NEGATIVE STABLE Outlook POSITIVE NEGATIVE Outlook BBBBBB-Issuer Rating WPD Holdings LLP BBB-BBB-Baa3Issuer Rating BBBBBB-Baa3Senior Unsecured Debt A-3Commercial Paper WPD Holdings Limited BBBBBB-Baa3Pass-Through Certificates STABLE STABLE Outlook PPL Montana Fitch Standard & Poor’s Moody’s
Forward-Looking Information Statement A-24 Statements contained in this presentation, including statements with respect to future earnings, energy prices, margins and sales, growth, revenues, expenses, credit profile, cash flow, liquidity, financing, asset disposition, marketing performance, hedging, regulation, corporate strategy, and generating capacity and performance, are “forward-looking statements” within the meaning of the federal securities laws. Although PPL Corporation believes that the expectations and assumptions reflected in these forward-looking statements are reasonable, these statements involve a number of risks and uncertainties, and actual results may differ materially from the results discussed in the statements. The following are among the important factors that could cause actual results to differ materially from the forward-looking statements: market demand and prices for energy, capacity and fuel; weather conditions affecting customer energy usage and operating costs; competition in power markets; the effect of any business or industry restructuring; the profitability and liquidity of PPL Corporation and its subsidiaries; new accounting requirements or new interpretations or applications of existing requirements; operating performance of plants and other facilities; environmental conditions and requirements and the related costs of compliance, including environmental capital expenditures and emission allowance and other expenses; system conditions and operating costs; development of new projects, markets and technologies; performance of new ventures; asset acquisitions and dispositions; any impact of hurricanes or other severe weather on our business, including any impact on fuel prices; receipt of necessary government permits, approvals and rate relief; capital market conditions and decisions regarding capital structure; the impact of state, federal or foreign investigations applicable to PPL Corporation and its subsidiaries; the outcome of litigation against PPL Corporation and its subsidiaries; stock price performance; the market prices of equity securities and the impact on pension income and resultant cash funding requirements for defined benefit pension plans; the securities and credit ratings of PPL Corporation and its subsidiaries; political, regulatory or economic conditions in states, regions or countries where PPL Corporation or its subsidiaries conduct business, including any potential effects of threatened or actual terrorism or war or other hostilities; foreign exchange rates; new state, federal or foreign legislation, including new tax legislation; and the commitments and liabilities of PPL Corporation and its subsidiaries. Any such forward-looking statements should be considered in light of such important factors and in conjunction with PPL Corporation’s Form 10-K and other reports.
Definitions of Non-GAAP Financial Measures A-25 “Earnings from ongoing operations” excludes the impact of special items. Special items include charges or credits that are unusual or nonrecurring. Special items also include unrealized gains or losses from energy-related and foreign currency-related, non-trading economic hedges and impairments of securities in PPL’s nuclear decommissioning trust funds. The energy-related, non-trading economic hedges are used to hedge a portion of the economic value of PPL’s generation assets and PPL’s load-following and retail activities. This economic value is subject to changes in fair value due to market price volatility of the input and output commodities (e.g., fuel and power). The foreign currency-related, non-trading economic hedges are used to hedge a portion of the net income of the international delivery business segment. This economic value in U.S. dollars is subject to changes in the British Pound Sterling to U.S. dollar exchange rate. The unrealized gains and losses on these non-trading economic hedges in PPL’s supply and international delivery business segments are economically neutral to the company because they will reverse as the hedging contracts settle in the future. Earnings from ongoing operations should not be considered as an alternative to reported earnings, or net income attributable to PPL, which is an indicator of operating performance determined in accordance with generally accepted accounting principles (GAAP). PPL believes that earnings from ongoing operations, although a non-GAAP measure, is also useful and meaningful to investors because it provides them with PPL’s underlying earnings performance as another criterion in making their investment decisions. PPL’s management also uses earnings from ongoing operations in measuring certain corporate performance goals. Other companies may use different measures to present financial performance. “Free cash flow before dividends” is derived by deducting capital expenditures and other investing activities-net, as well as the repayment of transition bonds, from cash flow from operations. Free cash flow before dividends should not be considered as an alternative to cash flow from operations, which is determined in accordance with GAAP. PPL believes that free cash flow before dividends, although a non-GAAP measure, is an important measure to both management and investors since it is an indicator of the company’s ability to sustain operations and growth without additional outside financing beyond the requirement to fund maturing debt obligations. Other companies may calculate free cash flow before dividends in a different manner.