Fourth Quarter Earnings Call
February 5, 2010
Exhibit 99.2
2
Cautionary Statements and Factors That
May Affect Future Results
Any statements made in this presentation
about future operating results or other future
events are forward-looking statements under
the Safe Harbor Provisions of the Private
Securities Litigation Reform Act of 1995.
Actual results may differ materially from such
forward-looking statements. A discussion of
factors that could cause actual results or
events to vary is contained in the Appendix to
this presentation and in the Company’s SEC
filings.
J. H. Miller
P. A. Farr
W. H. Spence
3
Agenda
• Fourth Quarter 2009 Earnings
and 2010 Earnings Forecast and
Outlook
• Segment Results and Financial
Overview
• Operational Review
• Q&A
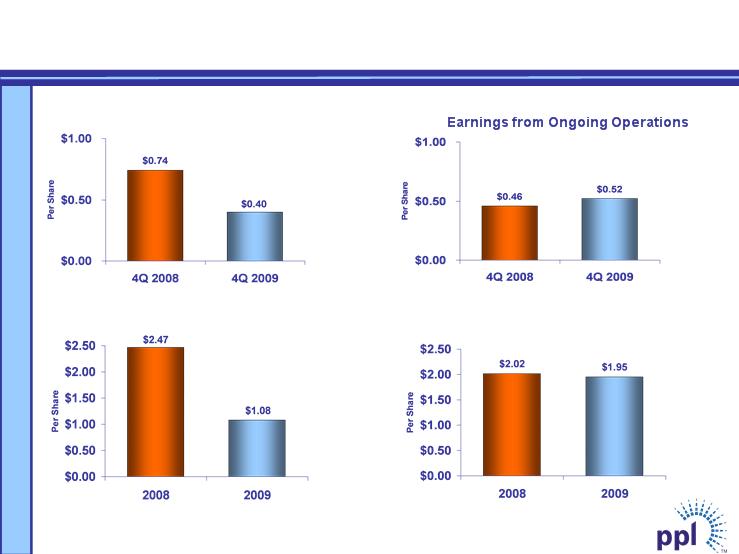
Earnings Results
Fourth Quarter
Fourth Quarter
Reported Earnings
Note: See Appendix for the reconciliation of earnings from ongoing operations to reported earnings. |
Year-to-Date
Reported Earnings
Year-to-Date
Earnings from Ongoing Operations
4
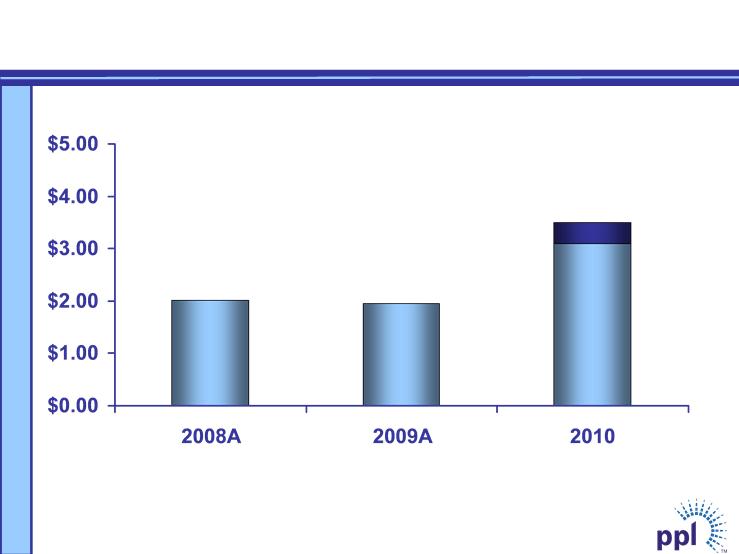
Forecast
5
$2.02
$3.50
Per Share
$1.95
$3.10
Note: See Appendix for the reconciliation of earnings from ongoing operations to reported earnings.
Strong Expected Earnings Growth
$ 0.06
$0.46
$0.52
Total
0.03
0.15
0.18
International Delivery
(0.01)
0.10
0.09
Pennsylvania Delivery
$ 0.04
$0.21
$0.25
Supply
Change
Q4
2008
Q4
2009
6
Note: See Appendix for the reconciliation of earnings from ongoing operations to reported earnings. |
$ (0.07)
$2.02
$1.95
Total
(0.05)
0.77
0.72
International Delivery
(0.09)
0.44
0.35
Pennsylvania Delivery
$ 0.07
$0.81
$0.88
Supply
Change
2008
2009
Ongoing Earnings Overview
Note: See Appendix for the reconciliation of earnings from ongoing operations to reported earnings. |
7
| 2009 |
2008 EPS - Ongoing Earnings | | $0.81 |
Margins - East | 0.19 | |
Margins - West | 0.07 | |
O&M | (0.11) | |
Depreciation | (0.05) | |
Income Taxes & Other | (0.03) | |
Total | | 0.07 |
2009 EPS - Ongoing Earnings | | $0.88 |
Supply Segment
Earnings Drivers
8
Note: See Appendix for the reconciliation of earnings from ongoing operations to reported earnings. |
| 2009 |
2008 EPS - Ongoing Earnings | | $0.44 |
Delivery Margins | (0.04) | |
Financing Costs | (0.04) | |
Income Taxes & Other | (0.01) | |
Total | | (0.09) |
2009 EPS - Ongoing Earnings | | $0.35 |
Pennsylvania Delivery Segment
Earnings Drivers
9
Note: See Appendix for the reconciliation of earnings from ongoing operations to reported earnings. |
| 2009 |
2008 EPS - Ongoing Earnings | | $0.77 |
Delivery Margins | 0.05 | |
O&M | 0.03 | |
Financing Costs | 0.07 | |
Effect of Exchange Rates | (0.22) | |
Income Taxes & Other | 0.02 | |
Total | | (0.05) |
2009 EPS - Ongoing Earnings | | $0.72 |
International Delivery Segment
Earnings Drivers
Forecast
10
Note: See Appendix for the reconciliation of earnings from ongoing operations to reported earnings. |
|
$2.02
$3.50
Per Share
$1.95
$3.10
Strong Expected Earnings Growth
Millions
11
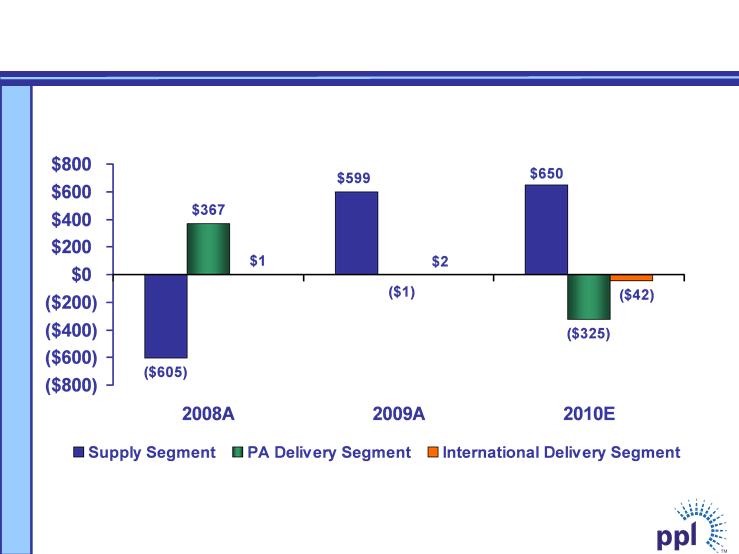
Note: See Appendix for reconciliation of cash from operations to free cash flow before dividends
Free Cash Flow before Dividends Forecast
12
PA Delivery Segment Operational Update
• PA PUC conducted a binding poll, indicating its
intent to approve the PPL electric portion of the
Susquehanna-Roseland 500 Kv transmission
line
– Final order expected in February
• 288,000 customers have selected retail
electricity suppliers for 2010
– No material impact on PPL
• Third POLR solicitation completed for the 2011
to mid-2013 procurement period
13
Exceptional performance has earned WPD additional revenue
of over $240 million with potential to earn more |
International Delivery Segment Operational Update
• The Ofgem final proposal was a constructive outcome for WPD
• Increases revenues by an average of 6.9% per year (plus inflation)
• Higher revenues result from a capital spending increase of 31% and
operating cost increase of 14%
• Additionally, WPD was awarded the following benefits for its
performance:
– $106 million for capital cost efficiency (#1)
– $77 million for quality of supply performance (#1)
– $48 million for forecasting accuracy (#1)
– $11 million for operating cost efficiency (#3)
14
Supply Segment Operational Update
• Susquehanna nuclear power plant set generation
record
• Susquehanna operating licenses renewed for an
additional 20 years
• Received FERC approval to expand Holtwood hydro
plant in PA
• Started construction to expand Rainbow hydro facility
in MT
• Completed construction of scrubbers at Brunner
Island
• Completed sale of the majority of Maine hydroelectric
assets
As of December 31, 2009
*Represents expected sales based on current business plan assumptions
**Represents energy, capacity, congestion and other revenues
15
| | | 2010 | | 2011 | | 2012 |
Baseload | | | | | | | |
Expected Generation* (1,000 MWhs) | | | 52.1 | | 52.1 | | 56.1 |
East | | | 43.4 | | 43.8 | | 47.6 |
West | | | 8.7 | | 8.3 | | 8.5 |
| | | | | | | |
Current Hedges (%) | | | 99% | | 88% | | 55% |
East | | | 100% | | 88% | | 51% |
West | | | 97% | | 86% | | 78% |
| | | | | | | |
Average Hedged Price (Energy Only) ($/MWh) | | | $59 | | $58 | | $61 |
East | | | $60 | | $59 | | $62 |
West | | | $49 | | $56 | | $57 |
| | | | | | | |
Expected Average Price (Fully Loaded) ($MWh) | | | $70 | | $67 | | $68 |
East** | | | $72 | | $69 | | $71 |
West | | | $49 | | $56 | | $57 |
| | | | | | | |
% Hedged Through Swaps/Options Energy Transactions | | | 96% | | 88% | | 55% |
% Hedged Through Load-following Transactions | | | 3% | | 0% | | 0% |
Intermediate/Peaking | | | | | | | |
Expected Generation (1,000 MWhs) | | | 5.0 | | 5.0 | | 5.1 |
Current Hedges (%) | | | 19% | | 0% | | 0% |
Supply Segment Asset Hedge Positions
(1) Weighted Average $/ton at mine for east wholly owned plants, excludes Keystone & Conemaugh
Note: As of 12/31/2009
2010 2011 2012
Uranium 100% 100% 100%
Coal
East 99% 85% 62%
West 100% 100% 91%
Total 99% 89% 70%
16
| 2010 | 2011 | 2012 |
| Hedge Level | Price | Hedge Level | Price | Hedge Level | Price |
% Fixed Base Price | 93% | $49 | 28% | $51 | 5% | $63 |
% Collars | 0% | N/A | 72% | $44-$51 | 95% | $42-$50 |
% Diesel Surcharge | 7% | $46 | 0% | N/A | 0% | N/A |
Eastern Coal Contracts (1)
Current Fuel Contracts - Base Prices
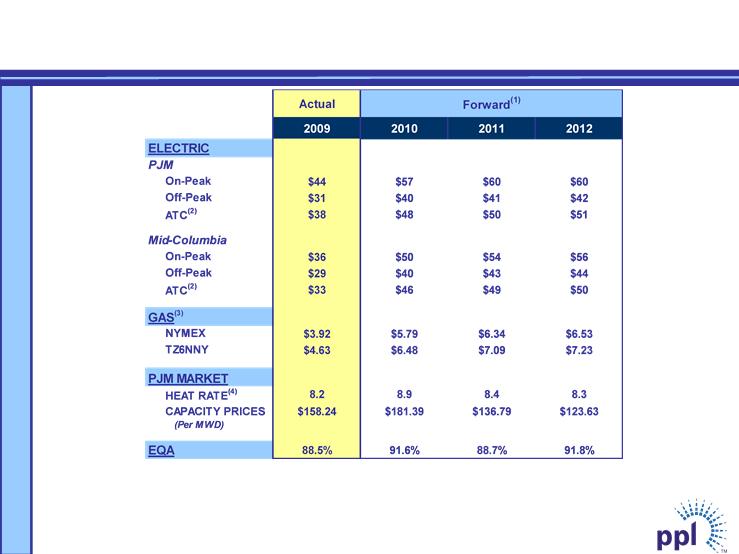
A-1
(1) | Market prices based on the average of broker quotes as of 12/31/2009 |
(2) | 24-hour average |
(3) | NYMEX and TZ6NNY forward gas prices on 12/31/2009 |
(4) | Market Heat Rate = PJM on-peak power price divided by TZ6NNY gas price |
Market Prices
Market Prices Actual Forward(1) 2009 2010 2011 2012 ELECTRIC PJM On-Peak $44 $57 $60 $60 Off-Peak $31 $40 $41 $42 Mid-Columbia ATC(2) $38 $48 $50 $51 On-Peak $36 $50 $54 $56 Off-Peak $29 $40 $43 $44 ATC(2) $33 $3.92 $46 $49 $50 $5.79 $6.34 $6.53 GAS(3) NYMEX TZ6NNY $4.63 8.2 $6.48 $7.09 $7.23 8.9 8.4 8.3 PJM MARKET HEAT RATE(4) CAPACITY PRICES $158.24 $181.39 $136.79 $123.63 (Per MWD) 88.5% 91.6% 88.7% 91.8% EQA (1) Market prices based on the average of broker quotes as of 12/31/2009 (2) 24-hour average (3) NYMEX and TZ6NNY forward gas prices on 12/31/2009 (4) Market Heat Rate = PJM on-peak power price divided by TZ6NNY gas price A-1
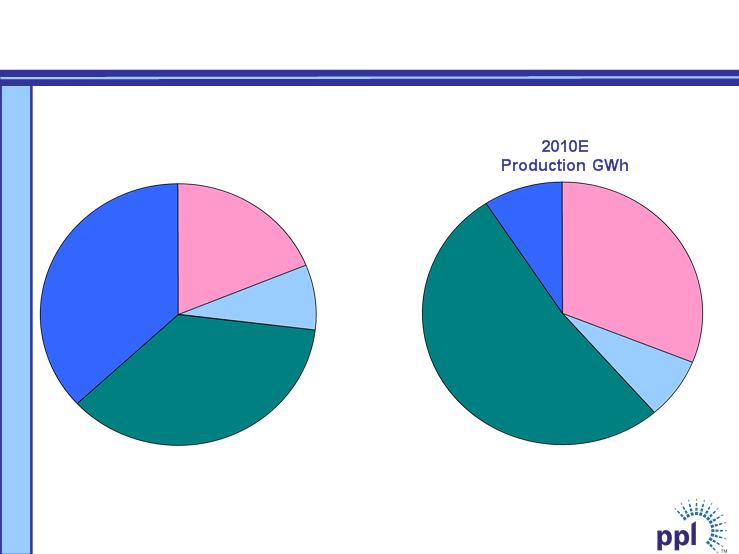
PPL Supply Business Overview
A-2
Gas/Oil
37%
Coal
36%
Nuclear
19%
Hydro
8%
2010E
Installed Capacity MW
Gas/Oil
9%
Coal
52%
Nuclear
31%
Hydro
8%
Note: Includes tolling agreements
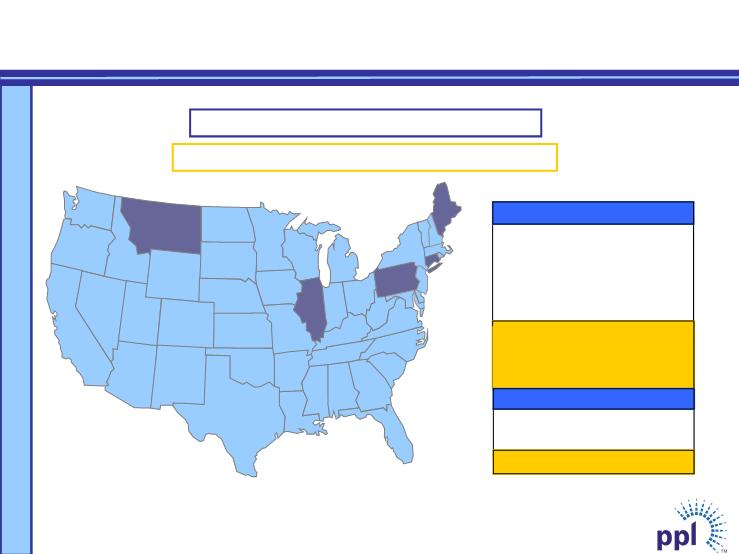
PPL’s Generation Portfolio
Total Domestic Generation: 11,719 MW
Planned Uprate Projects or Additions: 239 MW
Coal 3,497
Nuclear 2,206
Oil 1,672
Gas 2,212 (1)
Hydro 324 (2)
CTs 465
QFs 57 (1)
Coal 682
Hydro 604
Hydro Uprate (2012) 28
Nuclear Uprate (2010-2011) 53
Hydro Uprate (2013) 125
Gas/Oil Uprate (2011) 30
Landfill Gas Uprate (2011) 3
East 10,433 MW
A-3
(1) | Includes tolling agreements, and renewable energy projects |
(2) | Includes MWs associated with the proposed sale of the remaining
PPL Maine hydro assets |
West 1,286 MW
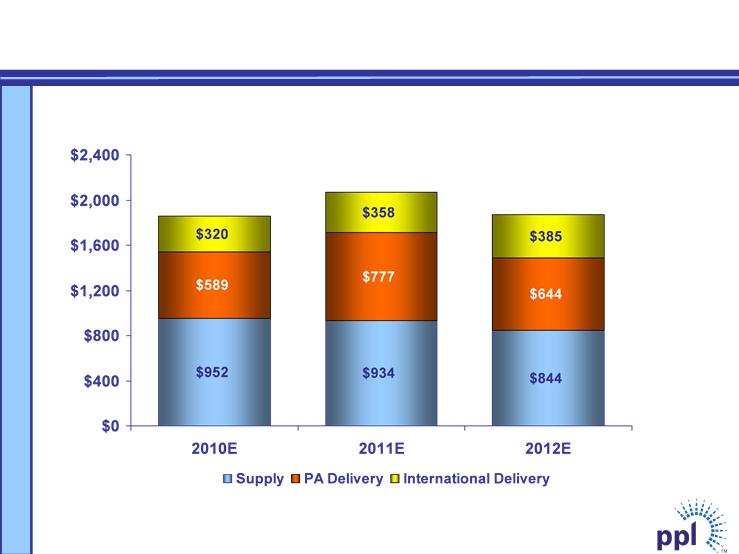
(Millions)
$1,861
$2,069
$1,873
A-4
Capital Expenditures by Segment
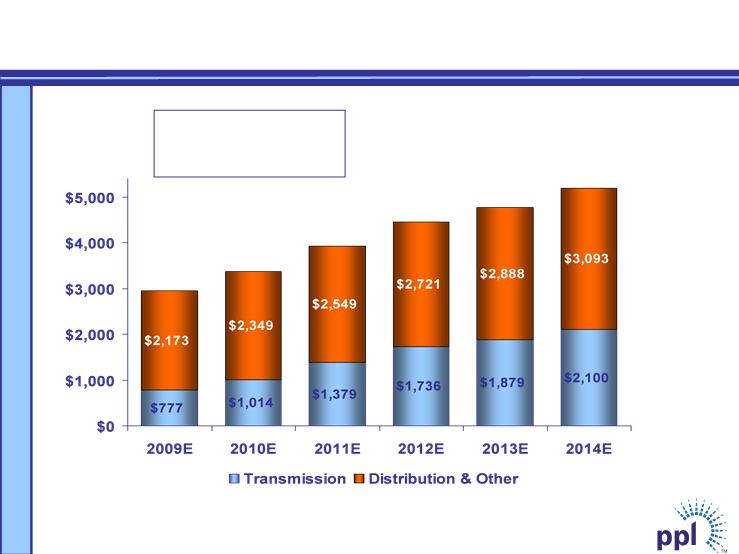
(Millions)
$3,363
$3,928
$4,457
$4,767
$5,193
CAGR
Distribution = 7.3%
Transmission = 22.0%
$2,950
A-5
PPL Electric Utilities Rate Base
A-6
August 11, 2009 July 19, 2011
October 20, 2009 October 18, 2011
January 19, 2010 January 9, 2012
April 20, 2010 April 3, 2012
July 20, 2010 July 17, 2012
October 19, 2010 October 16, 2012
April 18, 2011 January 22, 2013
P
P
P
Completed
P
PPL Electric Utilities 2011 to mid-2013
Procurement Plan Schedule
• Due dates for bids:
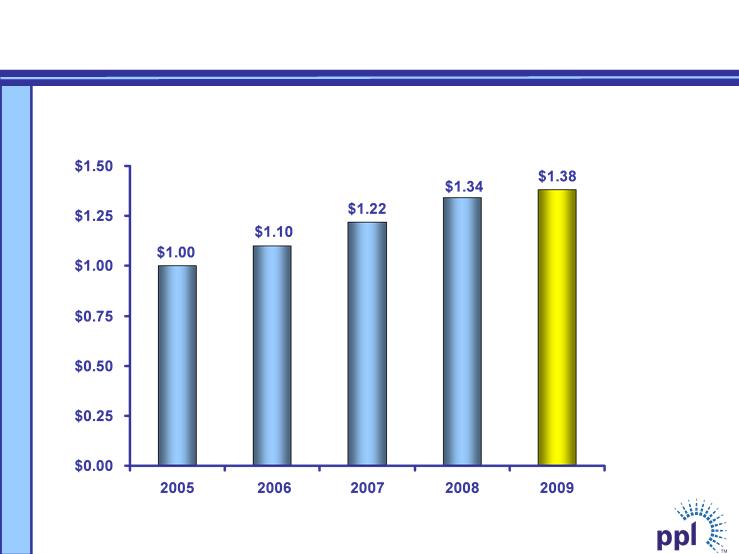
$/Share
Annualized
Dividend Profile
A-7
(1) Bonds defeased in substance in 2008 by depositing sufficient funds with the trustee
Note: As of 12/31/2009
A-8
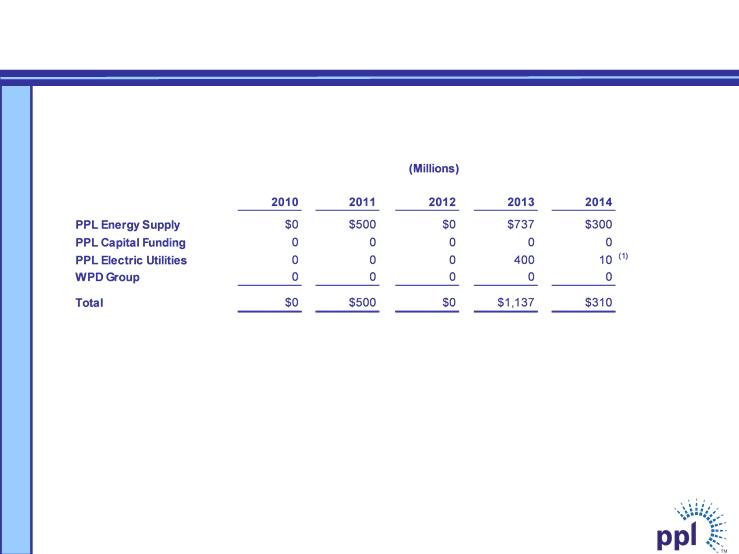
Debt Maturities
Debt Maturities (Millions) 2010 2011 2012 2013 2014 PPL Energy Supply $0 $500 $0 $737 $300 PPL Capital Funding 0 0 0 0 0 PPL Electric Utilities 0 0 0 400 10 (1) WPD Group 0 0 0 0 0 Total $0 $500 $0 $1,137 $310 (1) Bonds defeased in substance in 2008 by depositing sufficient funds with the trustee Note: As of 12/31/2009 A- 8
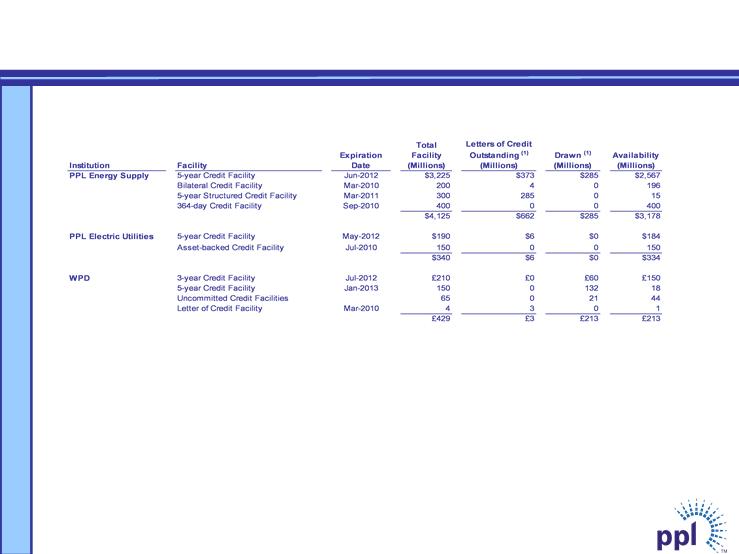
(1) Reported as of 12/31/2009
Domestic facilities consist of a diverse bank group, with no bank and its
affiliates providing an aggregate commitment of more than 15% of the total
committed capacity.
A-9
Liquidity Profile
Liquidity Profile Total Letters of Credit Expiration Facility Outstanding (1) Drawn (1) Availability Institution Facility Date (Millions) (Millions) (Millions) (Millions) PPL Energy Supply 5-year Credit Facility Jun-2012 $3,225 $373 $285 $2,567 Bilateral Credit Facility Mar-2010 200 4 0 196 5-year Structured Credit Facility Mar-2011 300 285 0 15 364-day Credit Facility Sep-2010 400 0 0 400 $4,125 $662 $285 $3,178 PPL Electric Utilities 5-year Credit Facility May-2012 $190 $6 $0 $184 Asset-backed Credit Facility Jul-2010 150 0 0 150 $340 $6 $0 $334 WPD 3-year Credit Facility Jul-2012 £210 £0 £60 £150 5-year Credit Facility Jan-2013 150 0 132 18 Uncommitted Credit Facilities 65 0 21 44 Letter of Credit Facility Mar-2010 4 3 0 1 £429 £3 £213 £213 Domestic facilities consist of a diverse bank group, with no bank and its affiliates providing an aggregate commitment of more than 15% of the total committed capacity. (1) Reported as of 12/31/2009 A- 9
A-10
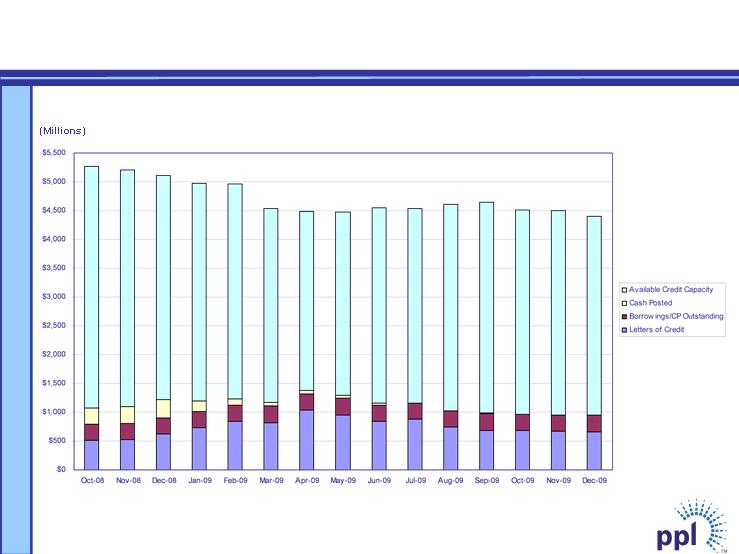
PPL Energy Supply Collateral Profile
A-11
| 2008 | 2009 | 2010 |
Cash from Operations | $595 | $1,310 | $1,435 |
Increase/(Decrease) in cash due to: | | | |
Capital Expenditures | (939) | (720) | (952) |
Investment in Energy Project | (203) | | |
Asset Sales (1), (2) | | 84 | 167 |
Other Investing Activities-net | (58) | (75) | |
Free Cash Flow before Dividends | ($605) | $ 599 | $650 |
| | | |
(Millions)
Actual Projected
(1) 2009 includes sale of Wyman and initial payment for the Maine hydro assets from ArcLight
(2) 2010 includes contingent payment on the Maine hydro assets from ArcLight, completion of the sale of the Penobscot Trust
assets, and the previously announced sale of the Long Island generating assets
Supply Segment Reconciliation of Cash from Operations
to Free Cash Flow before Dividends
A-12
| | 2008 | | 2009 | | 2010 |
Cash from Operations | | $643 | | $294 | | $264 |
Less Transition Bond Repayment | | (293) | | | | |
Increase/(Decrease) in cash due to: | | | | | | |
Capital Expenditures | | (286) | | (298) | | (589) |
Asset Sales & Other | | 303 | | 3 | | |
Free Cash Flow before Dividends | | $367 | | ($1) | | ($325) |
Note: Asset Sales in 2008 includes the net proceeds from the sale of gas and propane businesses
(Millions)
Actual Projected
PA Delivery Segment Reconciliation of Cash from
Operations to Free Cash Flow before Dividends
A-13
| 2008 | 2009 | 2010 |
Cash from Operations | $279 | $248 | $278 |
Increase/(Decrease) in cash due to: | | | |
Capital Expenditures Other Investing Activities - Net | (278) | (247) 1 | (320) |
Free Cash Flow before Dividends | $1 | $2 | ($42) |
| | | |
(Millions)
Actual Projected
International Delivery Segment Reconciliation of Cash
from Operations to Free Cash Flow before Dividends
A-14
(Millions)
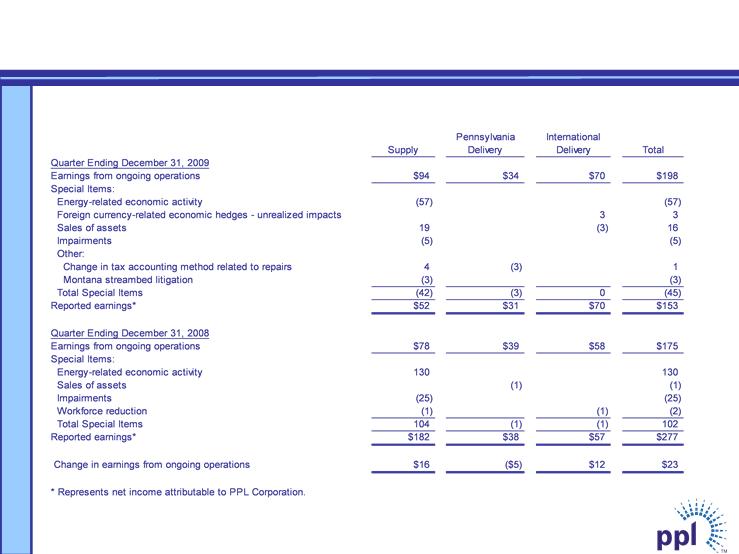
Reconciliation of Fourth Quarter Earnings from
Ongoing Operations to Reported Earnings
Reconciliation of Fourth Quarter Earnings from Ongoing Operations to Reported Earnings (Millions) Quarter Ending December 31, 2009 Earnings from ongoing operations Special Items: Energy-related economic activity Foreign currency-related economic hedges - unrealized impacts Sales of assets Impairments Other: Supply $94 (57) 19 (5) Pennsylvania Delivery $34 International Delivery $70 3 (3) Total $198 (57) 316(5) Change in tax accounting method related to repairs Montana streambed litigation Total Special Items Reported earnings* 4 (3) (42) $52 (3) (3) $31 0 $70 1(3) (45) $153 Quarter Ending December 31, 2008 Earnings from ongoing operations Special Items: Energy-related economic activity Sales of assets Impairments Workforce reduction Total Special Items Reported earnings* $78 130 (25) (1) 104 $182 $39 (1) (1) $38 $58 (1) (1) $57 $175 130(1) (25) (2) 102 $277 Change in earnings from ongoing operations $16 ($5) $12 $23 * Represents net income attributable to PPL Corporation. A-14
A-15
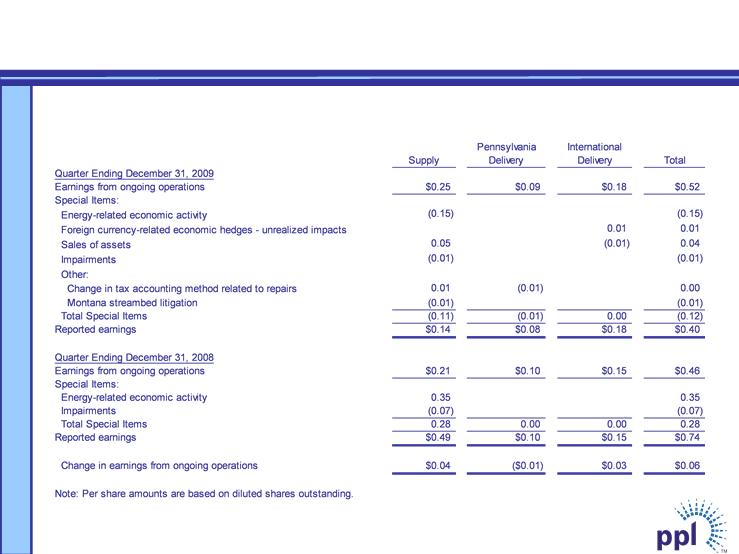
(Dollars Per Share)
Reconciliation of Fourth Quarter Earnings from
Ongoing Operations to Reported Earnings
Reconciliation of Fourth Quarter Earnings from Ongoing Operations to Reported Earnings (Dollars Per Share) Quarter Ending December 31, 2009 Earnings from ongoing operations Special Items: Energy-related economic activity Foreign currency-related economic hedges - unrealized impacts Sales of assets Impairments Other: Change in tax accounting method related to repairs Montana streambed litigation Total Special Items Reported earnings Supply $0.25 (0.15) 0.05 (0.01) 0.01 (0.01) (0.11) $0.14 Pennsylvania Delivery $0.09 (0.01) (0.01) $0.08 International Delivery $0.18 0.01 (0.01) 0.00 $0.18 Total $0.52 (0.15) 0.01 0.04 (0.01) 0.00(0.01) (0.12) $0.40 Quarter Ending December 31, 2008 Earnings from ongoing operations Special Items: Energy-related economic activity Impairments Total Special Items Reported earnings $0.21 0.35 (0.07) 0.28 $0.49 $0.10 0.00 $0.10 $0.15 0.00 $0.15 $0.46 0.35 (0.07) 0.28 $0.74 Change in earnings from ongoing operations $0.04 ($0.01) $0.03 $0.06 Note: Per share amounts are based on diluted shares outstanding. A-15
A-16
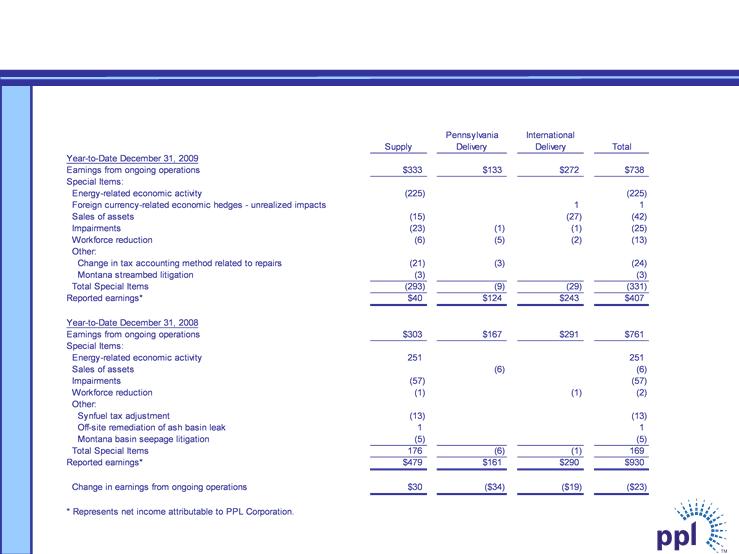
(Millions)
Reconciliation of Year-to-Date Earnings from
Ongoing Operations to Reported Earnings
Reconciliation of Year-to-Date Earnings from Ongoing Operations to Reported Earnings (Millions) Year-to-Date December 31, 2009 Earnings from ongoing operations Special Items: Energy-related economic activity Foreign currency-related economic hedges - unrealized impacts Sales of assets Impairments Workforce reduction Other: Supply $333 (225) (15) (23) (6) Pennsylvania Delivery $133 (1) (5) International Delivery $272 1 (27) (1) (2) Total $738 (225) 1(42) (25) (13) Change in tax accounting method related to repairs Montana streambed litigation Total Special Items Reported earnings* (21) (3) (293) $40 (3) (9) $124 (29) $243 (24) (3) (331) $407 Year-to-Date December 31, 2008 Earnings from ongoing operations Special Items: Energy-related economic activity Sales of assets Impairments Workforce reduction Other: $303 251 (57) (1) $167 (6) $291 (1) $761 251(6) (57) (2) Synfuel tax adjustment Off-site remediation of ash basin leak (13) 1 (13) 1 Montana basin seepage litigation Total Special Items Reported earnings* (5) 176 $479 (6) $161 (1) $290 (5) 169 $930 Change in earnings from ongoing operations $30 ($34) ($19) ($23) * Represents net income attributable to PPL Corporation. A-16
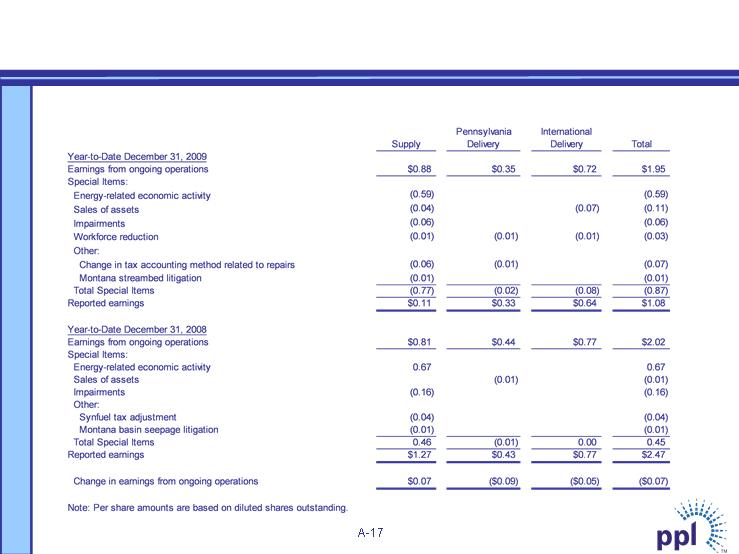
(Dollars Per Share)
Reconciliation of Year-to-Date Earnings from
Ongoing Operations to Reported Earnings
Reconciliation of Year-to-Date Earnings from Ongoing Operations to Reported Earnings (Dollars Per Share) Pennsylvania International Supply Delivery Delivery Total Year-to-Date December 31, 2009 Earnings from ongoing operations $0.88 $0.35 $0.72 $1.95 Special Items: Energy-related economic activity (0.59) (0.59) Sales of assets (0.04) (0.07) (0.11) Impairments (0.06) (0.06) Workforce reduction (0.01) (0.01) (0.01) (0.03) Other: Change in tax accounting method related to repairs (0.06) (0.01) (0.07) Montana streambed litigation (0.01) (0.01) Total Special Items (0.77) (0.02) (0.08) (0.87) Reported earnings $0.11 $0.33 $0.64 $1.08 Year-to-Date December 31, 2008 Earnings from ongoing operations $0.81 $0.44 $0.77 $2.02 Special Items: Energy-related economic activity 0.67 0.67 Sales of assets (0.01) (0.01) Impairments (0.16) (0.16) Other: Synfuel tax adjustment (0.04) (0.04) Montana basin seepage litigation (0.01) (0.01) Total Special Items 0.46 (0.01) 0.00 0.45 Reported earnings $1.27 $0.43 $0.77 $2.47 Change in earnings from ongoing operations $0.07 ($0.09) ($0.05) ($0.07) Note: Per share amounts are based on diluted shares outstanding. A-17
A-18
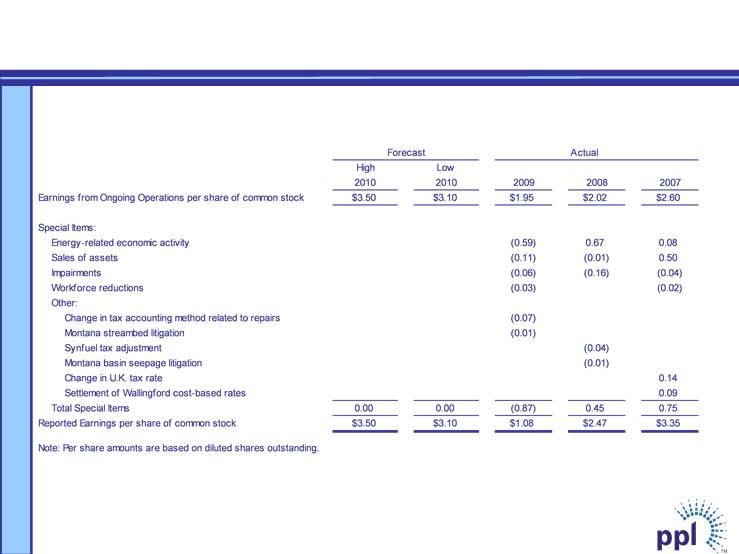
Reconciliation of PPL’s Earnings from Ongoing
Operations to Reported Earnings
Reconciliation of PPL’s Earnings from Ongoing Operations to Reported Earnings Earnings from Ongoing Operations per share of common stock High 2010 $3.50 Forecast Low 2010 $3.10 2009 $1.95 Actual 2008 $2.02 2007 $2.60 Special Items: Energy-related economic activity Sales of assets Impairments Workforce reductions Other: Change in tax accounting method related to repairs Montana streambed litigation Synfuel tax adjustment Montana basin seepage litigation Change in U.K. tax rate Settlement of Wallingford cost-based rates Total Special Items Reported Earnings per share of common stock 0.00 $3.50 0.00 $3.10 (0.59) (0.11) (0.06) (0.03) (0.07) (0.01) (0.87) $1.08 0.67 (0.01) (0.16) (0.04) (0.01) 0.45 $2.47 0.08 0.50 (0.04) (0.02) 0.14 0.09 0.75 $3.35 Note: Per share amounts are based on diluted shares outstanding. A-18
A-19
(Millions of Dollars)
(a) See additional information on the following slide. |
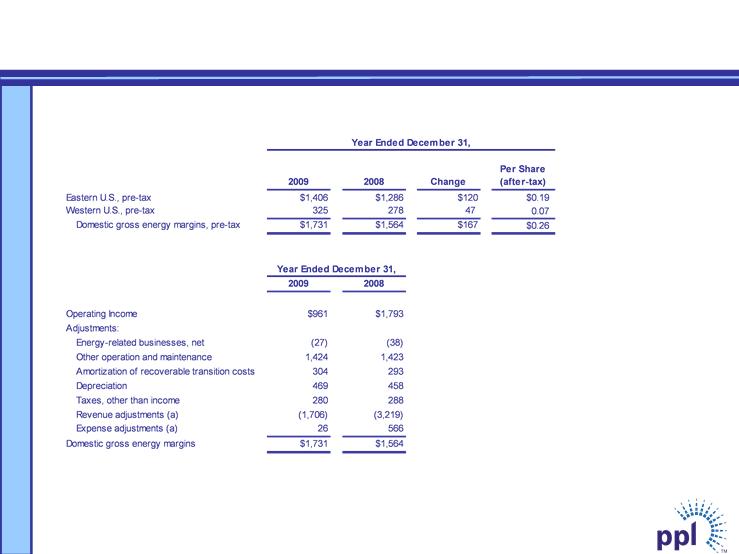
Reconciliation of Year-to-Date
Operating Income and Energy Margins
Reconciliation of Year-to-Date Operating Income and Energy Margins (Millions of Dollars) Year Ended December 31, Per Share 2009 2008 Change (after-tax) Eastern U.S., pre-tax $1,406 $1,286 $120 $0.19 Western U.S., pre-tax 325 278 47 0.07 Domestic gross energy margins, pre-tax $1,731 $1,564 $167 $0.26 Year Ended December 31, 2009 2008 Operating Income $961 $1,793 Adjustments: Energy-related businesses, net (27) (38) Other operation and maintenance 1,424 1,423 Amortization of recoverable transition costs 304 293 Depreciation 469 458 Taxes, other than income 280 288 Revenue adjustments (a) (1,706) (3,219) Expense adjustments (a) 26 566 Domestic gross energy margins $1,731 $1,564 (a) See additional information on the following slide. A-19
A-20
(Millions of Dollars)
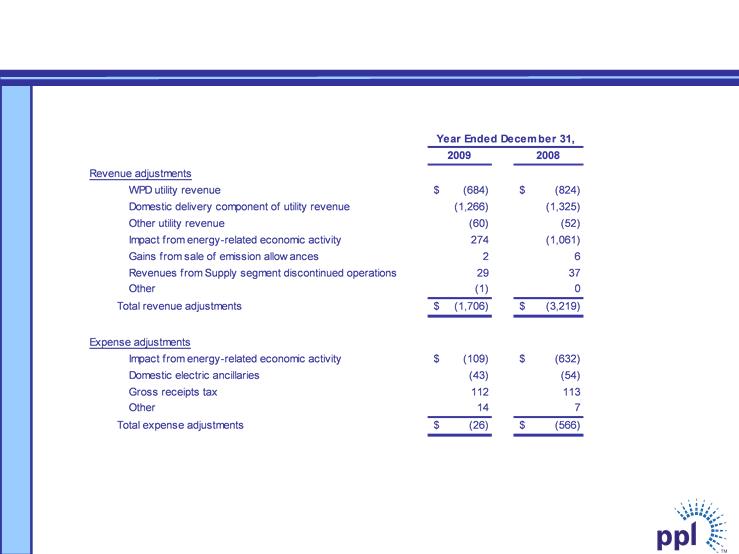
Reconciliation of Year-to-Date
Operating Income and Energy Margins
Reconciliation of Year-to-Date Operating Income and Energy Margins (Millions of Dollars) Year Ended December 31, 2009 2008 Revenue adjustments WPD utility revenue $ (684) $ (824) Domestic delivery component of utility revenue (1,266) (1,325) Other utility revenue (60) (52) Impact from energy-related economic activity 274 (1,061) Gains from sale of emission allowances 2 6 Revenues from Supply segment discontinued operations 29 37 Other (1) 0 Total revenue adjustments $ (1,706) $ (3,219) Expense adjustments Impact from energy-related economic activity $ (109) $ (632) Domestic electric ancillaries (43) (54) Gross receipts tax 112 113 Other 14 7 Total expense adjustments $ (26) $ (566) A-20
Credit Ratings
A-21
| Moody’s | Standard & Poor’s | Fitch |
PPL Corporation | | | |
Issuer Rating | Baa2 | BBB | BBB |
Outlook | NEGATIVE | NEGATIVE | STABLE |
| | | |
PPL Energy Supply | | | |
Issuer Rating | | BBB | BBB |
Tax-Exempt Bonds (1) | Aaa | AAA | |
Senior Notes | Baa2 | BBB | BBB |
Outlook | STABLE | NEGATIVE | STABLE |
| | | |
PPL Capital Funding | | | |
Issuer Rating | | | BBB |
Senior Unsecured Debt | Baa2 | BBB- | BBB |
Subordinated Debt | Baa3 | BB+ | BB+ |
Outlook | NEGATIVE | | STABLE |
| | | |
PPL Electric Utilities | | | |
Issuer Rating | Baa1 | A- | BBB |
First Mortgage Bonds | A3 | A- | A- |
Tax-Exempt Bonds (2) | A3/Baa1 | A/A- | |
Senior Secured Debt | A3 | A- | A- |
Commercial Paper | P-2 | A-2 | F-2 |
Preferred Stock | Baa3 | BBB | BBB- |
Preference Stock | Baa3 | BBB | BBB- |
Outlook | NEGATIVE | NEGATIVE | STABLE |
(1) Letter of Credit-Backed Security
(2) Includes both Insured and Non-Insured Securities
Credit Ratings (cont.)
A-22
Commercial Paper
A-
BBB+
Baa1
Senior Unsecured Debt
F2
A-2
P-2
Commercial Paper
POSITIVE
NEGATIVE
STABLE
Outlook
BBB+
BBB+
Baa1
Issuer Rating
A-
BBB+
Baa1
Senior Unsecured Debt
F2
A-2
Commercial Paper
POSITIVE
NEGATIVE
STABLE
Outlook
Western Power Distribution (South West) PLC
BBB+
BBB+
Issuer Rating
Western Power Distribution (South Wales) PLC
POSITIVE
NEGATIVE
STABLE
Outlook
POSITIVE
Outlook
BBB
Issuer Rating
WPD Holdings LLP
BBB-
BBB-
Baa3
Issuer Rating
BBB
BBB-
Baa3
Senior Unsecured Debt
A-3
Commercial Paper
WPD Holdings Limited
BBB
BBB-
Baa3
Pass-Through Certificates
STABLE
STABLE
Outlook
PPL Montana
Fitch
Standard & Poor’s
Moody’s
A-23
Statements contained in this presentation, including statements with respect to future earnings, energy prices, margins and sales,
growth, revenues, expenses, cash flow, asset disposition, marketing performance, hedging, regulation, corporate strategy and
generating capacity and performance, are “forward-looking statements” within the meaning of the federal securities laws. Although PPL
Corporation believes that the expectations and assumptions reflected in these forward-looking statements are reasonable, these
expectations, assumptions and statements are subject to a number of risks and uncertainties, and actual results may differ materially
from the results discussed in the statements. The following are among the important factors that could cause actual results to differ
materially from the forward-looking statements: market demand and prices for energy, capacity and fuel; weather conditions affecting
customer energy usage and operating costs; competition in power markets; the effect of any business or industry restructuring; the
profitability and liquidity of PPL Corporation and its subsidiaries; new accounting requirements or new interpretations or applications of
existing requirements; operating performance of plants and other facilities; environmental conditions and requirements and the related
costs of compliance, including environmental capital expenditures and emission allowance and other expenses; system conditions and
operating costs; development of new projects, markets and technologies; performance of new ventures; asset acquisitions and
dispositions; any impact of hurricanes or other severe weather on our business, including any impact on fuel prices; receipt of necessary
government permits, approvals, rate relief and regulatory cost recovery; capital market conditions and decisions regarding capital
structure; the impact of state, federal or foreign investigations applicable to PPL Corporation and its subsidiaries; the outcome of litigation
against PPL Corporation and its subsidiaries; stock price performance; the market prices of equity securities and the impact on pension
income and resultant cash funding requirements for defined benefit pension plans; the securities and credit ratings of PPL Corporation
and its subsidiaries; political, regulatory or economic conditions in states, regions or countries where PPL Corporation or its subsidiaries
conduct business, including any potential effects of threatened or actual terrorism or war or other hostilities; foreign exchange rates; new
state, federal or foreign legislation, including new tax legislation; and the commitments and liabilities of PPL Corporation and its
subsidiaries. Any such forward-looking statements should be considered in light of such important factors and in conjunction with PPL
Corporation’s Form 10-K and other reports on file with the Securities and Exchange Commission.
Forward-Looking Information Statement
“Earnings from ongoing operations” should not be considered as an alternative to reported earnings, or net income attributable to PPL, which is an indicator of
operating performance determined in accordance with generally accepted accounting principles (GAAP). PPL believes that “earnings from ongoing operations”,
although a non-GAAP financial measure, is also useful and meaningful to investors because it provides them with management’s view of PPL’s fundamental
earnings performance as another criterion in making their investment decisions. PPL’s management also uses “earnings from ongoing operations” in measuring
certain corporate performance goals. Other companies may use different measures to present financial performance.
“Earnings from ongoing operations” is adjusted for the impact of special items. Special items include:
•The impact of energy-related economic activity (as discussed below).
•Foreign currency-related economic hedges.
•The impact of sales of assets not in the ordinary course of business.
•Impairment charges (including impairments of securities in the company’s nuclear decommissioning trust).
•Workforce reduction and other restructuring impacts.
•Other charges or credits that are, in management’s view, not reflective of the company’s ongoing operations.
Energy-related economic activity includes the changes in fair value of positions used to hedge a portion of the economic value of PPL’s generation assets, load
-following and retail activities. This economic value is subject to changes in fair value due to market price volatility of the input and output commodities (e.g., fuel
and power). Also included in this special item are the ineffective portion of qualifying cash flow hedges and the premium amortization associated with options
classified as economic activity. These items are included in ongoing earnings over the delivery period that was hedged. Management believes that adjusting for
such amounts provides a better matching of earnings from ongoing operations to the actual amounts settled for PPL’s underlying hedged assets.
“Free cash flow before dividends” is derived by deducting capital expenditures and other investing activities-net, as well as the repayment of transition bonds,
from cash flow from operations. Free cash flow before dividends should not be considered as an alternative to cash flow from operations, which is determined in
accordance with GAAP. PPL believes that free cash flow before dividends, although a non-GAAP measure, is an important measure to both management and
investors since it is an indicator of the company’s ability to sustain operations and growth without additional outside financing beyond the requirement to fund
maturing debt obligations. Other companies may calculate free cash flow before dividends in a different manner.
"Domestic Gross Energy Margins" is intended to supplement the investors' understanding of PPL’s domestic non-trading and trading activities by combining
applicable income statement line items and related adjustments to calculate a single financial measure. PPL believes that "Domestic Gross Energy Margins" is
useful and meaningful to investors because it provides them with the results of PPL's domestic non-trading and trading activities as another criterion in making
their investment decisions. "Domestic Gross Energy Margins" is not intended to replace "Operating Income," which is determined in accordance with GAAP, as
an indicator of overall operating performance. PPL's management also uses "Domestic Gross Energy Margins" in measuring certain corporate performance
goals used in determining variable compensation. Other companies may use different measures to present the results of their non-trading and trading activities.
A-24
Definitions of Non-GAAP Financial Measures