© PPL Corporation 2012
EEI Financial Conference
Phoenix, AZ
November 11-14, 2012
Exhibit 99.2
© PPL Corporation 2012
2
Cautionary Statements and Factors
That May Affect Future Results
Any statements made in this presentation about future operating
results or other future events are forward-looking statements
under the Safe Harbor Provisions of the Private Securities
Litigation Reform Act of 1995. Actual results may differ materially
from such forward-looking statements. A discussion of factors
that could cause actual results or events to vary is contained in
the Appendix to this presentation and in the Company’s SEC
filings.
© PPL Corporation 2012
3
U.K. Delivery Territories:
WPD (South Wales)
WPD (South West)
WPD (West Midlands)
WPD (East Midlands)
U.S. Delivery Territories:
•
PPL Electric Utilities
•
Kentucky Utilities
•
Louisville Gas and Electric
•
•
•
•
•
•
Generation Assets:
Competitive power plants
Regulated power plants
PPL Delivery and Generation Assets
© PPL Corporation 2012
4
• Rate-regulated business provides earnings and dividend stability in weak
economic and market environment
– Over 70% of projected 2012 EPS from regulated businesses
– Substantial projected organic growth in rate base: ~7.6% CAGR from 2012-2016
– Business Risk Profile rated “Excellent” by S&P
– Secure dividend with strong platform for continued growth
• Highly attractive competitive generation fleet with diverse fuel mix allows for
significant upside when power markets recover
– Strong baseload footprint in PJM complemented by flexible gas-fired units
– No major exposure to currently proposed environmental regulations
• Strong management team with track record of execution
– U.K. team best-in-class among U.K. peers
– Obtained required approvals for Susquehanna-Roseland transmission line
– Successfully hedging competitive generation and locking in margins in a challenging market
PPL Well-Positioned for Future Success
© PPL Corporation 2012
5
Approximately two-thirds of regulated capital expenditures
earn returns subject to minimal or no regulatory lag
(1)
65%
$1.1
$0.3
$0.3
(1) Includes capex for WPD Midlands. Figures based on assumed exchange rate of $1.57 / GBP.
(2) Assumes 85% of total planned ECR spend as LKE expects between 80% and 90% to receive timely returns via ECR mechanism based on historical experience and future
projections.
projections.
Real-Time Recovery of Regulated
Capex Spending
Capex Spending
65%
$1.1
$0.6
$0.5
67%
$1.1
$0.6
$0.5
($ in billions)
$1.1
$0.4
$0.4
63%
$1.1
$0.3
$0.3
68%
(2)
© PPL Corporation 2012
6
• Highly attractive rate-regulated business
– Regulator-approved multi-year forward-looking revenues based on future business plan, including capital
expenditures and O&M plus adjustments for inflation
– Real-time return of and return on capital investment - no lag
– No volumetric risk
– Additional incentives for operational efficiency and high-quality service
• Best-in-class management team with track record of delivering results
U.K. Regulated Segment
Investment Highlights
Top performing electricity distribution business in the U.K.
• WPD has earned over $185 million in annual performance awards over
the past 8 regulatory years
United Kingdom Delivery Territories:
WPD (South Wales)
WPD (South West)
WPD (West Midlands)
WPD (East Midlands)
(1) Central Networks was renamed WPD Midlands upon PPL acquisition in April 2011.
(1)
© PPL Corporation 2012
7
DPCR5 | RIIO-ED1 | Rating | |
Revenue Determination | RPI - X (cost efficiency model) | RIIO (Revenue = Incentives + Innovation + Outputs) | |
Price Control Period | 5 years | 8 years | |
Financeability | WACC (fixed for price control period) | WACC (annual debt adjustments based on iBoxx 10+ year index) | |
Recovery Period | 20 years | 20 years, existing assets; 45 years, new assets | |
Incentives | Rewards / Penalties for output delivery | Rewards / Penalties for output delivery | |
Innovation | Low Carbon Network Fund (LCNF) | LCNF supplemented | |
Stakeholders | Customer Engagement | Expanded Stakeholder Engagement | |
Pensions | Partial deficit recovery | Efficient costs recovered; Partial deficit recovery | |
Fast-Tracking | Not applicable | Possible; Results known ~1 year sooner |
U.K. Regulatory Framework Change
Positive
Neutral
Negative
Key success factors for WPD include the delivery of outputs for the current regulatory
period and the submission of a high-quality long-term business plan
© PPL Corporation 2012
8
Electricity Transmission (RIIO-T1) | Gas Transmission (RIIO-T1) | Gas Distribution (RIIO-GD1) | Electricity Distribution (DPCR5) | |
Price Control Period | 8 years (1 April 2013 - 2021) | 8 years (1 April 2013 - 2021) | 8 years (1 April 2013 - 2021) | 5 years (1 April 2010 - 2015) |
WACC (real): Cost of debt (pre-tax) Cost of equity Gearing (leverage) “Vanilla” WACC | 3.0% 7.0% 60% 4.6% | 3.0% 6.8% 62.5% 4.4% | 3.0% 6.7% 65% 4.3% | 3.6% 6.7% 65% 4.7% (4.3% with 3.0% debt cost) |
Recovery Period | 20 years, existing assets; 45 years, new assets | 45 years (no change) | 45 years; new assets front-end loaded | 20 years |
Incentives | Rewards / Penalties for output delivery | Rewards / Penalties for output delivery | Rewards / Penalties for output delivery | Rewards / Penalties for output delivery |
Innovation | Low Carbon Network Fund equivalent | Low Carbon Network Fund equivalent | Low Carbon Network Fund equivalent | Low Carbon Network Fund |
Ofgem 2012 Initial Proposal Comparison
© PPL Corporation 2012
9
• Efficient, well-run utilities focused on safety, reliability and customer service
• Constructive regulatory environment that provides a timely return on a
substantial amount of planned capex over the next 5 years
– Environmental Cost Recovery (ECR): ~$1.8 billion plan approved by the KPSC with a 10.1% ROE; ~$500
million remaining under prior plan at 10.63% ROE - virtually no regulatory lag
– Other supportive recovery mechanisms include Construction Work In Progress, Fuel Adjustment Clause,
Gas Supply Clause Adjustment and Demand Side Management recovery
Kentucky Regulated Segment
Investment Highlights
Significant Rate Base Growth
Kentucky Delivery Territories
($ in billions)
© PPL Corporation 2012
10
• Significant growth in transmission portion of
business which earns a favorable rate of
return on a near real-time basis
business which earns a favorable rate of
return on a near real-time basis
– CAGR of 22.3% in transmission rate base
through 2016 driven by initiatives to improve
aging infrastructure
– ROE of 11.68% earned through FERC Formula
Rate Mechanism
Rate Mechanism
– Return on CWIP for $180 million
Northeast/Pocono Reliability project
– ROE of 12.93% and return on CWIP for $560
million Susquehanna-Roseland project
Pennsylvania Regulated Segment
Investment Highlights
Projected Distribution Rate Base Growth
Projected Transmission Rate Base Growth
• Reliability initiatives drive distribution rate
base growth at a projected CAGR of 6.5%
through 2016
base growth at a projected CAGR of 6.5%
through 2016
• Act 11 - Alternative ratemaking legislation
provides for more timely recovery of eligible
distribution plant costs that improve and
maintain safety and reliability
provides for more timely recovery of eligible
distribution plant costs that improve and
maintain safety and reliability
© PPL Corporation 2012
Pennsylvania Regulated: Transmission
Susquehanna-Roseland Project:
• PPL Electric to build Pennsylvania portion of the
150-mile Susquehanna to Roseland, NJ 500 kV
transmission line. New Jersey portion of the line
to be built by PSEG
• Already approved by both PA and NJ state utility
commissions
• ROE of 12.93% and return on CWIP
11
Key Milestones:
• Oct. 1, 2012 - Official Record of Decision from the
National Park Service
• Oct. 2012: Begin overhead line construction
• March 2013 - Begin Lackawanna 500kV substation
construction
• Nov. 2014 - Complete Lackawanna 500kV
substation
• June 2015 - Energize the Susquehanna-Roseland
line
(1) Actual costs to date through December 31, 2011 .
(1)
© PPL Corporation 2012
12
• Very well-positioned competitive generation
– PJM assets:
• Excellent mix of low marginal cost nuclear and hydro
facilities, efficient supercritical coal units and
attractive gas-fired assets that capture market
opportunity and back-stop base load unit availability
facilities, efficient supercritical coal units and
attractive gas-fired assets that capture market
opportunity and back-stop base load unit availability
– Montana assets:
• Low marginal cost coal and hydro units that are
critical to infrastructure
Supply Segment
Investment Highlights
• Substantially in compliance with new
emissions standards without further major
investments
emissions standards without further major
investments
• Generation fleet will benefit from multiple
factors
factors
– Tightening reserve margins
– General firming of natural gas prices
PJM Generation Assets
Managing capital spend through low commodity cycle
• Cut approximately $700 million in capital spending at Supply
since 2010
© PPL Corporation 2012
Summary of Events
• May 2011:
– Identified cracks in Unit #2 turbine blades during bi-annual
spring refueling outage
– Announced Unit #1 blades would also be inspected
• June 2011:
– Identified cracks in Unit #1 turbine blades
– Replaced cracked blades on both Units and returned them
to service near end of month
• April 2012:
– Identified cracks in Unit #1 turbine blades during refueling
outage
outage
• Less extensive than previous cracking
– Announced Unit #2 blades would be inspected after Unit #1
returned to service
returned to service
• May-June 2012:
– Replaced cracked blades on Unit #1 and installed diagnostic
equipment - returned to service in early June
– Unit #2 inspection found no cracking; installed diagnostic
equipment
equipment
– Unit #2 returned to service mid-June
• October-November 2012:
– Announced Unit #1 outage to inspect turbine to confirm
data that could lead to finalization of a plan to resolve issue
– Unit #2 power reduced in early October and will be shut
down in November based on results of Unit #1 inspection
– Unit #1 returned to service on November 7th
• Replaced a small number of cracked blades and
returned Unit #1 to service
• Confirmed data from diagnostic equipment installed
in the spring
in the spring
• Now have a solid understanding of the cause and
are finalizing short-term and long-term plans to
resolve the issue
are finalizing short-term and long-term plans to
resolve the issue
• Shut down Unit #2 for similar inspection
• Will serve as a bridge until the power plant begins
making long-term improvements starting in the
spring of 2013
making long-term improvements starting in the
spring of 2013
13
Susquehanna Update
© PPL Corporation 2012
14
A significantly more rate-regulated business mix provides strong
support for current dividend and a platform for future growth
(1) Ongoing EPS based on mid-point of forecast. Annualized dividend based on 3rd quarter declaration. Actual dividends to be determined by Board of Directors.
(2) From only regulated segments.
$/Share
Annualized
(2)
(1)
Dividend Profile
© PPL Corporation 2012
15
Appendix
© PPL Corporation 2012
16
$2.73
$/Share
Note: See Appendix for the reconciliation of earnings from ongoing operations to reported earnings.
$2.40
$2.30
Increased 2012 Ongoing Earnings Forecast
© PPL Corporation 2012
17
P
U.K. Electricity Distribution Price Control
Review Schedule
Review Schedule
RIIO-ED1 Tentative Schedule | |
Provisional Timing | Milestone |
September 2012 | Publication of Strategy Consultation |
February 2013 | Publication of Strategy Decision |
July 2013 | DNOs submit business plans |
October 2013 | Initial Assessment and publication of Fast-Track Proposals |
February 2014 | Publication of Fast-Track Decision |
March 2014 | Business plan resubmitted (non-fast-track) |
July 2014 | Publication of Initial Proposals Consultation for non-fast-tracked companies |
November 2014 | Publication of Final Proposals for non-fast-tracked companies |
December 2014 | Issue statutory consultation on new license conditions |
April 1, 2015 | New price control period commences |
Source: Ofgem Strategy Consultation for RIIO-ED1, September 2012
Completed
P
© PPL Corporation 2012
18
Completed
P
P
P
P
P
P
P
P
P
LG&E and KU Rate Case Schedules
1st Rest for information received | July 31, 2012 |
LG&E and KU responses filed | August 14, 2012 |
Supplemental request for information received | August 28, 2012 |
LG&E and KU responses filed | September 12, 2012 |
Intervenor testimony filed | October 3, 2012 |
Request to intervenors submitted | October 10, 2012 |
Intervenor responses filed | October 24, 2012 |
LG&E/KU rebuttal testimony filed | November 5, 2012 |
Settlement Conference | November 13-14, 2012 |
Public meetings across the state | November 8, 15 and 20, 2012 |
Public hearing in Frankfort | November 27, 2012 |
Order issued (tentative) | Early January 2013 |
New rates effective | January 2013 |
© PPL Corporation 2012
19
Complete filings available at www.lge-ku.com/regulatory.asp
LG&E | KU | ||
Electric | Gas | Electric | |
Revenue Increase Requested | $62.1 million | $17.2 million | $82.4 million |
Test Year | 12-months ended 3/31/2012 | 12-months ended 3/31/2012 | 12-months ended 3/31/2012 |
Requested ROE | 11.00% | 11.00% | 11.00% |
Rate Base | $1.97 billion | $0.52 billion | $3.98 billion |
Common Equity Ratio | 55.64% | 55.64% | 53.74% |
1% Change in ROE = | ~$18 million in revenue | ~$5 million in revenue | ~$28 million in revenue |
Docket No. | 2012-00222 | 2012-00222 | 2012-00221 |
LG&E and KU Rate Case Facts
© PPL Corporation 2012
20
Completed
P
P
Direct testimony of other parties June 22, 2012
Rebuttal testimony July 16, 2012
Sur-rebuttal testimony August 1, 2012
Evidentiary hearings August 6, 7, 9 and 10, 2012
Close of record August 10, 2012
Main briefs August 29, 2012
Reply briefs September 14, 2012
Recommended Decision October 19, 2012
Order issued (tentative) December 20, 2012
New rates effective January 2013
P
P
P
P
P
P
P
PPL Electric Utilities Distribution
Rate Case Schedule
Rate Case Schedule
© PPL Corporation 2012
21
Distribution Revenue Increase Requested $104.6 million
Test Year 2012
Requested ROE 11.25%
2012 Distribution Rate Base $2.42 billion
2012 Common Equity Ratio 51.03%
1% Change in ROE = ~$23 million in revenue
Docket No. R-2012-2290597
Complete filing available at www.pplelectric.com/rateinfo
PPL Electric Utilities Distribution
Rate Case Facts
Rate Case Facts
© PPL Corporation 2012
22
Enhancing Value Through Active Hedging
Capacity revenues are expected to be $385 million, $590 million and $560 million for 2012, 2013 and 2014, respectively.
As of September 30, 2012
(1) Represents expected sales of Supply segment based on current business plan assumptions.
(2) The 2013 & 2014 ranges of average energy prices for existing hedges were estimated by determining the impact on the existing collars resulting from 2013 & 2014 power prices at the
5th and 95th percentile confidence levels.
Enhancing Value Through Active Hedging 2012 2013 2014 Baseload Expected Generation(1) ( Million MWhs) 44.5 49.6 50.4 East 37.8 41.2 41.8 West 6.7 8.4 8.6 Current Hedges ( % ) 99- 101% 93- 97% 53- 57% East 99- 101% 97- 101% 56- 60% West 96- 99% 72- 76% 44- 47% Average Hedged Price ( Energy Only) ( $ / MWh) (2) East $59- 61 $48- 49 $ 40- 43 West $57- 58 $46- 47 $ 45- 47 Current Coal Hedges ( % ) 105% 97% 77% East 107% 96% 67% West 100% 100% 100% Average Hedged Consumed Coal Price ( Delivered $/ Ton) East $75- 76 $80- 83 $ 77- 85 West $26- 28 $23- 29 $ 24- 31 Intermediate/ Peaking Expected Generation(1) ( Million MWhs) 9.2 8.9 8.1 Current Hedges ( % ) 91% 7% 0% Capacity revenues are expected to be $385 million, $590 million and $560 million for 2012, 2013 and 2014, respectively. As of September 30, 2012 (1) Represents expected sales of Supply segment based on current business plan assumptions. (2) The 2013 & 2014 ranges of average energy prices for existing hedges were estimated by determining the impact on the existing collars resulting from 2013 & 2014 power prices at the 5th and 95th percentile confidence levels. © PPL Corporation 2012 22
© PPL Corporation 2012
23
(1) | 24-hour average. |
(2) | NYMEX and TZ6NNY forward gas prices on 9/30/2012. |
(3) | Market Heat Rate = PJM on-peak power price divided by TZ6NNY gas price. |
Market Prices
Market Prices Balance of 2012 2013 2014 ELECTRIC PJM On-Peak $41 $46 $ 47 Off-Peak $31 $32 $ 33 ATC(1) $36 $38 $ 39 Mid-Columbia On-Peak $32 $34 $ 38 Off-Peak $28 $25 $ 29 ATC(1) $30 $29 $ 34 GAS(2) NYMEX $ 3.32 $3.84 $ 4.18 TZ6NNY $ 3.65 $4.13 $ 4.35 PJM MARKET HEAT RATE(3) 11.3 11.1 10.8 $123.63 $187.49 $173.85 CAPACITY PRICES ( Per MWD) 86% 88% 89% EQA (1) 24-hour average. (2) NYMEX and TZ6NNY forward gas prices on 9/30/2012. (3) Market Heat Rate = PJM on-peak power price divided by TZ6NNY gas price. © PPL Corporation 2012 23
© PPL Corporation 2012
24
($ in billions)
(1) Includes capex for WPD Midlands. Figures based on assumed exchange rate of $1.57 / GBP.
(2) Expect between 80% and 90% to receive timely returns via ECR mechanism based on historical experience and future projections.
(1)
(2)
$3.5
$4.1
$3.9
$3.5
$3.1
Capital Expenditures
Lower capital expenditures provide additional financial flexibility
© PPL Corporation 2012
25
($ in billions)
(1) Represents capitalization for LKE, as LG&E and KU rate constructs are based on capitalization. Represents Regulatory Asset Value (RAV) for WPD.
(2) Includes RAV for WPD Midlands. Figures based on assumed exchange rate of $1.57 / GBP and are as of year-end December 31.
$18.6
$20.8
$22.9
$24.4
(2)
2012E - 2016E Regulatory Asset Base(1) CAGR: 7.6%
$17.6
$25.3
Projected Regulated Rate Base Growth
© PPL Corporation 2012
26
Free Cash Flow before
Dividends
Dividends
(Millions of Dollars)
Note: Free Cash Flow forecast updated on an annual basis. Charts reflect 2012 Free Cash Flow forecast as presented on the 2011 4th quarter earnings call on 02/10/2012
(1) 2010 Free Cash Flow includes two months of the results of the Kentucky Regulated segment.
(1)
Reconciliation of Cash from
Operations to Free Cash Flow
before Dividends
Operations to Free Cash Flow
before Dividends
(Millions of dollars)
Free Cash Flow before Dividends
© PPL Corporation 2012
27
Note: As of September 30, 2012
(1) Excludes $1.15 billion of junior subordinated notes due 2018 that are a component of PPL’s 2010 Equity Units and may
be put back to PPL Capital Funding if the remarketing in 2013 is not successful.
(2) Excludes $978 million of junior subordinated notes due 2019 that are a component of PPL’s 2011 Equity Units and may be
put back to PPL Capital Funding if the remarketing in 2014 is not successful.
(3) Bonds defeased in substance in 2008 by depositing sufficient funds with the trustee.
(4) Includes $300 million of REset Put Securities due 2035 that are required to be put by the holders in October 2015 either
for (a) purchase and remarketing by a remarketing dealer or (b) repurchase by PPL Energy Supply.
Debt Maturities
Debt Maturities ( Millions) 2012 2013 2014 2015 2016 (1) $0 (2) PPL Capital Funding $0$ 0 $0$ 0 LG& E and KU Energy ( Holding Co LKE) 0 0 0400 0 Louisville Gas & Electric 0 0 0250 0 Kentucky Utilities 0 0 0250 0 10 (3) PPL Electric Utilities 00 1000 PPL Energy Supply 3 751 318 317 (4) 368 WPD 0 0 0 0460 Total $3 $751 $ 328 $1,317 $828 Note: As of September 30, 2012 (1) Excludes $1.15 billion of junior subordinated notes due 2018 that are a component of PPL’s 2010 Equity Units and may be put back to PPL Capital Funding if the remarketing in 2013 is not successful. (2) Excludes $978 million of junior subordinated notes due 2019 that are a component of PPL’s 2011 Equity Units and may be put back to PPL Capital Funding if the remarketing in 2014 is not successful. (3) Bonds defeased in substance in 2008 by depositing sufficient funds with the trustee. (4) Includes $300 million of REset Put Securities due 2035 that are required to be put by the holders in October 2015 either for (a) purchase and remarketing by a remarketing dealer or (b) repurchase by PPL Energy Supply. © PPL Corporation 2012 27
© PPL Corporation 2012
28
Note: As of September 30, 2012
• Credit facilities consist of a diverse bank group, with no bank and its affiliates providing an aggregate commitment of more than 9%
of the total committed capacity for the domestic facilities and 16% of the total committed capacity for WPD’s facilities.
Liquidity Profile
Liquidity Profile Letters of Credit Outstanding & Total Commercial Expiration Facility Paper Backstop Drawn Availability Institution Facility Date (Millions) (Millions) (Millions) (Millions) PPL Energy Supply Syndicated Credit Facility Oct-2016 $3,000 $468 $ 0 $2,532 Letter of Credit Facility Mar- 2013 200 126 0 74 Uncommitted Letter of Credit Facilities 175 32 0 143 $ 3,375 $626 $0 $2,749 PPL Electric Utilities Syndicated Credit Facility Oct-2016 $300 $ 1 $ 0 $299 Asset- backed Credit Facility Sep- 2013 100 0 0 100 $ 400 $1 $0 $399 Louisville Gas & Electric Syndicated Credit Facility Oct-2016 $400 $ 0 $ 0 $400 Kentucky Utilities Syndicated Credit Facility Oct-2016 $400 $ 0 $ 0 $400 Letter of Credit Facility Apr- 2014 198 198 0 0 $ 598 $198 $0 $400 WPD PPL WW Syndicated Credit Facility Jan-2013 £ 150 £0 £107 £ 43 WPD (South West) Syndicated Credit Facility Jan-2017 245 0 0 245 WPD (East Midlands) Syndicated Credit Facility Apr- 2016 300 0 0 300 WPD ( West Midlands) Syndicated Credit Facility Apr-2016 300 0 0 300 Uncommitted Credit Facilities 84 4 0 80 £ 1,079 £4 £107 £968 Note: As of September 30, 2012 • Credit facilities consist of a diverse bank group, with no bank and its affiliates providing an aggregate commitment of more than 9% of the total committed capacity for the domestic facilities and 16% of the total committed capacity for WPD’s facilities. © PPL Corporation 2012 28
© PPL Corporation 2012
29
Reconciliation of PPL’s Earnings from
Ongoing Operations to Reported Earnings
Reconciliation of PPL’s Earnings from Ongoing Operations to Reported Earnings (Per Share - Diluted) Forecast Actual High Low 2012 2012 2011 2010 Earnings from Ongoing Operations $ 2.40 $ 2.30 $ 2.73 $ 3.13 Special Items: Adjusted energy-related economic activity, net 0.05 0.05 0.12 ( 0.27) Foreign currency-related economic hedges (0.05) ( 0.05) 0.01 Sales of assets: Maine hydroelectric generation business 0.03 Impairments: Emission allowances ( 0.02) Renewable energy credits ( 0.01) Acquisition-related adjustments: WPD Midlands 2011 Bridge Facility costs ( 0.05) Foreign currency loss on 2011 Bridge Facility ( 0.07) Net hedge gains 0.07 Hedge ineffectiveness ( 0.02) U.K. stamp duty tax (0.04) Separation benefits (0.02) ( 0.02) (0.13) Other acquisition-related adjustments ( 0.10) LKE Monetization of certain full-requirement sales contracts ( 0.29) Sale of certain non- core generation facilities ( 0.14) Discontinued cash flow hedges and ineffectiveness (0.06) Reduction of credit facility ( 0.01) 2010 Bridge Facility costs ( 0.12) Other acquisition-related adjustments (0.05) Net operating loss carryforward and other tax-related adjustments 0.01 0.01 Other: Montana hydroelectric litigation 0.08 ( 0.08) LKE discontinued operations (0.01) ( 0.01) Health care reform - tax impact ( 0.02) Litigation settlement - spent nuclear fuel storage 0.06 Change in U.K. tax rate 0.13 0.13 0.12 0.04 Windfall profits tax litigation ( 0.07) 0.03 Counterparty bankruptcy (0.01) ( 0.01) (0.01) Wholesale supply cost reimbursement 0.01 Coal contract modification payments ( 0.03) ( 0.03) Total Special Items 0.07 0.07 (0.03) ( 0.96) Reported Earnings $ 2.47 $ 2.37 $ 2.70 $ 2.17 © PPL Corporation 2012 29
© PPL Corporation 2012
30
Statements contained in this presentation, including statements with respect to future earnings, cash flows, financing, regulation and
corporate strategy are "forward-looking statements" within the meaning of the federal securities laws. Although PPL Corporation
believes that the expectations and assumptions reflected in these forward-looking statements are reasonable, these statements are
subject to a number of risks and uncertainties, and actual results may differ materially from the results discussed in the statements.
The following are among the important factors that could cause actual results to differ materially from the forward-looking statements:
market demand and prices for energy, capacity and fuel; weather conditions affecting customer energy usage and operating costs;
competition in power markets; the effect of any business or industry restructuring; the profitability and liquidity of PPL Corporation, its
subsidiaries and customers; new accounting requirements or new interpretations or applications of existing requirements; operating
performance of plants and other facilities; the length of scheduled and unscheduled outages at our generating plants; environmental
conditions and requirements and the related costs of compliance, including environmental capital expenditures and emission
allowance and other expenses; system conditions and operating costs; development of new projects, markets and technologies;
performance of new ventures; asset or business acquisitions and dispositions, and PPL Corporation's ability to realize the expected
benefits from acquired businesses, including the 2010 acquisition of Louisville Gas and Electric Company and Kentucky Utilities
Company and the 2011 acquisition of the Central Networks electricity distribution businesses in the U.K.; any impact of hurricanes or
other severe weather on our business, including any impact on fuel prices; receipt of necessary government permits, approvals, rate
relief and regulatory cost recovery; capital market conditions and decisions regarding capital structure; the impact of state, federal or
foreign investigations applicable to PPL Corporation and its subsidiaries; the outcome of litigation against PPL Corporation and its
subsidiaries; stock price performance; the market prices of equity securities and the impact on pension income and resultant cash
funding requirements for defined benefit pension plans; the securities and credit ratings of PPL Corporation and its subsidiaries;
political, regulatory or economic conditions in states, regions or countries where PPL Corporation or its subsidiaries conduct business,
including any potential effects of threatened or actual terrorism or war or other hostilities; foreign exchange rates; new state, federal or
foreign legislation, including new tax legislation; and the commitments and liabilities of PPL Corporation and its subsidiaries. Any such
forward-looking statements should be considered in light of such important factors and in conjunction with PPL Corporation's Form 10
-K and other reports on file with the Securities and Exchange Commission.
Forward-Looking Information Statement
© PPL Corporation 2012
31
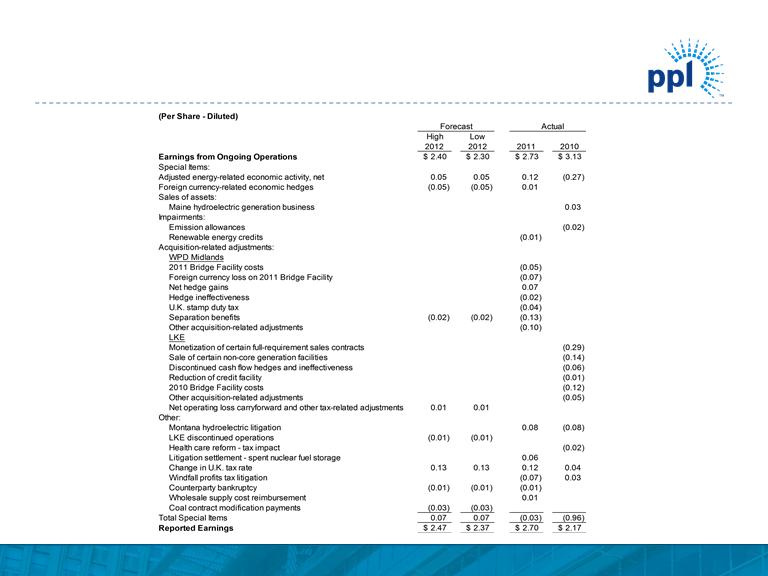
"Earnings from ongoing operations," also referred to as "ongoing earnings," should not be considered as an alternative to reported earnings, or
net income attributable to PPL shareowners, which is an indicator of operating performance determined in accordance with generally accepted
accounting principles (GAAP). PPL believes that "earnings from ongoing operations," although a non-GAAP financial measure, is also useful and
meaningful to investors because it provides management’s view of PPL’s fundamental earnings performance as another criterion in making
investment decisions. PPL’s management also uses “earnings from ongoing operations” in measuring certain corporate performance goals.
Other companies may use different measures to present financial performance.
"Earnings from ongoing operations" is adjusted for the impact of special items. Special items include:
• Adjusted energy-related economic activity (as discussed below).
• Foreign currency-related economic hedges.
• Gains and losses on sales of assets not in the ordinary course of business.
• Impairment charges (including impairments of securities in the company’s nuclear decommissioning trust funds).
• Workforce reduction and other restructuring impacts.
• Acquisition-related adjustments.
• Other charges or credits that are, in management’s view, not reflective of the company's ongoing operations.
Adjusted energy-related economic activity includes the changes in fair value of positions used economically to hedge a portion of the economic
value of PPL's generation assets, full-requirement sales contracts and retail activities. This economic value is subject to changes in fair value due
to market price volatility of the input and output commodities (e.g., fuel and power) prior to the delivery period that was hedged. Also included in
adjusted energy-related economic activity is the ineffective portion of qualifying cash flow hedges, the monetization of certain full-requirement
sales contracts and premium amortization associated with options. This economic activity is deferred, with the exception of the full-requirement
sales contracts that were monetized, and included in earnings from ongoing operations over the delivery period of the item that was hedged or
upon realization. Management believes that adjusting for such amounts provides a better matching of earnings from ongoing operations to the
actual amounts settled for PPL's underlying hedged assets. Please refer to the Notes to the Financial Statements and MD&A in PPL
Corporation’s periodic filings with the Securities and Exchange Commission for additional information on energy-related economic activity.
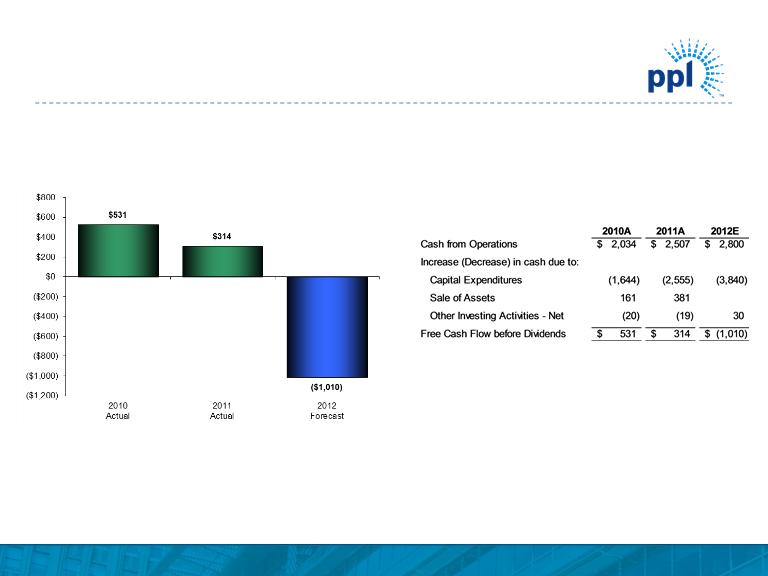
Free cash flow before dividends is derived by deducting capital expenditures and other investing activities-net, from cash flow from operations.
Free cash flow before dividends should not be considered as an alternative to cash flow from operations, which is determined in accordance with
GAAP. PPL believes that free cash flow before dividends, although a non-GAAP measure, is an important measure to both management and
investors, as it is an indicator of the company's ability to sustain operations and growth without additional outside financing beyond the
requirement to fund maturing debt obligations. Other companies may calculate free cash flow before dividends in a different manner.
Definitions of Non-GAAP Financial Measures
© PPL Corporation 2012
32
"Kentucky Gross Margins" is a single financial performance measure of the Kentucky Regulated segment's electricity generation, transmission
and distribution operations as well as its distribution and sale of natural gas. In calculating this measure, utility revenues and expenses
associated with approved cost recovery tracking mechanisms are offset. Certain costs associated with these mechanisms, primarily ECR and
DSM, are recorded as "Other operation and maintenance“ and "Depreciation." These mechanisms allow for recovery of certain expenses,
returns on capital investments and performance incentives. As a result, this measure represents the net revenues from the Kentucky Regulated
segment's operations.
"Pennsylvania Gross Delivery Margins" is a single financial performance measure of the Pennsylvania Regulated segment's electric delivery
operations, which includes transmission and distribution activities. In calculating this measure, utility revenues and expenses associated with
approved recovery mechanisms, including energy provided as a PLR, are offset with minimal impact on earnings. Costs associated with these
mechanisms are recorded in "Energy purchases," "Other operation and maintenance,“ which is primarily Act 129 costs, and in "Taxes, other
than income," which is primarily gross receipts tax. This performance measure includes PLR energy purchases by PPL Electric from PPL
EnergyPlus, which are reflected in "PLR intersegment utility revenue (expense)." As a result, this measure represents the net revenues from the
Pennsylvania Regulated segment's electric delivery operations.
"Unregulated Gross Energy Margins" is a single financial performance measure of the Supply segment's competitive energy non-trading and
trading activities. In calculating this measure, the Supply segment's energy revenues, which include operating revenues associated with certain
Supply segment businesses that are classified as discontinued operations, are offset by the cost of fuel, energy purchases, certain other
operation and maintenance expenses, primarily ancillary charges, gross receipts tax, which is recorded in "Taxes, other than income," and
operating expenses associated with certain Supply segment businesses that are classified as discontinued operations. This performance
measure is relevant to PPL due to the volatility in the individual revenue and expense lines on the Statements of Income that comprise
"Unregulated Gross Energy Margins." This volatility stems from a number of factors, including the required netting of certain transactions with
ISOs and significant swings in unrealized gains and losses. Such factors could result in gains or losses being recorded in either "Wholesale
energy marketing" or "Energy purchases" on the Statements of Income. This performance measure includes PLR revenues from energy sales
to PPL Electric by PPL EnergyPlus, which are reflected in "PLR intersegment utility revenue (expense)." PPL excludes from "Unregulated
Gross Energy Margins" the Supply segment's adjusted energy-related economic activity, which includes the changes in fair value of positions
used to economically hedge a portion of the economic value of PPL's competitive generation assets, full-requirement sales contracts and retail
activities. This economic value is subject to changes in fair value due to market price volatility of the input and output commodities (e.g., fuel
and power) prior to the delivery period that was hedged. Also included in this energy-related economic activity is the ineffective portion of
qualifying cash flow hedges, the monetization of certain full-requirement sales contracts and premium amortization associated with options. This
economic activity is deferred, with the exception of the full-requirement sales contracts that were monetized, and included in unregulated gross
energy margins over the delivery period that was hedged or upon realization.
Definitions of Non-GAAP Financial Measures