
© PPL Corporation 2016 DRAFT 1st Quarter Earnings Call –4th DRAFT PPL Corporation April 28, 2016 Exhibit 99.2

© PPL Corporation 2016 DRAFT Cautionary Statements and Factors That May Affect Future Results Anystatementsmadeinthispresentationaboutfutureoperating resultsorotherfutureeventsareforward-lookingstatements under the Safe Harbor Provisions of the Private Securities LitigationReformActof1995.Actualresultsmaydiffermaterially fromsuchforward-lookingstatements.Adiscussionoffactors thatcouldcauseactualresultsoreventstodifferiscontainedin theAppendixtothispresentationandintheCompany’sSEC filings. 2
© PPL Corporation 2016 DRAFT 1 st Quarter 2016 Earnings Resultsand Operational Overview U.K. Incentive Revenues Update Segment Results and Financial Overview Q&A W. H. Spence V. Sorgi Agenda 3 R. Symons
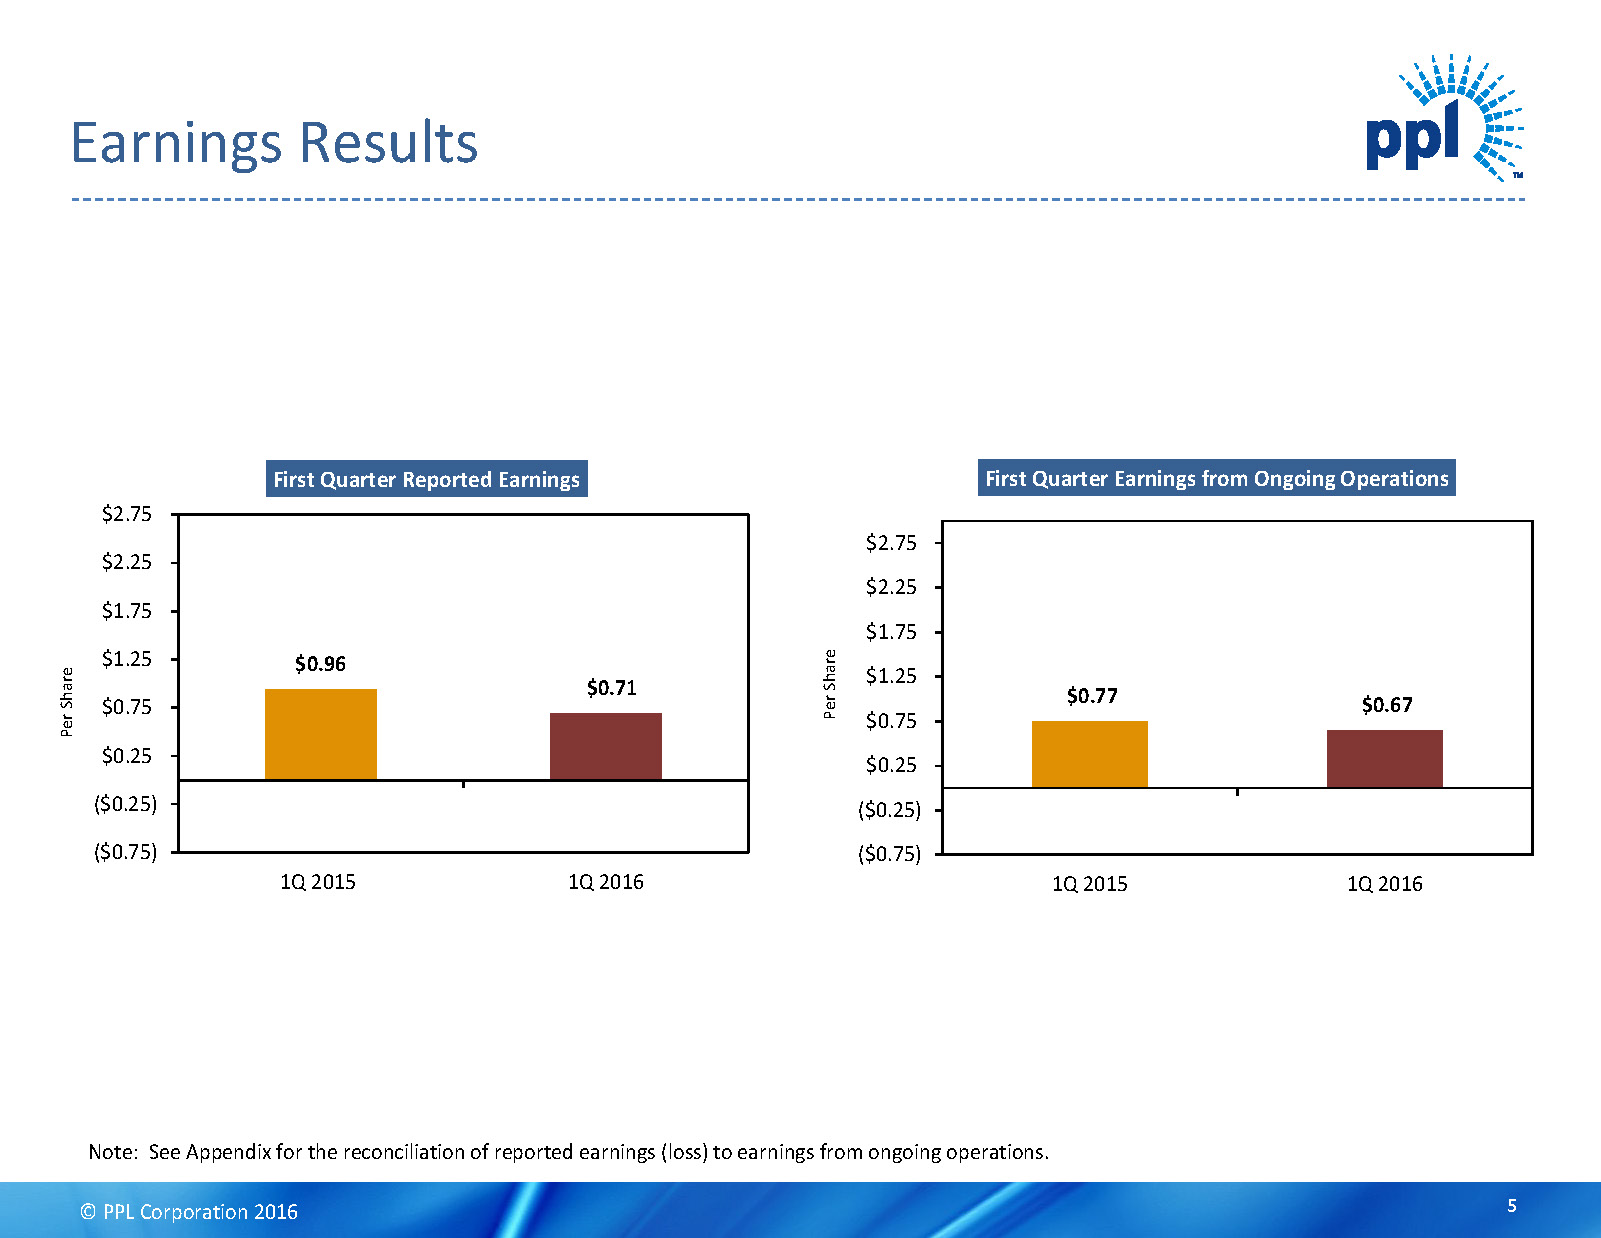
© PPL Corporation 2016 DRAFT $0.96 $0.71 ($0.75) ($0.25) $0.25 $0.75 $1.25 $1.75 $2.25 $2.75 1Q 2015 1Q 2016 First Quarter Reported Earnings P e r S h a r e Note: See Appendix for the reconciliation of reported earnings (loss) to earnings from ongoing operations. Earnings Results $0.77 $0.67 ($0.75) ($0.25) $0.25 $0.75 $1.25 $1.75 $2.25 $2.75 1Q 2015 1Q 2016 First Quarter Earnings from Ongoing Operations P e r S h a r e 4
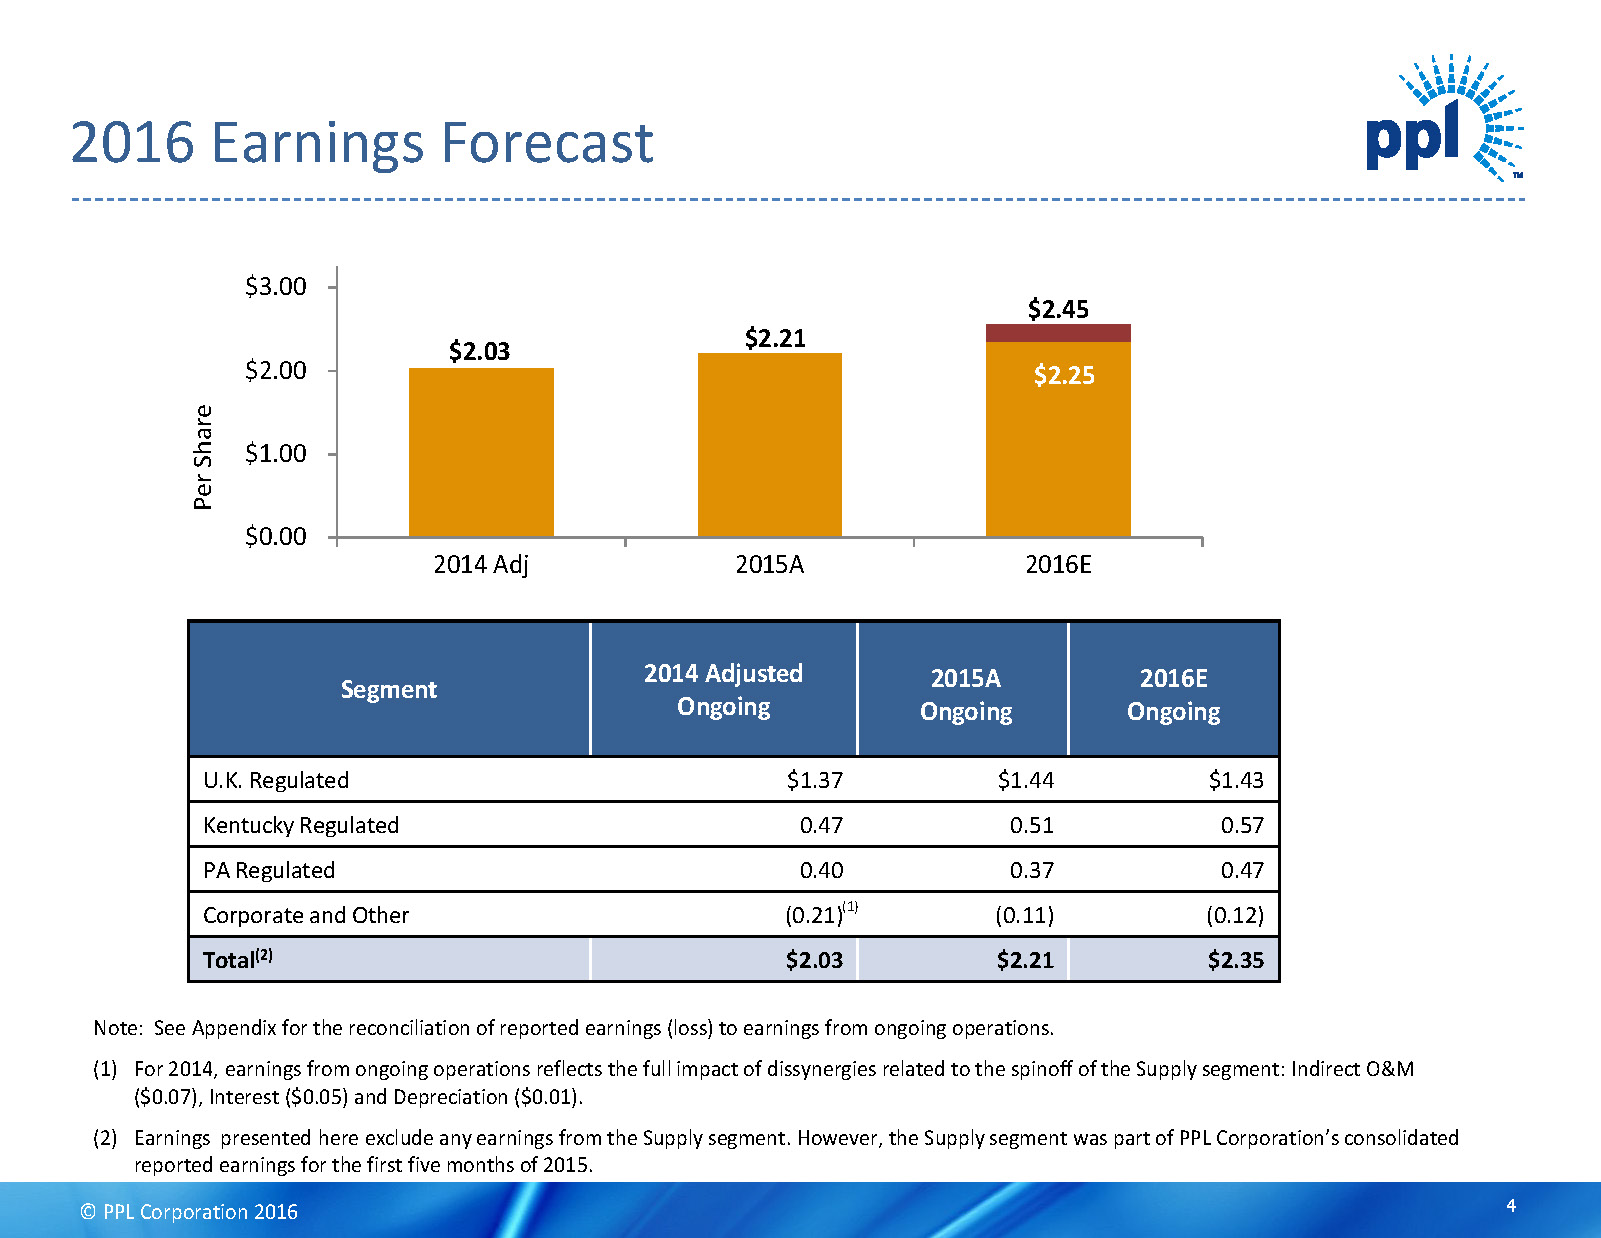
© PPL Corporation 2016 DRAFT $0.00 $1.00 $2.00 $3.00 2014 Adj 2015A 2016E $2.25 $2.21 P e r S h a r e 2016 Earnings Forecast $2.03 Note: See Appendix for the reconciliation of reported earnings (loss) to earnings from ongoing operations. (1) For 2014, earnings from ongoing operations reflects the full impact of dissynergies related to the spinoff of the Supply segment: Indirect O&M ($0.07), Interest ($0.05) and Depreciation ($0.01). (2) Earnings presented here exclude any earnings from the Supply segment. However, the Supply segment was part of PPL Corporation’s consolidated reported earnings for the first five months of 2015. Segment 2014 Adjusted Ongoing 2015A Ongoing 2016E Ongoing U.K. Regulated $1.37 $1.44 $1.43 Kentucky Regulated 0.47 0.51 0.57 PA Regulated 0.40 0.37 0.47 Corporate and Other (0.21) (0.11) (0.12) Total (2) $2.03 $2.21 $2.35 $2.45 (1) 5
© PPL Corporation 2016 DRAFT Pennsylvania • $350M Northeast Pocono Transmission Line In-Service Kentucky • Environmental Update • Construction projects progressing as scheduled U.K. • Strong performance against RIIO-ED1 incentive targets Operational Update 6
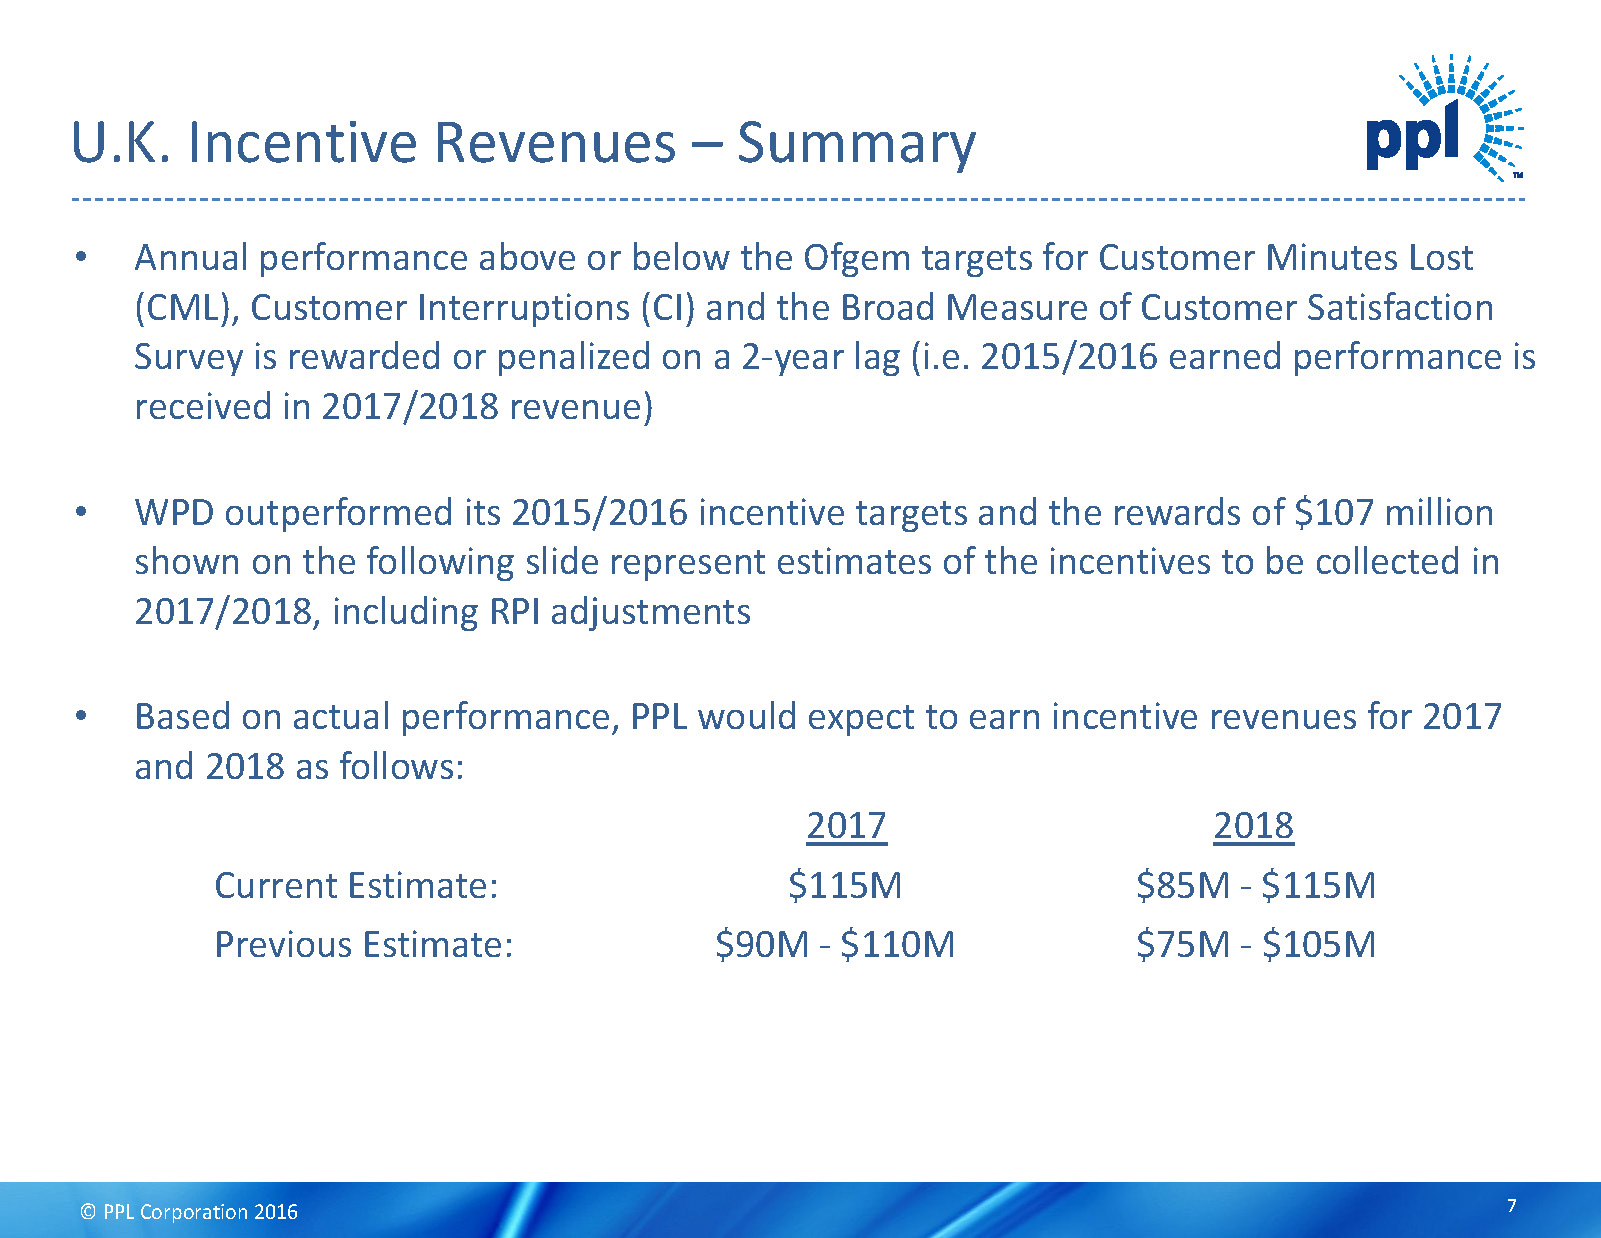
© PPL Corporation 2016 DRAFT U.K. Incentive Revenues –Summary • Annual performance above or below the Ofgem targets for Customer Minutes Lost (CML), Customer Interruptions (CI) and the Broad Measure of Customer Satisfaction Survey is rewarded or penalized on a 2-year lag (i.e. 2015/2016 earned performance is received in 2017/2018 revenue) • Rewards/penalties shown on the following slides from the Fast-track Determination are stated in 2012/2013 prices; therefore, we adjust for RPI as necessary • WPD outperformed its 2015/2016 incentive targets and our estimate for total 2015/2016 incentive revenues is $107 million compared to our prior estimate of between $xx million • Based on actual performance, PPL would expect to earn incentive revenues for 2017 and 2018 as follows: 2017 2018 Estimate: $115M $85M -$115M(previously $75M-$105M) 7
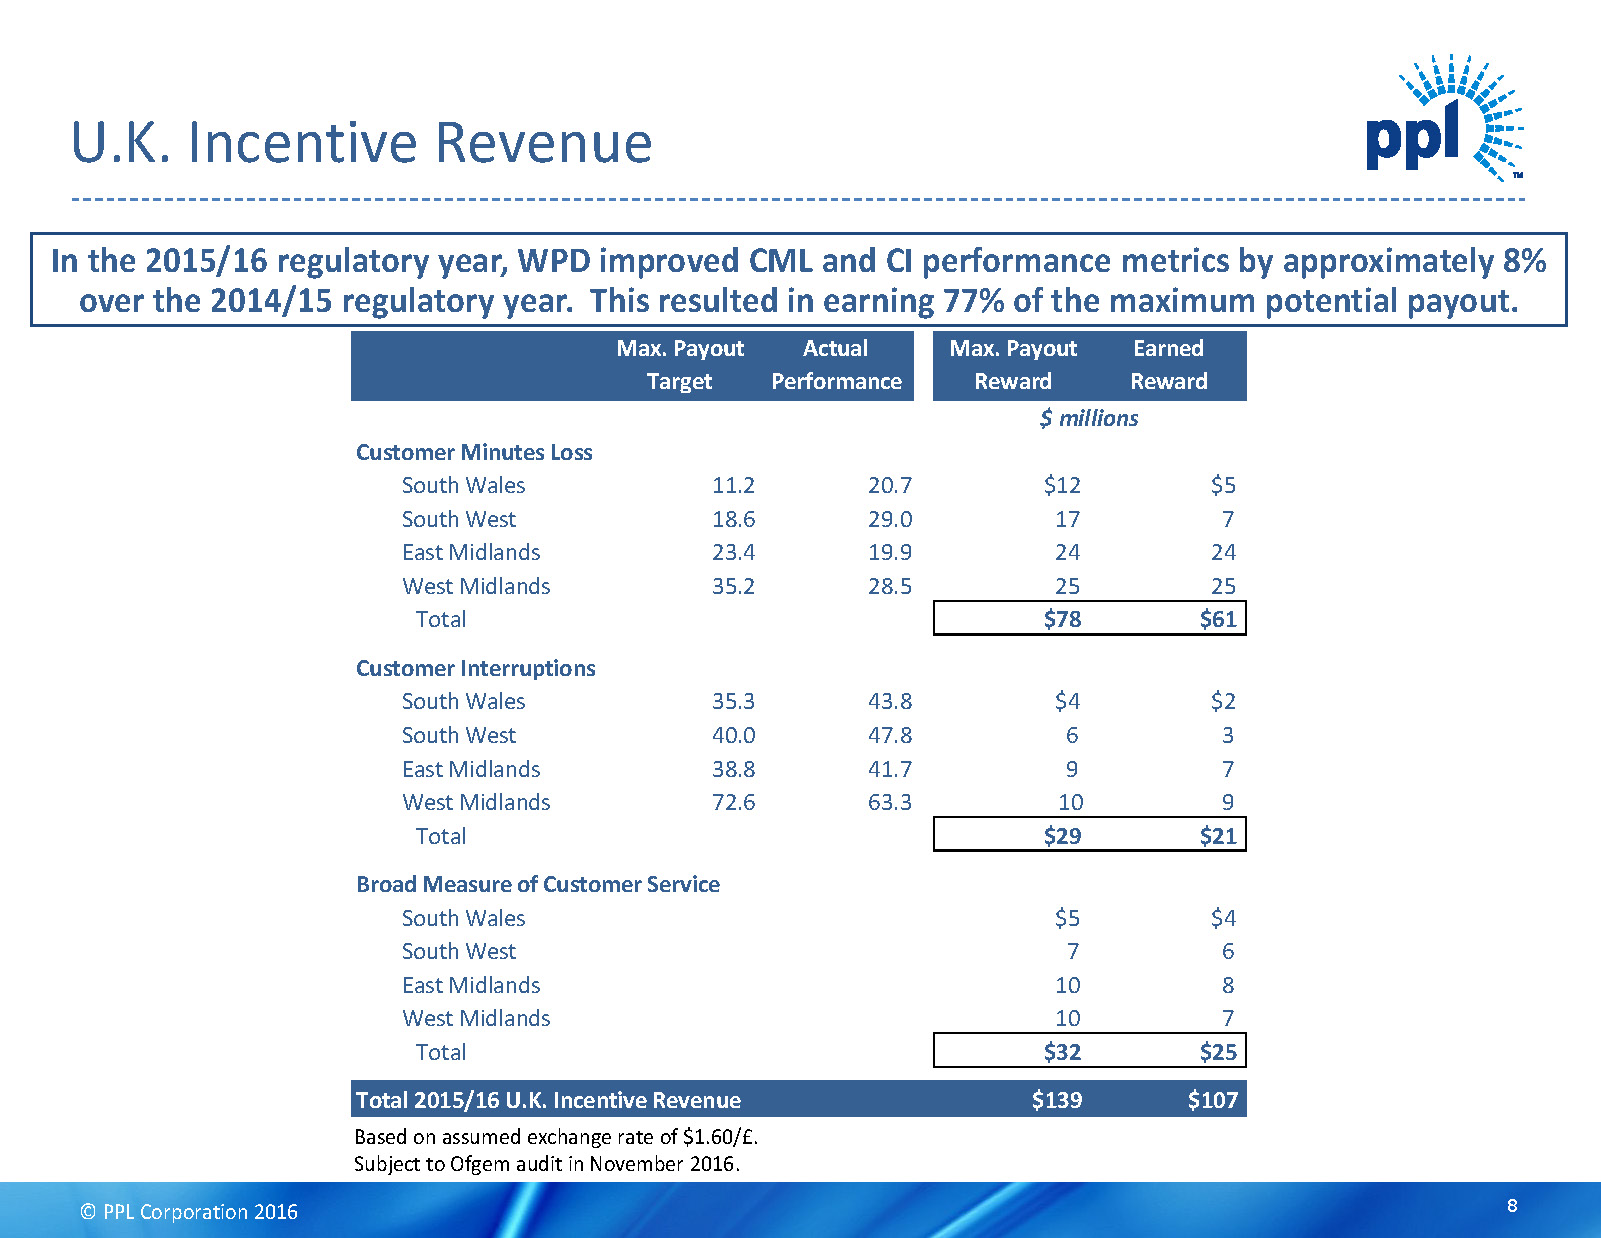
© PPL Corporation 2016 DRAFT U.K. Incentive Revenue 8 In the 2015/16 regulatory year, WPD improved performance by xx%over prior year which resulted in earning 77% of the maximum payout. Based on assumed exchange rate of $1.60/£. Subject to Ofgem audit in November 2016. Max. Payout Actual Max. Payout Earned Target Performance Award Award Customer Minutes Loss South Wales 11.2 20.7 $11.6 $4.8 South West 18.6 29.0 17.2 6.8 East Midlands 23.4 19.9 24.1 24.1 West Midlands 35.2 28.5 25.1 25.1 Total $78.0 $60.8 Customer Interruptions South Wales 35.3 43.8 $4.2 $1.8 South West 40.0 47.8 6.4 3.2 East Midlands 38.8 41.7 8.9 6.9 West Midlands 72.6 63.3 9.1 9.1 Total $28.6 $21.0 Broad Measure of Customer Service South Wales $4.8 $3.9 South West 7.1 5.6 East Midlands 10.2 8.1 West Midlands 10.2 7.7 Total $32.2 $25.3 Total U.K. Incentive Revenue $138.8 $107.1

© PPL Corporation 2016 DRAFT Summary Financial Highlights 9
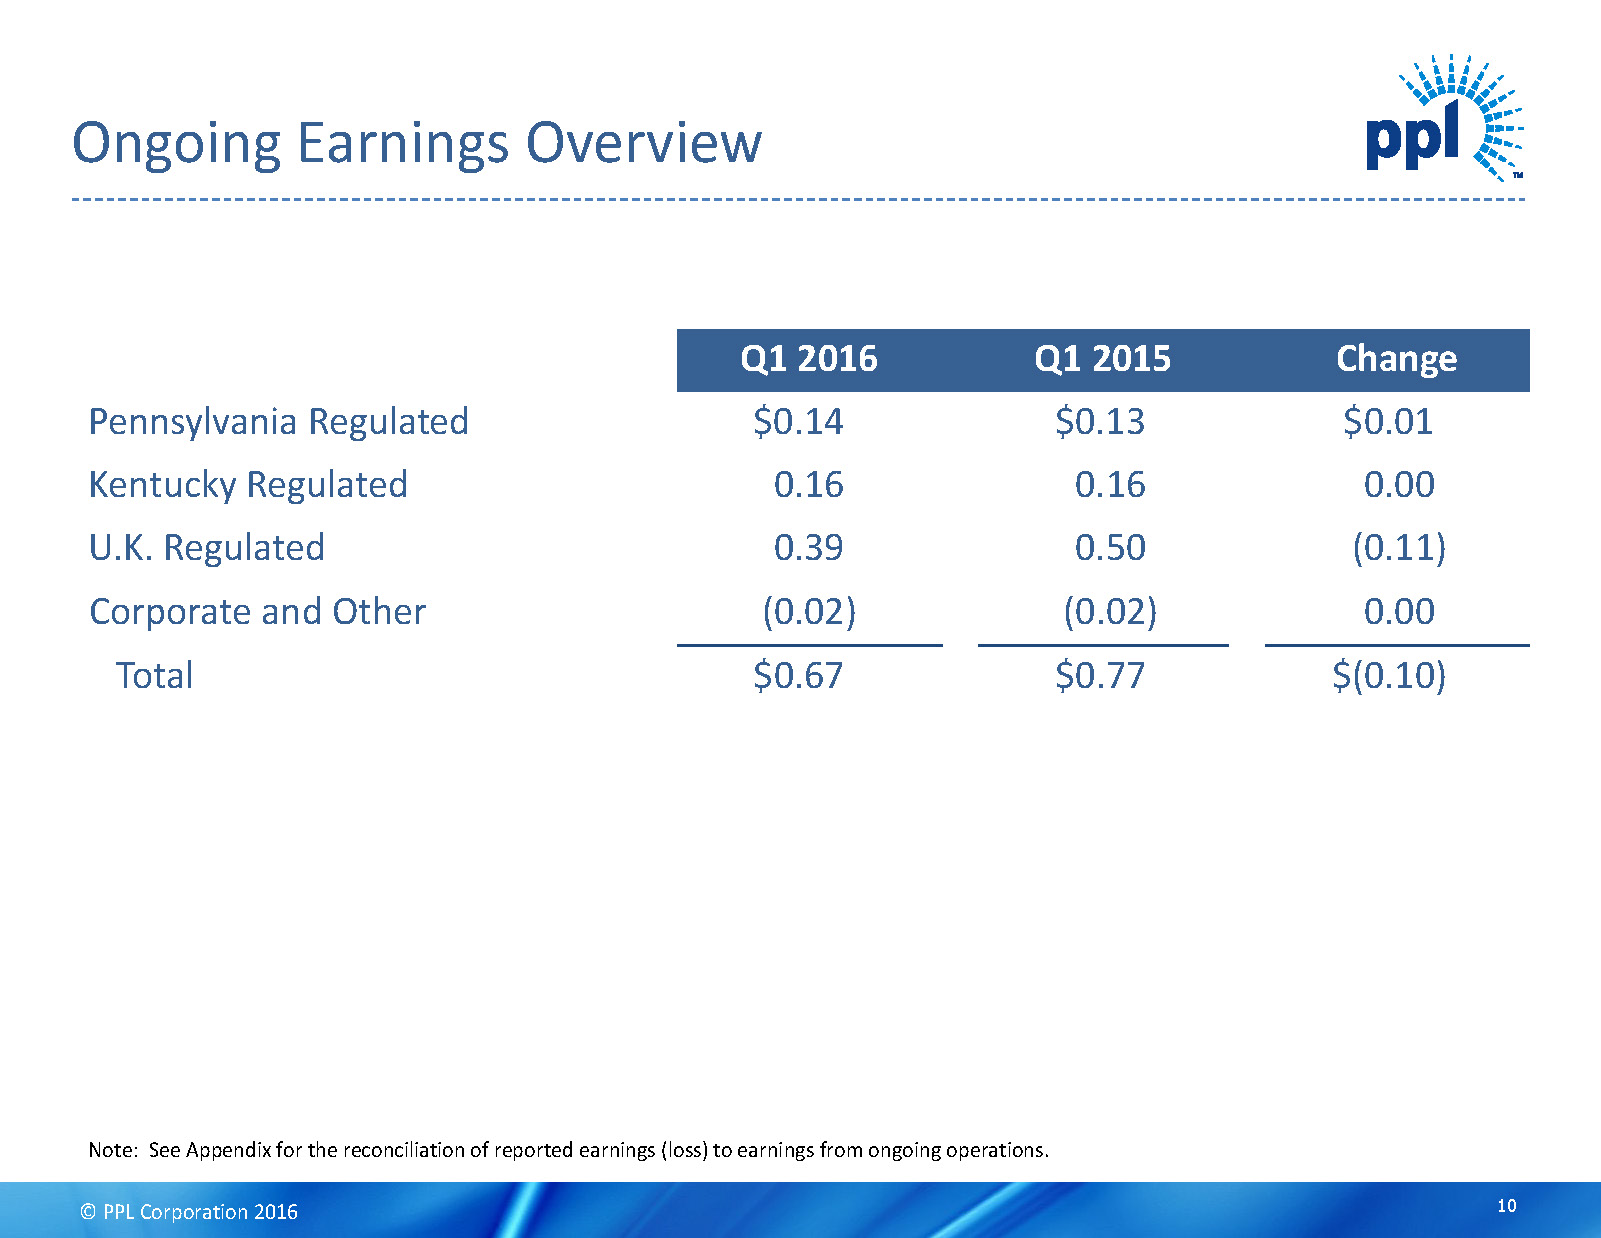
© PPL Corporation 2016 DRAFT Q1 2016 Q1 2015 Change Pennsylvania Regulated $0.14 $0.13 $0.01 Kentucky Regulated 0.16 0.16 0.00 U.K. Regulated 0.39 0.50 (0.11) Corporate and Other (0.02) (0.02) 0.00 Total $0.67 $0.77 $(0.10) Ongoing Earnings Overview Note: See Appendix for the reconciliation of reported earnings (loss) to earnings from ongoing operations. 10
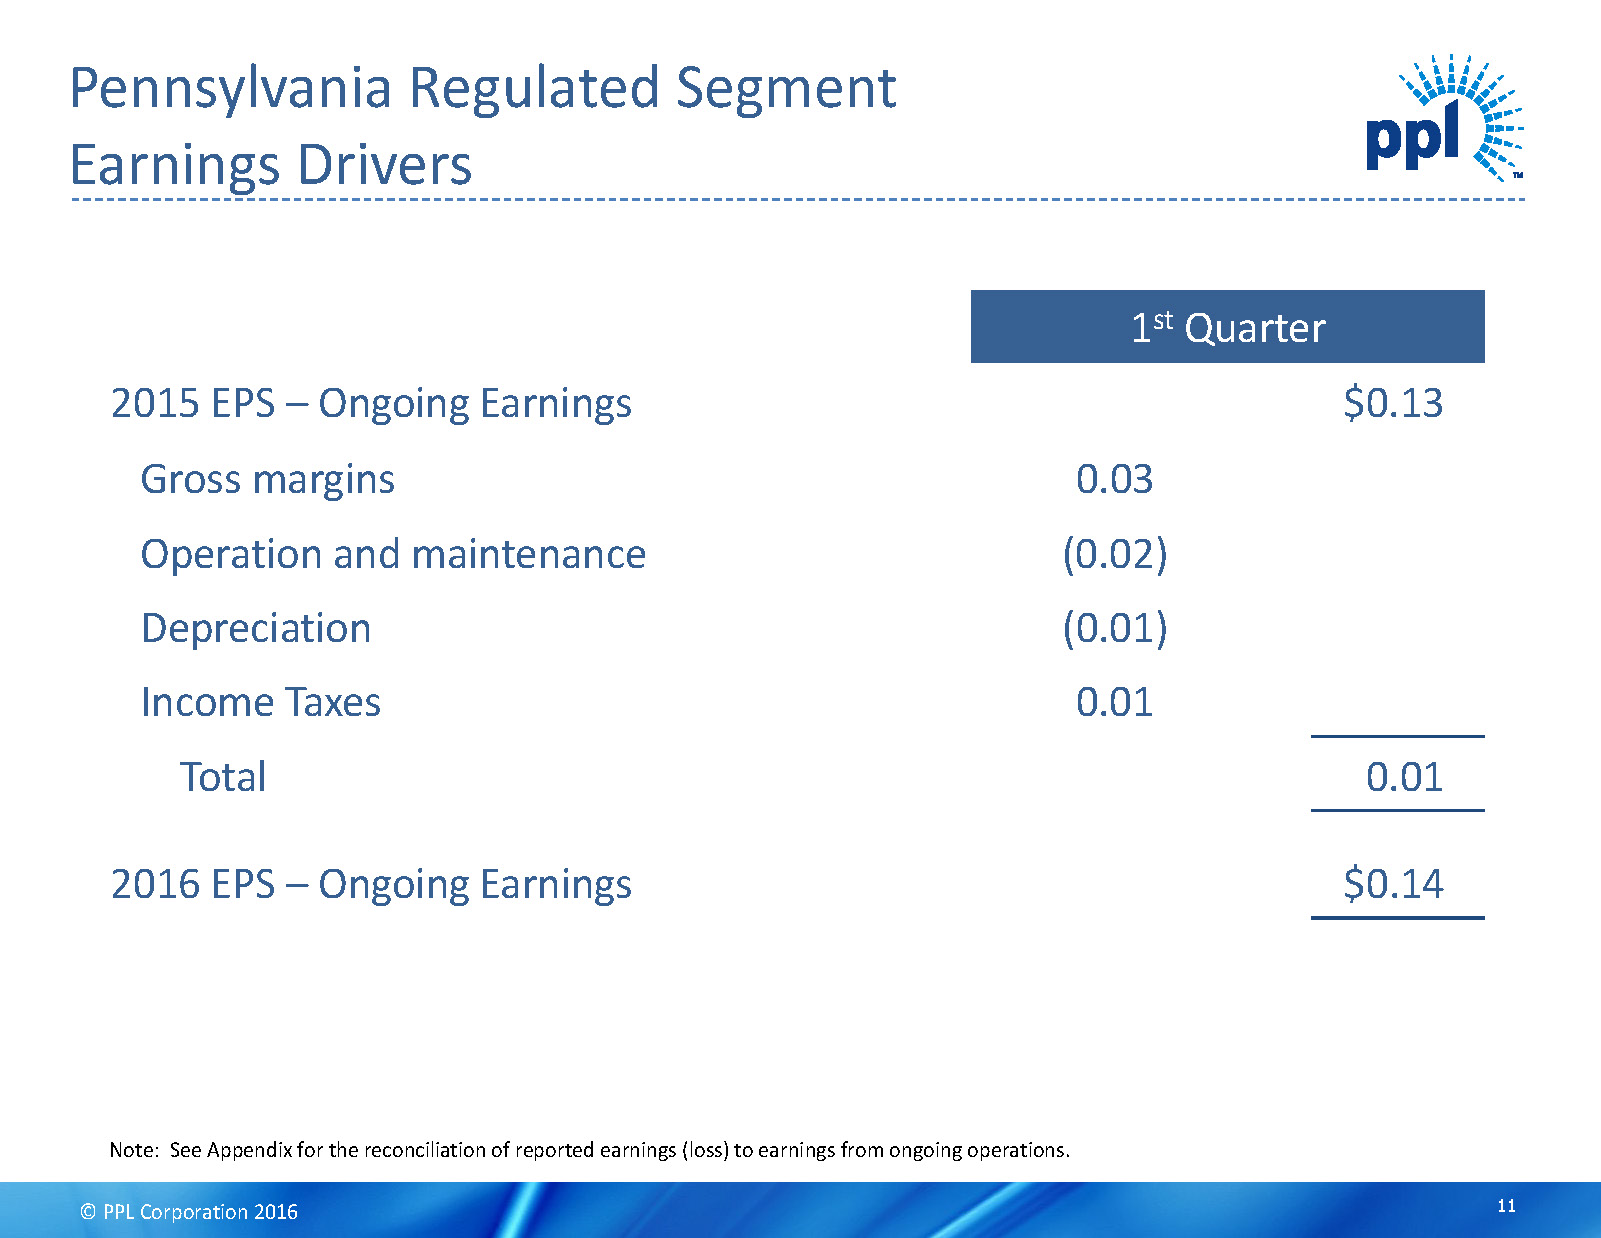
© PPL Corporation 2016 DRAFT 1 st Quarter 2015 EPS –Ongoing Earnings $0.13 Gross margins 0.03 Operation and maintenance (0.02) Depreciation (0.01) Income Taxes 0.01 Total 0.01 2016 EPS –Ongoing Earnings $0.14 Pennsylvania Regulated Segment Earnings Drivers Note: See Appendix for the reconciliation of reported earnings (loss) to earnings from ongoing operations. 11
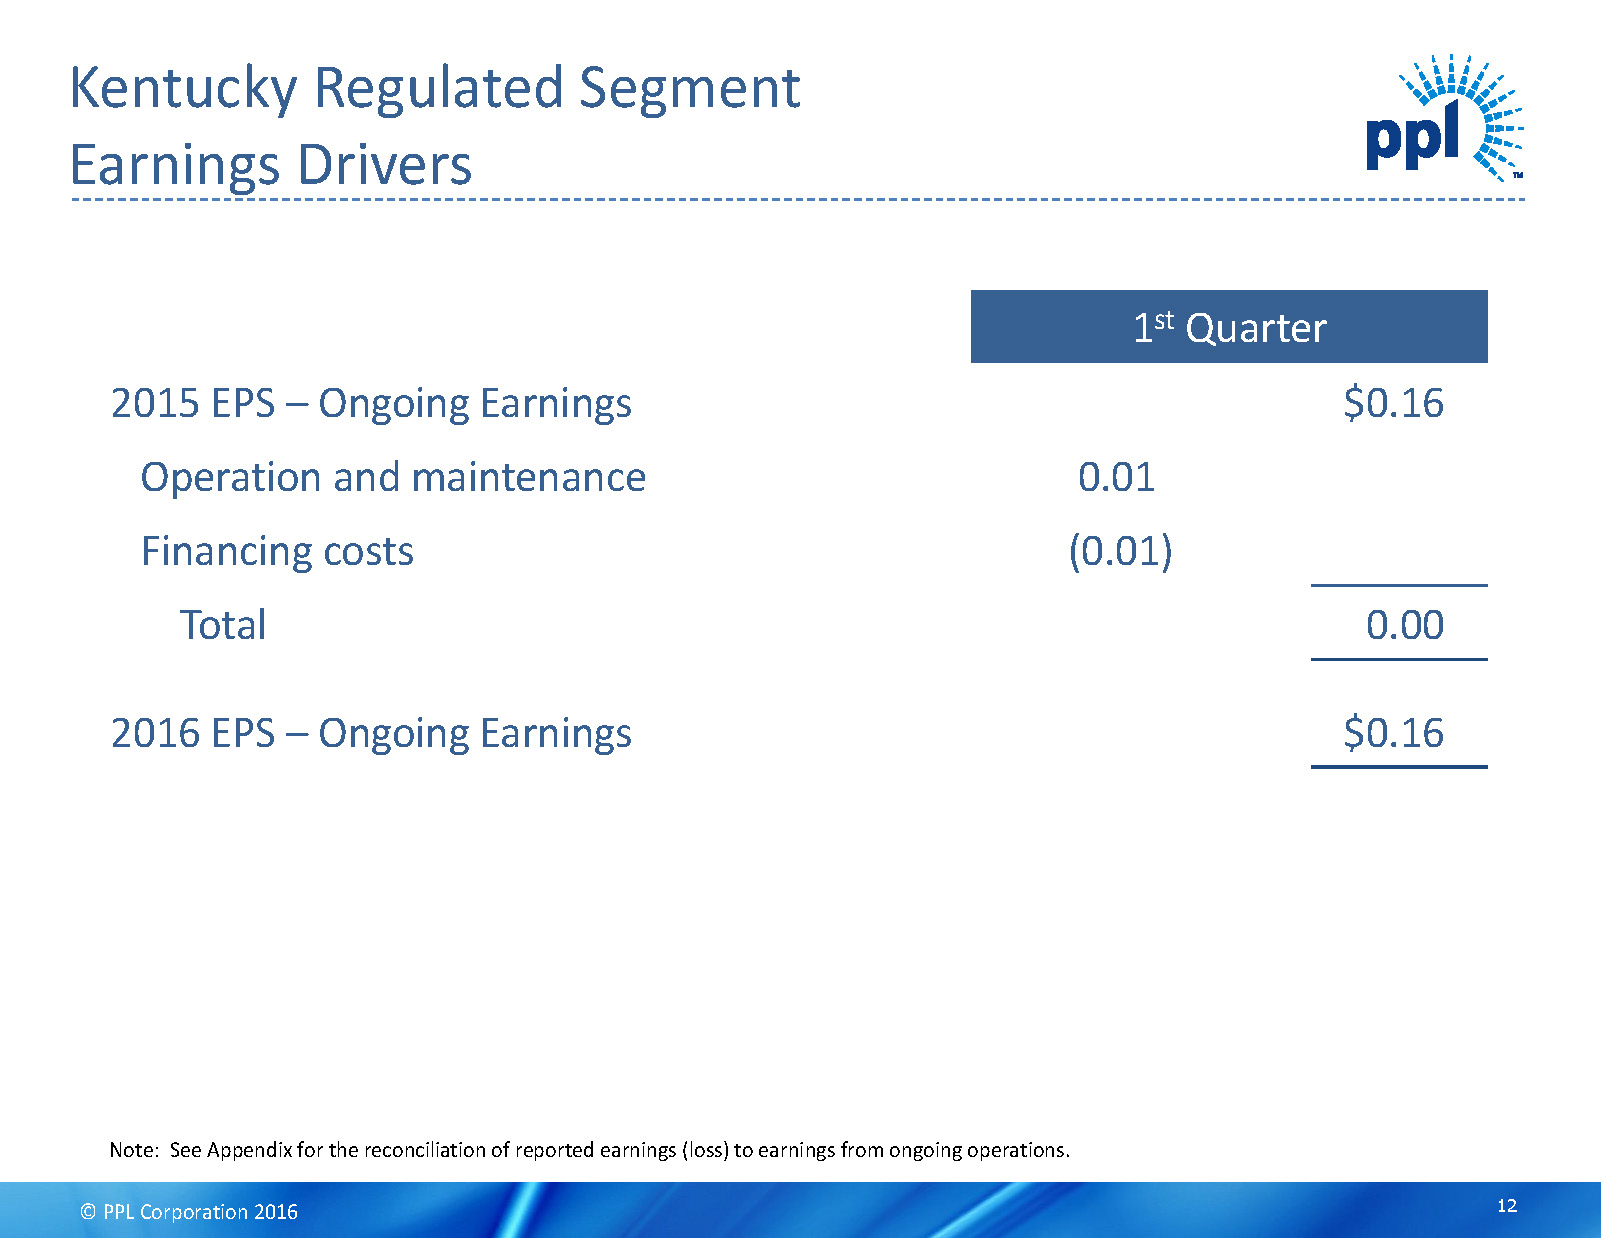
© PPL Corporation 2016 DRAFT 1 st Quarter 2015 EPS –Ongoing Earnings $0.16 Operation and maintenance 0.01 Financing costs (0.01) Total 0.00 2016 EPS –Ongoing Earnings $0.16 Kentucky Regulated Segment Earnings Drivers Note: See Appendix for the reconciliation of reported earnings (loss) to earnings from ongoing operations. 12
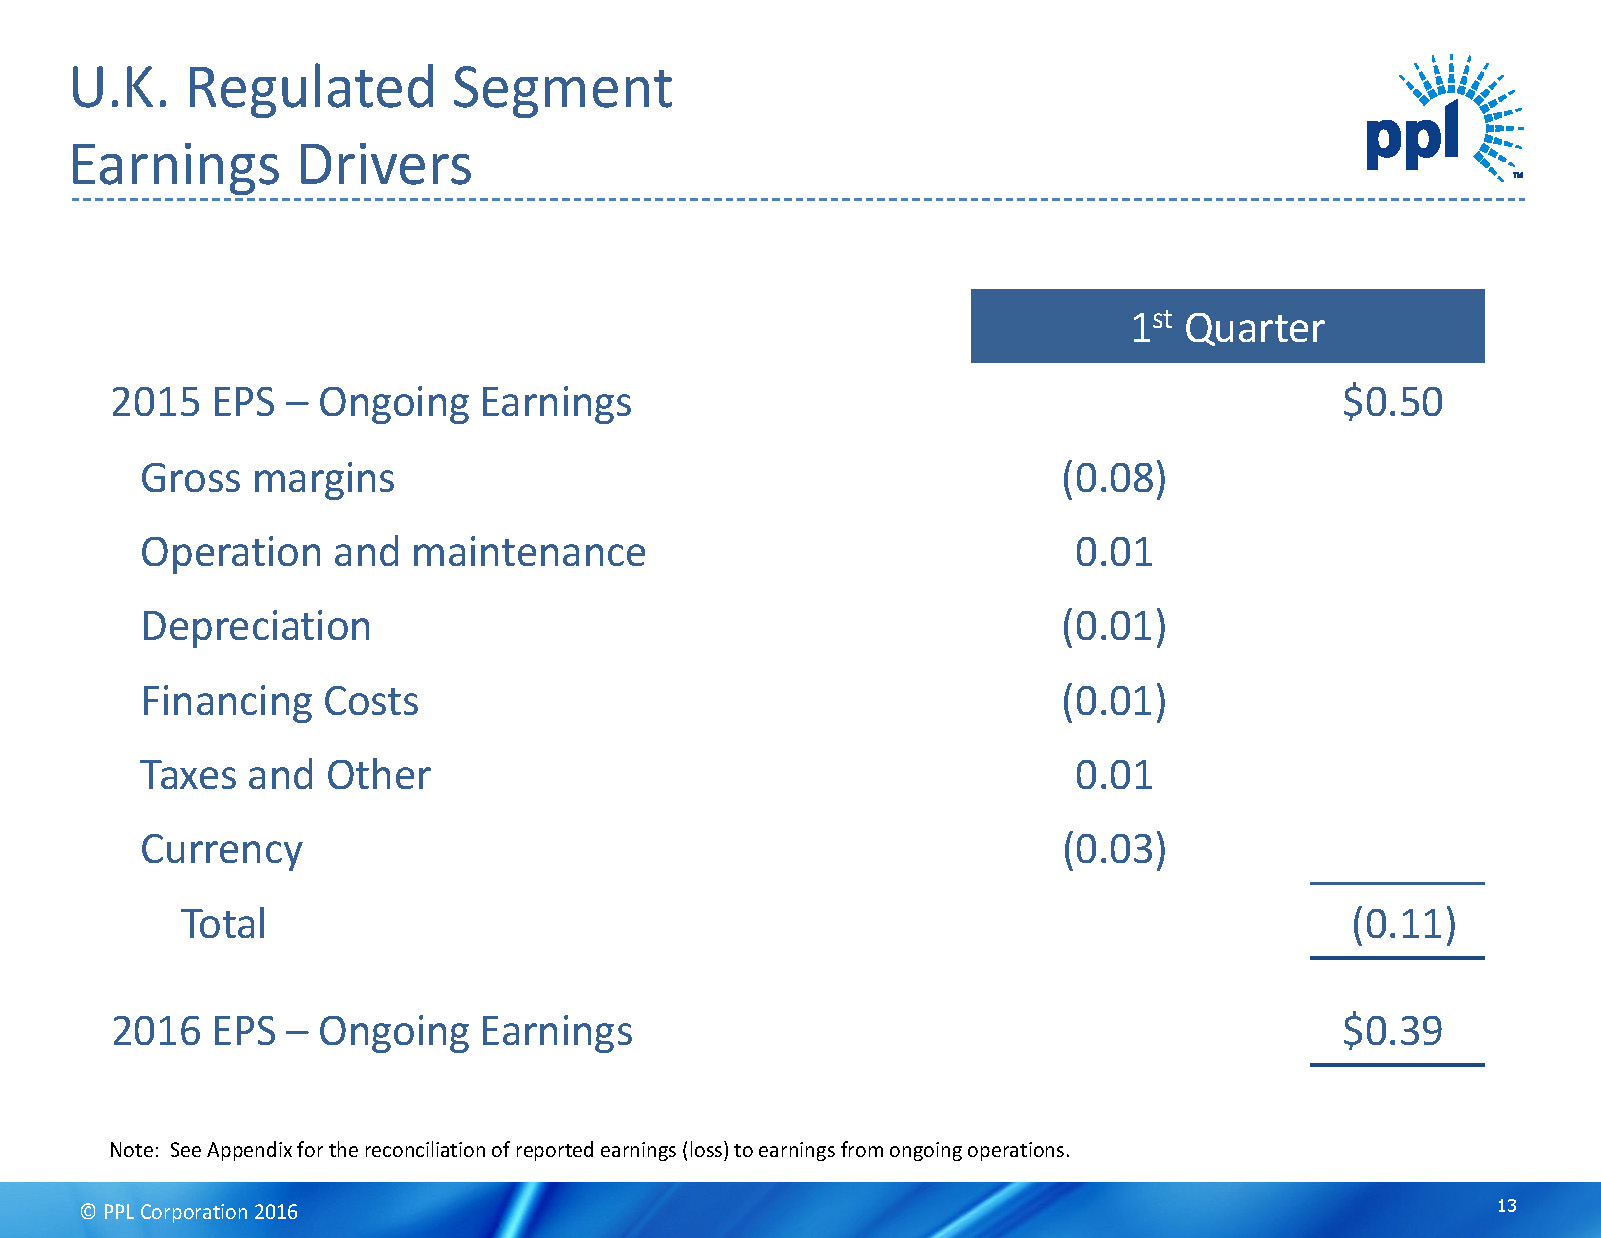
© PPL Corporation 2016 DRAFT 1 st Quarter 2015 EPS –Ongoing Earnings $0.50 Gross margins (0.08) Operation and maintenance 0.01 Depreciation (0.01) Financing Costs (0.01) Taxes and Other 0.01 Currency (0.03) Total (0.11) 2016 EPS –Ongoing Earnings $0.39 U.K. Regulated Segment Earnings Drivers Note: See Appendix for the reconciliation of reported earnings (loss) to earnings from ongoing operations. 13
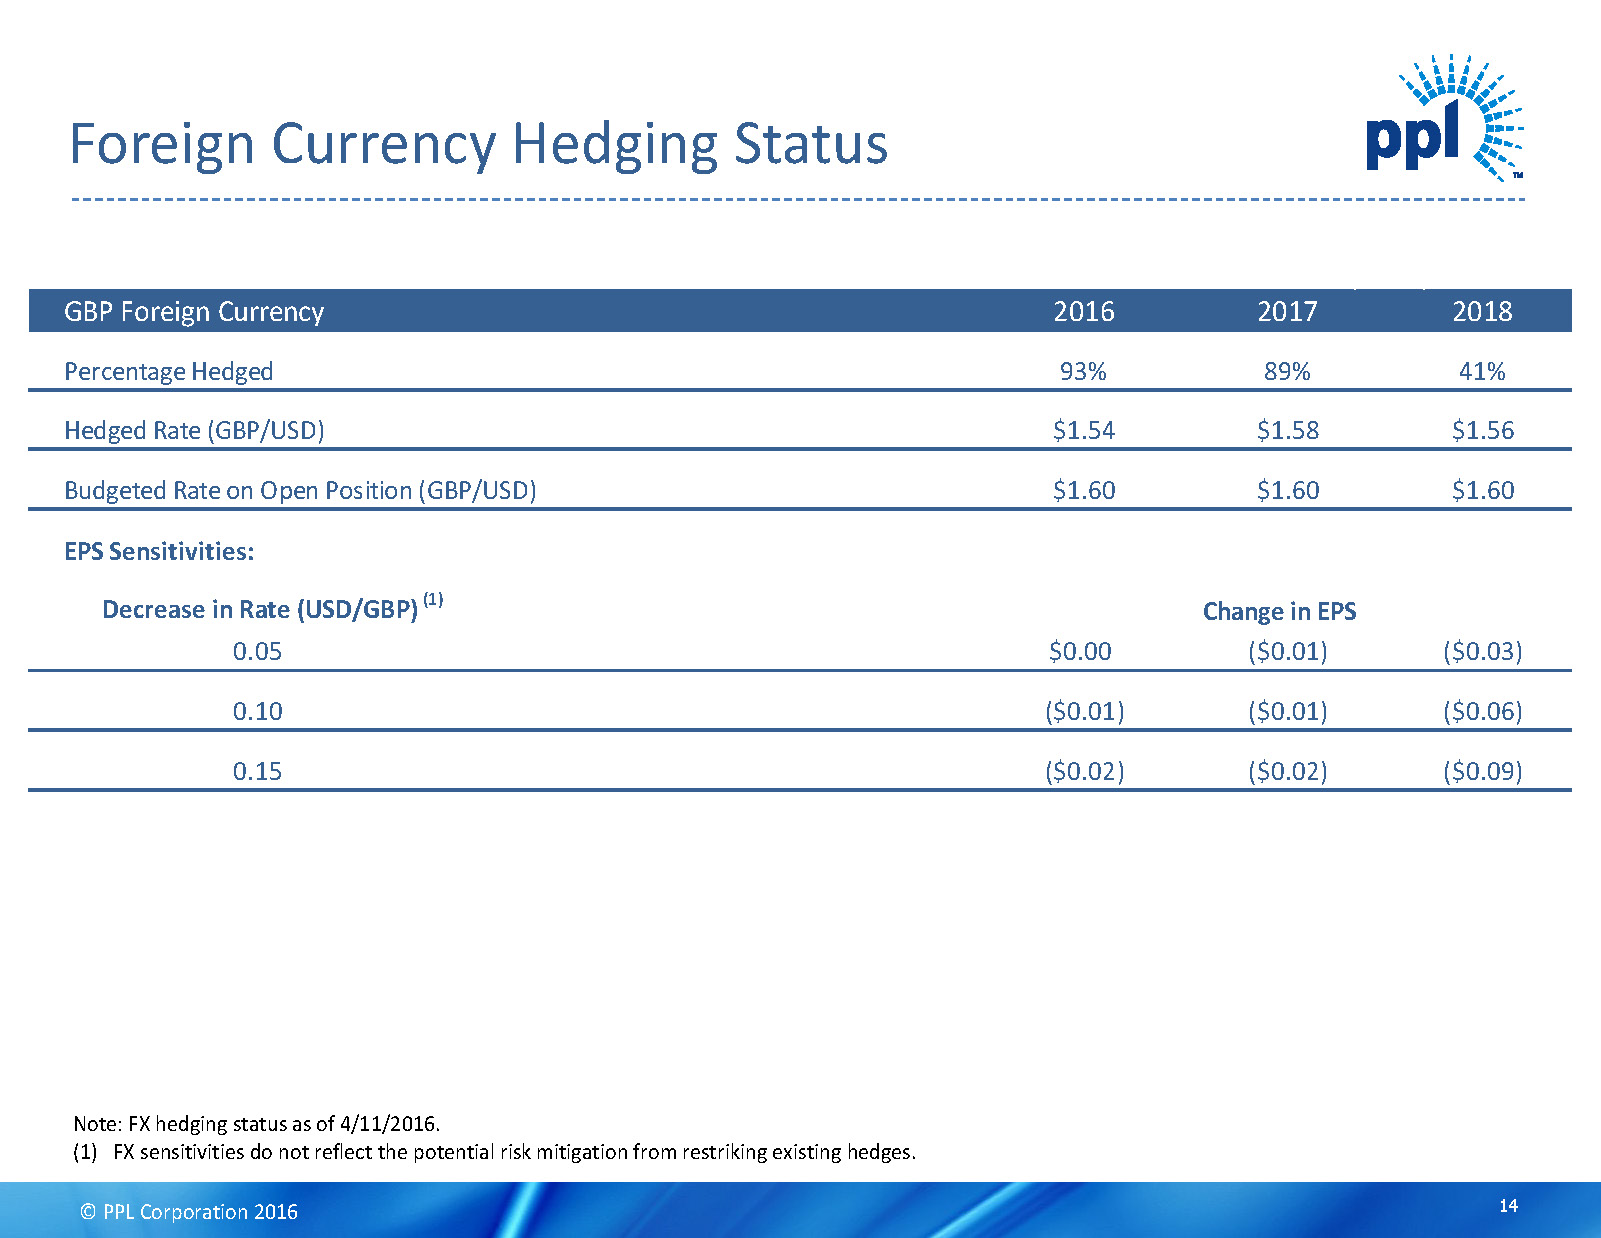
© PPL Corporation 2016 DRAFT Foreign Currency Hedging Status 14 Note: FX hedging status as of 4/11/2016. (1) FX sensitivities do not reflect the potential risk mitigation from restriking existing hedges. GBP Foreign Currency 2016 2017 2018 Percentage Hedged 93% 89% 41% Hedged Rate (GBP/USD) $1.54 $1.58 $1.56 Budgeted Rate on Open Position (GBP/USD) $1.60 $1.60 $1.60 EPS Sensitivities: Decrease in Rate (USD/GBP) (1) 0.05 $0.00 ($0.01) ($0.03) 0.10 ($0.01) ($0.01) ($0.06) 0.15 ($0.02) ($0.02) ($0.09) Change in EPS
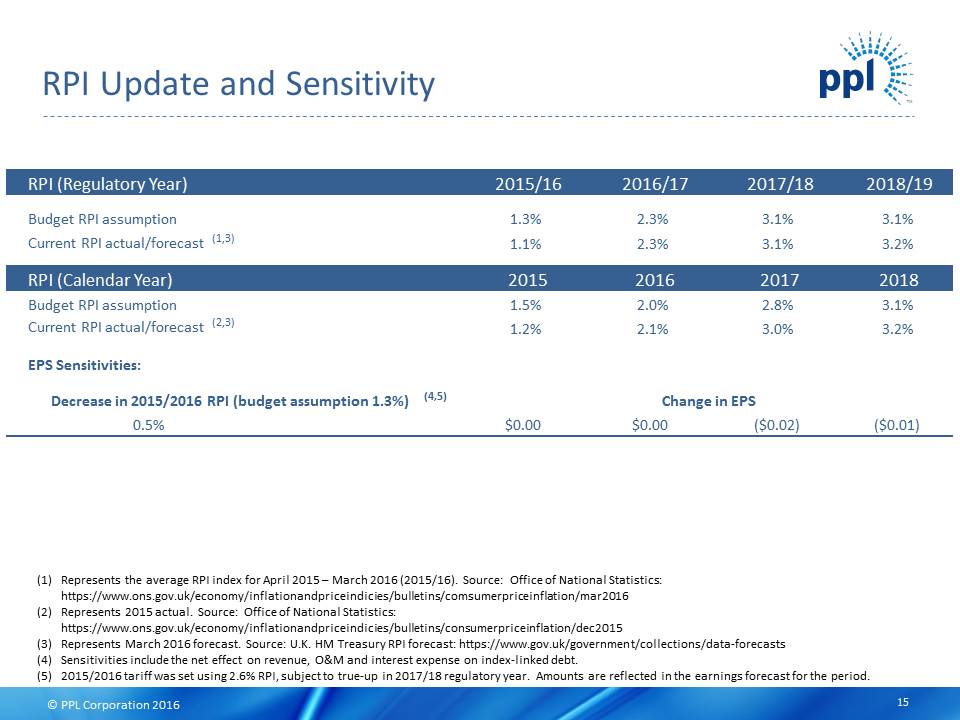
© PPL Corporation 2016 DRAFT RPI Update and Sensitivity 15 RPI (Regulatory Year) 2015/16 2016/17 2017/18 2018/19 Budget RPI assumption 1.3% 2.3% 3.1% 3.1% Current RPI actual/forecast (1,3) 1.1% 2.3% 3.1% 3.2% RPI (Calendar Year) 2015 2016 2017 2018 Budget RPI assumption 1.5% 2.0% 2.8% 3.1% Current RPI actual/forecast (2,3) 1.2% 2.1% 3.0% 3.2% EPS Sensitivities: Decrease in 2015/2016 RPI (budget assumption 1.3%) (4,5) 0.5% $0.00 $0.00 ($0.02) ($0.01) Change in EPS (1) Represents the average RPI index for April 2015 –March 2016 (2015/16). Source: Office of National Statistics: https://www.ons.gov.uk/economy/inflationandpriceindicies/bulletins/comsumerpriceinflation/mar2016 (2) Represents 2015 actual. Source: Office of National Statistics: https://www.ons.gov.uk/economy/inflationandpriceindicies/bulletins/consumerpriceinflation/dec2015 (3) Represents March 2016 forecast. Source: U.K. HM Treasury RPI forecast: https://www.gov.uk/government/collections/data-forecasts (4) Sensitivities include the net effect on revenue, O&M and interest expense on index-linked debt. (5) 2015/2016 tariff was set using 2.6% RPI, subject to true-up in 2017/18 regulatory year. Amounts are reflected in the earnings forecast for the period.

© PPL Corporation 2016 DRAFT Appendix 16

© PPL Corporation 2016 DRAFT Note: Corporate and Other capital expenditures average approximately $10 million per year. (1) Based on assumed exchange rate of $1.60/£. (2) Expect between 80% and 90% to receive timely returns via ECR mechanism based on historical experience and future projections. Significant Ongoing Capital Expenditure Program ($ in billions) ~$16 billion of Capital Expenditures from 2016 –2020 to strengthen safety and reliability of T&D systems and address environmental regulations in Kentucky. • Over 80% of Regulated capital expenditures earn returns subject to minimal or no lag • PA –Implementation of $471 million Smart Meter Program to be recovered through a rider mechanism (~$406 million of Capital; ~$65 million O&M) • PA and KY –Continued focus on improving reliability in both Transmission and Distribution systems • KY –Environmental spending in response to regulations for Mercury, SO2, NOX, Ozone, Particulates, Water Intake and Discharge and CCRs (does not include Clean Power Plan) • U.K. –Continued focus on asset replacement, faults and overheads and general system reinforcement 17 (1) (2) $3.39 $3.25 $3.23 $3.19 $3.32
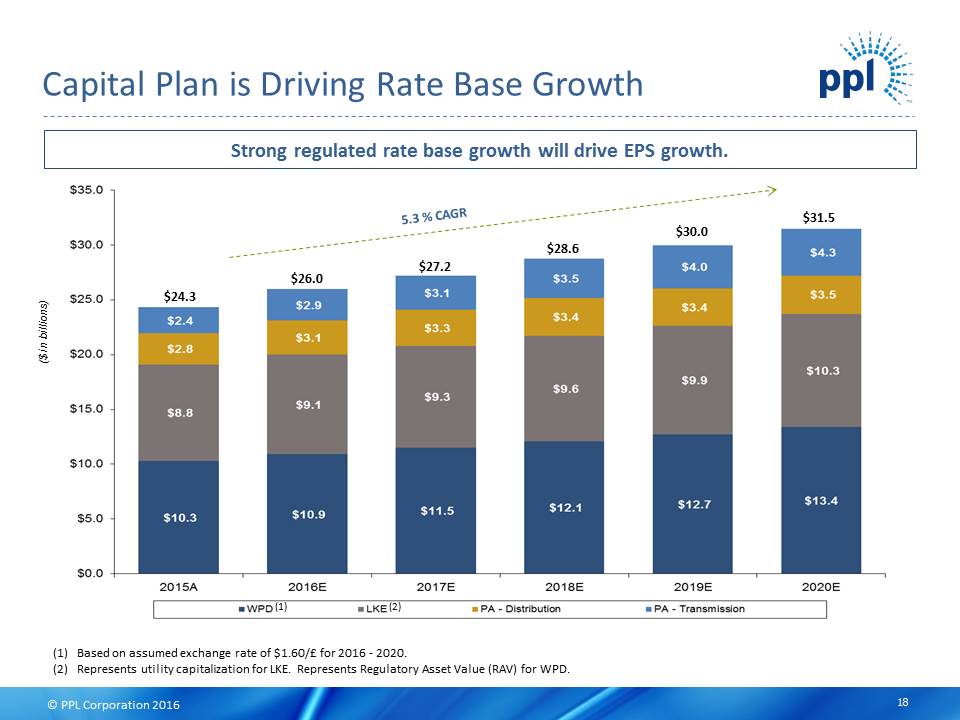
© PPL Corporation 2016 DRAFT ( $ i n b i l l i o n s ) (1) Based on assumed exchange rate of $1.60/£ for 2016 -2020. (2) Represents utility capitalization for LKE. Represents Regulatory Asset Value (RAV) for WPD. Strong regulated rate base growth will drive EPS growth. Capital Plan is Driving Rate Base Growth 18 (2) $24.3 $26.0 $27.2 $28.6 $30.0 $31.5 (1)
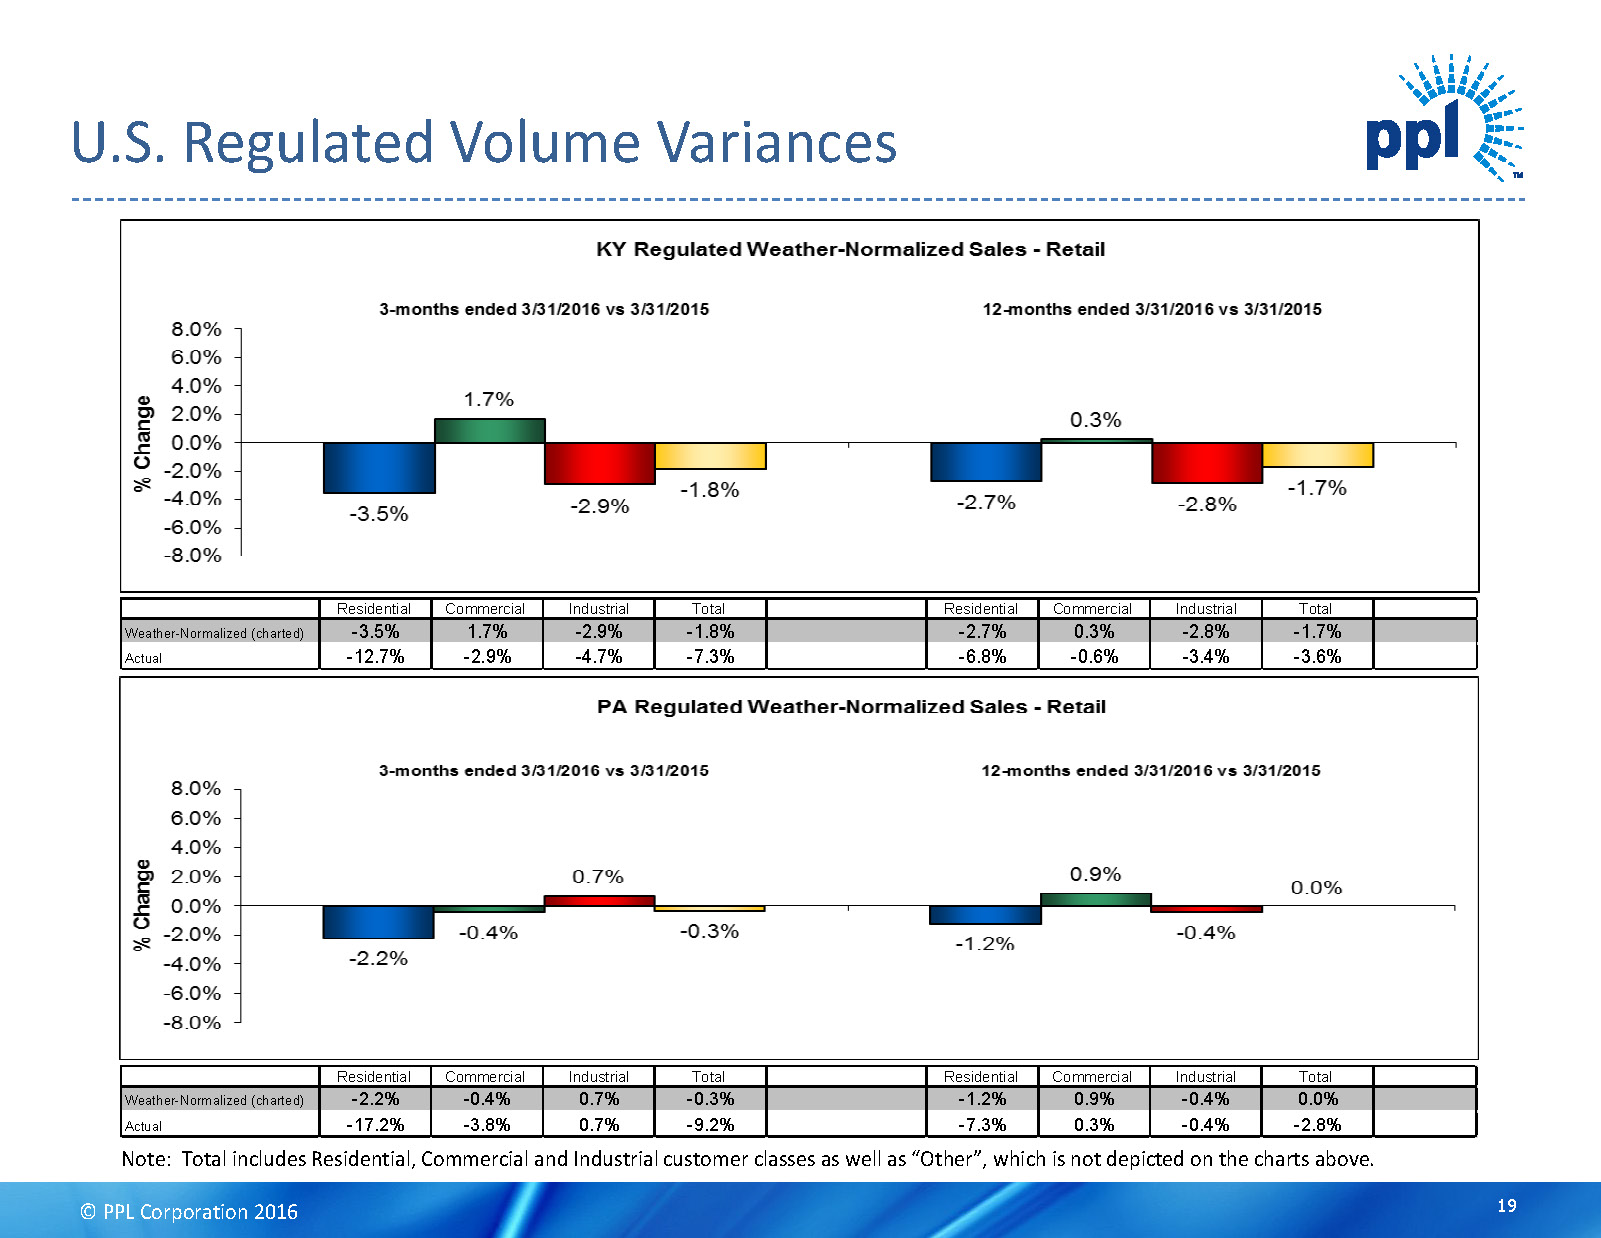
© PPL Corporation 2016 DRAFT Note: Total includes Residential, Commercial and Industrial customer classes as well as “Other”, which is not depicted on the charts above. U.S. Regulated Volume Variances 19 Residential Commercial Industrial Total Residential Commercial Industrial Total Weather-Normalized (charted) -2.2% -0.4% 0.7% -0.3% -1.2% 0.9% -0.4% 0.0% Actual -17.2% -3.8% 0.7% -9.2% -7.3% 0.3% -0.4% -2.8% Residential Commercial Industrial Total Residential Commercial Industrial Total Weather-Normalized (charted) -3.5% 1.7% -2.9% -1.8% -2.7% 0.3% -2.8% -1.7% Actual -12.7% -2.9% -4.7% -7.3% -6.8% -0.6% -3.4% -3.6%
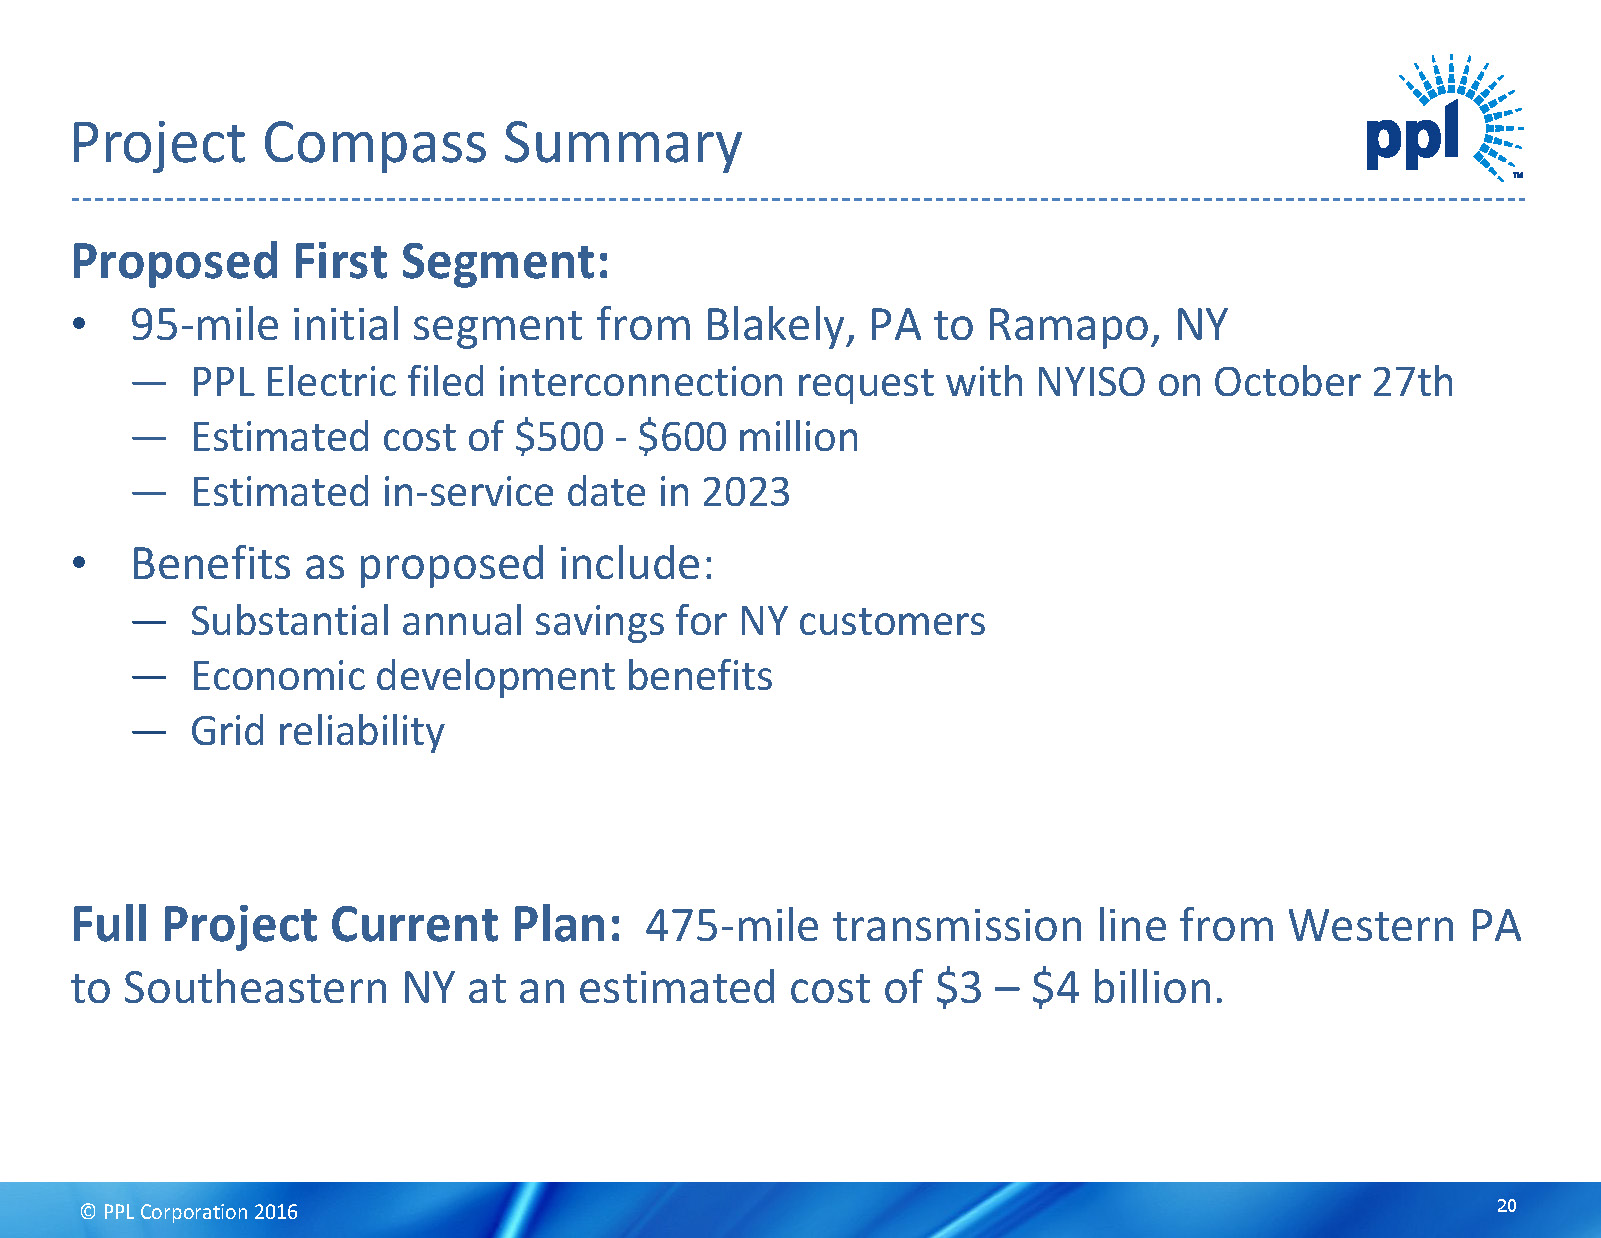
© PPL Corporation 2016 DRAFT 20 Proposed First Segment: • 95-mile initial segment from Blakely, PA to Ramapo, NY —PPL Electric filed interconnection request with NYISO on October 27th —Estimated cost of $500 -$600 million —Estimated in-service date in 2023 • Benefits as proposed include: —Substantial annual savings for NY customers —Economic development benefits —Grid reliability Full Project Current Plan: 475-mile transmission line from Western PA to Southeastern NY at an estimated cost of $3 –$4 billion. Project Compass Summary
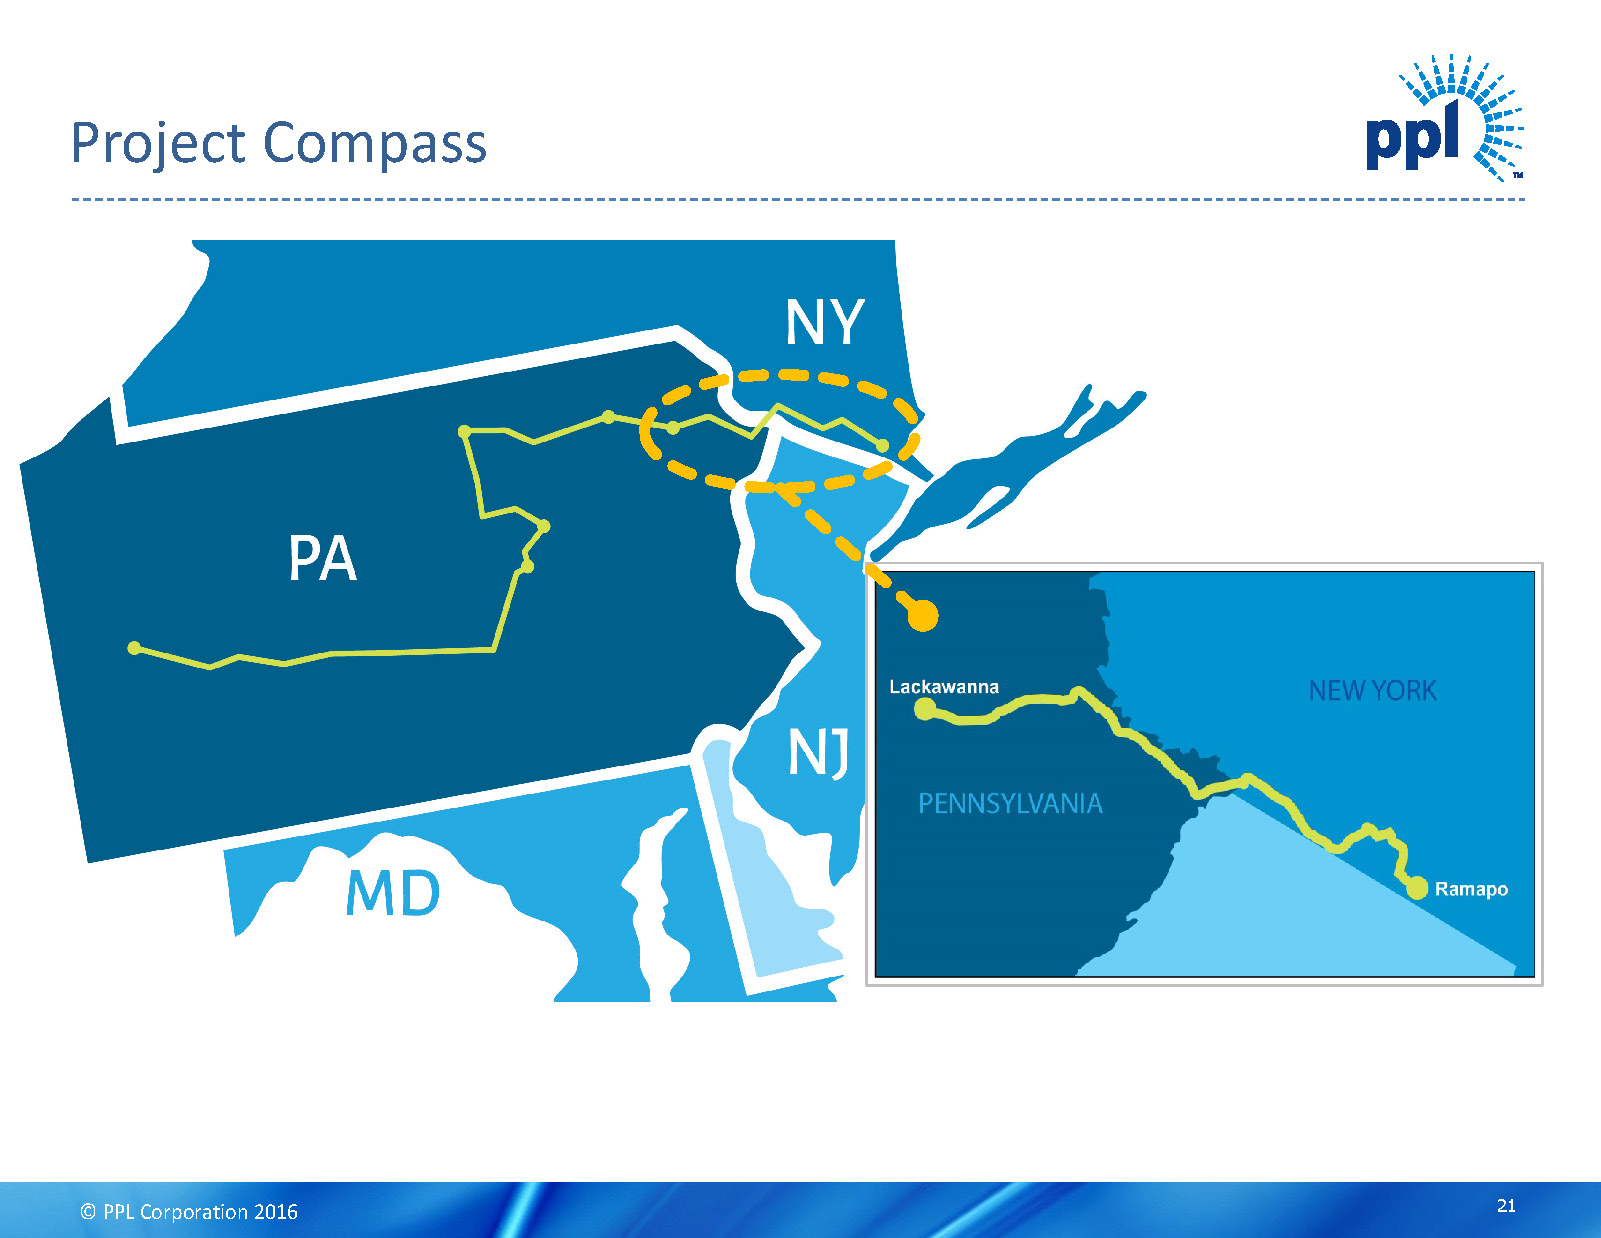
© PPL Corporation 2016 DRAFT Project Compass 21
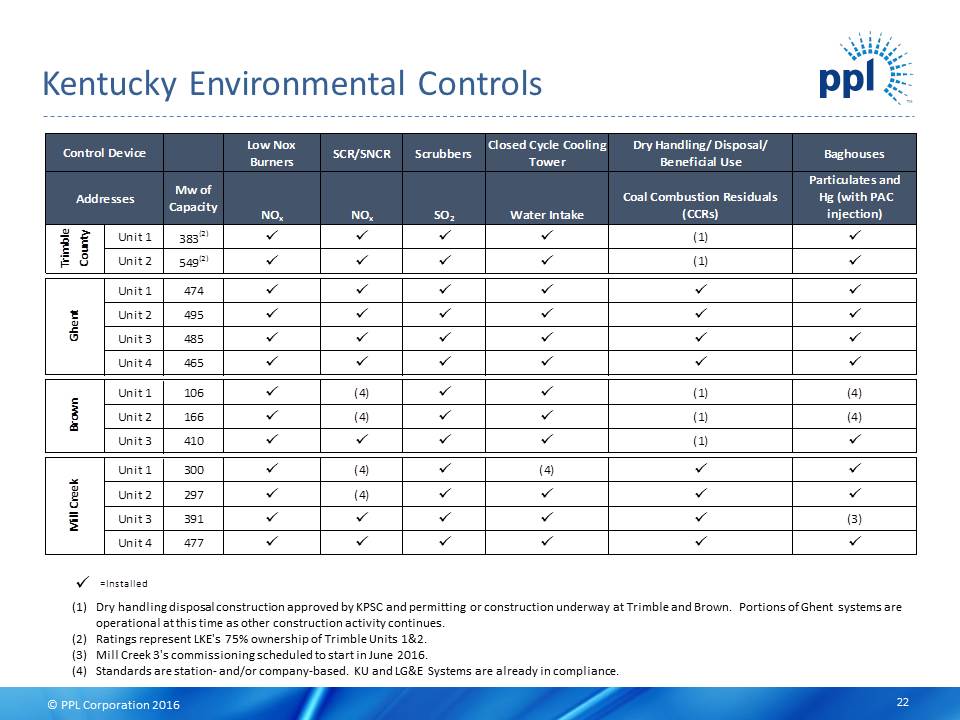
© PPL Corporation 2016 DRAFT Low Nox Burners SCR/SNCR Scrubbers Closed Cycle Cooling Tower Dry Handling/ Disposal/ Beneficial Use Baghouses Mw of Capacity NO x NO x SO 2 Water Intake Coal Combustion Residuals (CCRs) Particulates and Hg (with PAC injection) Unit 1 383 (2) x x x x (1) x Unit 2 549 (2) x x x x (1) x Unit 1 474 x x x x x x Unit 2 495 x x x x x x Unit 3 485 x x x x x x Unit 4 465 x x x x x x Unit 1 106 x (4) x x (1) (4) Unit 2 166 x (4) x x (1) (4) Unit 3 410 x x x x (1) x Unit 1 300 x (4) x (4) x x Unit 2 297 x (4) x x x x Unit 3 391 x x x x x (3) Unit 4 477 x x x x x x Control Device Addresses Trimble County Ghent Brown Mill Creek Kentucky Environmental Controls 22 (1) Dry handling disposal construction approved by KPSC and permitting or construction underway at Trimble and Brown. Portions of Ghentsystems are operational at this time as other construction activity continues. (2) Ratings represent LKE's 75% ownership of Trimble Units 1&2 (3) Mill Creek 3's commissioning scheduled to start in June 2016. (4) Standards are station-and/or company-based. KU and LG&E Systems are already in compliance. x = Installed
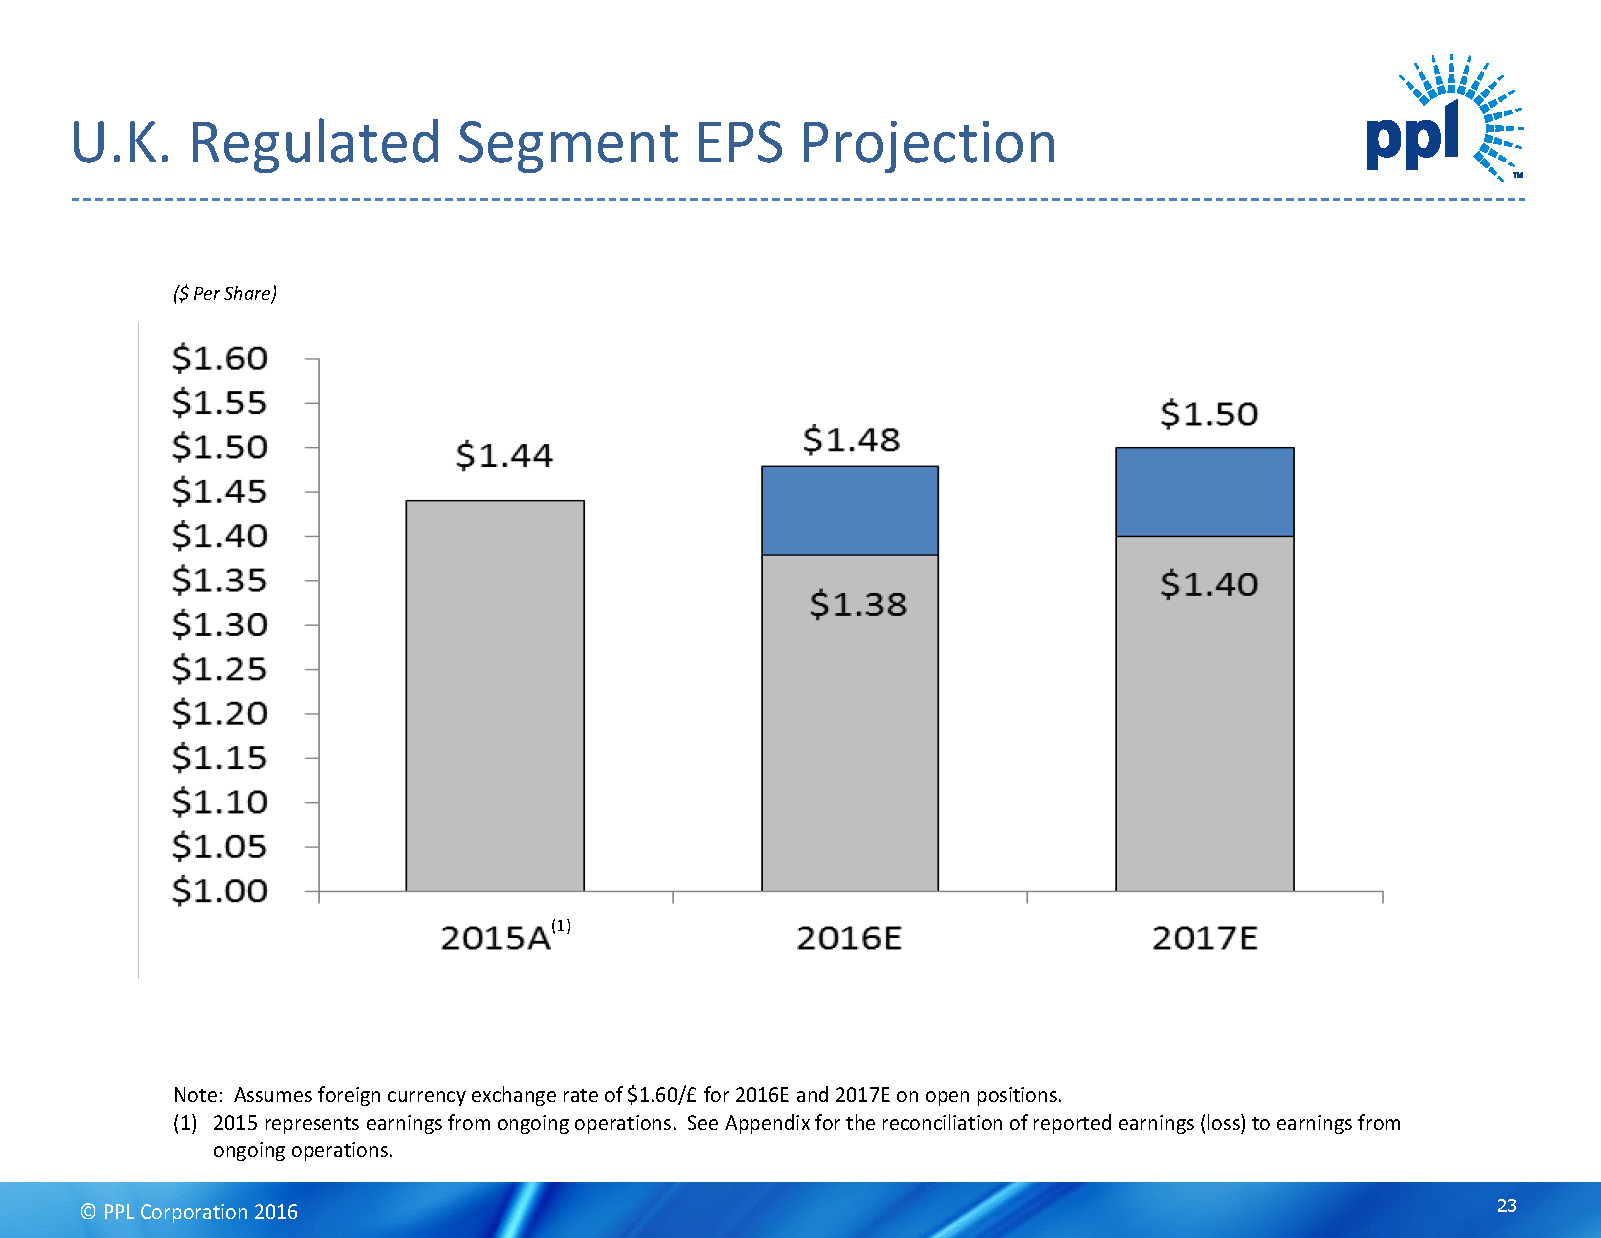
© PPL Corporation 2016 DRAFT U.K. Regulated Segment EPS Projection ($ Per Share) Note: Assumes foreign currency exchange rate of $1.60/£ for 2016E and 2017E on open positions. (1) 2015 represents earnings from ongoing operations. See Appendix for the reconciliation of reported earnings (loss) to earnings from ongoing operations. 23 (1)
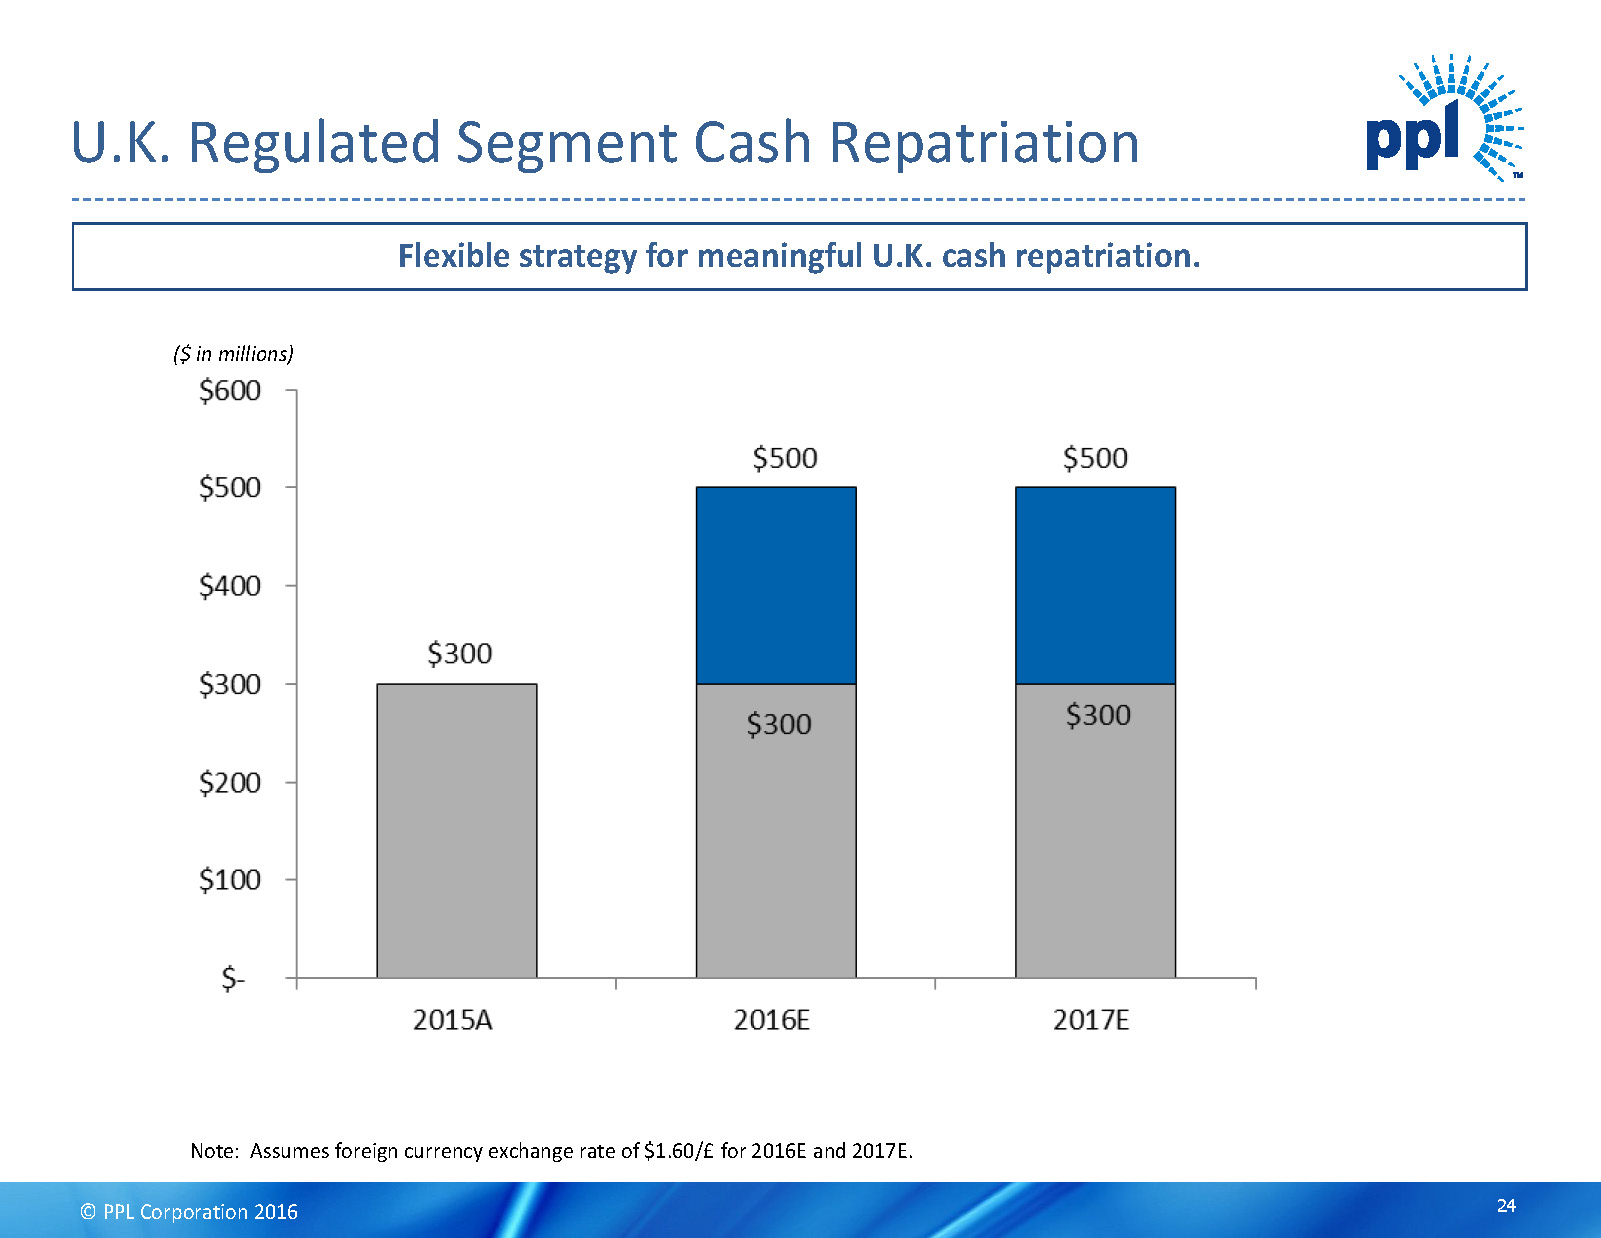
© PPL Corporation 2016 DRAFT U.K. Regulated Segment Cash Repatriation Note: Assumes foreign currency exchange rate of $1.60/£ for 2016E and 2017E. ($ in millions) Flexible strategy for meaningful U.K. cash repatriation. 24
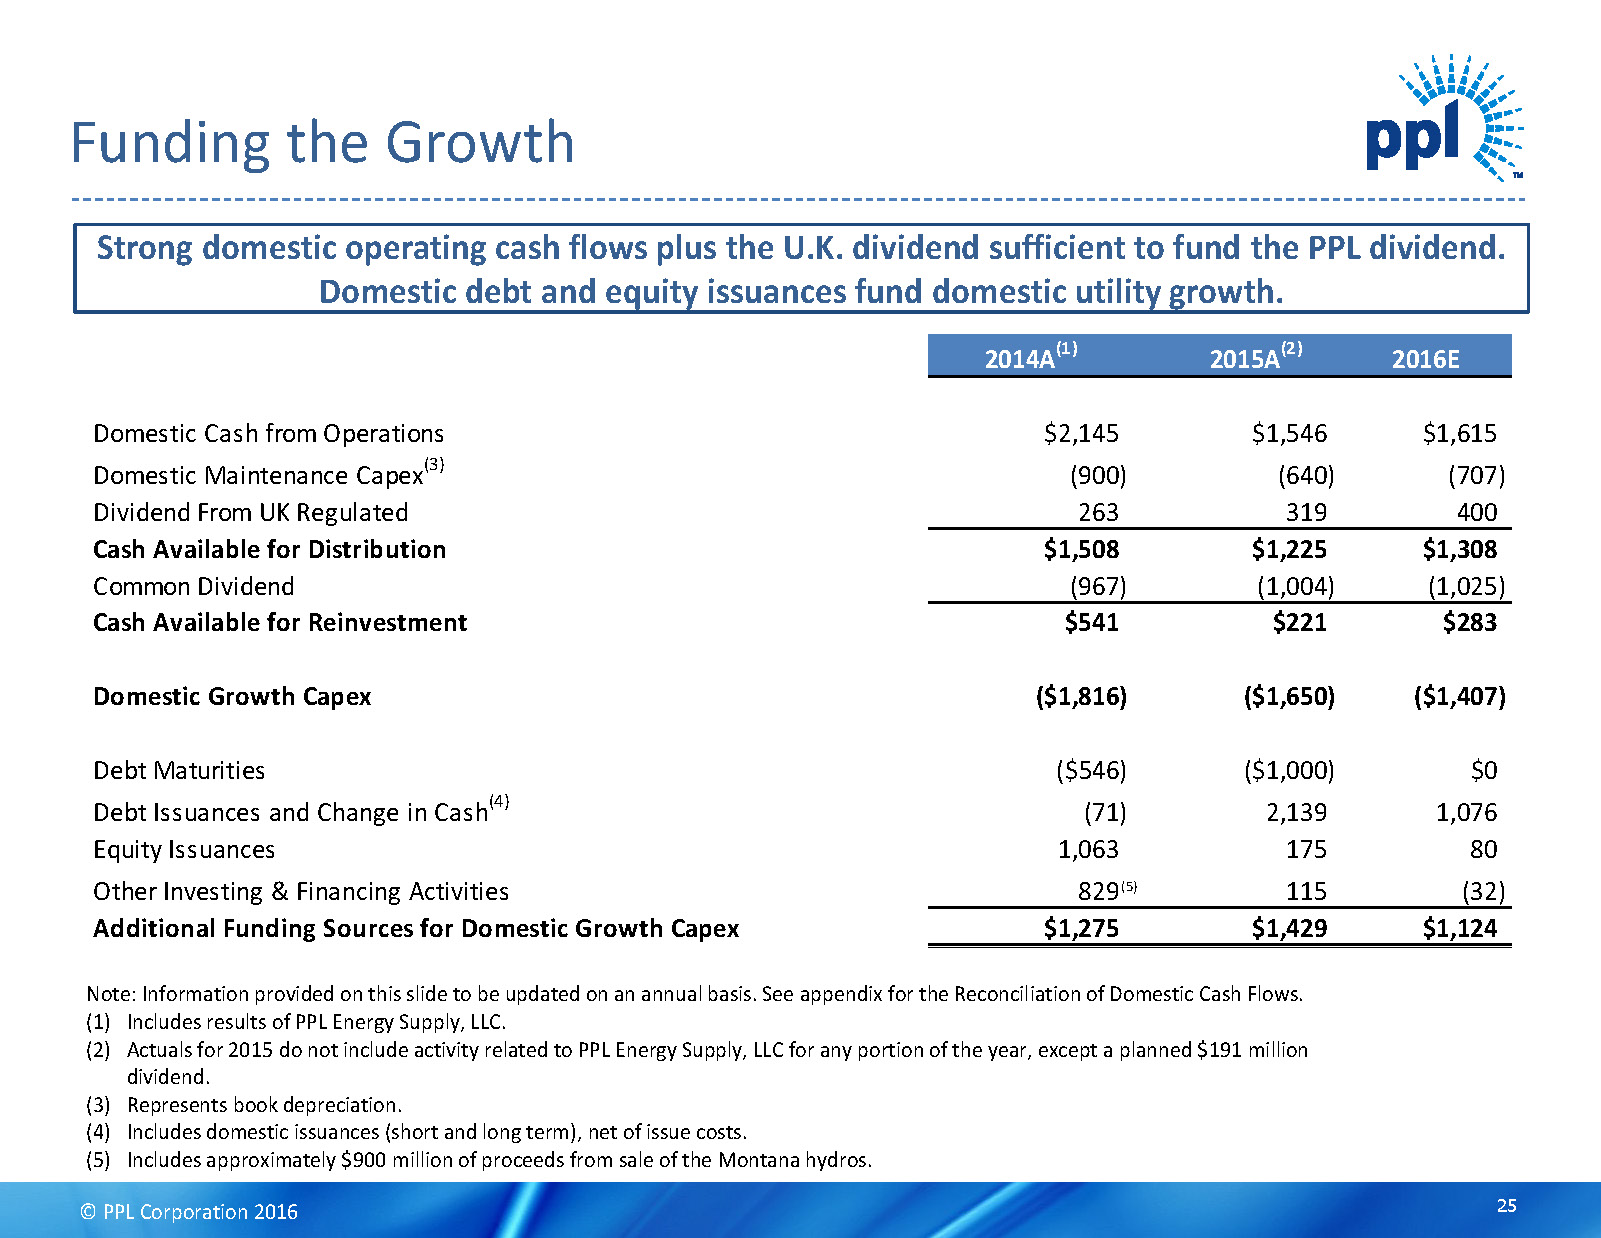
© PPL Corporation 2016 DRAFT 2014A (1) 2015A (2) 2016E Domestic Cash from Operations $2,145 $1,546 $1,615 Domestic Maintenance Capex (3) (900) (640) (707) Dividend From UK Regulated 263 319 400 Cash Available for Distribution $1,508 $1,225 $1,308 Common Dividend (967) (1,004) (1,025) Cash Available for Reinvestment $541 $221 $283 Domestic Growth Capex ($1,816) ($1,650) ($1,407) Debt Maturities ($546) ($1,000) $0 Debt Issuances and Change in Cash (4) (71) 2,139 1,076 Equity Issuances 1,063 175 80 Other Investing & Financing Activities 829 115 (32) Additional Funding Sources for Domestic Growth Capex $1,275 $1,429 $1,124 Funding the Growth Strong domestic operating cash flows plus the U.K. dividend sufficient to fund the PPL dividend. Domestic debt and equity issuances fund domestic utility growth. 25 (5) Note: Information provided on this slide to be updated on an annual basis. See appendix for the Reconciliation of Domestic Cash Flows. (1) Includes results of PPL Energy Supply, LLC. (2) Actuals for 2015 do not include activity related to PPL Energy Supply, LLC for any portion of the year, except a planned $191million dividend. (3) Represents book depreciation. (4) Includes domestic issuances (short and long term), net of issue costs. (5) Includes approximately $900 million of proceeds from sale of the Montana hydros.
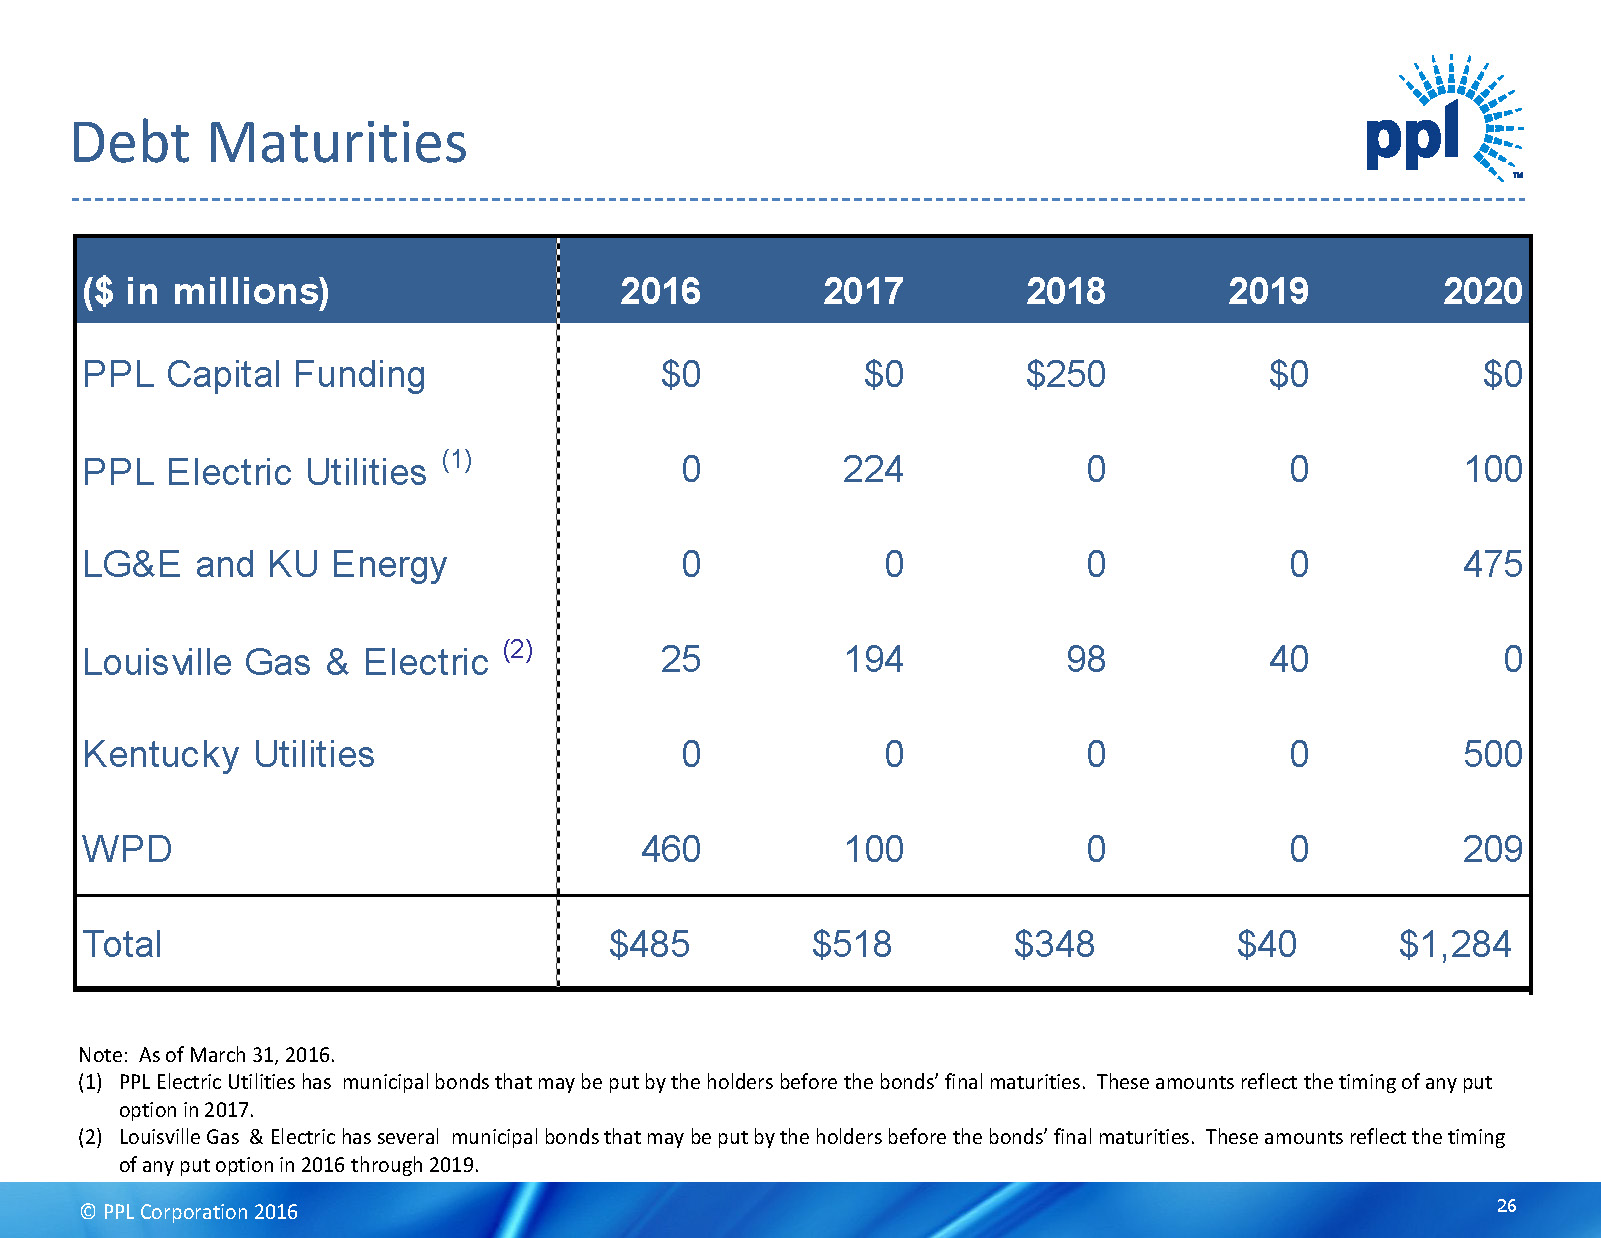
© PPL Corporation 2016 DRAFT ($ in millions) 2016 2017 2018 2019 2020 PPL Capital Funding $0 $0 $250 $0 $0 PPL Electric Utilities (1) 0 224 0 0 100 LG&E and KU Energy 0 0 0 0 475 Louisville Gas & Electric (2) 25 194 98 40 0 Kentucky Utilities 0 0 0 0 500 WPD 460 100 0 0 209 Total $485 $518 $348 $40 $1,284 Debt Maturities Note: As of March 31, 2016. (1) PPL Electric Utilities has municipal bonds that may be put by the holders before the bonds’ final maturities. These amountsreflect the timing of any put option in 2017. (2) Louisville Gas & Electric has several municipal bonds that may be put by the holders before the bonds’ final maturities. These amounts reflect the timing of any put option in 2016 through 2019. 26
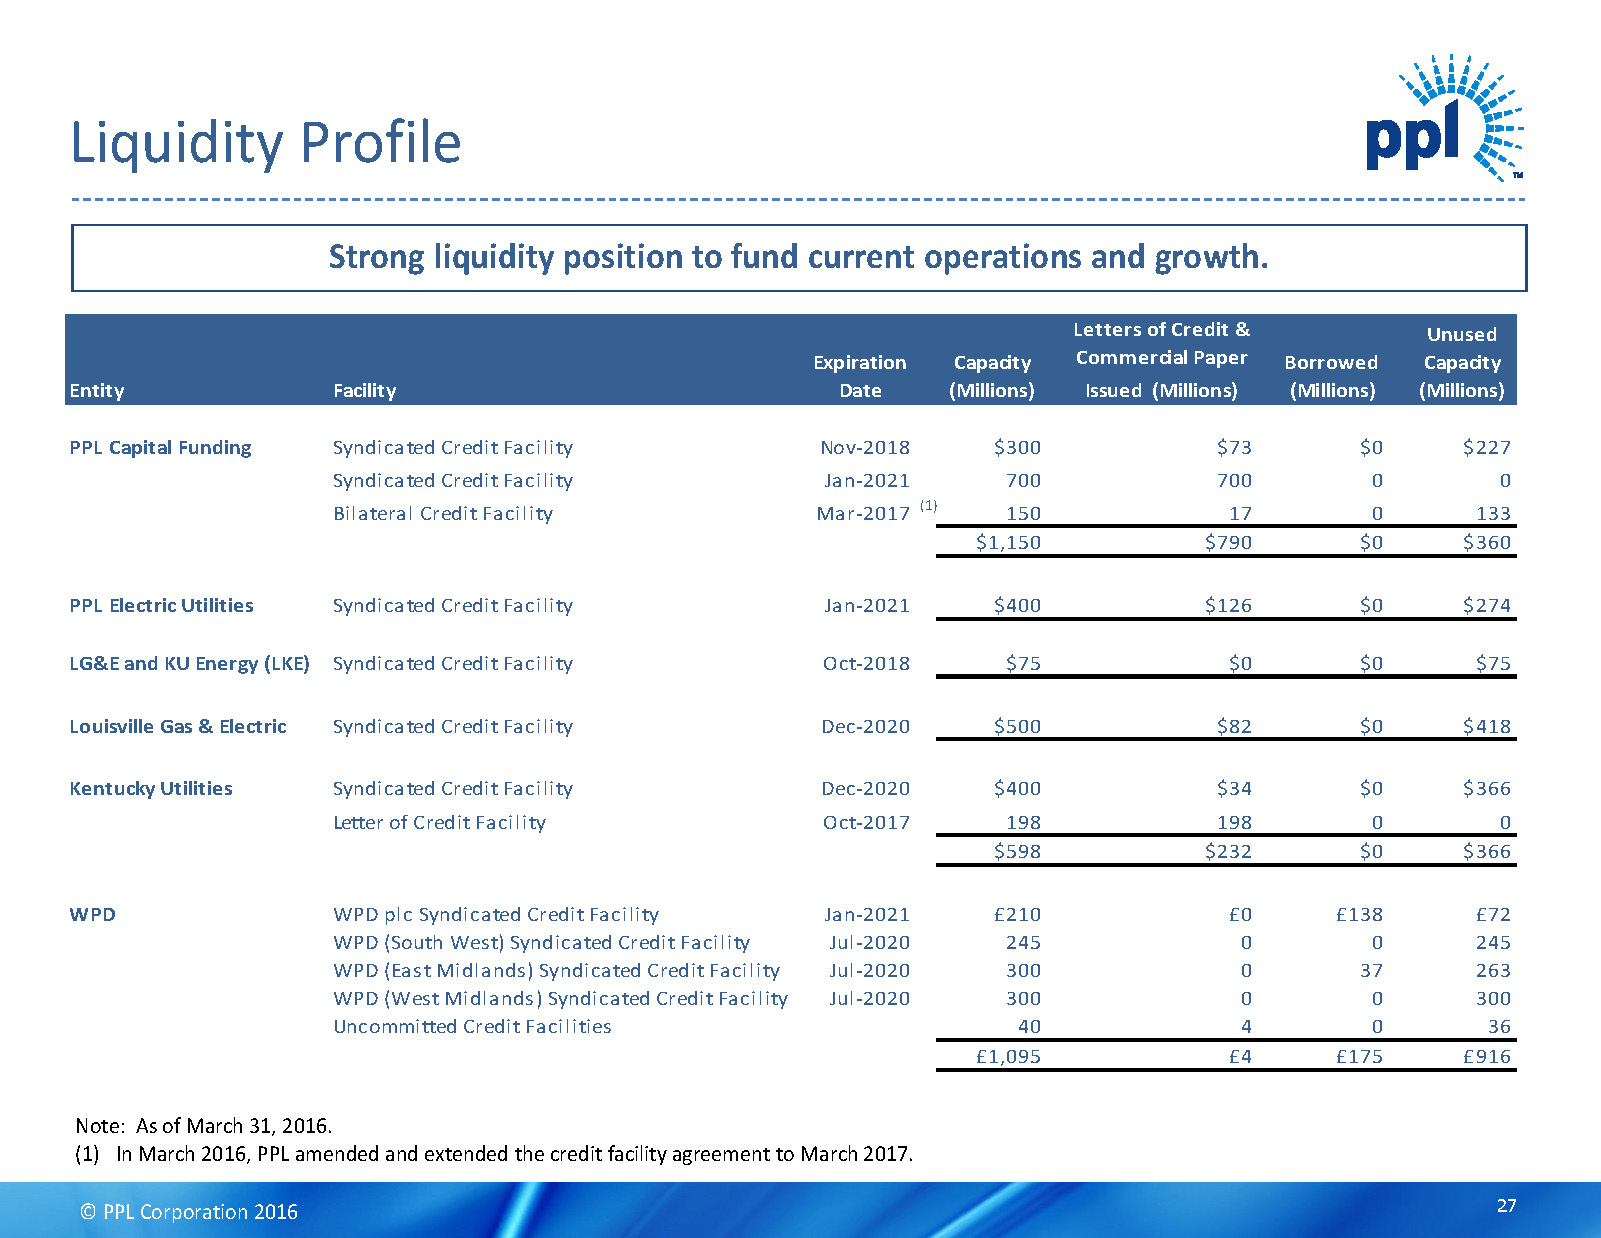
© PPL Corporation 2016 DRAFT Liquidity Profile Note: As of March 31, 2016. (1) In March 2016, PPL amended and extended the credit facility agreement to March 2017. Entity Facility Expiration Date Capacity (Millions) Letters of Credit & Commercial Paper Issued (Millions) Borrowed (Millions) Unused Capacity (Millions) PPL Capital Funding Syndicated Credit Facility Nov-2018 $300 $73 $0 $227 Syndicated Credit Facility Jan-2021 700 700 0 0 Bilateral Credit Facility Mar-2017 (1) 150 17 0 133 $1,150 $790 $0 $360 PPL Electric Utilities Syndicated Credit Facility Jan-2021 $400 $126 $0 $274 LG&E and KU Energy (LKE) Syndicated Credit Facility Oct-2018 $75 $0 $0 $75 Louisville Gas & Electric Syndicated Credit Facility Dec-2020 $500 $82 $0 $418 Kentucky Utilities Syndicated Credit Facility Dec-2020 $400 $34 $0 $366 Letter of Credit Facility Oct-2017 198 198 0 0 $598 $232 $0 $366 WPD WPD plc Syndicated Credit Facility Jan-2021 £210 £0 £138 £72 WPD (South West) Syndicated Credit Facility Jul-2020 245 0 0 245 WPD (East Midlands) Syndicated Credit Facility Jul-2020 300 0 37 263 WPD (West Midlands) Syndicated Credit Facility Jul-2020 300 0 0 300 Uncommitted Credit Facilities 40 4 0 36 £1,095 £4 £175 £916 Strong liquidity position to fund current operations and growth. 27
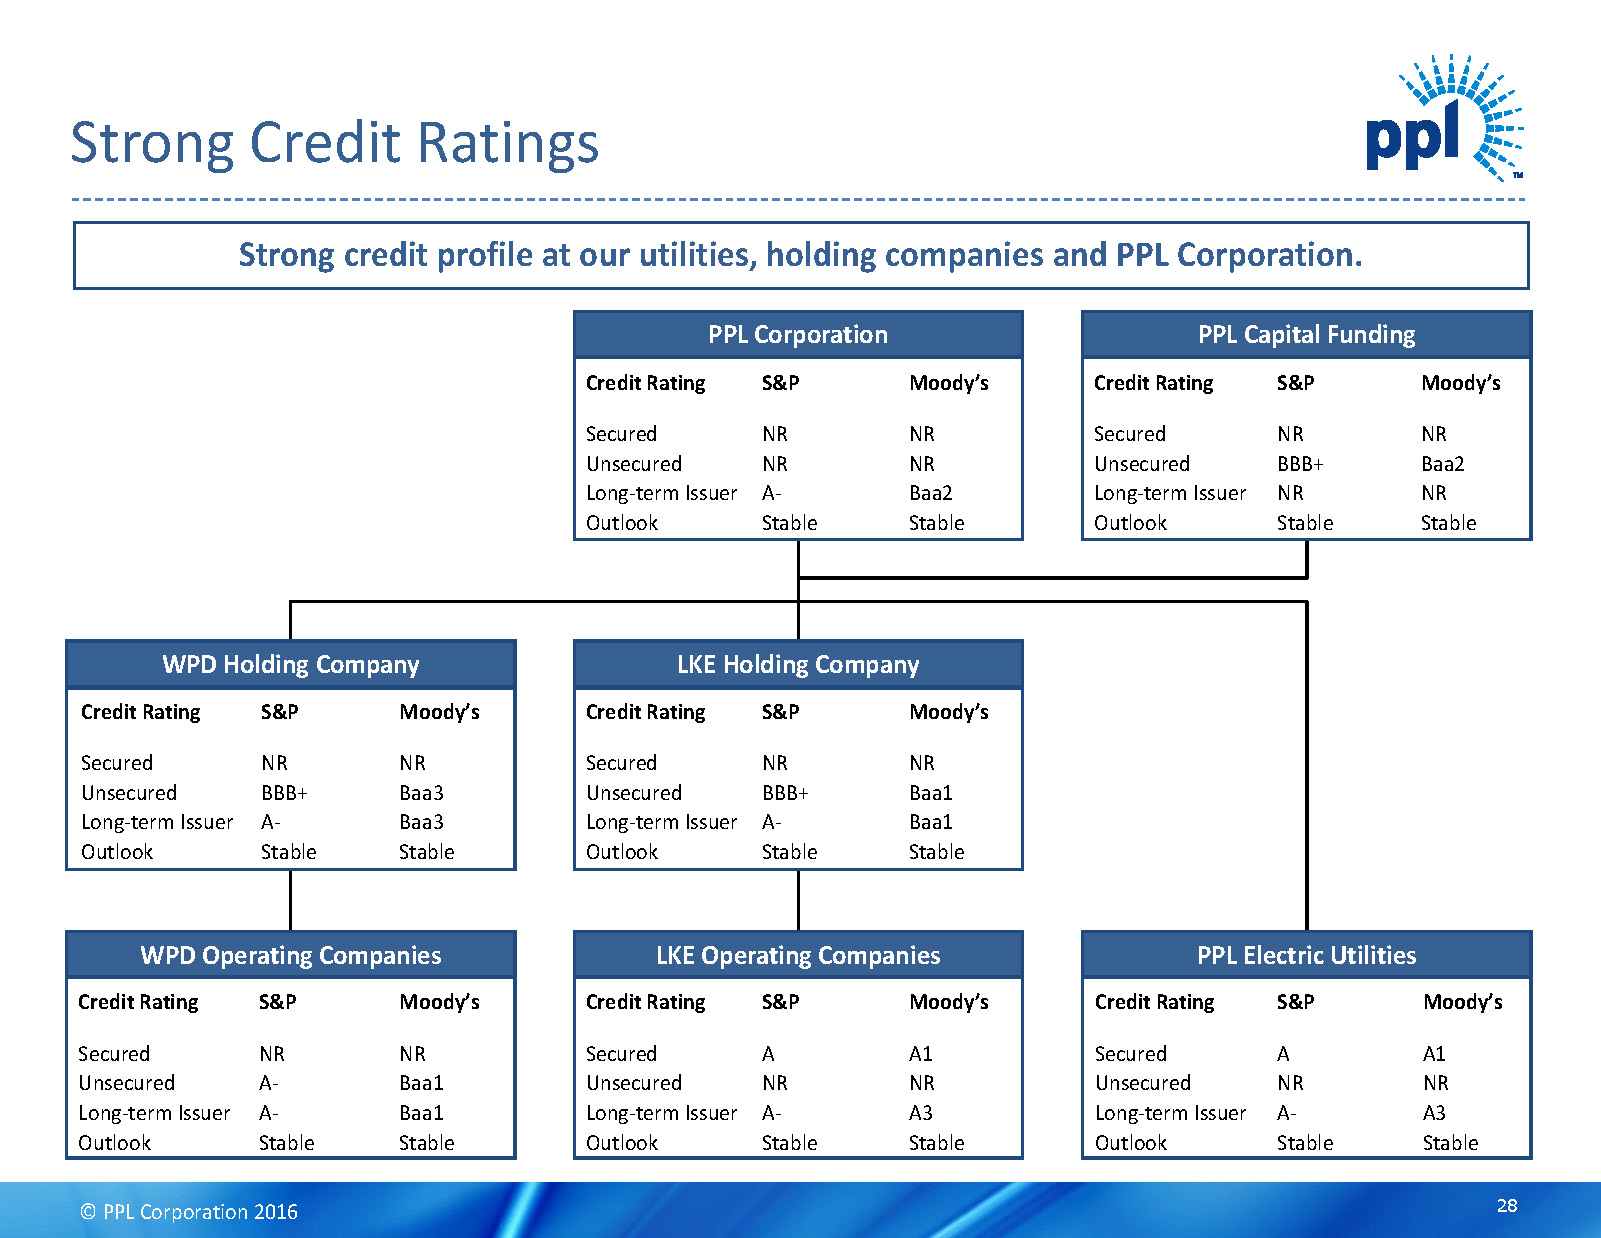
© PPL Corporation 2016 DRAFT WPD Holding Company LKE Holding Company PPL Electric UtilitiesLKE Operating Companies PPL Capital Funding Credit Rating Secured Unsecured Long-term Issuer Outlook S&P NR BBB+ NR Stable Moody’s NR Baa2 NR Stable Credit Rating Secured Unsecured Long-term Issuer Outlook S&P NR BBB+ A- Stable Moody’s NR Baa3 Baa3 Stable WPD Operating Companies Credit Rating Secured Unsecured Long-term Issuer Outlook S&P NR A- A- Stable Moody’s NR Baa1 Baa1 Stable Credit Rating Secured Unsecured Long-term Issuer Outlook S&P A NR A- Stable Moody’s A1 NR A3 Stable Credit Rating Secured Unsecured Long-term Issuer Outlook S&P NR BBB+ A- Stable Moody’s NR Baa1 Baa1 Stable Credit Rating Secured Unsecured Long-term Issuer Outlook S&P A NR A- Stable PPL Corporation Credit Rating Secured Unsecured Long-term Issuer Outlook S&P NR NR A- Stable Moody’s NR NR Baa2 Stable Strong Credit Ratings Strong credit profile at our utilities, holding companies and PPL Corporation. Moody’s A1 NR A3 Stable 28
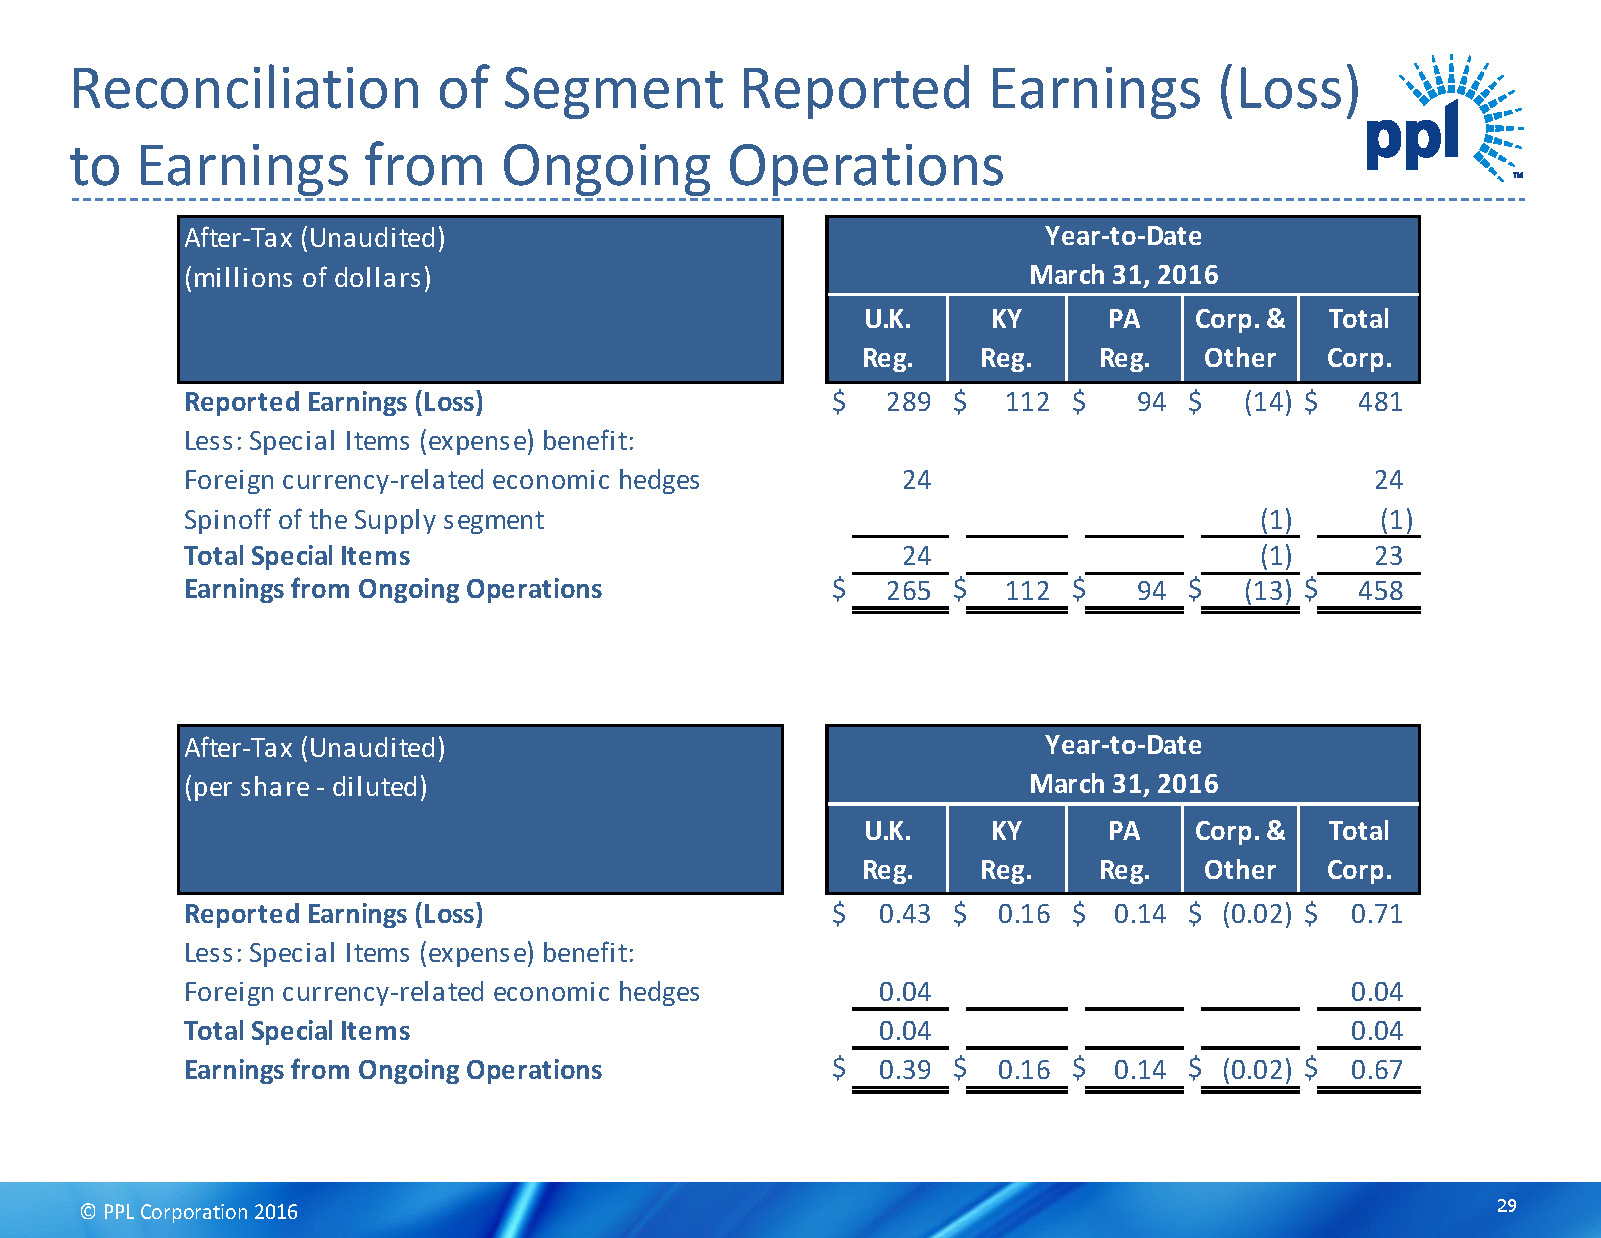
© PPL Corporation 2016 DRAFT 29 Reconciliation of Segment Reported Earnings (Loss) to Earnings from Ongoing Operations After-Tax (Unaudited) (millions of dollars) Reported Earnings (Loss) $ 289 $ 112 $ 94 $ (14) $ 481 Less: Special Items (expense) benefit: Foreign currency-related economic hedges 24 24 Spinoff of the Supply segment (1) (1) Total Special Items 24 (1) 23 Earnings from Ongoing Operations $ 265 $ 112 $ 94 $ (13) $ 458 After-Tax (Unaudited) (per share - diluted) Reported Earnings (Loss) $ 0.43 $ 0.16 $ 0.14 $ (0.02) $ 0.71 Less: Special Items (expense) benefit: Foreign currency-related economic hedges 0.04 0.04 Total Special Items 0.04 0.04 Earnings from Ongoing Operations $ 0.39 $ 0.16 $ 0.14 $ (0.02) $ 0.67 U.K. Reg. KY Reg. PA Reg. U.K. Reg. KY Reg. PA Reg. Corp. & Other Total Corp. Corp. & Other Year-to-Date March 31, 2016 Year-to-Date March 31, 2016 Total Corp.
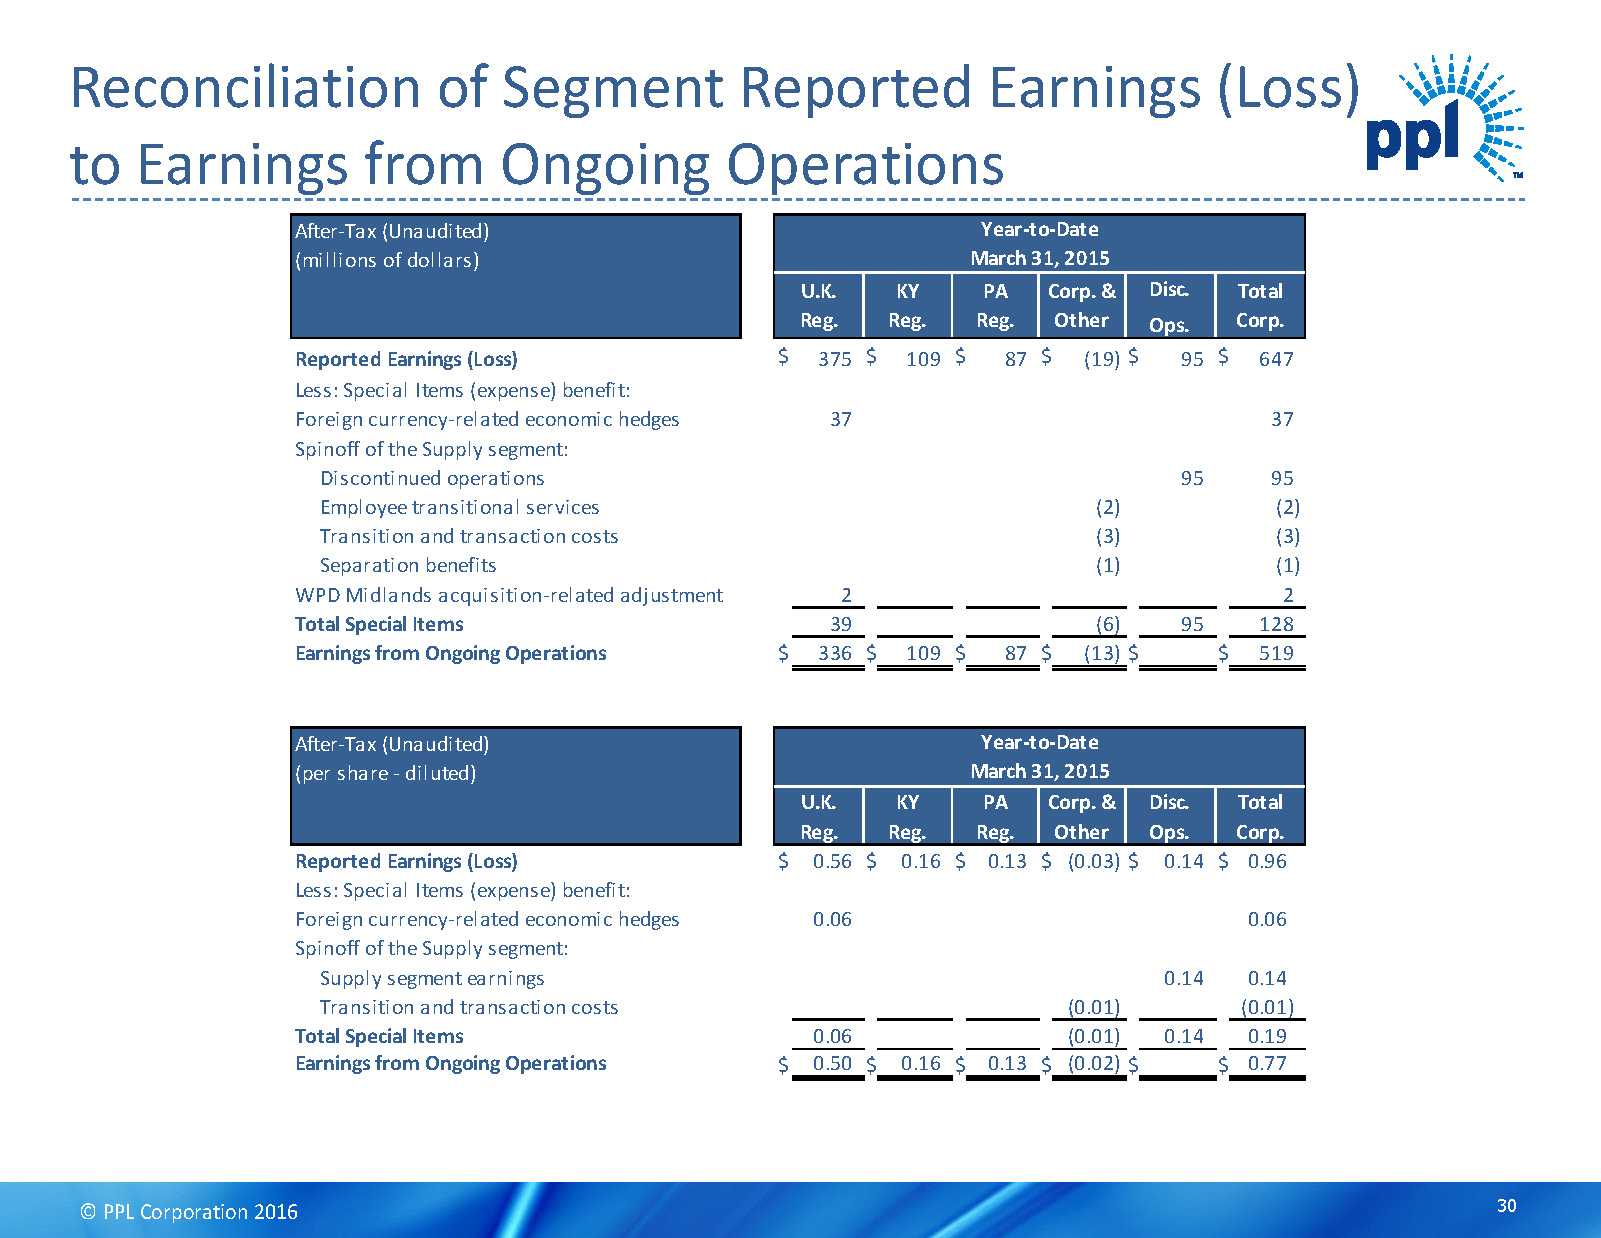
© PPL Corporation 2016 DRAFT Reconciliation of Segment Reported Earnings (Loss) to Earnings from Ongoing Operations 30 After-Tax (Unaudited) (millions of dollars) Reported Earnings (Loss) $ 375 $ 109 $ 87 $ (19) $ 95 $ 647 Less: Special Items (expense) benefit: Foreign currency-related economic hedges 37 37 Spinoff of the Supply segment: Discontinued operations 95 95 Employee transitional services (2) (2) Transition and transaction costs (3) (3) Separation benefits (1) (1) WPD Midlands acquisition-related adjustment 2 2 Total Special Items 39 (6) 95 128 Earnings from Ongoing Operations $ 336 $ 109 $ 87 $ (13) $ $ 519 After-Tax (Unaudited) (per share - diluted) Reported Earnings (Loss) $ 0.56 $ 0.16 $ 0.13 $ (0.03) $ 0.14 $ 0.96 Less: Special Items (expense) benefit: Foreign currency-related economic hedges 0.06 0.06 Spinoff of the Supply segment: Supply segment earnings 0.14 0.14 Transition and transaction costs (0.01) (0.01) Total Special Items 0.06 (0.01) 0.14 0.19 Earnings from Ongoing Operations $ 0.50 $ 0.16 $ 0.13 $ (0.02) $ $ 0.77 Corp. & Other Ops. Disc. U.K. Reg. KY Reg. PA Reg. Corp. & Other Year-to-Date March 31, 2015 Disc. Total Corp.Ops. U.K. Reg. KY Reg. PA Reg. Year-to-Date March 31, 2015 Total Corp.
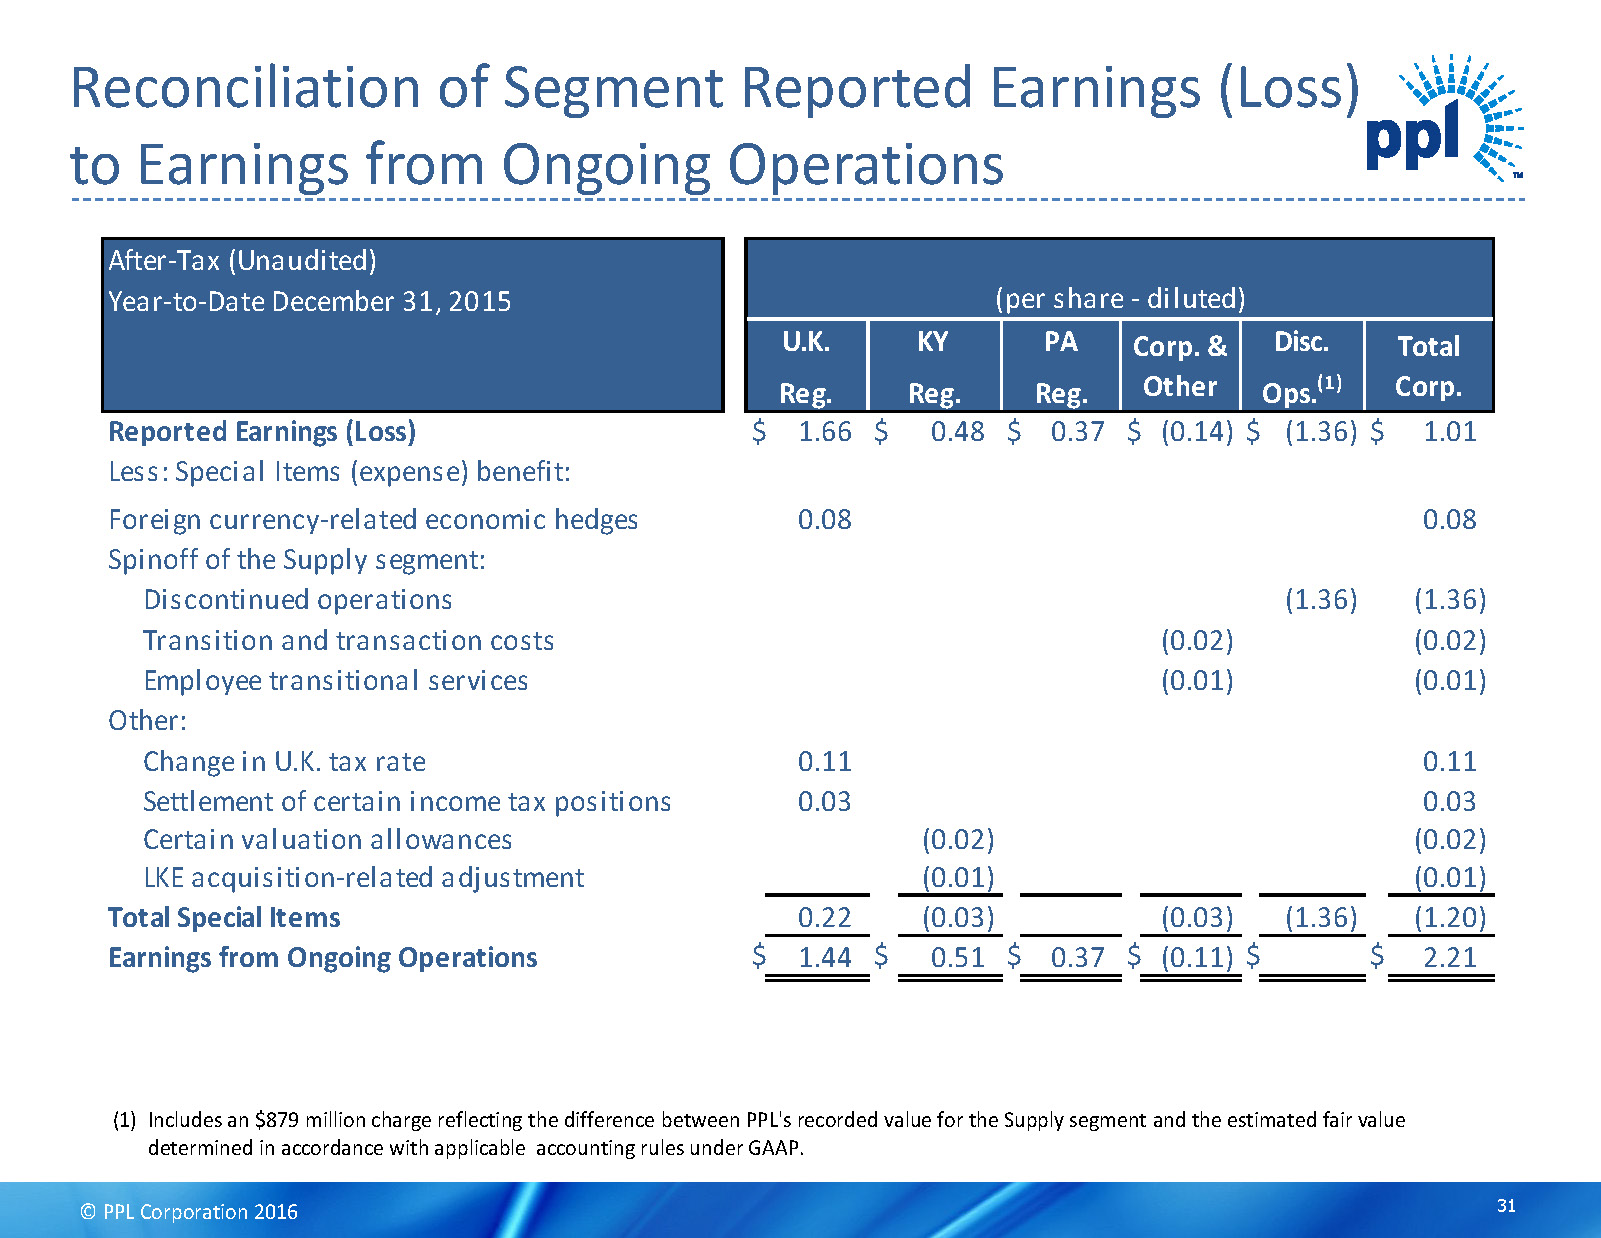
© PPL Corporation 2016 DRAFT 31 Reconciliation of Segment Reported Earnings (Loss) to Earnings from Ongoing Operations (1)Includes an $879 million charge reflecting the difference between PPL's recorded value for the Supply segment and the estimated fair value determined in accordance with applicable accounting rules under GAAP. After-Tax (Unaudited) Year-to-Date December 31, 2015 Reported Earnings (Loss) $ 1.66 $ 0.48 $ 0.37 $ (0.14) $ (1.36) $ 1.01 Less: Special Items (expense) benefit: Foreign currency-related economic hedges 0.08 0.08 Spinoff of the Supply segment: Discontinued operations (1.36) (1.36) Transition and transaction costs (0.02) (0.02) Employee transitional services (0.01) (0.01) Other: Change in U.K. tax rate 0.11 0.11 Settlement of certain income tax positions 0.03 0.03 Certain valuation allowances (0.02) (0.02) LKE acquisition-related adjustment (0.01) (0.01) Total Special Items 0.22 (0.03) (0.03) (1.36) (1.20) Earnings from Ongoing Operations $ 1.44 $ 0.51 $ 0.37 $ (0.11) $ $ 2.21 Disc. Total Corp. Reg. Reg. Reg. Ops. (1) U.K. KY PA Corp. & Other (per share - diluted)
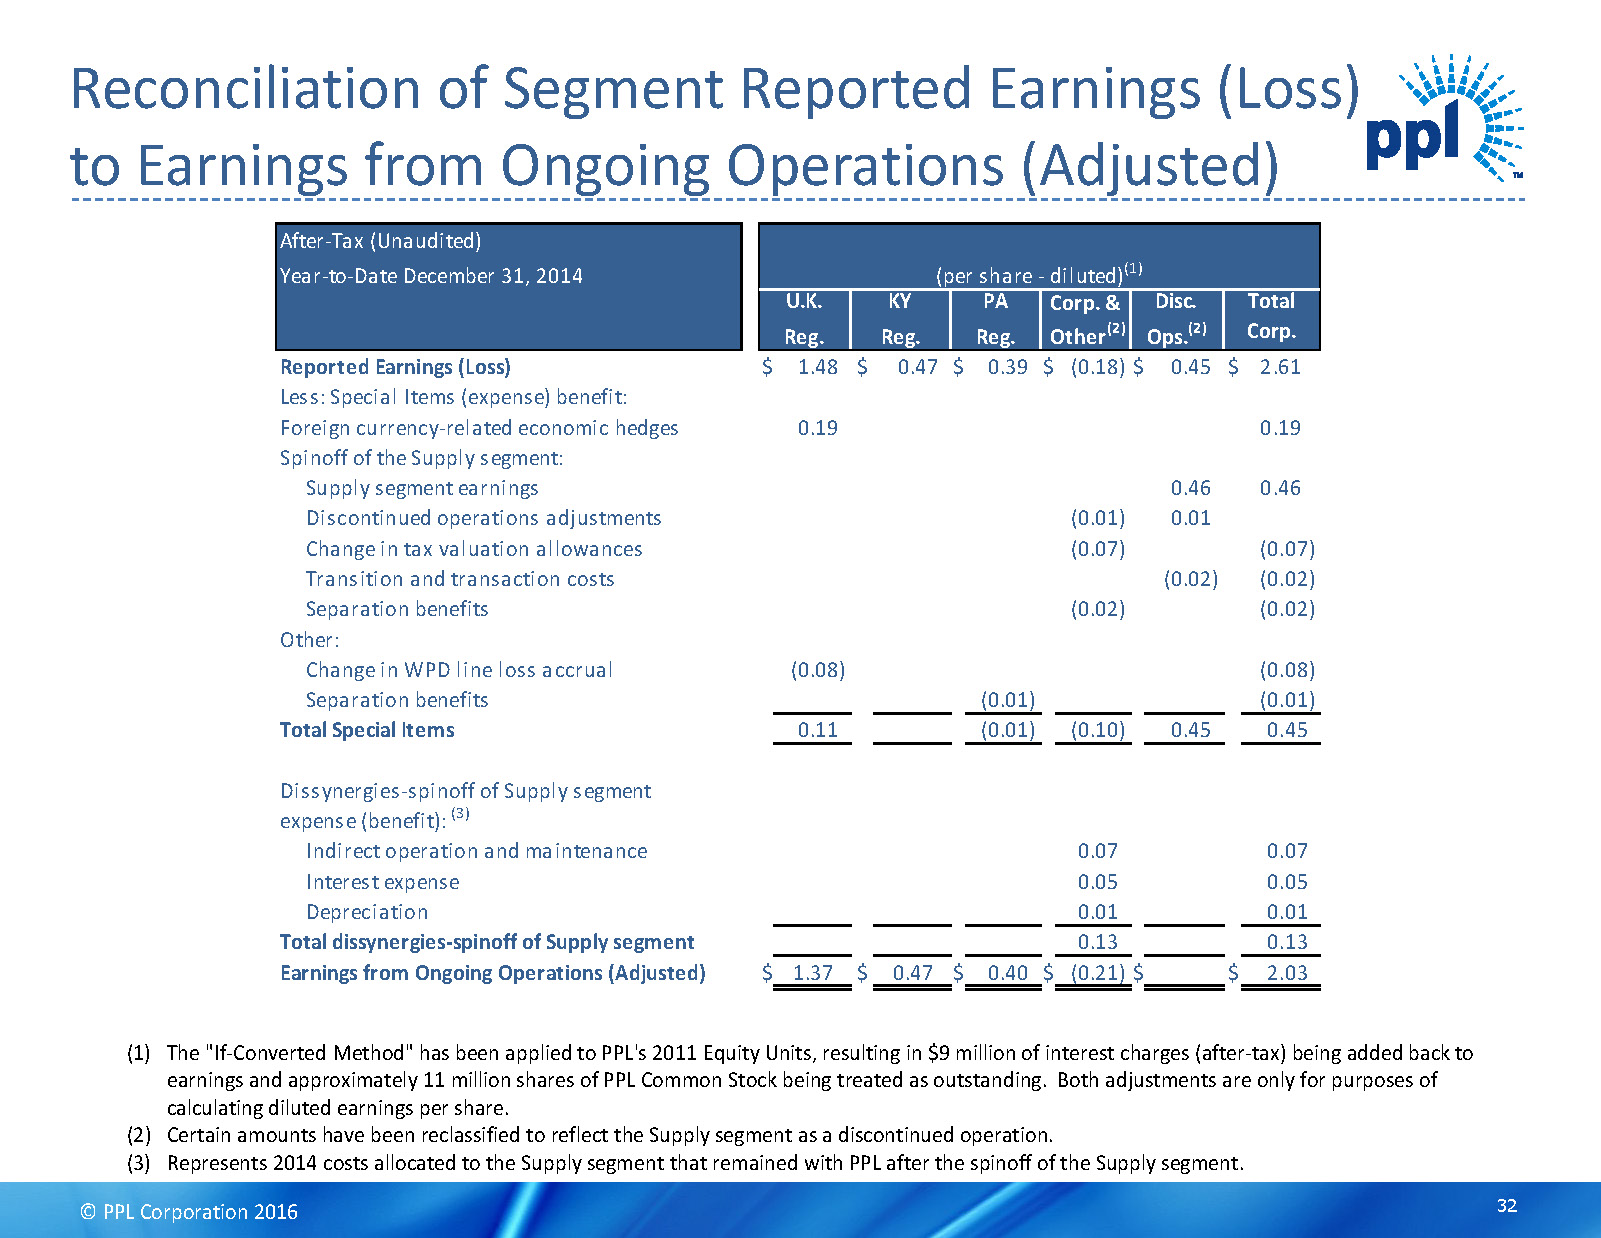
© PPL Corporation 2016 DRAFT Reconciliation of Segment Reported Earnings (Loss) to Earnings from Ongoing Operations (Adjusted) (1) The "If-Converted Method" has been applied to PPL's 2011 Equity Units, resulting in $9 million of interest charges (after-tax) being added back to earnings and approximately 11 million shares of PPL Common Stock being treated as outstanding. Both adjustments are only for purposes of calculating diluted earnings per share. (2) Certain amounts have been reclassified to reflect the Supply segment as a discontinued operation. (3) Represents 2014 costs allocated to the Supply segment that remained with PPL after the spinoff of the Supply segment. 32 After-Tax (Unaudited) Year-to-Date December 31, 2014 Reported Earnings (Loss) $ 1.48 $ 0.47 $ 0.39 $ (0.18) $ 0.45 $ 2.61 Less: Special Items (expense) benefit: Foreign currency-related economic hedges 0.19 0.19 Spinoff of the Supply segment: Supply segment earnings 0.46 0.46 Discontinued operations adjustments (0.01) 0.01 Change in tax valuation allowances (0.07) (0.07) Transition and transaction costs (0.02) (0.02) Separation benefits (0.02) (0.02) Other: Change in WPD line loss accrual (0.08) (0.08) Separation benefits (0.01) (0.01) Total Special Items 0.11 (0.01) (0.10) 0.45 0.45 Dissynergies-spinoff of Supply segment expense (benefit): (3) Indirect operation and maintenance 0.07 0.07 Interest expense 0.05 0.05 Depreciation 0.01 0.01 Total dissynergies-spinoff of Supply segment 0.13 0.13 Earnings from Ongoing Operations (Adjusted) $ 1.37 $ 0.47 $ 0.40 $ (0.21) $ $ 2.03 (per share - diluted) (1) U.K. KY PA Disc. Total Corp. Reg. Reg. Reg. Ops. (2) Corp. & Other (2)

© PPL Corporation 2016 DRAFT Reconciliation of PPL's Forecast of Reported Earnings (Loss) to Earnings from Ongoing Operations 33 After-Tax (Unaudited) Reported Earnings (Loss) $ 1.47 $ 0.57 $ 0.47 $ (0.12) $ 2.39 $ $ 2.29 Less: Special Items (expense) benefit: Foreign currency-related economic hedges 0.04 0.04 0.04 Total Special Items 0.04 0.04 0.04 Earnings from Ongoing Operations $ 1.43 $ 0.57 $ 0.47 $ (0.12) $ 2.35 $ $ 2.25 Reg. KY Reg. PA Reg. Corp. & Other U.K. Forecast (per share - diluted) 2016 Midpoint 2.45 0.04 2.49 0.04 Total High 2016 Low 2016
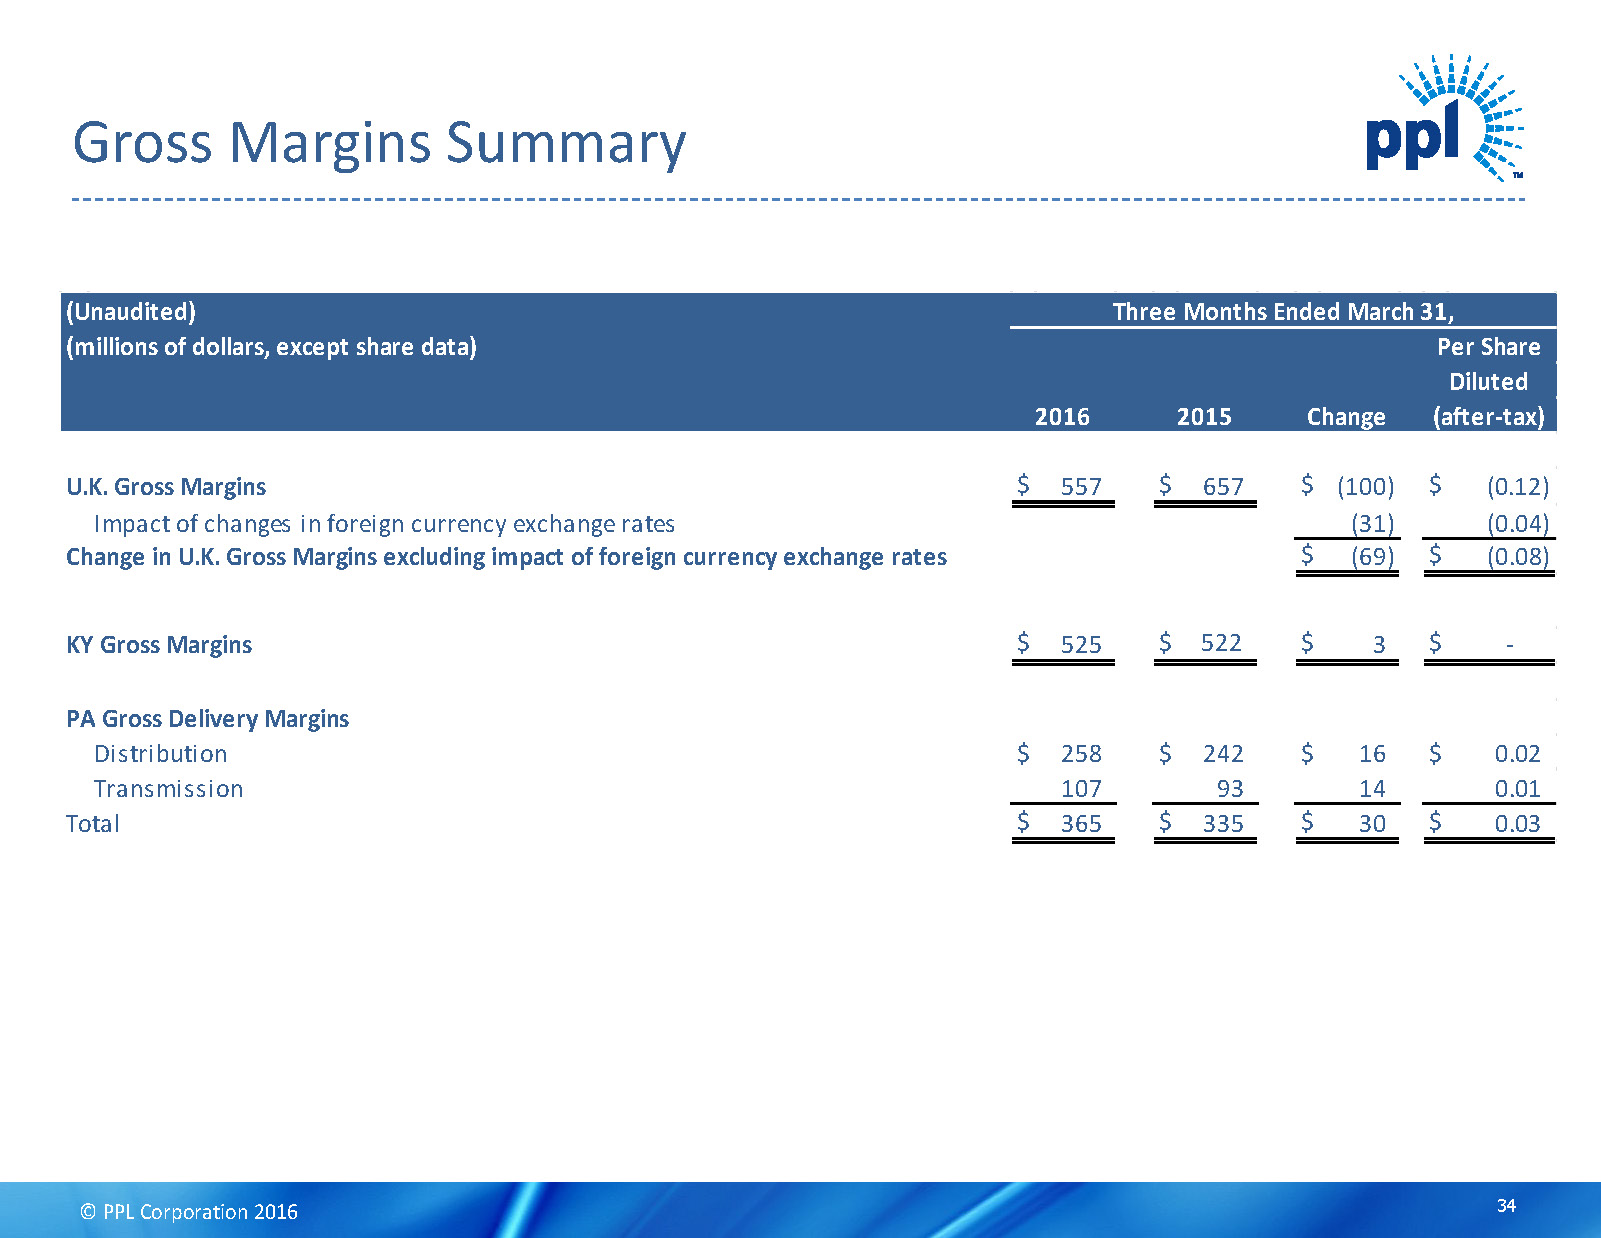
© PPL Corporation 2016 DRAFT Gross Margins Summary $ 557 $ 657 $ (100) $ (0.12) Impact of changes in foreign currency exchange rates (31) (0.04) $ (69) $ (0.08) $ 525 $ 522 $ 3 $ - Distribution $ 258 $ 242 $ 16 $ 0.02 Transmission 107 93 14 0.01 $ 365 $ 335 $ 30 $ 0.03 Total KY Gross Margins PA Gross Delivery Margins Change in U.K. Gross Margins excluding impact of foreign currency exchange rates (Unaudited) (millions of dollars, except share data) U.K. Gross Margins Three Months Ended March 31, Per Share Diluted 2016 2015 Change (after-tax) 34
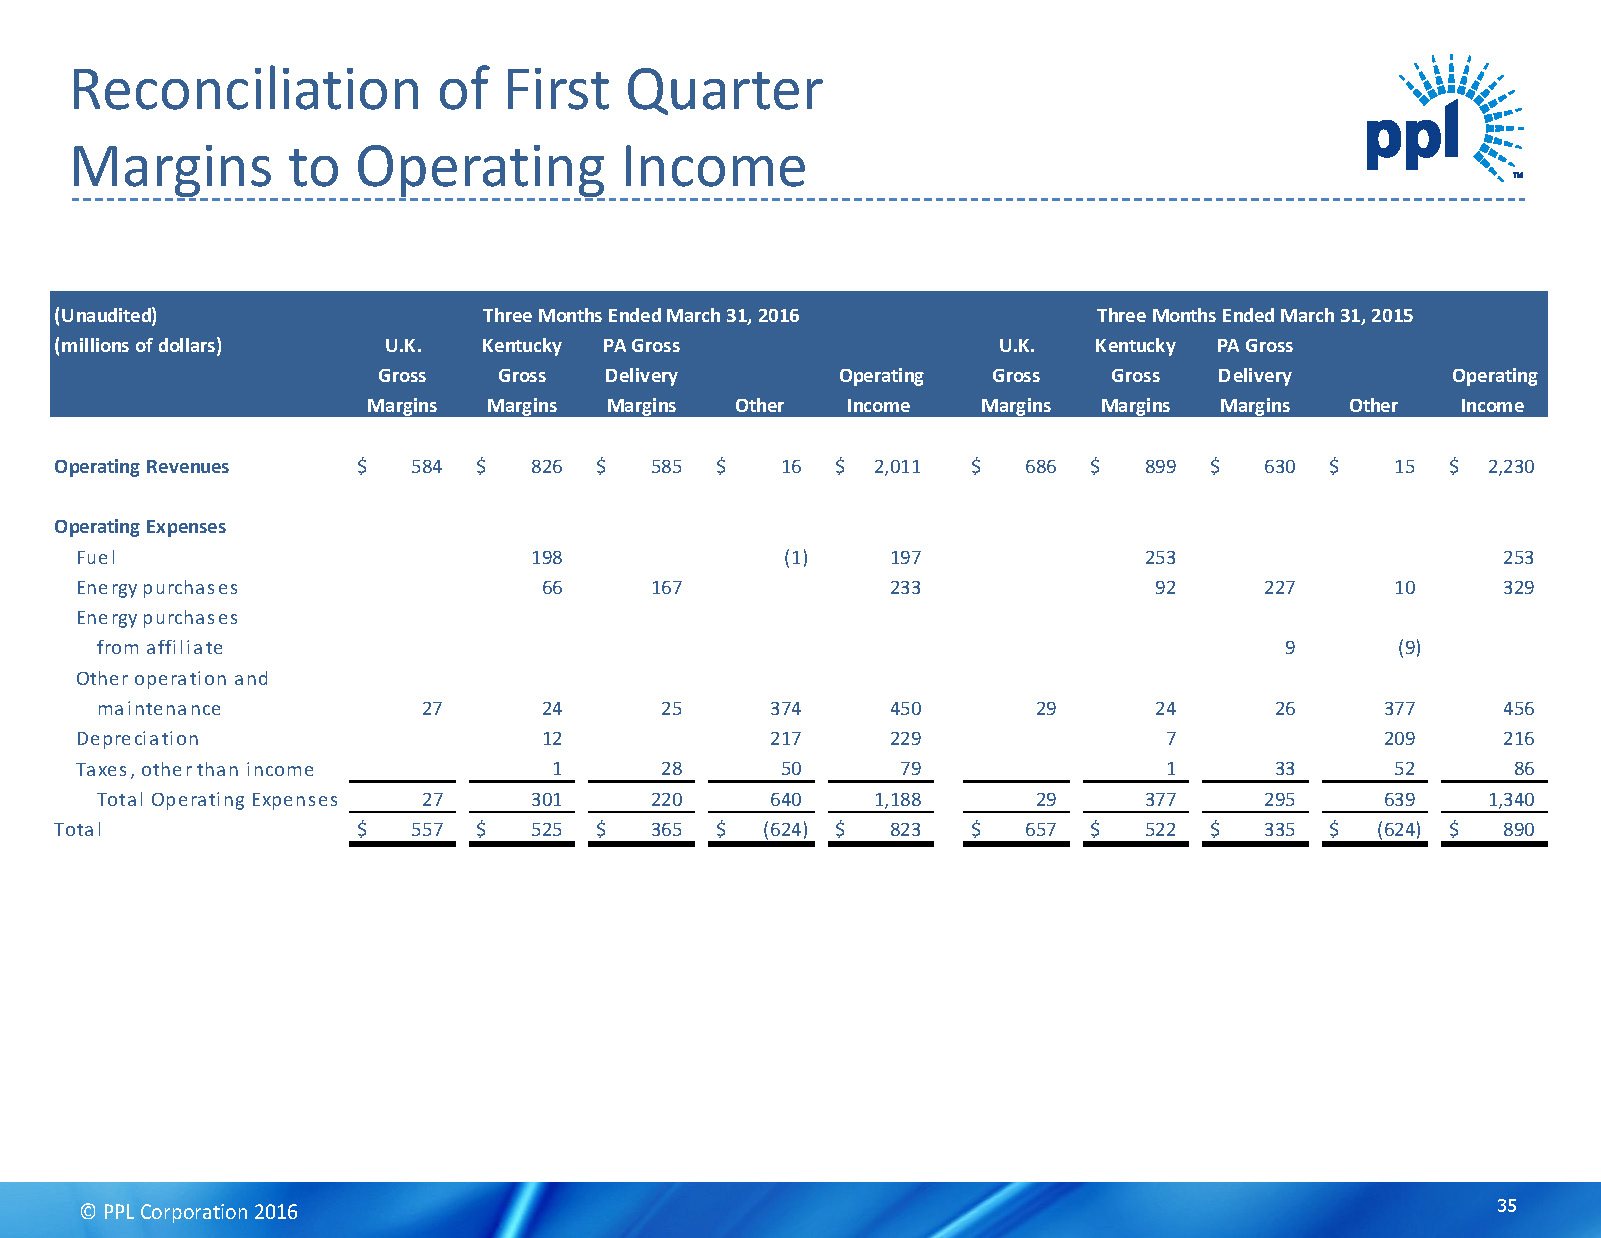
© PPL Corporation 2016 DRAFT Reconciliation of First Quarter Margins to Operating Income $ 584 $ 826 $ 585 $ 16 $ 2,011 $ 686 $ 899 $ 630 $ 15 $ 2,230 198 (1) 197 253 253 66 167 233 92 227 10 329 9 (9) 27 24 25 374 450 29 24 26 377 456 12 217 229 7 209 216 1 28 50 79 1 33 52 86 Total Operating Expenses 27 301 220 640 1,188 29 377 295 639 1,340 $ 557 $ 525 $ 365 $ (624) $ 823 $ 657 $ 522 $ 335 $ (624) $ 890 Operating Three Months Ended March 31, 2016 Other Income Margins Other Income Operating Gross Delivery Kentucky PA Gross KentuckyU.K. Gross Margins (Unaudited) PA Gross Margins Three Months Ended March 31, 2015 U.K. Gross Margins (millions of dollars) Margins Margins Gross Delivery Operating Revenues Total Operating Expenses Fuel Energy purchases Other operation and maintenance Depreciation Taxes, other than income Energy purchases from affiliate 35

© PPL Corporation 2016 DRAFT Reconciliation of Domestic Cash Flows 36 Year Ended December 2015 Additional (Millions of Dollars) Domestic Domestic Funding Sources PPL Consolidated Cash from Cash Available Cash Available Growth for Domestic Statement of Operations for Distribution for Reinvestment Capex Growth Capex PPL Global, LLC Other Cash Flows Net cash provided by operating activities - continuing operations 1,546$ (1) 871$ (183)$ (1) 2,234$ Net cash used in investing activities - continuing operations (640)$ (1,650)$ 115$ (1,226) (3,401) Net cash provided by financing activities - continuing operations (1,004)$ 707 533 246 (2) 482 Net cash distributions to parent from discontinued operations 132 132 Effect of exchange rates on cash and cash equivalents (10) (10) Domestic (increase) decrease in cash and cash equivalents 319 (3) 607 (4) (926) 1,546$ 1,546 1,225$ 1,225 Total 221$ (1,650)$ 1,429$ 168$ (731)$ (563)$ Year Ended December 2014 Additional (Millions of Dollars) Domestic Domestic Funding Sources PPL Consolidated Cash from Cash Available Cash Available Growth for Domestic Statement of Operations for Distribution for Reinvestment Capex Growth Capex PPL Global, LLC Other Cash Flows Net cash provided by operating activities 2,145$ (5) 1,184$ 74$ (5) 3,403$ Net cash used in investing activities (900)$ (1,816)$ 829$ (1,442) (3,329) Net cash provided by financing activities (967)$ 1,451 (86) 185 (2) 583 Effect of exchange rates on cash and cash equivalents (8) (8) Domestic (increase) decrease in cash and cash equivalents 263 (3) (1,005) (4) 742 2,145$ 2,145 1,508$ 1,508 Total 541$ (1,816)$ 1,275$ (352)$ 1,001$ 649$ Reconciling Items Reconciling Items Note: For 2016, due to the generalized and forward-looking nature of this information, the Company has not reconciled the presented non-GAAP financial measures to the most directly comparable GAAP financial measures. (1) Domestic Cash from Operations includes a $191 million PPL Energy Supply, LLC dividend and realized gains of $37 million on U.K. earnings hedges, partially offset by $45 million of discontinued hedges associated with the spinoff of the Supply segment. (2) Primarily represents PPL Global, LLC items that eliminate in PPL's consolidation. (3) Represents dividend from U.K. Regulated and the realized impact of associated net investment hedges. (4) Represents domestic change in cash and cash equivalents, and excludes the adjustments to Domestic Cash from Operations referenced here. (5) Domestic Cash from Operations includes realized losses of $74 million on U.K. earnings hedges.
© PPL Corporation 2016 DRAFT Statementscontainedinthispresentation,includingstatementswithrespecttofutureearnings,cashflows,financing,regulationandcorporate strategyare"forward-lookingstatements"withinthemeaningofthefederalsecuritieslaws.AlthoughPPLCorporationbelievesthatthe expectationsandassumptionsreflectedintheseforward-lookingstatementsarereasonable,thesestatementsaresubjecttoanumberofrisksand uncertainties,andactualresultsmaydiffermateriallyfromtheresultsdiscussedinthestatements.Thefollowingareamongtheimportantfactors thatcouldcauseactualresultstodiffermateriallyfromtheforward-lookingstatements:marketdemandforenergyinourserviceterritories, weatherconditionsaffectingcustomerenergyusageandoperatingcosts;theeffectofanybusinessorindustryrestructuring,includingtheability ofPPLCorporationtorealizeallorasignificantportionoftheanticipatedcostsavingsfromthecorporaterestructuringfollowingtheSupply businessspinoff;theprofitabilityandliquidityofPPLCorporationanditssubsidiaries;newaccountingrequirementsornewinterpretationsor applicationsofexistingrequirements;operatingperformanceofourfacilities;thelengthofscheduledandunscheduledoutagesatourgenerating plants;environmentalconditionsandrequirementsandtherelatedcostsofcompliance;systemconditionsandoperatingcosts;developmentof newprojects,marketsandtechnologies;performanceofnewventures;assetorbusinessacquisitionsanddispositions;anyimpactofhurricanesor othersevereweatheronourbusiness;receiptofnecessarygovernmentpermits,approvals,ratereliefandregulatorycostrecovery;capitalmarket conditionsanddecisionsregardingcapitalstructure;theimpactofstate,federalorforeigninvestigationsapplicabletoPPLCorporationandits subsidiaries;theoutcomeoflitigationagainstPPLCorporationanditssubsidiaries;stockpriceperformance;themarketpricesofequitysecurities andtheimpactonpensionincomeandresultantcashfundingrequirementsfordefinedbenefitpensionplans;thesecuritiesandcreditratingsof PPLCorporationanditssubsidiaries;political,regulatoryoreconomicconditionsinstates,regionsorcountrieswherePPLCorporationorits subsidiariesconductbusiness,includinganypotentialeffectsofthreatenedoractualterrorismorwarorotherhostilities;Britishpoundsterlingto U.S.dollarexchangerates;newstate,federalorforeignlegislation,includingnewtaxlegislation;andthecommitmentsandliabilitiesofPPL Corporationanditssubsidiaries.Anysuchforward-lookingstatementsshouldbeconsideredinlightofsuchimportantfactorsandinconjunction withPPLCorporation'sForm10-KandotherreportsonfilewiththeSecuritiesandExchangeCommission. Forward-Looking Information Statement 37
© PPL Corporation 2016 DRAFT Definitions of Non-GAAP Financial Measures Management utilizes "Earnings from ongoing operations" as a non-GAAP financial measure, and it should not be considered as an alternative to reported earnings, or net income, which is an indicator of operating performance determined in accordance with U.S. generally accepted accounting principles (GAAP).PPL believes that earnings from ongoing operations is useful and meaningful to investors because it provides management's view of PPL's earnings performance as another criterion in making investment decisions. PPL's management also uses earnings from ongoing operations in measuring certain corporate performance goals. Other companies may use different measures to present financial performance. "Earnings from ongoing operations" is adjusted for the impact of special items. Special items include: • Unrealized gains or losses on foreign currency-related economic hedges (as discussed below). • Supply segment discontinued operations. • Gains and losses on sales of assets not in the ordinary course of business. • Impairment charges. • Workforce reduction and other restructuring effects. • Acquisition and divestiture-related adjustments. • Other charges or credits that are, in management's view, not reflective of the company's ongoing operations. Unrealized gains or losses on foreign currency-related economic hedges include the changes in fair value of foreign currency contracts used to economically hedge British-pound-sterling-denominated anticipated earnings. The changes in fair value of these contracts each period are recognized immediately within GAAP earnings. Management believes that excluding these amounts from earnings from ongoing operations until settlement of the contracts provides a better matching of the financial impacts of those contracts with the economic valueof PPL’s underlying hedged earnings. 38
© PPL Corporation 2016 DRAFT Definitions of Non-GAAP Financial Measures Managementalsoutilizesthefollowingnon-GAAPfinancialmeasuresasindicatorsofperformanceforitsbusinesses. "U.K.GrossMargins"isasinglefinancialperformancemeasureoftheelectricitydistributionoperationsoftheU.K.Regulatedsegment.Incalculating thismeasure,directcostssuchasNationalGridconnectionchargesandOfgemlicensefees(recordedin"Otheroperationandmaintenance"onthe StatementsofIncome)aredeductedfromoperatingrevenues,astheyarecostspassedthroughtocustomers.Asaresult,thismeasurerepresentsthe netrevenuesfromthedeliveryofelectricityacrossWPD'sdistributionnetworkintheU.K.anddirectlyrelatedactivities. "KentuckyGrossMargins"isasinglefinancialperformancemeasureoftheelectricitygeneration,transmissionanddistributionoperationsofthe KentuckyRegulatedsegment,LKE,LG&EandKU,aswellastheKentuckyRegulatedsegment's,LKE'sandLG&E'sdistributionandsaleofnaturalgas. Incalculatingthismeasure,fuel,energypurchasesandcertainvariablecostsofproduction(recordedin"Otheroperationandmaintenance"onthe Statementsof Income) arededucted fromrevenues. In addition,certainotherexpenses,recordedin"Otheroperationand maintenance", "Depreciation"and"Taxes,otherthanincome"ontheStatementsofIncome,associatedwithapprovedcostrecoverymechanismsareoffsetagainst therecoveryofthoseexpenses,whichareincludedinrevenues. Thesemechanismsallowfordirectrecoveryoftheseexpensesand,insomecases, returnsoncapitalinvestmentsandperformanceincentives.Asaresult,thismeasurerepresentsthenetrevenuesfromelectricityandgasoperations. "PennsylvaniaGrossDeliveryMargins"isasinglefinancialperformancemeasureoftheelectricitytransmissionanddistributiondeliveryoperationsof thePennsylvaniaRegulatedsegmentandPPLElectric. Incalculatingthismeasure,utilityrevenuesandexpensesassociatedwithapprovedrecovery mechanisms,includingenergyprovidedasaPLR,areoffsetwithminimalimpactonearnings.Costsassociatedwiththesemechanismsarerecordedin "Energypurchases,""Otheroperationandmaintenance,"(whichareprimarilyAct129andUniversalServiceprogramcosts),and"Taxes,otherthan income,"whichisprimarilygrossreceiptstax.ThisperformancemeasureincludesPLRenergypurchasesbyPPLElectricfromPPLEnergyPlus,whichare reflectedin"Energypurchasesfromaffiliate"inthereconciliationtables.AsaresultoftheJune2015spinoffofPPLEnergySupplyandtheformationof TalenEnergy,PPLEnergyPlus(renamedTalenEnergyMarketing)isnolongeranaffiliateofPPLElectric. PPLElectric'spurchasesfromTalenEnergy MarketingsubsequenttoMay31,2015arereflectedin"EnergyPurchases"inthereconciliationtables.Thismeasurerepresentsthenetrevenuesfrom thePennsylvaniaRegulatedsegment'sandPPLElectric'selectricitydeliveryoperations. Thesemeasuresarenotintendedtoreplace"OperatingIncome,"whichisdeterminedinaccordancewithGAAP,asanindicatorofoveralloperating performance. Othercompaniesmayusedifferentmeasurestoanalyzeandreporttheirresultsofoperations. Managementbelievesthesemeasures provideadditionalusefulcriteriatomakeinvestmentdecisions. Theseperformancemeasuresareused,inconjunctionwithotherinformation,by seniormanagementandPPL'sBoardofDirectorstomanageoperationsandanalyzeactualresultscomparedwithbudget. 39