UNITED STATES
SECURITIES AND EXCHANGE COMMISSION
Washington, D.C. 20549
Form 8-K
Current Report
Pursuant to Section 13 or 15(d)
of the Securities Exchange Act of 1934
February 7, 2002
Date of Report (Date of earliest event reported)
BB&T Corporation
(Exact name of registrant as specified in its charter)
Commission file number : 1-10853
| North Carolina | 56-0939887 |
| (State of incorporation) | (I.R.S. Employer Identification No.) |
| 200 West Second Street | |
| Winston-Salem, North Carolina | 27101 |
| (Address of principal executive offices) | (Zip Code) |
(336) 733-2000
(Registrant's telephone number, including area code)
This Form 8-K has 45 pages.
ITEM 5. OTHER EVENTS
The purpose of this Current Report on Form 8-K is to file presentation materials from BB&T's 2002 Investor Conference, held on February 7, 2002.
EXHIBIT INDEX
Exhibit 99.1 Presentation to Analysts on February 7, 2002
BB&T CORPORATION

Loan Portfolio
Performance and Strategies
February 2002
PEER PERFORMANCE COMPARISON
PORTFOLIO & LINES OF BUSINESS
RISK MANAGEMENT
LONG TERM RISK MANAGEMENT STRATEGIES
LOAN PORTFOLIO MANAGEMENT
NONPERFORMING ASSETS/
TOTAL LOANS
NET CHARGE-OFFS/AVERAGE LOANS
TOTAL LOAN YIELD

TOTAL LOAN GROWTH
BB&T PORTFOLIO
and
LINES OF BUSINESS
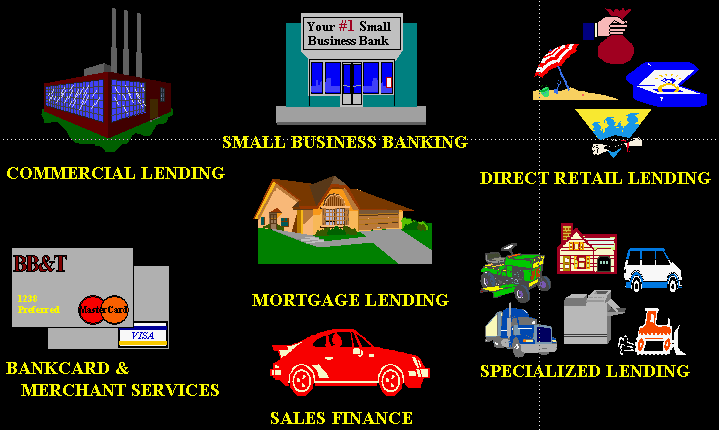
LINES OF BUSINESS
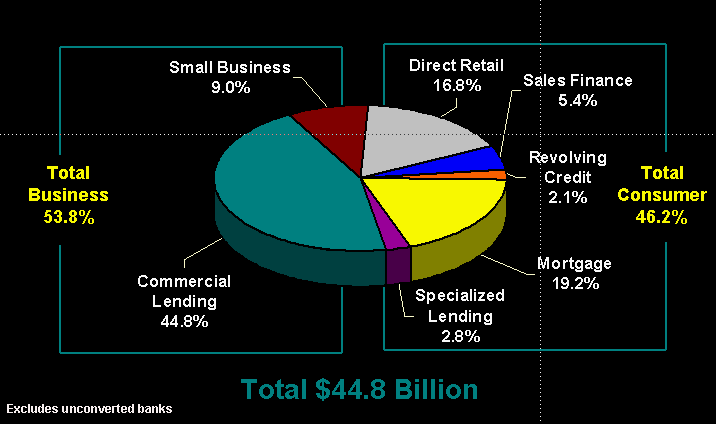
Portfolio Summary
As of December 31, 2001
| Proforma w/ F&M, | |||||||||
|---|---|---|---|---|---|---|---|---|---|
| Community First, | |||||||||
| AREA & Mid-America | |||||||||
| $ | % | $ | % | ||||||
| Commercial Loans | 20,033 | 44.8 | 22,724 | 44.9 | |||||
| Small Business | 4,040 | 9.0 | 4,631 | 9.2 | |||||
| Direct Retail | 7,515 | 16.8 | 8,317 | 16.4 | |||||
| Sales Finance | 2,402 | 5.4 | 2,659 | 5.3 | |||||
| Bankcard & Merchant | 948 | 2.1 | 970 | 1.9 | |||||
| Mortgage | 8,588 | 19.2 | 10,017 | 19.8 | |||||
| Specialized Lending | 1,239 | 2.8 | 1,272 | 2.5 | |||||
| TOTAL | $44,765 | 100.0 | % | $50,590 | 100.0 | % | |||
$ In Millions
COMMERCIAL LENDING
- Loans to small and middle market companies
* Locally based or major local presence
* Closely held, owner involvement
* Total sales under $200 Million
* Service and relationship driven - Portfolio includes Commercial Real Estate
* In-market lending to experienced clients - Delivered in a value-added style
* Responsive, reliable, flexible and advisory
* Community bank, decentralized
* Quality service focus

COMMERCIAL LENDING
| Plan | ||||||||||||||
|---|---|---|---|---|---|---|---|---|---|---|---|---|---|---|
| 2000 | 2001 | 2002 | ||||||||||||
 | Past Dues | .80% | 1.24% | 1.50% or less | ||||||||||
| Loan Losses | .05% | .22% | .25% or less | |||||||||||
 | Yield | Prime + | Prime + | Prime + | ||||||||||
| .25 % | .83 % | 1.15 % | ||||||||||||
| % Increase | ||||||||||||||
| 00-01 | 01-02 | |||||||||||||
 | Growth | $ 17,563 | $ 19,501 | 11.04 % | 7.00 % | |||||||||
$ in Millions
Excludes Unconverted Banks
SMALL BUSINESS BANKING

- Market segment with common characteristics:
* Owner/Manager
* One or two locations
* Less than 20 employees
* Sales under $2.5 Million
* Credit needs of $500,000 or less
* Often use the branches - Standard credit and deposit products delivered by Business Bankers and City Executives
Largest Small Business lender in the Carolinas, Virginia and West Virginia
SMALL BUSINESS BANKING
| Top 10 Small | # 1 Small Business | ||
|---|---|---|---|
| Business Lenders | Friendly Bank | ||
| 1. | Wells Fargo | 1. | BB&T |
| 2. | Bank of America | 2. | Regions |
| 3. | US Bancorp | 3. | US Bancorp |
| 4. | Bank One | 4. | Wells Fargo |
| 5. | First Union | 5. | Union Planters |
| 6. | BB&T | 6. | Columbus B&T |
| 7. | National City | 7. | Zions |
| 8. | Sun Trust | 8. | AmSouth |
| 9. | Fifth Third | 9. | Colonial |
| 10. | Key Corp | 10. | National City |
| Source: December 2001 Issue of | Source: June 2001 Small | ||
| SNL Securities - Specialty Lender | Business Administration | ||
SMALL BUSINESS BANKING
| Plan | ||||||||||||||
|---|---|---|---|---|---|---|---|---|---|---|---|---|---|---|
| 2000 | 2001 | 2002 | ||||||||||||
| Past Dues | 2.35% | 3.16% | 3.00% or less | ||||||||||
| Loan Losses | .35% | .62% | .65% or less | |||||||||||
| Yield | Prime + | Prime + | Prime + | ||||||||||
| 1.01% | 1.73% | 2.00% | ||||||||||||
| % Increase | ||||||||||||||
| 00-01 | 01-02 | |||||||||||||
| Growth | $ 3,776 | $ 4,012 | 6.28% | 4.80% | |||||||||
$ in Millions
Excludes Unconverted Banks
DIRECT RETAIL LENDING
- Consumer purpose term loans and convenient personal lines of credit
- Products delivered to clients through branch network by Retail Service Officers and Financial Center Managers
- Noninterest income from Credit Life insurance sales and loan related fees
- 83% of all Direct Retail Lending loans are secured by Real Estate
Largest Home Equity Line lender in the Carolinas

DIRECT RETAIL LENDING
DIRECT RETAIL LENDING
| Plan | ||||||||||||||
|---|---|---|---|---|---|---|---|---|---|---|---|---|---|---|
| 2000 | 2001 | 2002 | ||||||||||||
| Past Dues | 1.44% | 1.77% | 1.75% or less | ||||||||||
| Loan Losses | .21% | .27% | .30% or less | |||||||||||
| Yield | 9.68% | 8.90% | 8.00% | ||||||||||
| % Increase | ||||||||||||||
| 00-01 | 01-02 | |||||||||||||
| Growth | $ 7,363 | $ 7,535 | 2.34% | 6.00% | |||||||||
$ in Millions
Excludes Unconverted Banks
SALES FINANCE

- Automobile financing provided through automobile retail dealerships
- New loan contracts purchased from over 1,500 active dealers by Sales Finance Specialists in 9 centers
- Each dealer client is assigned to a Relationship Manager in the branch network
- Over 60% of Dealers have commercial loan/deposit relationships
- Consistently ranked in Top 5% of all bank indirect lenders in Dealer Satisfaction (by J.D. Powers)
SALES FINANCE
| Plan | ||||||||||||||
|---|---|---|---|---|---|---|---|---|---|---|---|---|---|---|
| 2000 | 2001 | 2002 | ||||||||||||
| Past Dues | 2.56% | 2.60% | 2.50% or less | ||||||||||
| Loan Losses | .69% | .89% | .85% or less | |||||||||||
| Yield | 8.76% | 8.85% | 8.10% | ||||||||||
| % Increase | ||||||||||||||
| 00-01 | 01-02 | |||||||||||||
| Growth | $ 2,461 | $ 2,446 | -.60% | .20% | |||||||||
$ in Millions
Excludes Unconverted Banks
BANKCARD and
MERCHANT SERVICES
- Bankcard Products (VISA & MasterCard) and Overdraft Protection
* Delivered through Branch Network, Direct Mail and Telemarketing
* One-quarter of production through branch POS system
* Sold within BB&T's Geographic Market
• Merchant Services (POS Payment Processing) |
BANKCARD and
MERCHANT SERVICES
| Plan | ||||||||||||||
|---|---|---|---|---|---|---|---|---|---|---|---|---|---|---|
| 2000 | 2001 | 2002 | ||||||||||||
| Past Dues | 2.29% | 2.29% | 2.50% or less | ||||||||||
| Loan Losses | 2.92% | 3.28% | 3.30% or less | |||||||||||
| Yield | 17.22% | 16.24% | 15.97% | ||||||||||
| % Increase | ||||||||||||||
| 00-01 | 01-02 | |||||||||||||
| Growth | $ 740 | $ 871 | 17.81% | 13.00% | |||||||||
$ in Millions
Excludes Unconverted Banks
MORTGAGE LENDING

Production
- Largest originator of mortgage loans in the Carolinas
- Home purchase/refinance loans originated in over 200 cities
- Correspondent Lending purchases loans from 130 + correspondents, primarily mortgage bankers and financial institutions
- Wholesale Lending purchases loans from over 500 mortgage brokers
Servicing
- Servicing retained as a client service, relationship building strategy
Total Servicing -- $29.0 Billion -- 295,000 mortgages
MORTGAGE LENDING
| Plan | ||||||||||||||
|---|---|---|---|---|---|---|---|---|---|---|---|---|---|---|
| 2000 | 2001 | 2002 | ||||||||||||
| Past Dues | 2.51% | 2.94% | 3.00% or less | ||||||||||
| Loan Losses | .02% | .02% | .03% or less | |||||||||||
| Yield | 7.72% | 7.43% | 6.82% | ||||||||||
| % Increase | ||||||||||||||
| 00-01 | 01-02 | |||||||||||||
| Growth | $8,430 | $8,917 | 5.80% | -4.66% | |||||||||
| Originations | $5,072 | $10,525 | $7,800 | |||||||||||
$ in Millions
Excludes Unconverted Banks
BB&T MORTGAGE INCOME
Residential Mortgages
| Plan | ||||||||||||||
|---|---|---|---|---|---|---|---|---|---|---|---|---|---|---|
| 2000 | 2001 | 2002 | ||||||||||||
| Origination Revenue | 16,043 | 47,226 | 28,515 | |||||||||||
| Servicing Revenue | 50,418 | 68,029 | 78,009 | |||||||||||
| Gross Revenue | $66,461 | $115,255 | $106,524 | |||||||||||
| Mortgage Servicing Rights (MSRs): | ||||||||||||||
| Income at origination | 36,358 | 72,340 | 53,893 | |||||||||||
| Provision for Impairment | -2,964 | -67,085 | -- | |||||||||||
| Impairment Recapture | -- | 5,930 | 40,000 | |||||||||||
| Net MSRs | $33,394 | $ 11,185 | $ 93,893 | |||||||||||
| BB&T Mortgage Banking Income | $99,855 | $126,440 | $200,417 | |||||||||||
| Noninterest Expenses: | ||||||||||||||
| Amortization of MSRs | 18,441 | 43,481 | 58,174 | |||||||||||
| Mortgage Loan Incentive Comp. | 17,010 | 31,017 | 25,598 | |||||||||||
| Total Expenses | $35,451 | $ 74,498 | $ 83,772 | |||||||||||
| Net BB&T Mortgage Banking Income | $64,132 | $ 51,942 | $116,645 | |||||||||||
$ in Millions
SPECIALIZED
LENDING
- Eight non-bank companies with oversight provided by advisory boards of directors from the bank and subsidiaries
- Provides "higher risk" financing alternatives to consumers and businesses
- Bank clients as well as non-bank clients within and outside the bank's primary geographic market area served by these subsidiaries
* Laureate Capital -- Commercial mortgage banking
* BB&T Factors -- Commercial factoring services
* BB&T Leasing -- Commercial fleet and equipment leasing
* Sheffield Financial -- Financing of outdoor power equipment
* Regional Acceptance -- Indirect sub-prime auto finance
* Lendmark Financial Services -- Sub-prime mortgage lending
* Rose Shanis Financial Services -- Direct consumer finance
* Prime Rate Premium Finance -- Insurance premium finance
SPECIALIZED LENDING
| Plan | ||||||||
|---|---|---|---|---|---|---|---|---|
| 2000 | 2001 | 2002 | ||||||
| Loan Losses | 2.61 | % | 3.25 | % | 3.35 | % | |
| Yield | 16.34 | % | 16.52 | % | 17.07 | % | |
| Growth | 26.92 | % | 23.20 | % | 21.36 | % | |
| Net Income* | $38.6 | $50.9 | $69.1 | |||||
$ in Millions
Excludes BB&T Factors and Laureate Capital
* Before Taxes and Intercompany Expenses
TOTAL LOAN PORTFOLIO
| Plan | ||||||||
|---|---|---|---|---|---|---|---|---|
| 2000 | 2001 | 2002 | ||||||
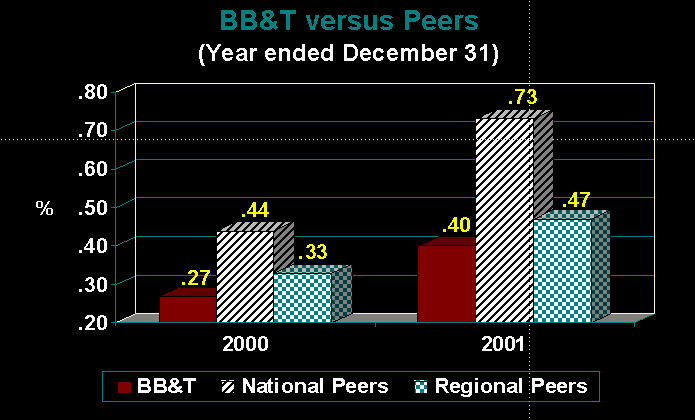
| Loan Losses | .27 | % | .40 | % | .45 | % | |
| Yield | Prime + | Prime + | Prime + | ||||
| .16% | 1.45% | 2.00% | ||||||
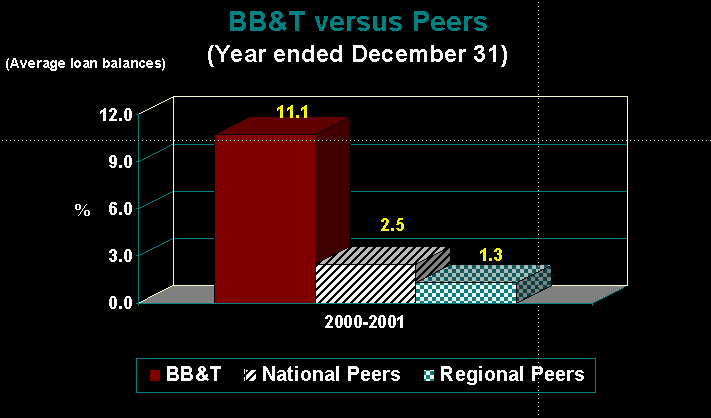
| Growth | $41,934 | $46,590 | $51,762 | ||||
| % Increase | 10.90% | 11.10% | 11.10% | |||||
$ in Millions
TOTAL LOAN PORTFOLIO
| Plan | |||
|---|---|---|---|
| 2000 | 2001 | 2002 | |
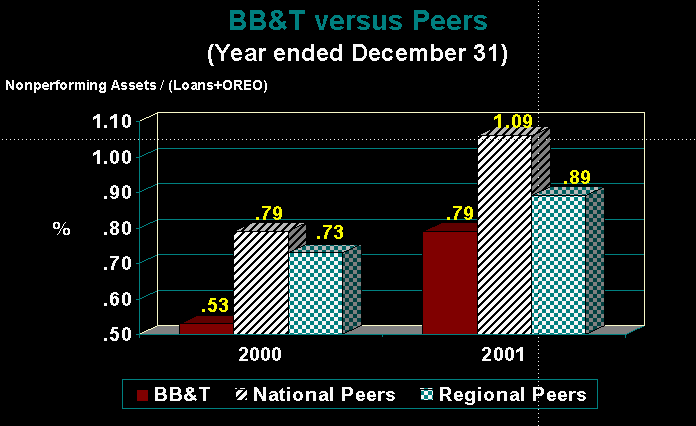
| Nonperforming Assets (EOP) | $ 236,329 | $ 373,571 | $ 395,000 |
| Nonperforming Assets/ | .36 | .53 | .50 |
| Total Assets (EOP) | |||
| Nonperforming Assets/ | .53 | .79 | .75 |
| Total Loans +ORE (EOP) | |||
| Loan Loss Reserve/ | 2.45x | 1.73x | 1.78x |
| Nonperforming Assets (EOP) |
$ in Thousands
RISK MANAGEMENT
Risk Management
Diversification by Lines of Business
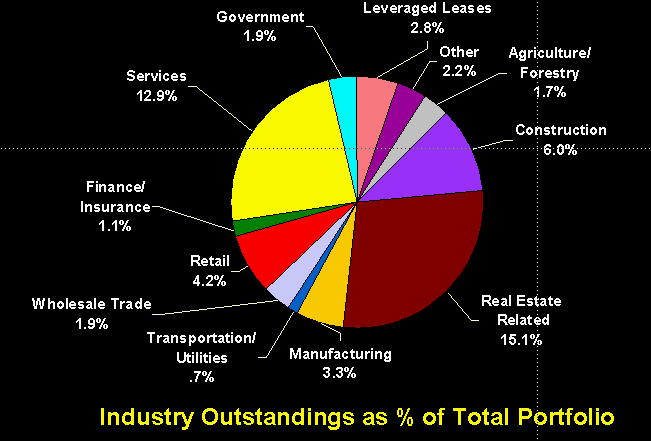
Risk Management
Diversification by Industry
Risk Management
Watch List Distribution
Highest Percentage of Watch List Credits in Manufacturing
| % of Total | % of Total | % of | |
|---|---|---|---|
| Loans | Business Loans | Watch List | |
| Manufacturing | 3.3 | 6.1 | 29.0 |
| Services | 12.9 | 23.9 | 16.4 |
| Retail | 4.2 | 7.9 | 15.1 |
| Real Estate Related | 15.1 | 28.1 | 14.8 |
| Construction | 6.0 | 11.1 | 8.5 |
| Agriculture/Forestry | 1.7 | 3.2 | 8.2 |
| Wholesale Trade | 1.9 | 3.5 | 2.5 |
| Transportation/Utilities | 0.7 | 1.4 | 1.6 |
| All Other Industries | 8.0 | 14.8 | 3.9 |
| 53.8 | 100.0 | 100.0 |
69% of Watch List in North and South Carolina
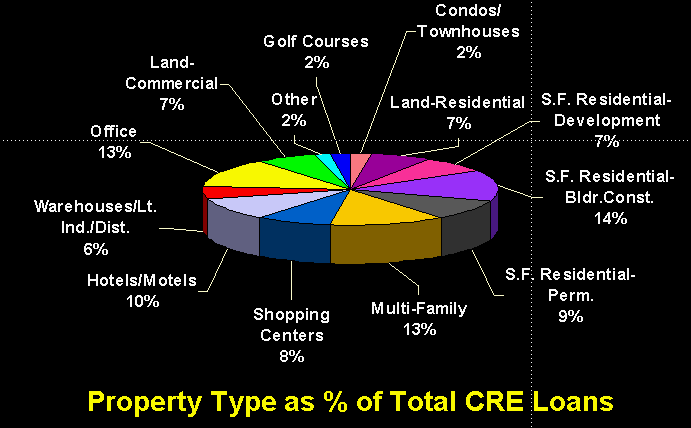
Risk Management
Commercial Real Estate
Largest concentration is
Commercial Real Estate loans
(Definition: the primary source
of funds for repayment is the sale
or rental of the property)
• Total CRE portfolio = $8.5 billion
* 18.9% of Total Loans
• Highly diversified by Property Type
Risk Management
Diversification by Property Type
Risk Management
Commercial Real Estate
![]() In-market relationship lending focus
In-market relationship lending focus![]() Underwrite client as well as the transaction
Underwrite client as well as the transaction![]() Professional CRE Underwriters assist with >$5,000,000 loans
Professional CRE Underwriters assist with >$5,000,000 loans![]() Professional Construction Managers inspect >$1,000,000 loans
Professional Construction Managers inspect >$1,000,000 loans![]() CRE limits by Risk Grade = 1/2 of non- CRE limits
CRE limits by Risk Grade = 1/2 of non- CRE limits![]() Single project limit of $25,000,000
Single project limit of $25,000,000
Risk Management
Diversification by Size of Relationship
Commercial and Small Business Relationships
| Relationship | # of | Outstandings | % of Total | ||||
|---|---|---|---|---|---|---|---|
| Commitment | Relationships | $ in Thousands | Loans | ||||
| ‹ $500M | 74,690 | $ 5,822,669 | 13.0 | % | |||
| $500M - $2MM | 6,376 | 4,831,563 | 10.8 | % | |||
| $2MM - $5MM | 1,839 | 4,159,587 | 9.3 | % | |||
| $5MM - $10MM | 564 | 2,720,019 | 6.1 | % | |||
| $10MM - $20MM | 239 | 2,172,438 | 4.9 | % | |||
| › $20MM | 142 | 2,332,067 | 5.2 | % | |||
| Total | 83,850 | $22,038,343 | 49.3 | % | |||
Average Small Business Relationship = $78,000
Average Commercial Relationship = $1,800,000
Excludes Leases
Risk Management
Diversification by Size of Relationship
Limited exposure to Shared National Credits
![]() Total outstandings = $618 million
Total outstandings = $618 million 1.3% of Total Loans
![]() Participation in syndicated credits limited to Relationship-based clients
Participation in syndicated credits limited to Relationship-based clients
Average Committed = $21 million
Average Outstandings = $9 million
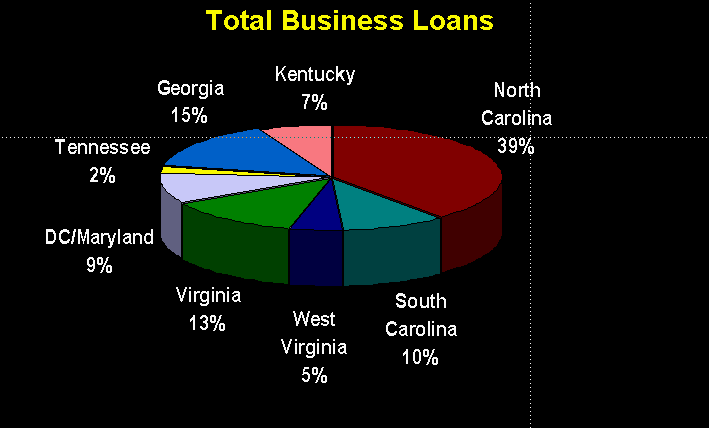
Risk Management
Diversification by State
Risk Management
Small Business Portfolio
![]() In-market Relationship Driven Strategy
In-market Relationship Driven Strategy![]() Dedicated lenders in branches close to clients
Dedicated lenders in branches close to clients![]() Judgmental underwriting with scoring as tool only
Judgmental underwriting with scoring as tool only![]() 64% of portfolio secured by real estate
64% of portfolio secured by real estate![]() Loss results will continue to better industry averages
Loss results will continue to better industry averages
Risk Management
Consumer Portfolio
Mortgage: (19.2% of Total Loans) Low risk single family permanent mortgages
Direct Retail: (16.8% of Total Loans) 83% of portfolio is real estate secured
Sales Finance: (5.4% of Total Loans) No retail leasing Expect used car prices to stabilize
Bankcard: (2.1% of Total Loans) Issue cards in-market; relationship-based strategy
Specialized Lending: (2.8% of Total Loans) Diversified segment/product mix
LONG TERM RISK
MANAGEMENT STRATEGIES
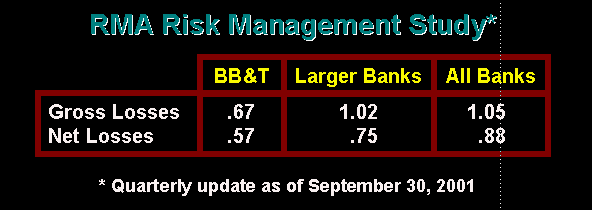
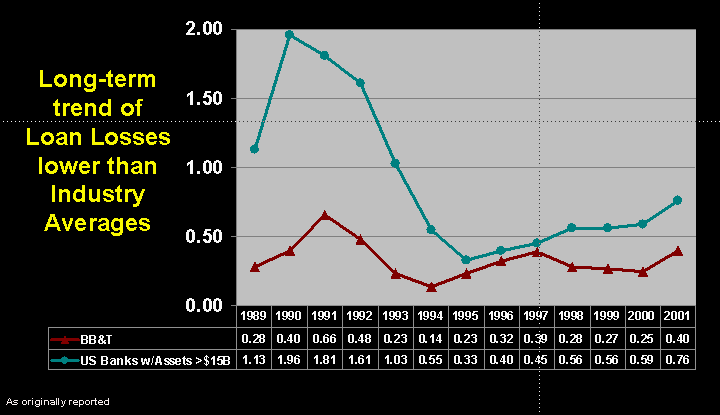
BB&T LOAN LOSS HISTORY
RISK MANAGEMENT STRATEGIES
*Instill the BB&T Values Driven Credit Culture*
*Focus on knowledge of local markets and individual clients*
*Practice sound and fundamental underwriting and portfolio management techniques*
*Diversify to mitigate concentration risks*
LOAN PORTFOLIO MANAGEMENT
S I G N A T U R E
Pursuant to the requirements of the Securities Exchange Act of 1934, the registrant has duly caused this report to be signed on its behalf by the undersigned hereunto duly authorized.
BB&T CORPORATION
(Registrant)
By: /S/ SHERRY A. KELLETT
Sherry A. Kellett
Senior Executive Vice President and Controller
(Principal Accounting Officer)
Date: February 7, 2002