Exhibit 99.2
BB&T
and
First Citizens Bancorp
Cleveland, Tennessee
Expanding a Great Franchise
Analyst Presentation
January 12, 2006
Forward-Looking Information
BB&T has made forward-looking statements in the accompanying analyst presentation materials that are subject to risks and uncertainties. These statements are based on the beliefs and assumptions of the management of BB&T, and on the information available to management at the time the analyst presentation materials were prepared. In particular, the analyst materials in this report include statements regarding estimated earnings per share of BB&T on a stand alone basis, expected cost savings from the merger, estimated merger or restructuring charges, estimated increases in First Citizens Bancorp’s fee income ratio and net interest margin, estimated financial impacts resulting from deposit divestitures, the anticipated accretive effect of the merger, and BB&T’s anticipated performance in future periods. With respect to estimated cost savings and merger or restructuring charges, BB&T has made assumptions about, among other things, the extent of operational overlap between BB&T and First Citizens Bancorp, the amount of general and administrative expense consolidation, costs relating to converting First Citizens Bancorp’s bank operations and data processing to BB&T’s systems, the size of anticipated reductions in fixed labor costs, the amount of severance expenses, the extent of the charges that may be necessary to align the companies’ respective accounting policies, and the cost related to the merger. The realization of cost savings and the amount of merger or restructuring charges are subject to the risk that the foregoing assumptions are inaccurate.
Any statements in the accompanying exhibit regarding the anticipated accretive effect of the merger and BB&T’s anticipated performance in future periods are subject to risks relating to, among other things, the following possibilities: (1) expected cost savings from this merger or other previously announced mergers may not be fully realized or realized within the expected time frame; (2) deposit attrition, customer loss or revenue loss following proposed mergers may be greater than expected; (3) competitive pressure among depository and other financial institutions may increase significantly; (4) costs or difficulties related to the integration of the businesses of BB&T and its merger partners, including First Citizens Bancorp, may be greater than expected; (5) changes in the interest rate environment may reduce margins; (6) general economic or business conditions, either nationally or regionally, may be less favorable than expected, resulting in, among other things, a deterioration in credit quality, or a reduced demand for credit; (7) legislative or regulatory changes, including changes in accounting standards, may adversely affect the businesses in which BB&T and First Citizens Bancorp are engaged; (8) adverse changes may occur in the securities markets; and (9) competitors of BB&T and First Citizens Bancorp may have greater financial resources and develop products that enable such competitors to compete more successfully than BB&T and First Citizens Bancorp.
BB&T believes these forward-looking statements are reasonable; however, undue reliance should not be placed on such forward-looking statements, which are based on current expectations. Such statements are not guarantees of performance. They involve risks, uncertainties and assumptions. The future results and shareholder value of BB&T following completion of the merger may differ materially from those expressed in these forward-looking statements. Many of the factors that will determine these results and values are beyond management’s ability to control or predict.
Outline
| · | | Background and transaction terms |
| · | | Rationale for the acquisition |
BB&T Corporation (BBT)
| · | | $109.6 billion financial holding company* |
| · | | 1,427 branch locations in NC, SC, VA, GA, MD, WV, KY, TN, FL, AL, IN, and the District of Columbia* |
| | For 3 Months |
|---|
| | Ended 9/30/05 |
|---|
| · | | ROA | | 1.64 | % |
| · | | Cash Basis ROA | | 1.81 | % |
| · | | ROE | | 15.65 | % |
| · | | Cash Basis ROE | | 28.56 | % |
| · | | Cash Basis Efficiency Ratio | | 49.66 | % |
*Includes the previously announced acquisition of Main Street Banks, Inc.
First Citizens Bancorp*
| · | | $686 million multi-bank holding company headquartered in Cleveland, TN |
| · | | First Citizens has 19 branches: 16 in Eastern Tennessee, two in North Carolina, and one in Georgia |
| | For 3 months |
|---|
| | Ended 9/30/05 |
|---|
| · | | | ROA | | | | 1.41 | % |
| · | | | Cash Basis ROA | | | | 1.41 | % |
| · | | | ROE | | | | 19.66 | % |
| · | | | Cash Basis ROE | | | | 19.66 | % |
| · | | | Cash Basis Efficiency Ratio | | | | 49.53 | % |
*First Citizens is a privately held company.
Company History
| · | | Originally founded in 1974, the Company now operates three separately chartered bank subsidiaries: |
| — | The Home Bank of Tennessee |
| · | | First Citizens collectively serves six counties in East Tennessee, including the major MSA’s of Chattanooga and Knoxville |
| · | | First Citizens has strong market coverage along the I-75 corridor connecting Chattanooga and Knoxville, TN |
| · | | Twelfth largest Tennessee-based bank; 4th largest in Eastern Tennessee |
| · | | The Bank/First Citizens is the lead subsidiary bank |
Pro Forma Company Profile
| | |
|---|
| · | | Size: | | $110.2 billion in assets* | |
| | | | | $23.5 billion in market capitalization** | |
| · | | Offices: | | | |
| |
|---|
| VA | | 404 | |
| NC | | 335 | |
| GA | | 144 | * |
| MD | | 127 | |
| SC | | 98 | |
| KY | | 94 | |
| FL | | 89 | |
| WV | | 80 | |
| | |
| TN | | 63 | |
| | |
| DC | | 9 | |
| AL | | 2 | |
| IN | | 1 | |
| TOTAL | | 1,446 | |
*Includes previously announced Main Street Banks, Inc. pending acquisition
**Based on closing prices as of 01/11/06
Terms of the Transaction
Terms of the Transaction
| · | Aggregate value: | $142.6 million* |
| · | Consideration: | First Citizens shareholders will have the opportunity to make an election to exchange their shares based on one of the following two options: ** |
| 1. | A fixed exchange ratio of 1.30 of a share of BB&T stock for each share of First Citizens stock |
| 2. | A fixed cash price based on BB&T’s average share price for a five-day period multiplied by 1.30; the cash election will be limited to an aggregate of 25% of the First Citizens’ shares outstanding |
| · | Structure: | Tax-free exchange to the extent that stock is received |
| · | Termination fee: | $6 million |
| · | Expected closing: | Second quarter 2006 |
*Based on BB&T’s closing stock price of $41.94 on 01/11/06 and assuming shareholders choose the stock election (option 1).
**Individual shareholders will be able to elect the proportion of their shares they exchange for option 1 or option 2. To the extent that total cash elections received from shareholders exceed the aggregate cash available, shares exchanged for the cash election (option 2) will be reallocated to the stock election (option 1) on a proportional basis. The aggregate cash election will be limited to 25% of the First Citizens’ shares outstanding.
Pricing*
| | |
|---|
| · | | Purchase price | | $54.52 | |
| · | | Price/9-30-05 stated book | | 3.31x | |
| · | | Price/9-30-05 tangible book | | 3.35x | |
| · | | Price/9-30-05 LTM EPS | | 15.52x | |
| · | | Price/9-30-05 LTM Core EPS | | 15.17x | |
| · | | Price/2005 EPS estimate | | 14.93x | |
| · | | Price/2006 EPS estimate | | 13.37x | |
| · | | BB&T shares issued | | 3.40 million** | |
*Assumes stock election by shareholders.
**BB&T shares based on First Citizens' shares outstanding adjusted for stock options using the treasury method. BB&T expects to repurchase approximately 2.9% of these shares in the transaction.
Acquisition Comparables*
Comparable Acquisitions Announced in the Southeast since January 1, 2004
with Seller Assets over $50 Million
| | | | | | | | | | Deal Pr/ | Deal Pr/ |
|---|
| | | Date | Seller | | Deal Value/ | Deal Pr/ | Deal | Deal Pr/ | LTM | LTM Core |
|---|
| Buyer | Seller | Announced | Total Assets | Deal Value | Assets | Stock Pr | Pr/Bk | Tg Bk | EPS | EPS |
|---|
| | | | ($M) | ($M) | (%) | (%) | (%) | (%) | (x) | (x) |
|---|
| | | | | | | | | | | |
|---|
| South Financial Group, Inc. (The) | | | CNB Florida Bancshares, Inc. | | | | 1/20/2004 | | | 810.3 | | | 154.8 | | | 19.1 | | | 9.5 | | | 272.6 | | | 303.6 | | | 24.0 | | | 25.8 | |
| FSB Bancshares, Inc. | | | American City Bancorp, Inc. | | | | 3/8/2004 | | | 125.8 | | | 21.3 | | | 16.9 | | | NA | | | 249.2 | | | 249.2 | | | 30.1 | | | NA | |
| South Financial Group, Inc. (The) | | | Florida Banks, Inc. | | | | 3/17/2004 | | | 943.8 | | | 168.0 | | | 17.8 | | | 26.5 | | | 311.7 | | | 311.7 | | | 36.7 | | | 36.7 | |
| Alabama National BanCorporation | | | Coquina Bank | | | | 3/30/2004 | | | 98.4 | | | 29.7 | | | 30.2 | | | NA | | | 277.4 | | | 277.4 | | | 23.2 | | | NA | |
| First National Bankshares of Florida, Inc. | | | First Bradenton Bank | | | | 6/30/2004 | | | 54.1 | | | 8.3 | | | 15.4 | | | NA | | | 171.2 | | | 171.2 | | | 30.8 | | | NA | |
| Popular, Inc. | | | Kislak Financial Corporation | | | | 8/17/2004 | | | 876.0 | | | 158.0 | | | 18.0 | | | NA | | | 240.2 | | | 240.2 | | | 22.5 | | | NA | |
| United Community Banks, Inc. | | | Liberty National Bancshares, Inc. | | | | 8/24/2004 | | | 179.1 | | | 36.7 | | | 20.5 | | | NA | | | 299.9 | | | 299.9 | | | 21.6 | | | NA | |
| Wilson Bank Holding Company | | | Community Bank of Smith County | | | | 9/13/2004 | | | 76.1 | | | 5.9 | | | 7.8 | | | NA | | | 198.8 | | | 198.8 | | | 18.5 | | | NA | |
| First Bank Corp | | | Bor Bancshares, Incorporated | | | | 9/16/2004 | | | 119.1 | | | 26.6 | | | 22.3 | | | NA | | | 312.7 | | | 312.7 | | | 16.9 | | | NA | |
| Fidelity Bankshares, Inc. | | | First Community Bancorp, Inc. | | | | 9/21/2004 | | | 150.9 | | | 26.6 | | | 17.6 | | | NA | | | 250.0 | | | 250.0 | | | 20.0 | | | NA | |
| Colonial BancGroup, Inc. | | | Union Bank of Florida | | | | 9/27/2004 | | | 1,052.5 | | | 233.0 | | | 22.1 | | | NA | | | 307.0 | | | 307.0 | | | 26.8 | | | NA | |
| First Citizens Bancorporation, Inc. | | | People's Community Capital Corporation | | | | 10/18/2004 | | | 121.5 | | | 39.9 | | | 32.9 | | | 33.3 | | | 278.0 | | | 278.0 | | | 29.1 | | | 29.7 | |
| South Financial Group, Inc. (The) | | | Pointe Financial Corporation | | | | 10/27/2004 | | | 374.3 | | | 103.7 | | | 27.7 | | | NA | | | 291.1 | | | 316.5 | | | 33.3 | | | 37.7 | |
| Liberty Bancshares, Inc. | | | TrustBanc Financial Group, Inc. | | | | 12/3/2004 | | | 113.2 | | | 28.0 | | | 24.7 | | | NA | | | 263.2 | | | 263.3 | | | 26.9 | | | NA | |
| Colonial BancGroup, Inc. | | | FFLC Bancorp, Inc. | | | | 1/14/2005 | | | 1,065.3 | | | 225.0 | | | 21.1 | | | 15.9 | | | 259.9 | | | 259.9 | | | 22.2 | | | 22.2 | |
| Capital City Bank Group, Inc. | | | First Alachua Banking Corporation | | | | 2/3/2005 | | | 229.2 | | | 58.2 | | | 25.4 | | | NA | | | 235.8 | | | 247.1 | | | 23.7 | | | NA | |
| First National Security Company | | | First Community Banking Corporation | | | | 3/1/2005 | | | 375.8 | | | 89.7 | | | 23.9 | | | NA | | | 200.0 | | | 202.1 | | | 19.7 | | | NA | |
| First Citizens Bancorporation, Inc. | | | Summit Financial Corporation | | | | 3/7/2005 | | | 320.9 | | | 110.0 | | | 34.3 | | | (5.6 | ) | | 266.7 | | | 268.0 | | | 24.4 | | | 24.7 | |
| First Security Group, Inc. | | | Jackson Bank & Trust | | | | 5/12/2005 | | | 167.9 | | | 33.1 | | | 19.7 | | | NA | | | 185.6 | | | 185.6 | | | 19.2 | | | NA | |
| FLAG Financial Corporation | | | First Capital Bancorp, Inc. | | | | 5/26/2005 | | | 675.0 | | | 135.2 | | | 20.0 | | | 40.1 | | | 221.6 | | | 255.7 | | | 32.8 | | | 32.8 | |
| Union Bankshares, Inc. | | | First Paris Holding Company | | | | 6/28/2005 | | | 102.5 | | | 15.8 | | | 15.4 | | | NA | | | 182.0 | | | 185.6 | | | 18.5 | | | NA | |
| Capital Bank Corporation | | | 1st State Bancorp, Inc. | | | | 6/29/2005 | | | 372.8 | | | 114.6 | | | 30.7 | | | 6.6 | | | 166.7 | | | 166.7 | | | 30.2 | | | 31.2 | |
| BancorpSouth, Inc. | | | American State Bank Corporation | | | | 8/10/2005 | | | 341.8 | | | 50.0 | | | 14.6 | | | NA | | | 232.7 | | | 232.7 | | | 25.1 | | | NA | |
| Security Bank Corporation | | | Rivoli Bancorp, Inc. | | | | 9/9/2005 | | | 210.9 | | | 38.6 | | | 18.3 | | | NA | | | 302.2 | | | 302.2 | | | 25.8 | | | 26.0 | |
| |
| |
| Maximum | | | | | | | | | | 1,065.3 | | | 233.0 | | | 34.3 | | | 40.1 | | | 312.7 | | | 316.5 | | | 36.7 | | | 37.7 | |
| Minimum | | | | | | | | | | 54.1 | | | 5.9 | | | 7.8 | | | (5.6 | ) | | 166.7 | | | 166.7 | | | 16.9 | | | 22.2 | |
| | | | | | | | | | |
| Average | | | | | | | | | | 373.2 | | | 79.6 | | | 21.5 | | | 18.0 | | | 249.0 | | | 253.5 | | | 25.1 | | | 29.6 | |
| | | | | | | | | | |
| Median | | | | | | | | | | 220.1 | | | 45.0 | | | 20.3 | | | 15.9 | | | 254.9 | | | 257.8 | | | 24.2 | | | 29.7 | |
| |
| |
| Deal Price: $54.52 | | |
| | | | | | | | | | |
| BB&T Corporation | | | First Citizens Bancorp | | | | | | | 686.0 | | | 142.6 | | | 20.8 | | | NA | | | 331.2 | | | 335.2 | | | 15.5 | | | 15.2 | |
| | | | | | | | | | |
| |
| Over/(Under) Average Comparables | | | | | | | | | | | | | | | | (.7 | ) | | NA | | | 82.2 | | | 81.7 | | | (9.6 | ) | | (14.5 | ) |
*Source for Acquisition Comparables: SNL Financial
Acquisition Comparables*
Comparable Acquisitions Announced since January 1, 2004
with Seller Assets between $250 Million and $1 Billion
| | | | | | | | | | Deal Pr/ | Deal Pr/ |
|---|
| | | Date | Seller | | Deal Value/ | Deal Pr/ | Deal | Deal Pr/ | LTM | LTM Core |
|---|
| Buyer | Seller | Announced | Total Assets | Deal Value | Assets | Stock Pr | Pr/Bk | Tg Bk | EPS | EPS |
|---|
| | | | ($M) | ($M) | (%) | (%) | (%) | (%) | (x) | (x) |
|---|
| | | | | | | | | | | |
|---|
| South Financial Group, Inc. (The) | | | CNB Florida Bancshares, Inc. | | | | 1/20/2004 | | | 810.3 | | | 154.8 | | | 19.1 | | | 9.5 | | | 272.6 | | | 303.6 | | | 24.0 | | | 25.8 | |
| Sun Bancorp, Inc. | | | Community Bancorp of New Jersey | | | | 2/16/2004 | | | 427.8 | | | 83.2 | | | 19.4 | | | 9.3 | | | 316.2 | | | 316.2 | | | 33.4 | | | 37.3 | |
| Provident Bancorp, Inc. | | | Warwick Community Bancorp, Inc. | | | | 3/15/2004 | | | 760.0 | | | 154.3 | | | 20.3 | | | (4.2 | ) | | 198.4 | | | 206.1 | | | 22.7 | | | 23.7 | |
| F.N.B. Corporation | | | Slippery Rock Financial Corporation | | | | 5/5/2004 | | | 335.0 | | | 77.9 | | | 23.3 | | | 49.5 | | | 242.3 | | | 250.4 | | | 30.7 | | | 32.9 | |
| Fulton Financial Corporation | | | First Washington FinancialCorp | | | | 6/14/2004 | | | 482.6 | | | 127.2 | | | 26.4 | | | 39.2 | | | 318.2 | | | 318.2 | | | 25.5 | | | 27.0 | |
| KeyCorp | | | EverTrust Financial Group, Inc. | | | | 6/24/2004 | | | 770.1 | | | 195.0 | | | 25.3 | | | 26.7 | | | 194.7 | | | 194.7 | | | 27.0 | | | 27.8 | |
| Brookline Bancorp, Inc. | | | Mystic Financial, Inc. | | | | 7/7/2004 | | | 441.2 | | | 65.6 | | | 14.9 | | | 20.0 | | | 216.9 | | | 216.9 | | | 32.3 | | | 36.8 | |
| Park National Corporation | | | First Federal Bancorp, Inc. | | | | 8/2/2004 | | | 258.2 | | | 45.9 | | | 17.8 | | | 56.4 | | | 194.9 | | | 194.9 | | | 24.5 | | | 24.5 | |
| WesBanco, Inc. | | | Winton Financial Corporation | | | | 8/25/2004 | | | 553.7 | | | 103.2 | | | 18.6 | | | 35.6 | | | 209.3 | | | 209.5 | | | 21.3 | | | 22.7 | |
| Placer Sierra Bancshares | | | First Financial Bancorp | | | | 9/7/2004 | | | 324.1 | | | 50.2 | | | 15.5 | | | 30.3 | | | 220.3 | | | 221.1 | | | 28.2 | | | 27.0 | |
| South Financial Group, Inc. (The) | | | Pointe Financial Corporation | | | | 10/27/2004 | | | 374.3 | | | 103.7 | | | 27.7 | | | NA | | | 291.1 | | | 316.5 | | | 33.3 | | | 37.7 | |
| Berkshire Hills Bancorp Inc. | | | Woronoco Bancorp, Inc. | | | | 12/16/2004 | | | 898.5 | | | 147.2 | | | 16.4 | | | (1.6 | ) | | 167.8 | | | 174.8 | | | 23.1 | | | 23.1 | |
| Sky Financial Group, Inc. | | | Belmont Bancorp. | | | | 12/21/2004 | | | 296.7 | | | 68.9 | | | 23.2 | | | 13.6 | | | 215.3 | | | 215.3 | | | 26.7 | | | 27.9 | |
| Fulton Financial Corporation | | | SVB Financial Services, Inc. | | | | 1/11/2005 | | | 474.9 | | | 89.6 | | | 18.9 | | | (3.5 | ) | | 302.3 | | | 302.3 | | | 25.9 | | | 27.6 | |
| Willow Grove Bancorp, Inc. | | | Chester Valley Bancorp Inc. | | | | 1/20/2005 | | | 644.7 | | | 151.9 | | | 23.6 | | | 28.1 | | | 265.2 | | | 274.3 | | | 23.4 | | | 26.3 | |
| Pacific Capital Bancorp | | | First Bancshares, Inc. | | | | 2/28/2005 | | | 279.7 | | | 60.8 | | | 21.7 | | | 50.5 | | | 297.6 | | | 297.6 | | | 24.1 | | | 25.1 | |
| First Citizens Bancorporation, Inc. | | | Summit Financial Corporation | | | | 3/7/2005 | | | 320.9 | | | 110.0 | | | 34.3 | | | (5.6 | ) | | 266.7 | | | 268.0 | | | 24.4 | | | 24.7 | |
| FLAG Financial Corporation | | | First Capital Bancorp, Inc. | | | | 5/26/2005 | | | 675.0 | | | 135.2 | | | 20.0 | | | 40.1 | | | 221.6 | | | 255.7 | | | 32.8 | | | 32.8 | |
| NBT Bancorp Inc. | | | CNB Bancorp, Inc. | | | | 6/13/2005 | | | 419.4 | | | 87.6 | | | 20.9 | | | 44.1 | | | 213.0 | | | 258.2 | | | 19.6 | | | 20.3 | |
| New York Community Bancorp, Inc. | | | Long Island Financial Corp. | | | | 8/1/2005 | | | 539.7 | | | 69.8 | | | 12.9 | | | 25.2 | | | 230.4 | | | 230.4 | | | 19.5 | | | 19.5 | |
| Bay View Capital Corporation | | | Great Lakes Bancorp, Inc. | | | | 10/26/2005 | | | 745.0 | | | 67.7 | | | 9.1 | | | NA | | | 172.5 | | | 172.5 | | | 21.1 | | | 26.4 | |
| Alabama National BanCorporation | | | Florida Choice Bankshares Inc. | | | | 10/27/2005 | | | 293.9 | | | 108.9 | | | 37.1 | | | NA | | | 259.6 | | | 259.6 | | | 28.6 | | | 28.6 | |
| F.N.B. Corporation | | | Legacy Bank | | | | 12/21/2005 | | | 382.1 | | | 73.0 | | | 19.1 | | | 38.2 | | | 171.7 | | | 212.5 | | | 32.3 | | | 32.3 | |
| | | | | | | | | | | | | | | | | | | | | | | | | | | | | | | | | |
| | | | | | | | | | | | | | | | | | | | | | | | | | | | | | | | | |
| Maximum | | | | | | | | | | 898.5 | | | 195.0 | | | 37.1 | | | 56.4 | | | 318.2 | | | 318.2 | | | 33.4 | | | 37.7 | |
| Minimum | | | | | | | | | | 258.2 | | | 45.9 | | | 9.1 | | | (5.6 | ) | | 167.8 | | | 172.5 | | | 19.5 | | | 19.5 | |
| | | | | | | | | | |
| Average | | | | | | | | | | 500.3 | | | 101.4 | | | 21.1 | | | 25.1 | | | 237.3 | | | 246.5 | | | 26.3 | | | 27.7 | |
| | | | | | | | | | |
| Median | | | | | | | | | | 441.2 | | | 89.6 | | | 20.0 | | | 25.2 | | | 221.6 | | | 250.4 | | | 25.5 | | | 27.0 | |
| | | | | | | | | | | | | | | | | | | | | | | | | | | | | | | | | |
| | | | | | | | | | | | | | | | | | | | | | | | | | | | | | | | | |
| Deal Price: $54.52 | | | | | | | | | | | | | | | | | | | | | | | | | | | | | | | | |
| | | | | | | | | | |
| BB&T Corporation | | | First Citizens Bancorp | | | | | | | 686.0 | | | 142.6 | | | 20.8 | | | NA | | | 331.2 | | | 335.2 | | | 15.5 | | | 15.2 | |
| | | | | | | | | | |
| | | | | | | | | | | | | | | | | | | | | | | | | | | | | | | | | |
| Over/(Under) Average Comparables | | | | | | | | | | | | | | | | (0.3 | ) | | NA | | | 93.9 | | | 88.8 | | | (10.8 | ) | | (12.6 | ) |
| | | | | | | | | | | | | | | | | | | | | | | | | | | | | | | | | |
*Source for Acquisition Comparables: SNL Financial
Financial Data
Financial Summary
| BB&T | FCB* |
|---|
| For The Quarter Ended: | 9/30/05 | 9/30/05 |
|---|
| ROA | | 1.64 | % | 1.41 | % |
| Cash Basis ROA | | 1.81 | | 1.41 | |
| ROE | | 15.65 | | 19.66 | |
| Cash Basis ROE | | 28.56 | | 19.66 | |
| Net Interest Margin (FTE) | | 3.88 | | 4.97 | |
| Cash Basis Efficiency Ratio | | 49.66 | | 49.53 | |
| Net Charge-Offs | | 0.30 | | 0.06 | |
| Reserve/NPLs | | 353.87 | | 183.00 | |
| NPAs/Assets | | 0.28 | | 0.82 | |
*First Citizens is an S-Corp. Net income has been adjusted to reflect taxation as a C-Corp.
Capital Strength
| BB&T | FCB |
|---|
| 9/30/05 | 9/30/05 |
|---|
| | | | | | |
| Equity/assets | | 10.5 | % | 8.2 | % |
| | | | | | |
| Leverage capital ratio | | 7.3 | % | 8.5 | % |
| | | | | | |
| Total risk-based capital | | 14.9 | % | 12.7 | % |
Rationale for Acquisition
| · | | BB&T has announced a strategy to pursue in-market (Carolinas/Virginia/West Virginia/ DC/Maryland/Tennessee/Kentucky/Florida/Georgia) acquisitions of high quality banks and thrifts in the $500 million to $15 billion range. The acquisition of First Citizens is consistent with this strategy. |
| · | | This merger accelerates BB&T’s long term earnings growth rates by expanding BB&T’s Tennessee market; provides contiguous expansion from our current Knoxville-based markets toward Chattanooga and our Northeast Georgia franchise. |
| · | | An acquisition of First Citizens provides BB&T with the following: |
| — | Senior management team with significant local banking expertise. |
| — | The opportunity to sell BB&T’s broad array of banking and insurance products to First Citizens’ client base. |
| · | | Improves efficiency — 35% cost savings fully realized in the first 12 months of operations following conversion; anticipate consolidation of up to 11 of their 19 locations with existing BB&T locations. |
| · | | This merger increases BB&T’s market share rank in Tennessee from 9th to 7th and from 5th to 4th in Eastern Tennessee. |
| · | | In the Cleveland, TN MSA, BB&T will become #1 in market share, rising from 8th position. |
| · | | This acquisition is consistent with past acquisitions which we have successfully executed, i.e., it fits our model. |
Efficiency Improvement
Targeted Annual Cost Savings
$6.6 million or approximately
35% of First Citizens' expense base*
*BB&T anticipates consolidation of up to 11 of First Citizens’ 19 locations with existing BB&T branches.
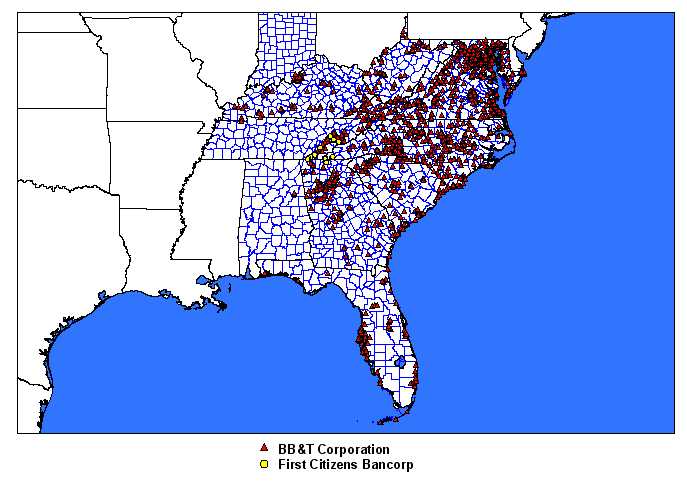
Branch Locations
2005 Economic Vitality Map

Market Characteristics

| · | | Transportation infrastructure makes Tennessee attractive to commercial manufacturers — four major interstates intersect in Eastern Tennessee |
| · | | According to the Small Business Survival Index (SBSI), Tennessee is the fifteenth best state in the nation in overall public policy that promotes low taxes, limited government, restrained regulation, and protection of property rights |
| · | | East Tennessee is home to a variety of divisions of Fortune 500 companies including ALCOA, Maytag, Rubbermaid, and Coca-Cola |
Market Characteristics
| · | | Chattanooga was ranked as one of the top 50 cities for business by Expansion Management magazine |
| · | | Cleveland/Bradley County has over 145 manufacturers as well as major employers in healthcare, financial services, retail, and education |
| · | | Based on a recent 10-year growth report, Bradley County shows allocation of $64 million of investment in twelve new manufacturing plants |
| · | | Expansion Management magazine named Knoxville as the 14th best city for business to relocate or expand into in the U.S. |
BB&T Investment Criteria
| · | | Cash Basis EPS (accretive by year 2) |
| · | | GAAP EPS (accretive by year 3) |
| · | | Internal rate of return (15% or better) |
| · | | Cash Basis ROE (accretive by year 3) |
| · | | Cash Basis ROA (accretive by year 3) |
| · | | Tangible book value per share (accretive by year 5) |
| · | | Must not cause combined leverage capital ratio to go below 7% |
| · | | Must create accelerated dividend growth potential by year 5 for current BB&T shareholders |
| | Criteria are listed in order of importance. There are sometimes trade-offs among criteria. BB&T is primarily concerned with cash basis measures for each of the criterion above. |
Assumptions
| · | | Closing Stock Price as of January 11, 2006: BB&T - $41.94 |
| · | | Current Market Price: First Citizens — N/A (privately held) |
| · | | BB&T Base Model: The projected 2006 financial statement is based on the First Call EPS estimate of $3.30 and subsequent years are based on 10% income statement and balance sheet growth. |
| · | | First Citizens Base Forecast: The 2005 net income estimate is based on pre-tax income of $14.9 million. The 2006 projection reflects approximately 10% growth. |
| · | | Cost Savings: 35% annual cost savings of First Citizens’ estimated noninterest expense base are used in the valuation to be fully realized in the first 12 months following conversion. |
| · | | Growth Rates: All of First Citizens’ balance sheet and income statement items, except for noninterest income, are grown at 10%. Noninterest income was grown in order to achieve a core fee income ratio of 35% in year 7, and grown at 10% thereafter. |
| · | | Margin: After the impact of divestiture, First Citizens’ margin is projected to be 4.38% in all model years. |
| · | | Divestiture: Based on HHI analysis, a divestiture of approximately $32.7 million is required in the Blue Ridge Area, GA-TN Federal Banking Market. |
| · | | One-time charges: One-time after-tax merger-related charges of $11.1 million, net of estimated premium of $1.3 million from divested deposits. |
Results of the Transaction Assuming
Shareholders Elect 100% Stock
Earnings Per Share Impact
| | | Accretion | | Accretion |
|---|
| | | (Dilution) | Pro Forma | (Dilution) |
|---|
| | Pro Forma | Pro Forma | Cash Basis | Pro Forma |
|---|
| Year | EPS | Shares | EPS | Shares |
|---|
| | | | | | | | | |
| 2006* | | $ | 3.30 | | | $(0.00) | | | $3.44 | | ($ | 0.00 | ) |
| | 2007 | | | 3.63 | | | 0.00 | | | 3.78 | | | 0.00 | |
| | 2008 | | | 3.99 | | | 0.00 | | | 4.14 | | | 0.00 | |
| | 2009 | | | 4.40 | | | 0.00 | | | 4.55 | | | 0.01 | |
| | 2010 | | | 4.84 | | | 0.01 | | | 4.99 | | | 0.01 | |
| | 2011 | | | 5.33 | | | 0.01 | | | 5.48 | | | 0.01 | |
| | 2012 | | | 5.86 | | | 0.02 | | | 6.01 | | | 0.02 | |
| | 2013 | | | 6.45 | | | 0.02 | | | 6.60 | | | 0.03 | |
| | 2014 | | | 7.10 | | | 0.03 | | | 7.25 | | | 0.03 | |
| | 2015 | | | 7.81 | | | 0.03 | | | 7.96 | | | 0.03 | |
| | 2016 | | | 8.59 | | | 0.03 | | | 8.74 | | | 0.03 | |
| |
| | Internal rate of return | | | | | | 20.92% | | | | | | | |
*2006 results are based on an assumed June 1, 2006 closing.
ROE Impact1
| | | | Pro Forma | |
|---|
| | Pro Forma | | Cash Basis | |
|---|
| Year | ROE (%) | Change | ROE (%) | Change |
|---|
| | | | | |
|---|
| | 2006 | | | 15.22 | | | (0.14 | ) | | 28.15 | | | (0.05 | ) |
| | 2007 | | | 15.84 | | | (0.08 | ) | | 26.57 | | | 0.06 | |
| | 2008 | | | 16.01 | | | (0.07 | ) | | 25.49 | | | 0.04 | |
| | 2009 | | | 16.15 | | | (0.06 | ) | | 24.52 | | | 0.04 | |
| | 2010 | | | 16.24 | | | (0.05 | ) | | 23.63 | | | 0.04 | |
| | 2011 | | | 16.29 | | | (0.03 | ) | | 22.80 | | | 0.04 | |
| | 2012 | | | 16.30 | | | (0.02 | ) | | 22.02 | | | 0.05 | |
| | 2013 | | | 16.28 | | | (0.01 | ) | | 21.32 | | | 0.05 | |
| | 2014 | | | 16.23 | | | (0.01 | ) | | 20.67 | | | 0.04 | |
| | 2015 | | | 16.16 | | | (0.01 | ) | | 20.07 | | | 0.03 | |
| | 2016 | | | 16.07 | | | (0.00 | ) | | 19.51 | | | 0.03 | |
| | 1 | The decrease in cash basis ROE results from the build up in equity relative to assets. If consistent with attaining and maintaining a leverage capital ratio of at least 7%, BB&T may choose to leverage the balance sheet further through future repurchases of BB&T’s common stock. |
ROA Impact
| | | | Pro Forma | |
|---|
| | Pro Forma | | Cash Basis | |
|---|
| Year | ROA (%) | Change | ROA (%) | Change |
|---|
| | | | | |
|---|
| | 2006 | | | 1.61 | | | (0.01 | ) | | 1.76 | | | (0.01 | ) |
| | 2007 | | | 1.64 | | | (0.00 | ) | | 1.78 | | | 0.00 | |
| | 2008 | | | 1.64 | | | (0.00 | ) | | 1.77 | | | 0.00 | |
| | 2009 | | | 1.65 | | | (0.00 | ) | | 1.76 | | | 0.00 | |
| | 2010 | | | 1.66 | | | 0.00 | | | 1.76 | | | 0.00 | |
| | 2011 | | | 1.66 | | | 0.00 | | | 1.76 | | | 0.00 | |
| | 2012 | | | 1.67 | | | 0.00 | | | 1.75 | | | 0.00 | |
| | 2013 | | | 1.67 | | | 0.00 | | | 1.75 | | | 0.01 | |
| | 2014 | | | 1.68 | | | 0.00 | | | 1.75 | | | 0.01 | |
| | 2015 | | | 1.68 | | | 0.00 | | | 1.74 | | | 0.01 | |
| | 2016 | | | 1.68 | | | 0.00 | | | 1.74 | | | 0.01 | |
Book Value/Capital Impact
| Pro Forma | Pro Forma | |
|---|
| Stated Book Value Per Share | Tangible Book Value Per Share | Pro Forma* |
|---|
| | Accretion | | Accretion | Leverage |
|---|
| Year | Stated | (Dilution) | Tangible | (Dilution) | Ratio |
|---|
| | 2006 | | $ | 22.19 | | $ | 0.12 | | $ | 13.41 | | $ | (0.02 | ) | | 7.23 | % |
| | 2007 | | | 24.12 | | | 0.12 | | | 15.34 | | | (0.02 | ) | | 7.31 | |
| | 2008 | | | 26.27 | | | 0.12 | | | 17.50 | | | (0.01 | ) | | 7.30 | |
| | 2009 | | | 28.71 | | | 0.13 | | | 19.95 | | | (0.00 | ) | | 7.54 | |
| | 2010 | | | 31.46 | | | 0.13 | | | 22.69 | | | 0.01 | | | 7.78 | |
| | 2011 | | | 34.58 | | | 0.14 | | | 25.82 | | | 0.02 | | | 8.03 | |
| | 2012 | | | 38.08 | | | 0.16 | | | 29.32 | | | 0.04 | | | 8.28 | |
| | 2013 | | | 41.99 | | | 0.17 | | | 33.23 | | | 0.06 | | | 8.52 | |
| | 2014 | | | 46.37 | | | 0.19 | | | 37.61 | | | 0.08 | | | 8.75 | |
| | 2015 | | | 51.26 | | | 0.22 | | | 42.51 | | | 0.10 | | | 8.98 | |
| | 2016 | | | 56.73 | | | 0.24 | | | 47.98 | | | 0.12 | | | 9.20 | |
| * | | BB&T’s goal is to manage its leverage ratio between 7% and 8%. BB&T may choose to maintain its target leverage ratio through future repurchases of BB&T’s common stock. |
Summary
| · | | The acquisition of First Citizens Bancorp is a strong strategic fit: |
| - | | It helps accomplish our goal of expanding our presence in Tennessee |
| - | | This merger increases BB&T’s market share rank in Tennessee from 9th to 7th and from 5th to 4th in Eastern Tennessee |
| - | | In the Cleveland, TN MSA, BB&T will become #1 in market share, rising from 8th position |
| - | | It fits culturally and geographically |
| - | | This is the type of merger we have consistently, successfully executed |
| · | | Overall Investment Criteria are met: |
| - | | Cash EPS is accretive in 2007 |
| - | | GAAP EPS is accretive in 2007 |
| - | | Cash Basis ROE is accretive in 2007 |
| - | | Cash Basis ROA is accretive in 2007 |
| - | | Tangible book value is accretive in 2010 |
| - | | Combined leverage ratio remains above 7% |
Appendix
| · | | Historical financial data |
| · | | Where to go for additional information about BB&T, First Citizens Bancorp, and the merger |
First Citizens Bancorp
Financial Summary
| | | | | | | | Nine months | Nine months | 9/30/05 |
|---|
| | | | | | | | ended | ended | vs. |
|---|
| | | % | | % | | % | September 30, | September 30, | 9/30/04 |
|---|
| | 2002 | Change | 2003 | Change | 2004 | Change | 2004 | 2005 | % Change |
|---|
| | | | | | | | | | | | | | | | | | |
| | | | | | | | | | | | | | | | | | |
| Earnings Summary(In thousands) | | | | | | | | | |
|---|
| | | | | | | | | | |
|---|
| Interest Income (FTE) | | | | | | | | | |
|---|
| Interest on loans & leases | | | $ | 24,707 | | | -8.5 | % | $ | 25,755 | | | 4.2 | % | $ | 29,598 | | | 14.9 | % | $ | 21,249 | | $ | 27,356 | | | 28.7 | % |
| Interest & dividends on securities | | | | 6,217 | | | 1.1 | % | | 4,293 | | | -31.0 | % | | 3,449 | | | -19.7 | % | | 2,560 | | | 2,717 | | | 6.1 | % |
| Interest on temporary investments | | | | 52 | | | -90.2 | % | | 110 | | | 112.2 | % | | 31 | | | -71.4 | % | | 15 | | | 247 | | | 1581.5 | % |
| | | | | | | | | | | | | | | | | | |
| Total interest income (FTE) | | | | 30,977 | | | -8.1 | % | | 30,158 | | | -2.6 | % | | 33,079 | | | 9.7 | % | | 23,824 | | | 30,319 | | | 27.3 | % |
| | | | | | | | | | | | | | | | | | |
| | | | | | | | | | | | | | | | | | | | | | | | | | | | | | |
| Interest Expense | | | | | | | | | | | | | | | | | | | | | | | | | | | | | |
| Interest expense on deposit accounts | | | | 8,074 | | | -41.6 | % | | 7,029 | | | -12.9 | % | | 6,257 | | | -11.0 | % | | 4,603 | | | 7,423 | | | 61.3 | % |
| Interest on short-term borrowings | | | | 1,509 | | | 123.2 | % | | 805 | | | -46.7 | % | | 750 | | | -6.8 | % | | 418 | | | 817 | | | 95.5 | % |
| Interest on long-term debt | | | | 151 | | | -85.5 | % | | 134 | | | -11.2 | % | | 443 | | | 230.4 | % | | 316 | | | 587 | | | 85.5 | % |
| | | | | | | | | | | | | | | | | | |
| Total interest expense | | | | 9,733 | | | -37.4 | % | | 7,968 | | | -18.1 | % | | 7,450 | | | -6.5 | % | | 5,337 | | | 8,826 | | | 65.4 | % |
| | | | | | | | | | | | | | | | | | |
| | | | | | | | | | | | | | | | | | | | | | | | | | | | | | |
| Net interest income (FTE) | | | | 21,243 | | | 17.0 | % | | 22,190 | | | 4.5 | % | | 25,629 | | | 15.5 | % | | 18,487 | | | 21,493 | | | 16.3 | % |
| Less taxable equivalency adjustment | | | | — | | | N/A | | | — | | | N/A | | | — | | | N/A | | | — | | | — | | | N/A | |
| | | | | | | | | | | | | | | | | | |
| Net interest income | | | | 21,243 | | | 17.0 | % | | 22,190 | | | 4.5 | % | | 25,629 | | | 15.5 | % | | 18,487 | | | 21,493 | | | 16.3 | % |
| Provision for loan losses | | | | 2,048 | | | 47.1 | % | | 1,525 | | | -25.5 | % | | 1,360 | | | -10.8 | % | | 1,125 | | | 455 | | | -59.6 | % |
| | | | | | | | | | | | | | | | | | |
| Net interest income after provision | | | | 19,196 | | | 14.5 | % | | 20,665 | | | 7.7 | % | | 24,269 | | | 17.4 | % | | 17,362 | | | 21,038 | | | 21.2 | % |
| | | | | | | | | | | | | | | | | | |
| | | | | | | | | | | | | | | | | | | | | | | | | | | | | | |
| Noninterest Income | | | | | | | | | | | | | | | | | | | | | | | | | | | | | |
| Service charges on deposit accounts | | | | 2,721 | | | 28.4 | % | | 3,678 | | | 35.2 | % | | 3,610 | | | -1.8 | % | | 2,896 | | | 2,988 | | | 3.2 | % |
| Non-deposit fees and commissions | | | | 374 | | | 130.9 | % | | 456 | | | 21.9 | % | | 394 | | | -13.6 | % | | 248 | | | 269 | | | 8.3 | % |
| G / (L) on sale of real estate & securities | | | | — | | | N/A | | | — | | | N/A | | | — | | | N/A | | | — | | | — | | | N/A | |
| G / (L) on sale of loans and leases | | | | 1,296 | | | 17.0 | % | | 2,086 | | | 61.0 | % | | 1,078 | | | -48.3 | % | | 824 | | | 835 | | | 1.2 | % |
| Other operating income | | | | 723 | | | -40.9 | % | | 697 | | | -3.5 | % | | 606 | | | -13.0 | % | | 405 | | | 695 | | | 71.7 | % |
| | | | | | | | | | | | | | | | | | |
| Total noninterest income | | | | 5,113 | | | 9.8 | % | | 6,917 | | | 35.3 | % | | 5,689 | | | -17.7 | % | | 4,374 | | | 4,786 | | | 9.4 | % |
| | | | | | | | | | | | | | | | | | |
| | | | | | | | | | | | | | | | | | | | | | | | | | | | | | |
| Noninterest Expense | | | | | | | | | | | | | | | | | | | | | | | | | | | | | |
| Personnel | | | | 8,263 | | | 19.0 | % | | 9,247 | | | 11.9 | % | | 9,735 | | | 5.3 | % | | 7,460 | | | 8,100 | | | 8.6 | % |
| Occupancy & equipment | | | | 2,387 | | | 2.9 | % | | 2,676 | | | 12.1 | % | | 2,928 | | | 9.4 | % | | 2,192 | | | 2,302 | | | 5.0 | % |
| Intangible amortization | | | | 31 | | | -46.1 | % | | 6 | | | -80.0 | % | | — | | | -100.0 | % | | — | | | — | | | N/A | |
| Other operating expenses | | | | 4,327 | | | 10.7 | % | | 4,576 | | | 5.7 | % | | 5,414 | | | 18.3 | % | | 4,044 | | | 4,039 | | | -0.1 | % |
| | | | | | | | | | | | | | | | | | |
| Total noninterest expense | | | | 15,008 | | | 13.4 | % | | 16,505 | | | 10.0 | % | | 18,078 | | | 9.5 | % | | 13,697 | | | 14,441 | | | 5.4 | % |
| | | | | | | | | | | | | | | | | | |
| | | | | | | | | | | | | | | | | | | | | | | | | | | | | | |
| Net income before taxes | | | | 9,301 | | | 13.6 | % | | 11,077 | | | 19.1 | % | | 11,880 | | | 7.2 | % | | 8,039 | | | 11,384 | | | 41.6 | % |
| Income taxes (1) | | | | 3,376 | | | 13.6 | % | | 4,124 | | | 22.2 | % | | 4,311 | | | 4.5 | % | | 2,859 | | | 5,106 | | | 78.6 | % |
| | | | | | | | | | | | | | | | | | |
| Net income before nonrecurring items | | | | 5,925 | | | 13.6 | % | | 6,953 | | | 17.4 | % | | 7,569 | | | 8.9 | % | | 5,181 | | | 6,278 | | | 21.2 | % |
| | | | | | | | | | | | | | | | | | |
| Nonrecurring income / (charges) | | | | — | | | N/A | | | — | | | N/A | | | — | | | N/A | | | — | | | — | | | N/A | |
| | | | | | | | | | | | | | | | | | |
| Net income | | | $ | 5,925 | | | 13.6 | % | $ | 6,953 | | | 17.4 | % | $ | 7,569 | | | 8.9 | % | $ | 5,181 | | $ | 6,278 | | | 21.2 | % |
| | | | | | | | | | | | | | | | | | |
| | | | | | | | | | | | | | | | | | |
| | | | | | | | | | | | | | | | | | |
| | | | | | | | | | | | | | | | | | | | | | | | | | | | | | |
(1) First Citizens is an S-Corp. Net Income has been adjusted to reflect estimated taxation as a C-Corp.
First Citizens Bancorp
Financial Summary
| | | | | | | | Nine months | Nine months | 9/30/05 |
|---|
| | | | | | | | ended | ended | vs. |
|---|
| | | % | | % | | % | September 30, | September 30, | 9/30/04 |
|---|
| | 2002 | Change | 2003 | Change | 2004 | Change | 2004 | 2005 | % Change |
|---|
| | | | | | | | | | | | | | | | | | |
| | | | | | | | | | | | | | | | | | |
| Average Balance Sheet | | | | | | | | | |
|---|
| (In thousands) | | | | | | | | | |
|---|
| Assets | | | | | | | | | |
|---|
| Loans | | | $ | 324,653 | | | 4.5 | % | $ | 371,232 | | | 14.3 | % | $ | 444,457 | | | 19.7 | % | $ | 436,604 | | $ | 493,047 | | | 12.9 | % |
| Loans held for sale | | | | 8,734 | | | 120.3 | % | | 7,677 | | | -12.1 | % | | 1,906 | | | -75.2 | % | | — | | | — | | | N/A | |
| Securities | | | | 130,165 | | | 7.8 | % | | 119,250 | | | -8.4 | % | | 107,301 | | | -10.0 | % | | 106,304 | | | 110,012 | | | 3.5 | % |
| Other earning assets | | | | 3,739 | | | -2.4 | % | | 11,085 | | | 196.5 | % | | 1,841 | | | -83.4 | % | | 1,298 | | | 10,874 | | | N/A | |
| | | | | | | | | | | | | | | | | | |
| Total interest-earning assets | | | | 467,291 | | | 6.4 | % | | 509,243 | | | 9.0 | % | | 555,505 | | | 9.1 | % | | 544,206 | | | 613,933 | | | 12.8 | % |
| | | | | | | | | | | | | | | | | | |
| | | | | | | | | | | | | | | | | | | | | | | | | | | | | | |
| Goodwill & other intangibles | | | | 528 | | | -2.9 | % | | 509 | | | -3.5 | % | | 506 | | | -0.6 | % | | 506 | | | 506 | | | 0.0 | % |
| Other assets | | | | 28,393 | | | -7.7 | % | | 31,790 | | | 12.0 | % | | 34,032 | | | 7.1 | % | | 33,535 | | | 37,777 | | | 12.6 | % |
| | | | | | | | | | | | | | | | | | |
| Total assets | | | $ | 496,211 | | | 5.4 | % | $ | 541,542 | | | 9.1 | % | $ | 590,043 | | | 9.0 | % | $ | 578,247 | | $ | 652,216 | | | 12.8 | % |
| | | | | | | | | | | | | | | | | | |
| | | | | | | | | | | | | | | | | | |
| | | | | | | | | | | | | | | | | | |
| | | | | | | | | | | | | | | | | | | | | | | | | | | | | | |
| Net interest margin (FTE) | | | | 4.55 | % | | | | | 4.36 | % | | | | | 4.58 | % | | | | | 4.53 | % | | 4.67 | % | | | | | | | | | | | | |
| | | | | | | | | | | | | | | | | | | | | | | | | | | | | | |
| | | | | | | | | | | | | | | | | | | | | | | | | | | | | | |
| Liabilities & Shareholders' Equity | | | | | | | | | | | | | | | | | | | | | | | | | | | | | |
| Interest-bearing deposits: | | | | | | | | | | | | | | | | | | | | | | | | | | | | | |
| Money Market & NOW | | | $ | 133,928 | | | 4.1 | % | $ | 159,382 | | | 19.0 | % | $ | 180,690 | | | 13.4 | % | $ | 178,133 | | $ | 183,303 | | | 2.9 | % |
| Savings | | | | 26,626 | | | 4.1 | % | | 33,178 | | | 24.6 | % | | 39,039 | | | 17.7 | % | | 38,656 | | | 40,433 | | | 4.6 | % |
| CD's and other time | | | | 191,427 | | | 4.1 | % | | 193,548 | | | 1.1 | % | | 194,788 | | | 0.6 | % | | 192,459 | | | 246,415 | | | 28.0 | % |
| | | | | | | | | | | | | | | | | | |
| Total interest-bearing deposits | | | | 351,981 | | | 4.1 | % | | 386,108 | | | 9.7 | % | | 414,517 | | | 7.4 | % | | 409,248 | | | 470,151 | | | 14.9 | % |
| Short-term borrowed funds | | | | 29,744 | | | 0.1 | % | | 33,448 | | | 12.5 | % | | 35,859 | | | 7.2 | % | | 34,737 | | | 25,422 | | | -26.8 | % |
| Long-term debt | | | | 25,632 | | | 48.8 | % | | 20,304 | | | -20.8 | % | | 31,506 | | | 55.2 | % | | 28,614 | | | 37,445 | | | 30.9 | % |
| | | | | | | | | | | | | | | | | | |
| Total interest-bearing liabilities | | | | 407,357 | | | 5.8 | % | | 439,860 | | | 8.0 | % | | 481,882 | | | 9.6 | % | | 472,599 | | | 533,018 | | | 12.8 | % |
| | | | | | | | | | | | | | | | | | | | | | | | | | | | | | |
| Demand deposits | | | | 47,424 | | | 4.6 | % | | 56,385 | | | 18.9 | % | | 62,138 | | | 10.2 | % | | 60,154 | | | 72,421 | | | 20.4 | % |
| Other liabilities | | | | 2,814 | | | -10.2 | % | | 2,719 | | | -3.4 | % | | 2,758 | | | 1.4 | % | | 2,502 | | | 4,510 | | | 80.3 | % |
| | | | | | | | | | | | | | | | | | |
| Total liabilities | | | | 457,595 | | | 5.5 | % | | 498,964 | | | 9.0 | % | | 546,778 | | | 9.6 | % | | 535,255 | | | 609,949 | | | 14.0 | % |
| | | | | | | | | | | | | | | | | | |
| | | | | | | | | | | | | | | | | | | | | | | | | | | | | | |
| Common equity | | | | 38,616 | | | 4.3 | % | | 42,578 | | | 10.3 | % | | 43,265 | | | 1.6 | % | | 42,992 | | | 42,267 | | | -1.7 | % |
| | | | | | | | | | | | | | | | | | |
| Total equity | | | | 38,616 | | | 4.3 | % | | 42,578 | | | 10.3 | % | | 43,265 | | | 1.6 | % | | 42,992 | | | 42,267 | | | -1.7 | % |
| | | | | | | | | | | | | | | | | | |
| | | | | | | | | | | | | | | | | | | | | | | | | | | | | | |
| | | | | | | | | | | | | | | | | | |
| Total liabilities & shareholders' equity | | | $ | 496,211 | | | 5.4 | % | $ | 541,542 | | | 9.1 | % | $ | 590,043 | | | 9.0 | % | $ | 578,247 | | $ | 652,216 | | | 12.8 | % |
| | | | | | | | | | | | | | | | | | |
| | | | | | | | | | | | | | | | | | |
| | | | | | | | | | | | | | | | | | |
| | | | | | | | | | | | | | | | | | | | | | | | | | | | | | |
First Citizens Bancorp
Financial Summary
| | | | | Nine months | Nine months |
|---|
| | | | | ended | ended |
|---|
| | | | | September 30, | September 30, |
|---|
| | 2002 | 2003 | 2004 | 2004 | 2005 |
|---|
| | | | | | | | | | |
| Ratio Analysis | | | | | |
|---|
| | | | | | |
|---|
| ROA | | | | 1.19 | % | | 1.28 | % | | 1.28 | % | | 1.20 | % | | 1.29 | % |
| ROCE | | | | 15.34 | % | | 16.33 | % | | 17.50 | % | | 16.11 | % | | 19.86 | % |
| Efficiency ratio | | | | 56.9 | % | | 56.7 | % | | 57.7 | % | | 59.9 | % | | 55.0 | % |
| Adj. noninterest income / Adj. revenues | | | | 19.4 | % | | 23.8 | % | | 18.2 | % | | 19.1 | % | | 18.2 | % |
| Equity / Assets | | | | 7.7 | % | | 7.5 | % | | 7.3 | % | | 6.8 | % | | 6.2 | % |
| | | | | | | | | | | | | | | | | | |
| Credit Quality | | | | | | | | | | | | | | | | | |
| (In thousands) | | | | | | | | | | | | | | | | | |
| Beginning | | | $ | 4,624 | | $ | 5,514 | | $ | 6,186 | | $ | 6,186 | | $ | 7,257 | |
| | | | | | | | | | |
| Provision | | | | 2,048 | | | 1,525 | | | 1,360 | | | 1,125 | | | 455 | |
| Acquired allowance | | | | — | | | — | | | — | | | — | | | — | |
| Net charge-offs | | | | (1,157 | ) | | (861 | ) | | (289 | ) | | (359 | ) | | (200 | ) |
| | | | | | | | | | |
| Ending allowance | | | $ | 5,514 | | $ | 6,178 | | $ | 7,257 | | $ | 6,952 | | $ | 7,512 | |
| | | | | | | | | | |
| | | | | | | | | | | | | | | | | | |
| | | | | | | | | | | | | | | | | | |
| Allowance | | | | 1.64 | % | | 1.54 | % | | 1.52 | % | | 1.48 | % | | 1.50 | % |
| Charge-off rate | | | | 0.36 | % | | 0.23 | % | | 0.07 | % | | 0.11 | % | | 0.05 | % |
| | | | | | | | | | | | | | | | | | |
| Period end loans & leases | | | $ | 337,001 | | $ | 402,313 | | $ | 477,877 | | $ | 471,073 | | $ | 501,955 | |
| | | | | | | | | | | | | | | | | | |
| Period end common equity | | | $ | 40,783 | | $ | 43,560 | | $ | 46,282 | | $ | 43,079 | | $ | 42,524 | |
| | | | | | | | | | | | | | | | | | |
| Total assets | | | $ | 529,743 | | $ | 577,996 | | $ | 635,715 | | $ | 632,004 | | $ | 685,968 | |
| | | | | | | | | | | | | | | | | | |
| | | | | | | | | | | | | | | | | | |
| | | | | | | | | | | | | | | | | | |
Glossary
Return on Assets – Earnings (excluding merger-related and nonrecurring charges or credits) for the period as a percentage of average assets for the period.
Return on Equity – Earnings (excluding merger-related and nonrecurring charges or credits) for the period as a percentage of average common equity for the period.
Cash Basis Performance Results and Ratios – These calculations exclude the effect of intangible assets, amortization of intangibles, net amortization of purchase accounting mark-to-market adjustments, merger-related charges, and nonrecurring charges.
Efficiency Ratio – Noninterest expense as a percentage of the sum of net interest income on a fully taxable equivalent basis (“FTE”) and noninterest income (excludes securities gains/losses, foreclosed property expense, provisions for or recaptures of the impairment of mortgage servicing rights, gains or losses on mortgage servicing rights-related derivatives, merger-related charges or credits, and nonrecurring items).
Tier 1 Capital – Calculated as common shareholders’ equity excluding unrealized gains or losses on debt securities available for sale, unrealized gains on equity securities available for sale and unrealized gains or losses on cash flow hedges, net of deferred income taxes; plus certain mandatorily redeemable capital securities, less nonqualifying intangible assets net of applicable deferred income taxes, and certain nonfinancial equity investments.
Leverage Capital Ratio – Tier 1 capital as a percentage of average tangible assets.
Total Risk-Based Capital Ratio – The sum of Tier 1 capital, a qualifying portion of subordinated debt, and a qualifying portion of the allowance for loan and lease losses as a percentage of risk-weighted assets.
Net Charge-Off Ratio – Loan and lease losses net of recoveries as a percentage of average loans and leases.
Net Revenue – Net interest income FTE before the provision for loan losses plus noninterest income.
Internal Rate of Return – The interest rate that equates the present value of future returns to the investment outlay. An investment is considered acceptable if its IRR exceeds the required return. The investment is defined as the market value of the stock and/or other consideration to be received by the selling shareholders.
Certain of the ratios discussed above may be annualized if the applicable periods are less than a full year.
The foregoing may be deemed to be offering materials of BB&T Corporation (“BB&T”) in connection with BB&T’s proposed acquisition of First Citizens Bancorp (“First Citizens”) on the terms and subject to the conditions in the Agreement and Plan of Reorganization, dated January 11, 2006, between BB&T and First Citizens.
Shareholders of First Citizens Bancorp, BB&T Corporation, and other investors are urged to read the proxy statement/prospectus that will be included in the registration statement on Form S-4 which BB&T will file with the SEC in connection with the proposed merger because it will contain important information about BB&T, First Citizens Bancorp, the merger, the persons soliciting proxies in the merger, and their interests in the merger and related matters. After it is filed with the SEC, the proxy statement/prospectus will be available for free, both on the SEC’s web site (http://www.sec.gov) and from BB&T and First Citizens, as follows:
| |
|---|
| F. Alan Smith | | | Michael L. Nichols | | |
| President/Chief Operating Officer | | | External Reporting Manager | | |
| The Bank/First Citizens Bank | | | BB&T | | |
| 2305 Keith Street | | | 150 S. Stratford Road, Suite 400 | | |
| Cleveland, TN 37312 | | | Winston-Salem, North Carolina 27104 | | |
| Phone: (423) 478-8600 | | | Phone: (336)733-3079 | | |
BB&T, First Citizens and their respective directors and executive officers may be deemed participants in the solicitation of proxies from shareholders of First Citizens in connection with this transaction. Information about the directors and executive officers of BB&T may be found in BB&T’s proxy statement filed with the SEC on March 25, 2005 and will be incorporated by reference in the proxy statement/prospectus. You can obtain free copies of these documents as described above. In addition to the proposed registration statement and proxy statement/prospectus, BB&T files annual, quarterly and special reports, proxy statements, and other information with the SEC. These filings also are available on the SEC’s web site athttp://www.sec.gov. First Citizens is a privately held corporation.