
Thispresentation containscertainforward-looking statementswithrespectto thefinancial condition,results ofoperationsandbusinessesof BB&T.Statementsthat are nothistoricalorcurrentto facts orstatementsabout beliefs andexpectationsareforward-looking statements. Forward-looking statements involvecertain risks anduncertaintiesand are based on the beliefs andassumptionsof themanagementof BB&T, and theinformation availabletomanagementat the time that thispresentationwasprepared. Factorsthat may cause actual results to differmateriallyfrom thosecontemplatedby suchforward-looking statements include, among others,thefollowing:(1)general economicorbusiness conditions,eithernationallyorregionally,may be lessfavorablethanexpected, resultingin,amongother things, adeteriorationin credit quality and / or areduced demandfor credit or otherservices;(2)changesin theinterestrateenvironmentmayreducenetinterest marginsand / or thevolumesand values of loans made or held as well as the value of otherfinancialassets held; (3)competitive pressures among depositoryand otherfinancial institutionsmayincrease significantly;(4)legislativeorregulatory changes, including changesinaccounting standards,mayadverselyaffect thebusinessesin which BB&T isengaged;(5) local, state orfederaltaxingauthoritiesmay take taxpositionsthat areadverseto BB&T; (6)adverse changesmay occur in thesecurities markets;(7)competitorsof BB&T may havegreater financial resourcesanddevelop productsthat enable them tocomp etemoresuccessfullythan BB&T; (8) costs ordifficulties relatedto theintegrationof thebusinessesof BB&T and itsmerger partnersmay begreaterthanexpected, includingtheintegrationof ouracquisitionofColonialBank; (9)unpredictable naturalor otherdisasterscould have anadverseeffect on us in that such events couldmateriallydisrupt ouroperationsor the ability orwillingnessof ourcustomerstoaccessthefinancial serviceswe offer; (10)expectedcostsavings associatedwithcompleted mergersandacquisitionsmay not be fullyrealizedorrealizedwithin theexpectedtimeframes, includingouracquisitionofColonialBank; and (11)deposit attrition, customerloss orrevenuelossfollowing completed mergersandacquisitions, includingouracquisitionofColonialBank, may begreaterthanexpected.You should not place unduerelianceon anyforward-looking statementand shouldconsiderall of theforegoing uncertaintiesand risk, as well as those more fullydiscussedunder Item 1A. “RiskFactors RelatedtoBB&T’s Business”ofBB&T’s2009AnnualReport on Form 10-K and in any ofBB&T’s subsequentSEC filings.Forward-looking statementsspeak only as of the date they are made, and BB&Tundertakesnoobligationtoupdateanyforward-looking statementto reflect the impact ofcircumstancesor events that arise afte r the date theforward-looking statementwas made.

1

Thispresentation contains financial information determinedbymethodsother than inaccordancewithaccounting principles generally acceptedin the United States ofAmerica (“GAAP”).BB&T’s managementuses these “non-GAAP” measuresin theiranalysisof theCorporation’s performance. BB&T’s management believesthat these non-GAAPfinancial measures provideagreater understandingofongoing operationsandenhance c omparabilityof results with priorperiodsas well asdemonstratingthe effects ofsignificantgains andchargesin thecurrent period.TheCompany believesthat ameaningful analysisof itsfinancial performance requiresanunderstandingof the factorsunderlyingthatperformance. BB&T’s management believesthatinvestorsmay use these non-GAAPfinancial measurestoanalyze financial performance withoutthe impact ofunusualitems that mayobscuretrends in theCompany’s underlying performance.Thesedisclosuresshould not beviewedas asubstituteforoperatingresultsdeterminedinaccordancewithGAAP,nor are theynecessarily comparableto non-GAAPperformance measuresthat may bepresentedby othercomp anies. BB&T’s managementuses thesemeasurestoevaluatetheunderlying performanceandefficiencyof itsoperations. BB&T’s management believesthesemeasuresreflect core trends of thebusiness, excluding purchase accounting amortizationthat will cease in the future, while theacquired businesswillremain. Tangible commonequity and Tier 1commonequity ratios are Non-GAAPmeasures.BB&T uses the Tier 1commonequitydefinitionused in the SCAPassessmenttocalculatethese ratios.BB&T's managementuses thesemeasurestoassessthe quality of capital andbelievesthatinvestorsmay find them useful in theiranalysisof theCorporation.These capitalmeasuresare notnecessarily comparableto similar capitalmeasuresthat may bepresentedby othercompanies.Asset quality ratios have beenadjustedtoremovethe impact ofacquiredloans andforeclosed property coveredby the FDIC losssharing agreementsasmanagement believestheirinclusionresults indistortionof those ratios and may not becomparableto otherperiods presentedor to otherportfoliosthat were notimpactedbypurchase accounting.Areconciliationof these non-GAAPmeasuresto the mostdirectly comparableGAAPmeasureisincludedon theInvestor Relations sectionofBB&T’s website(www.bbt.com/investor) and as anappendixto thispresentation.

2

Items Affecting Quarterly Earnings
$ inmillions,except per shareamounts
| | | | | | |
| | | Pretax | | | | |
| | | | | | Per share Impact | |
| | | Income (Expense) | | | | |
| Securities gains, net | $ | 219 | | $ | .19 | |
| | | | | | | |
| Allowance build1 | | (90 | ) | | (.08 | ) |
| | | | | | | |
| Losses related to NPA disposition strategy | | (69 | ) | | (.06 | ) |
| | | | | | | |
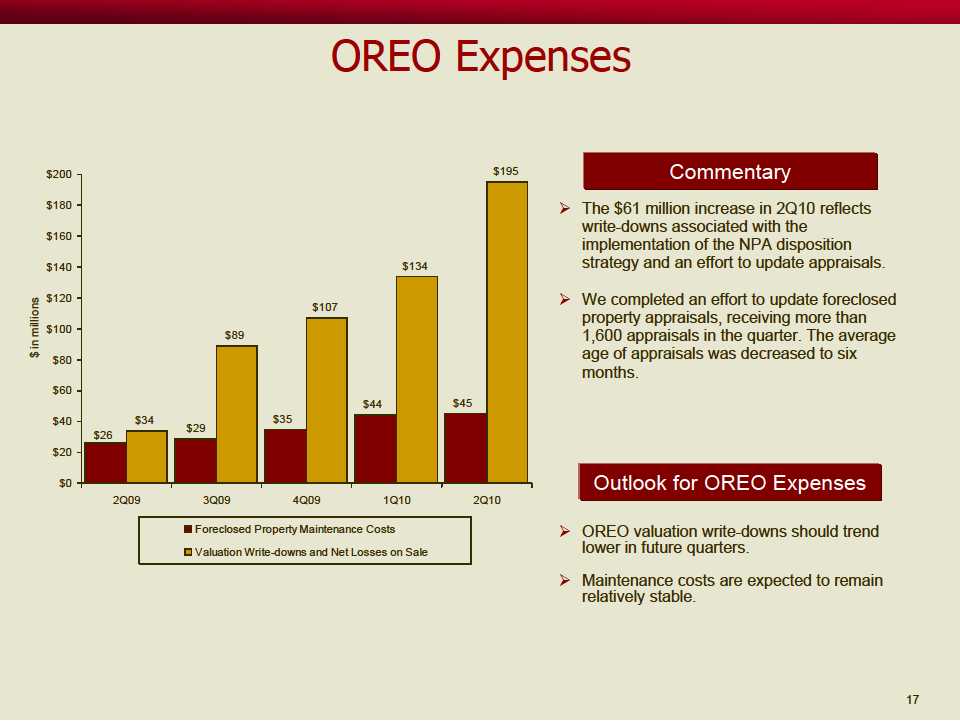
| Additional OREO write-downs2 | | (61 | ) | | (.05 | ) |
| | | | | | | |
| Merger-related charges | | (38 | ) | | (.03 | ) |
1Excludesthe impact of the NPAdisposition strategy.
2Increasein losses andwrite-downs comparedto the firstquarterof 2010.Write-downsinconnectionwith an effort toupda te foreclosed property appraisals.At June 30, 2010, theaverage appraisalagedecreasedto 6months.
4

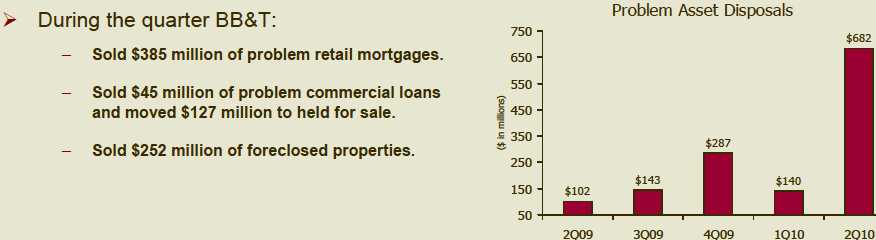
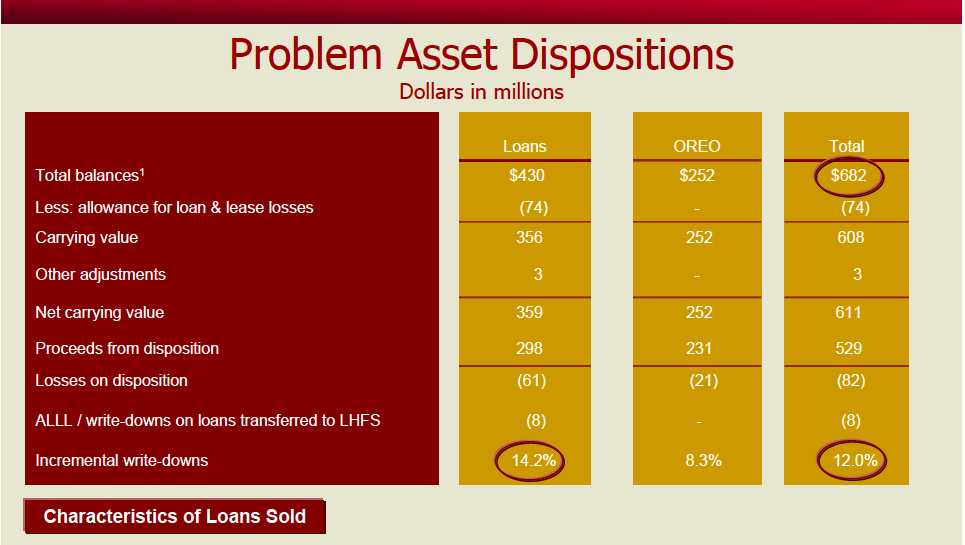
NPADisposition Strategy
|
| ØThe strategy implemented this quarter is consistent with our long-term plan to |
| dispose of problem assets as pricing improves. |
| ØWe reached an inflection point early this quarter, and observed more buyers enter |
| the bidding process, resulting in higher valuations and significantly better bids. |
| ØTherefore, we implemented a strategy with the goal of: |
| |
| –More aggressively reducing BB&T’s exposure to nonperforming loans and |
| foreclosed properties and reducing or eliminating any delay exiting the credit |
| cycle. |
|
| ØThese transactions successfully liquidated $682 million in problem assets, significantly |
| lowering balance sheet risk and accelerating our outlook for exiting the credit cycle. |
| |
| ØWe will continue this strategy as long as pricing remains firm. |
5

NetRevenuesandEarningsPower
NetRevenues
|
| ØNet revenues increased 43.9% on an annualized linked quarter |
| basis. |
| ØExcluding securities gains and loss share impact, net revenues |
| increased an annualized 6.4% compared to 1Q10. |
EarningsPower
|
| ØPre-tax pre-provision earnings available to common shareholders |
| totaled $885 million, up an annualized 36.6% compared to 1Q10. |
| ØExcluding gains on securities and foreclosed property costs, |
| pre-tax pre-provision earnings remain strong at $906 million. |
9

|
| ØHighly successful Colonial systems conversion completed in |
| May. |
| |
| ØMerger-charges will be down significantly in last half of 2010, |
| with $10 million - $20 million expected. |
| |
| ØWe continue to expect Colonial-related cost savings of $170 |
| million annually with a full run rate in the third quarter this year. |
| |
| ØColonial branches have originated more than $600 million in |
| loans and have $16.8 billion in deposits. |
| |
| ØColonial branches are opening transaction accounts on a pace |
| that is 72% of the rate for a legacy BB&T branch. |
10

|
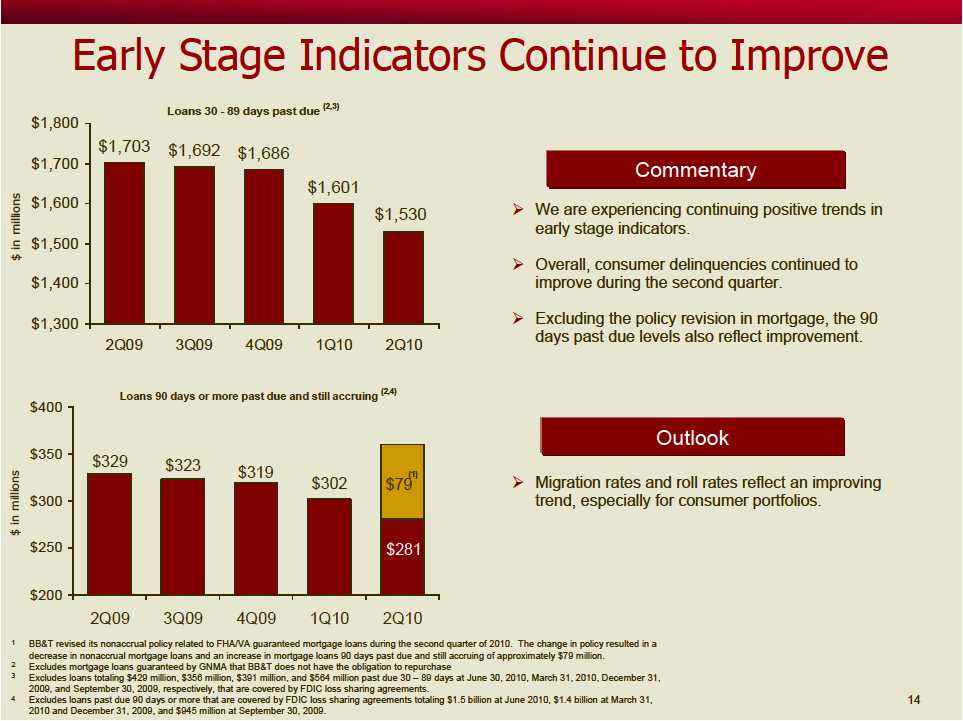
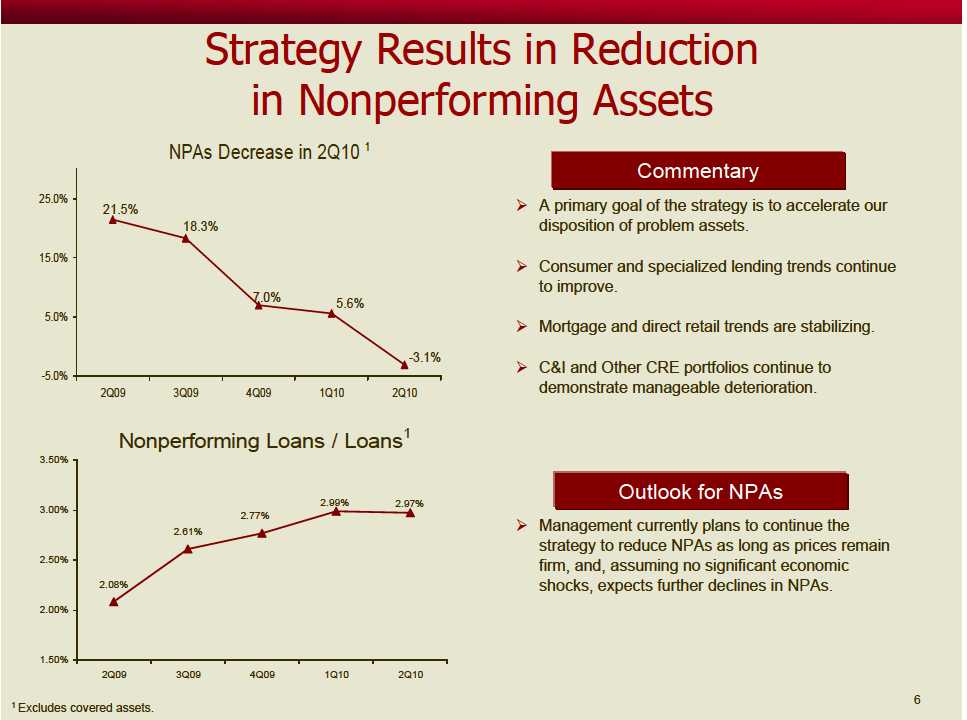
| ØOverall delinquencies are stable to improving, particularly excluding the policy change affecting mortgage delinquencies. |
| ØIncreases in charge-offs reflect the NPA disposition strategy and continued efforts to work through the ADC portfolio. |
| ØNPLs reflect continued manageable deterioration in Other CRE and C&I. |
1Excludes coveredloans.Balances calculatedas apercentageof loans in eachcategory.
12
| |
| Ø | The mortgage sale was primarily a bulk sale of larger balance nonaccruals ($342 thousand average loan balance compared |
| | to remaining nonaccruals average of $180 thousand) with higher uncertainty as to ultimate recovery. We targeted loans |
| | where modification was not a likely solution. |
| Ø | The mortgage bulk sale excluded construction perm loans, deep discount loans, late-stage foreclosure loans, smaller- |
| | balance loans, insured loans and recently modified loans. |
1Includes$11 million of loans onaccrualstatus.Balancesreflect unpaidprincipal balanceslesspreviouswrite-downs.
13
|
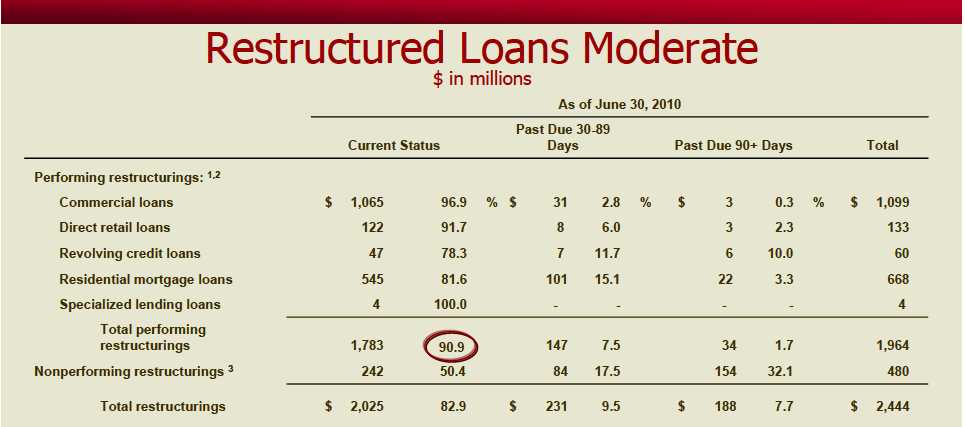
| ØRestructured loan balances moderated compared to first quarter. |
| Ø80.4% of TDRs are performing. |
| Ø82.9% of TDRs are current at 2Q10. |
| ØBB&T’s loan modification programs continue to be an effective strategy for assisting troubled |
| borrowers. |
|
| 1Excludes restructured covered and other acquired loans accounted for under the accretion method. |
| 2Past due performing restructurings are included in past due disclosures. |
| 3Nonperforming restructurings are included in nonaccrual loan disclosures. |
15

2Q10EarningsCallSummary
|
| ØIn summary, BB&T enjoyed another solid quarter. |
| |
| ØFundamental core performance in many of our businesses remains |
| strong despite a sluggish economy. |
| |
| ØConsistent with our long-term plans, we implemented a more aggressive |
| strategy to reduce our balance sheet risk and exposure to nonperforming |
| assets. |
| |
| ØAlso, we remain very conservative by maintaining a strong allowance |
| coverage and positioning our foreclosed property portfolio to continue |
| this strategy as long as market pricing remains acceptable. |
| |
| ØChanges in interest rates allowed us to reduce our securities portfolio, |
| and strengthen the flexibility and sensitivity of our balance sheet. |
| |
| ØWe further strengthened our capital levels and remain among industry |
| leaders in capital. |
25

Comments Regarding Disclosure
BB&TCorporationdoes notprovide earnings guidance,but doesdiscusstrendsregardingthe factors thatinfluence potentialfutureperformancein both itsquarterly earnings releaseand itsquarterly earnings conferencecall.
Thesestatements constitute “forward-looking statements,”asdefinedin thePrivate Securities Litigation ReformAct of 1995.Pleaserefer to the slideentitled “Forward Looking Information”forimportant cautionary information regarding forward-looking statements.BB&Tundertakesnoobligationto revise thesestatements followingthe date of thispresentation.
26

Appendix

Non-GAAP CapitalMeasures
| | | | | | | | | | | | | | | |
| (Dollars in millions) | As of / Quarter Ended |
| | | June 30 | | | March 31 | | | Dec. 31 | | | Sept.30 | | | June 30 | |
| | | 2010 | | | 2010 | | | 2009 | | | 2009 | | | 2009 | |
| Selected Capital Information1 | | | | | | | | | | | | | | | |
| Risk-based capital | | | | | | | | | | | | | | | |
| Tier 1 | $ | 13,594 | | $ | 13,657 | | $ | 13,456 | | $ | 12,851 | | $ | 12,132 | |
| Total | | 18,328 | | | 18,658 | | | 18,470 | | | 18,012 | | | 17,361 | |
| Risk-weighted assets2 | | 116,155 | | | 117,410 | | | 117,167 | | | 115,608 | | | 114,173 | |
| Average quarterly tangible assets | | 153,407 | | | 157,603 | | | 158,061 | | | 150,992 | | | 143,011 | |
| Risk-based capital ratios | | | | | | | | | | | | | | | |
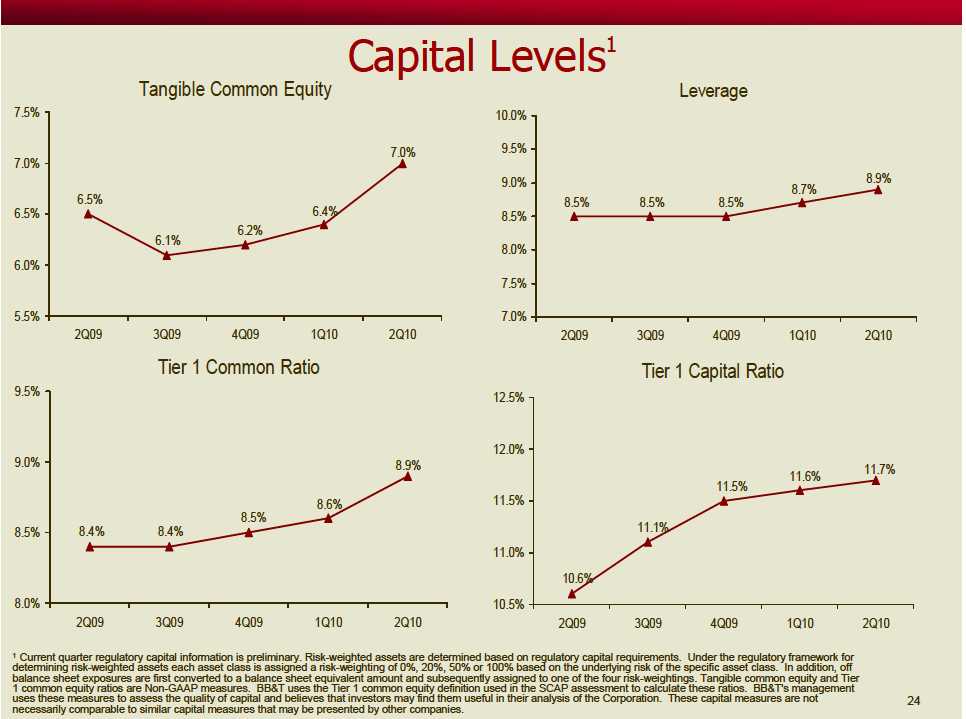
| Tier 1 | | 11.7 | % | | 11.6 | % | | 11.5 | % | | 11.1 | % | | 10.6 | % |
| Total | | 15.8 | | | 15.9 | | | 15.8 | | | 15.6 | | | 15.2 | |
| Leverage capital ratio | | 8.9 | | | 8.7 | | | 8.5 | | | 8.5 | | | 8.5 | |
| Equity as a percentage of total assets | | 10.8 | | | 10.1 | | | 9.8 | | | 9.8 | | | 9.7 | |
| Book value per common share | $ | 24.07 | | $ | 23.80 | | $ | 23.47 | | $ | 23.41 | | $ | 22.76 | |
| |
| Selected Non-GAAP Capital Information3 | | | | | | | | | | | | | | | |
| Tangible common equity as a percentage of tangible assets | | 7.0 | % | | 6.4 | % | | 6.2 | % | | 6.1 | % | | 6.5 | % |
| Tier 1 common equity as a percentage of risk-weighted assets | | 8.9 | | | 8.6 | | | 8.5 | | | 8.4 | | | 8.4 | |
| |
| Tangible book value per common share | $ | 14.93 | | $ | 14.67 | | $ | 14.44 | | $ | 14.10 | | $ | 14.74 | |
| 1 | Current quarter regulatory capital information is preliminary. |
| 2 | Risk-weighted assets are determined based on regulatory capital requirements. Under the regulatory framework for determining risk-weighted assets each asset class is assigned a risk- weighting of 0%, 20%, 50% or 100% based on the underlying risk of the specific asset class. In addition, off balance sheet exposures are first converted to a balance sheet equivalent amount and subsequently assigned to one of the four risk-weightings. |
| 3 | Tangible common equity and Tier 1 common equity ratios are Non-GAAP measures. BB&T uses the Tier 1 common equity definition used in the SCAP assessment to calculate these ratios. BB&T's management uses these measures to assess the quality of capital and believes that investors may find them useful in their analysis of the Corporation. These capital measures are not necessarily comparable to similar capital measures that may be presented by other companies. |

| | | | | | | | | | | | | | | | | | | | |
| Non-GAAP Capital Measures |
| (Dollars in millions) | As of / Quarter Ended |
| | June 30 | | March 31 | Dec. 31 | | Sept.30 | | June 30 |
| | 2010 | | 2010 | 2009 | | 2009 | | 2009 |
| Calculations of Tier 1 common equity and tangible assets and related measures: | | | | | | | | | | | | | | | | | | | | |
| Tier 1 equity | $ | | 13,594 | | $ | | 13,657 | | | $ | 13,456 | | | $ | 12,851 | | | $ | 12,132 | |
| Less: | | | | | | | | | | | | | | | | | | | | |
| Qualified restricted core capital elements | | | 3,254 | | | | 3,508 | | | | 3,497 | | | | 3,157 | | | | 2,578 | |
| Tier 1 common equity | | | 10,340 | | | | 10,149 | | | | 9,959 | | | | 9,694 | | | | 9,554 | |
| |
| Total assets | $ | | 155,083 | | $ | | 163,700 | | | $ | 165,764 | | | $ | 165,328 | | | $ | 152,398 | |
| Less: | | | | | | | | | | | | | | | | | | | | |
| Intangible assets, net of deferred taxes | | | 6,502 | | | | 6,519 | | | | 6,553 | | | | 6,695 | | | | 5,851 | |
| Plus: | | | | | | | | | | | | | | | | | | | | |
| Regulatory adjustments, net of deferred taxes | | | 187 | | | | 493 | | | | 806 | | | | 712 | | | | 1,315 | |
| Tangible assets | | | 148,768 | | | | 157,674 | | | | 160,017 | | | | 159,345 | | | | 147,862 | |
| |
| Total risk-weighted assets1 | $ | | 116,155 | | $ | | 117,410 | | | $ | 117,167 | | | $ | 115,608 | | | $ | 114,173 | |
| |
| Tangible common equity as a percentage of tangible assets | | | 7.0 | % | | | 6.4 | % | | | 6.2 | % | | | 6.1 | % | | | 6.5 | % |
| Tier 1 common equity as a percentage of risk-weighted assets | | | 8.9 | % | | | 8.6 | % | | | 8.5 | % | | | 8.4 | % | | | 8.4 | % |
| |
| Tier 1 common equity | $ | | 10,340 | | $ | | 10,149 | | | $ | 9,959 | | | $ | 9,694 | | | $ | 9,554 | |
| |
| Outstanding shares at end of period (in thousands) | | | 692,777 | | | | 691,869 | | | | 689,750 | | | | 687,446 | | | | 648,068 | |
| |
| Tangible book value per common share | $ | | 14.93 | | $ | | 14.67 | | | $ | 14.44 | | | $ | 14.10 | | | $ | 14.74 | |
| 1 | Risk-weighted assets are determined based on regulatory capital requirements. Under the regulatory framework for determining risk-weighted assets each asset class is assigned a risk- weighting of 0%, 20%, 50% or 100% based on the underlying risk of the specific asset class. In addition, off balance sheet exposures are first converted to a balance sheet equivalent amount and subsequently assigned to one of the four risk-weightings. |

| | | | | | | | | | |
| Non-GAAP Reconciliations |
| |
| | Quarter Ended |
| | June 30 | | March 31 | | Dec. 31 | | Sept. 30 | | June 30 | |
| | 2010 | | 2010 | | 2009 | | 2009 | | 2009 | |
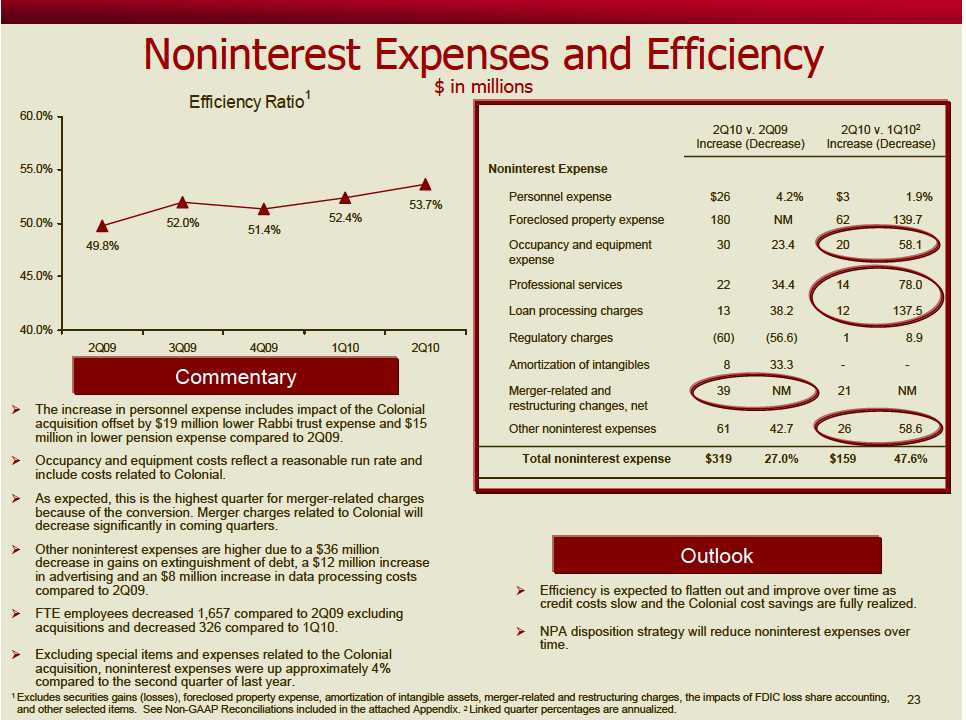
| Efficiency ratio – GAAP | 61.7 | % | 61.2 | % | 58.5 | % | 59.8 | % | 54.7 | % |
| Effect of securities gains (losses), net | 5.1 | | (.1 | ) | - | | .8 | | .5 | |
| Effect of merger-related and restructuring charges, net | (1.6 | ) | (.7 | ) | (.4 | ) | (.8 | ) | - | |
| Effect of contingency reserve | - | | .5 | | - | | (1.1 | ) | - | |
| Effect of FDIC special assessment | - | | - | | - | | - | | (3.3 | ) |
| Effect of gain on extinguishment of debt | - | | - | | - | | - | | 1.7 | |
| Effect of payroll services gain | - | | - | | .7 | | - | | - | |
| Effect of Colonial revaluation adjustments | - | | - | | .3 | | - | | - | |
| Effect of Colonial premises and equipment adjustments | - | | .8 | | - | | - | | - | |
| Effect of FDIC loss share accounting | - | | .3 | | - | | - | | - | |
| Effect of foreclosed property expense | (10.1 | ) | (8.1 | ) | (6.2 | ) | (5.4 | ) | (2.7 | ) |
| Effect of amortization of intangibles | (1.4 | ) | (1.5 | ) | (1.5 | ) | (1.3 | ) | (1.1 | ) |
| Efficiency ratio – reported | 53.7 | | 52.4 | | 51.4 | | 52.0 | | 49.8 | |
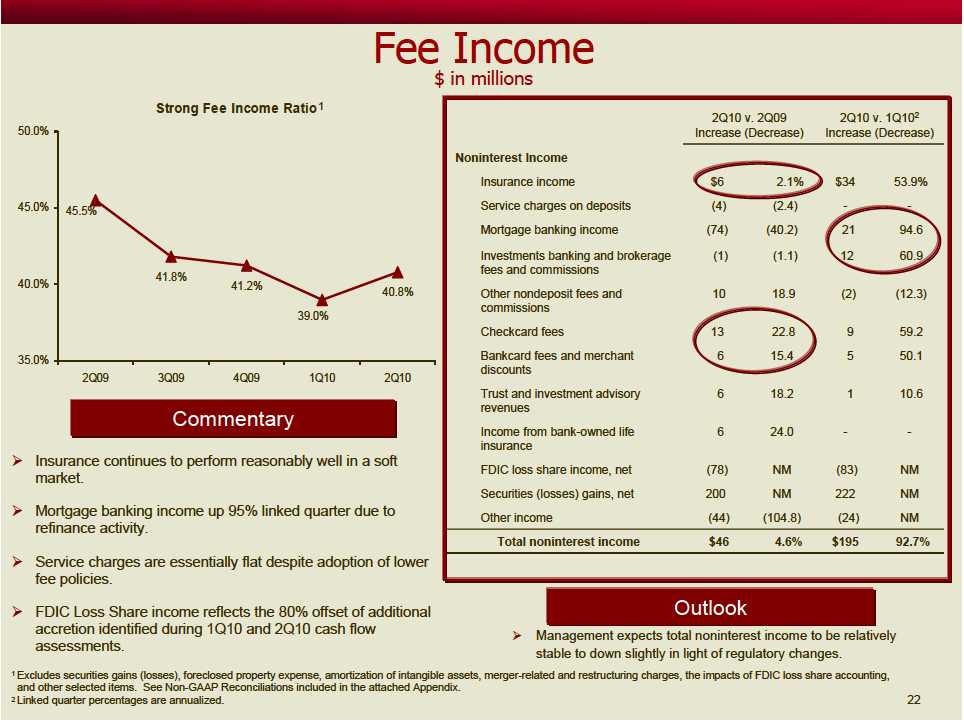
| Fee income ratio – GAAP | 42.7 | % | 38.5 | % | 41.7 | % | 42.6 | % | 46.0 | % |
| Effect of securities gains (losses), net | (5.5 | ) | .1 | | - | | (.8 | ) | (.5 | ) |
| Effect of payroll services gain | - | | - | | (.7 | ) | - | | - | |
| Effect of FDIC loss share accounting | 3.6 | | .4 | | - | | - | | - | |
| Effect of Colonial revaluation adjustments | - | | - | | .2 | | - | | - | |
| Fee income ratio – reported | 40.8 | | 39.0 | | 41.2 | | 41.8 | | 45.5 | |

| | | | | | | | | | |
| Non-GAAP Reconciliations |
| |
| | As of / For the Quarter Ended |
| | June 30 | | March 31 | | Dec. 31 | | Sept. 30 | | June 30 | |
| | 2010 | | 2010 | | 2009 | | 2009 | | 2009 | |
| Asset Quality Ratios (including amounts related to covered | | | | | | | | | | |
| loans and covered foreclosed property) | | | | | | | | | | |
| Loans 30-89 days past due and still accruing as a percentage | | | | | | | | | | |
| of total loans and leases1 | 1.87 | % | 1.87 | % | 1.96 | % | 2.11 | % | 1.70 | % |
| Loans 90 days or more past due and still accruing as a | | | | | | | | | | |
| percentage of total loans and leases1 | 1.82 | | 1.66 | | 1.61 | | 1.18 | | .33 | |
| Nonperforming loans and leases as a percentage of total loans | | | | | | | | | | |
| and leases | 2.77 | | 2.77 | | 2.56 | | 2.40 | | 2.08 | |
| Nonperforming loans and leases as a percentage of: | | | | | | | | | | |
| Total assets | 2.90 | | 2.84 | | 2.65 | | 2.48 | | 2.19 | |
| Loans and leases plus foreclosed property | 4.24 | | 4.38 | | 4.07 | | 3.78 | | 3.29 | |
| Net charge-offs as a percentage of average loans and leases | 2.48 | | 1.84 | | 1.83 | | 1.71 | | 1.81 | |
| Allowances for loan and lease losses as a percentage of loans | | | | | | | | | | |
| and leases held for investment | 2.66 | | 2.65 | | 2.51 | | 2.29 | | 2.19 | |
| Ratio of allowance for loans and lease losses to: | | | | | | | | | | |
| Net charge-offs | 1.06 | X | 1.41 | X | 1.34 | X | 1.35 | X | 1.17 | X |
| Nonperforming loans and leases held for investment | .98 | | .94 | | .96 | | .93 | | 1.01 | |
Applicableratios areannualized.
1Excludes mortgageloansguaranteedby GNMA that BB&T does not have theobligationtorepurchase.

| | | | | | | | | | |
| Non-GAAP Reconciliations |
| |
| | As of / For the Quarter Ended |
| | June 30 | | March 31 | | Dec. 31 | | Sept. 30 | | June 30 | |
| | 2010 | | 2010 | | 2009 | | 2009 | | 2009 | |
| Asset Quality Ratios (excluding amounts related to covered | | | | | | | | | | |
| loans and covered foreclosed property)2 | | | | | | | | | | |
| Loans 30-89 days past due and still accruing as a percentage | | | | | | | | | | |
| of total loans and leases1 | 1.57 | % | 1.65 | % | 1.72 | % | 1.71 | % | 1.70 | % |
| Loans 90 days or more past due and still accruing as a | | | | | | | | | | |
| percentage of total loans and leases1 | .37 | | .31 | | .32 | | .33 | | .33 | |
| Nonperforming loans and leases as a percentage of total loans | | | | | | | | | | |
| and leases | 2.97 | | 2.99 | | 2.77 | | 2.61 | | 2.08 | |
| Nonperforming assets as a percentage of: | | | | | | | | | | |
| Total assets | 2.93 | | 2.86 | | 2.68 | | 2.52 | | 2.19 | |
| Loans and leases plus foreclosed property | 4.37 | | 4.53 | | 4.24 | | 3.95 | | 3.29 | |
| Net charge-offs as a percentage of average loans and leases3 | 2.66 | | 1.99 | | 1.98 | | 1.79 | | 1.81 | |
| Allowances for loan and lease losses as a percentage of loans | | | | | | | | | | |
| and leases held for investment | 2.84 | | 2.84 | | 2.72 | | 2.49 | | 2.19 | |
| Ratio of allowance for loans and lease losses to: | | | | | | | | | | |
| Net charge-offs | 1.05 | X | 1.40 | X | 1.34 | X | 1.35 | X | 1.17 | X |
| Nonperforming loans and leases held for investment | .98 | | .93 | | .96 | | .93 | | 1.01 | |
| | Applicable ratios are annualized. |
| 1 | Excludes mortgage loans guaranteed by GNMA that BB&T does not have the obligation to repurchase. |
| 2 | These asset quality ratios have been adjusted to remove the impact of covered loans and covered foreclosed property. Appropriate adjustments to the numerator and denominator have been reflected in the calculation of these ratios. Management believes the inclusion of acquired loans in certain asset quality ratios that include nonperforming assets, past due loans or net charge-offs in the numerator or denominator results in distortion of these ratios and they may not be comparable to other periods presented or to other portfolios that were not impacted by purchase accounting. |
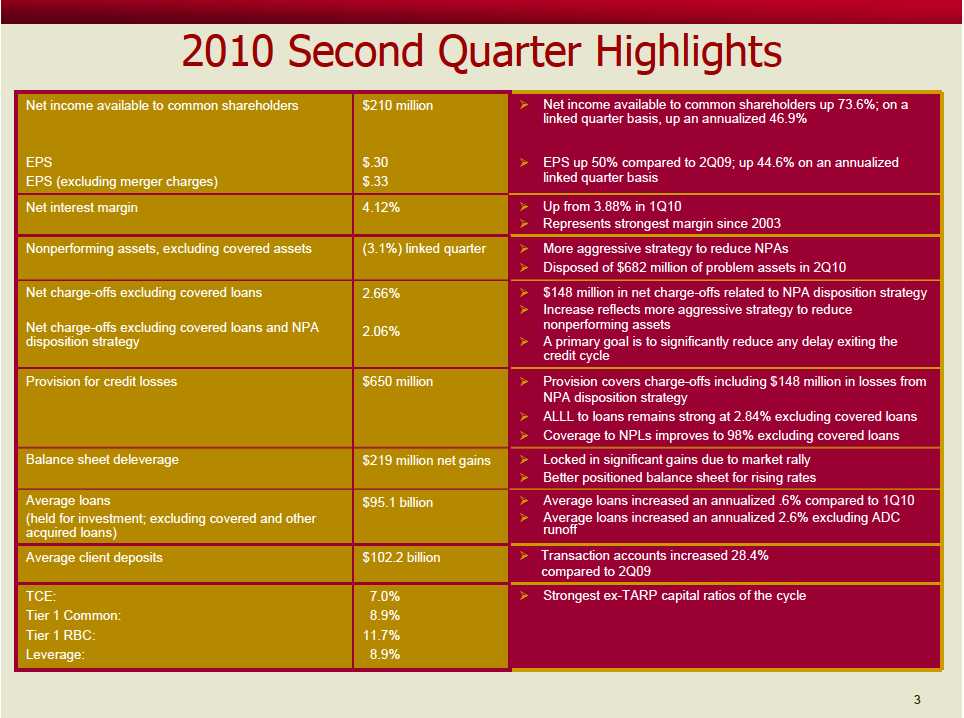
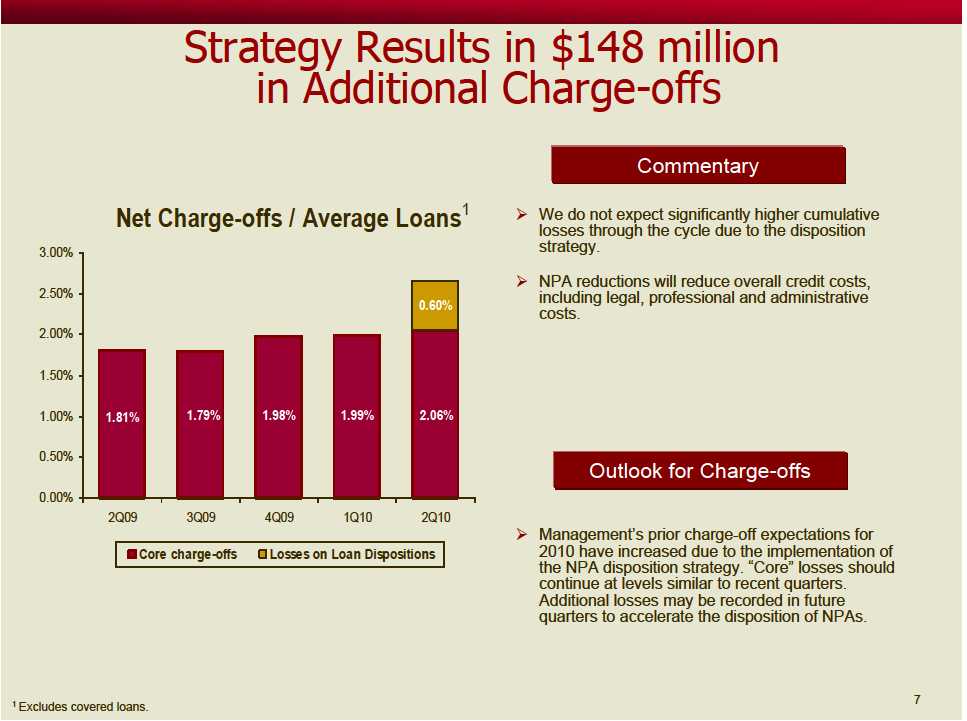
| 3 | Excluding the impact of losses and balances associated with BB&T's NPA disposition strategy, the adjusted net charge-offs ratio would have been 2.06% for the second quarter of 2010. |

| | | | | | | | |
| Non-GAAP Revenue and |
| |
| Expense Growth Rates |
| | | | | | | | Annualized | |
| | | | | | | | Link Qtr | |
| ($ in millions) | | 2Q10 | | | 1Q10 | | Growth | |
| Net interest income (fully taxable equivalent) | $ | 1,392 | | $ | 1,347 | | | |
| Noninterest income | | 1,039 | | | 844 | | | |
| Total revenue (fully taxable equivalent) | | 2,431 | | | 2,191 | | 43.9 | % |
| |
| Securities gains, net | | (219 | ) | | 3 | | | |
| Loss share impact for impairments1 | | 2 | | | (15 | ) | | |
| |
| Adjusted revenues | $ | 2,214 | | $ | 2,179 | | 6.4 | % |
| |
| | | 2 | Q10 | | 2 | Q09 | Growth | |
| Noninterest expense | $ | 1,500 | | $ | 1,181 | | 27.0 | % |
| Foreclosed property expense | | (240 | ) | | (60 | ) | | |
| Merger-related and restructuring charges, net | | (38 | ) | | 1 | | | |
| Qualified pension plan expense | | (2 | ) | | (17 | ) | | |
| Post employment benefits expense2 | | 1 | | | (18 | ) | | |
| FDIC special assessment | | - | | | (71 | ) | | |
| Gain from extinguishment from debt | | - | | | 36 | | | |
| Estimated growth from acquisitions | | - | | | 125 | | | |
| Total revenue (fully taxable equivalent) | $ | 1,221 | | $ | 1,177 | | 3.7 | % |
1Represents amountof loss share(income) expensethat wasrecordedinconnectionwithadditional (impairments) recoveries.
2Representscertainbenefitsthat have anoffsetting changeinnoninterest income.

BB&TCorporation