Exhibit 99.3

Non - GAAP Information This presentation contains financial information and performance measures determined by methods other than in accordance with accounting principles generally accepted in the United States of America (“GAAP”) . BB&T’s management uses these “non - GAAP” measures in their analysis of the corporation’s performance and the efficiency of its operations . Management believes that these non - GAAP measures provide a greater understanding of ongoing operations and enhance comparability of results with prior periods as well as demonstrating the effects of significant gains and charges in the current period . The company believes that a meaningful analysis of its financial performance requires an understanding of the factors underlying that performance . BB&T’s management believes that investors may use these non - GAAP financial measures to analyze financial performance without the impact of unusual items that may obscure trends in the company’s underlying performance . These disclosures should not be viewed as a substitute for financial measures determined in accordance with GAAP, nor are they necessarily comparable to non - GAAP performance measures that may be presented by other companies . In this presentation, these measures are generally marked as “non - GAAP” and are accompanied with disclosure regarding why BB&T’s management believes such measures are useful to investors . Below is a listing of the types of non - GAAP measures used in this presentation : □ Tangible common equity, Tier 1 common equity and related ratios are non - GAAP measures. The Basel III common equity Tier I capital ratio reflects management’s interpretation of the regulatory requirements. BB&T’s management uses these measures to assess the quality of capital and believes that investors may find them useful in their analysis of the Corporation. □ Asset quality ratios have been adjusted to remove the impact of acquired loans and foreclosed property covered by FDIC loss s har ing agreements from the numerator and denominator of these ratios. Management believes that their inclusion may result in distortion of these ratios, such that they may not b e c omparable to other periods presented or to other portfolios that were not impacted by purchase accounting. □ Fee income and efficiency ratios are non - GAAP in that they exclude securities gains (losses), foreclosed property expense, amort ization of intangible assets, merger - related and restructuring charges, the impact of FDIC loss share accounting and other selected items. BB&T’s management uses these measu res in their analysis of the Corporation’s performance. BB&T’s management believes these measures provide a greater understanding of ongoing operations and enhance comparability of res ults with prior periods, as well as demonstrating the effects of significant gains and charges. □ Return on average tangible common shareholders’ equity is a non - GAAP measure that calculates the return on average common shareh olders’ equity without the impact of intangible assets and their related amortization. This measure is useful for evaluating the performance of a business consistently, whe the r acquired or developed internally. □ Core net interest margin is a non - GAAP measure that adjusts net interest margin to exclude the estimated impact of interest inco me and funding costs associated with loans and securities acquired in the Colonial acquisition. BB&T’s management believes that the exclusion of the generally higher yielding assets acquired in the Colonial transaction from the calculation of net interest margin provides investors with useful information related to the relative performance of the rema ind er of BB&T’s earning assets. □ Net income available to common shareholders and diluted EPS has been adjusted to exclude the impact of the $235 million tax adjustment that was recorded in the third quarter of 2013. BB&T management believes this adjustment increases comparability of period to period results and uses this measure to assess performance and believes investors may find it useful in their analysis of the Corporation . A reconciliation of these non - GAAP measures to the most directly comparable GAAP measure is included on the Investor Relations s ection of BB&T’s website and as an appendix to this presentation. Forward - Looking Information This presentation contains forward - looking statements with respect to the financial condition, results of operations and businesses of BB&T . Statements that are not historical or current facts or statements about beliefs and expectations are forward - looking statements . Words such as “anticipates,” “believes,” “estimates,” “expects,” “forecasts,” “intends,” “plans,” “projects,” “may,” “will,” “should,” and other similar expressions are intended to identify these forward - looking statements . Forward - looking statements involve certain risks and uncertainties and are based on the beliefs and assumptions of the management of BB&T, and the information available to management at the time that this presentation was prepared . Factors that may cause actual results to differ materially from those contemplated by such forward - looking statements include, among others, the following : ( 1 ) general economic or business conditions, either nationally or regionally, may be less favorable than expected, resulting in, among other things, a deterioration in credit quality and / or a reduced demand for credit or other services ; ( 2 ) disruptions to the credit and financial markets, either nationally or globally, including the impact of a downgrade of U . S . government obligations by one of the credit rating agencies and the adverse effects of the ongoing sovereign debt crisis in Europe ; ( 3 ) changes in the interest rate environment may reduce net interest margins and / or the volumes and values of loans made or held as well as the value of other financial assets held ; ( 4 ) competitive pressures among depository and other financial institutions may increase significantly ; ( 5 ) legislative, regulatory, or accounting changes, including changes resulting from the adoption and implementation of the Dodd - Frank Wall Street Reform and Consumer Protection Act of 2010 , and changes in accounting standards, may adversely affect the businesses in which BB&T is engaged ; ( 6 ) local, state or federal taxing authorities may take tax positions that are adverse to BB&T ; ( 7 ) reduction in BB&T’s credit ratings ; ( 8 ) adverse changes may occur in the securities markets ; ( 9 ) competitors of BB&T may have greater financial resources and develop products that enable them to compete more successfully than BB&T and may be subject to different regulatory standards than BB&T ; ( 10 ) costs or difficulties related to the integration of the businesses of BB&T and its merger partners may be greater than expected ; ( 11 ) unpredictable natural or other disasters could have an adverse effect on BB&T in that such events could materially disrupt BB&T’s operations or the ability or willingness of BB&T’s customers to access the financial services BB&T offers ; ( 12 ) expected cost savings associated with completed mergers and acquisitions may not be fully realized or realized within the expected time frames ; ( 13 ) deposit attrition, customer loss and/or revenue loss following completed mergers and acquisitions, may be greater than expected ; and ( 14 ) BB&T faces system failures and cyber - security risks that could adversely affect BB&T’s business and financial performance . These and other risk factors are more fully described in BB&T’s Annual Report on Form 10 - K for the year ended December 31 , 2012 under the section entitled Item 1 A . “Risk Factors” and from time to time, in other filings with the Securities and Exchange Commission . You are cautioned not to place undue reliance on these forward - looking statements, which speak only as of the date of this presentation . Actual results may differ materially from those expressed in or implied by any forward - looking statements . Except to the extent required by applicable law or regulation, BB&T undertakes no obligation to revise or update publicly any forward - looking statements for any reason . 2
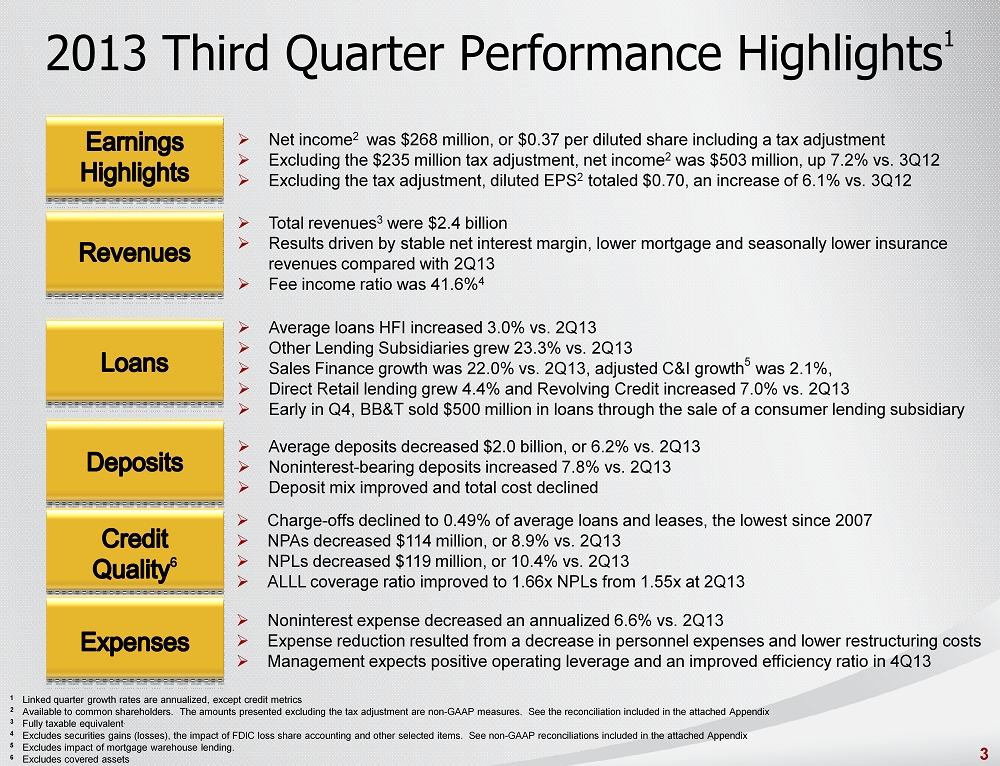
2013 Third Quarter Performance Highlights 1 6 » Net income 2 was $268 million , or $ 0.37 per diluted share including a tax adjustment » Excluding the $235 million tax adjustment, net income 2 was $503 million, up 7.2% vs. 3Q12 » Excluding the tax adjustment, diluted EPS 2 totaled $ 0.70, an increase of 6.1% vs. 3Q12 » Average loans HFI increased 3.0% vs. 2Q13 » Other Lending Subsidiaries grew 23.3% vs. 2Q13 » Sales Finance growth was 22.0% vs. 2Q13, adjusted C&I growth 5 was 2.1%, » Direct Retail lending grew 4.4% and Revolving Credit increased 7.0% vs. 2Q13 » Early in Q4, BB&T sold $500 million in loans through the sale of a consumer lending subsidiary » Average deposits decreased $2.0 billion , or 6.2% vs. 2Q13 » Noninterest - bearing deposits increased 7.8% vs. 2Q13 » Deposit mix improved and total cost declined » Charge - offs declined to 0.49% of average loans and leases, the lowest since 2007 » NPAs decreased $114 million , or 8.9% vs. 2Q13 » NPLs decreased $119 million , or 10.4% vs. 2Q13 » ALLL coverage ratio improved to 1.66x NPLs from 1.55x at 2Q13 » Total revenues 3 were $2.4 billion » Results driven by stable net interest margin, lower mortgage and seasonally lower insurance revenues compared with 2Q13 » Fee income ratio was 41.6% 4 » Noninterest expense decreased an annualized 6.6% vs. 2Q13 » Expense reduction resulted from a decrease in personnel expenses and lower restructuring costs » Management expects positive operating leverage and an improved efficiency ratio in 4Q13 1 Linked quarter growth rates are annualized, except credit metrics 2 Available to common shareholders. The amounts presented excluding the tax adjustment are non - GAAP measures. See the reconcilia tion included in the attached Appendix 3 Fully taxable equivalent . 4 Excludes securities gains (losses), the impact of FDIC loss share accounting and other selected items. See non - GAAP reconciliat ions included in the attached Appendix 5 Excludes impact of mortgage warehouse lending. 6 Excludes covered assets 3
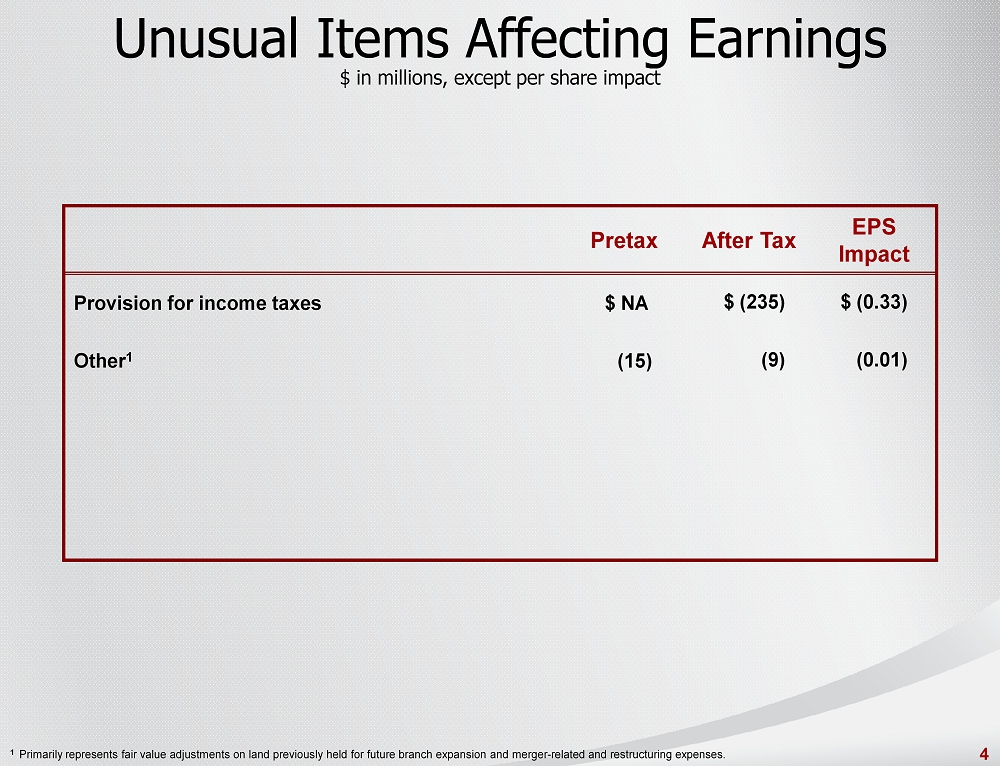
Pretax After Tax EPS Impact Provision for income taxes $ NA $ (235) $ (0.33) Other 1 (15) (9) (0.01) 1 Primarily represents fair value adjustments on land previously held for future branch expansion and merger - related and restructu ring expenses. 4 Unusual Items Affecting Earnings $ in millions, except per share impact
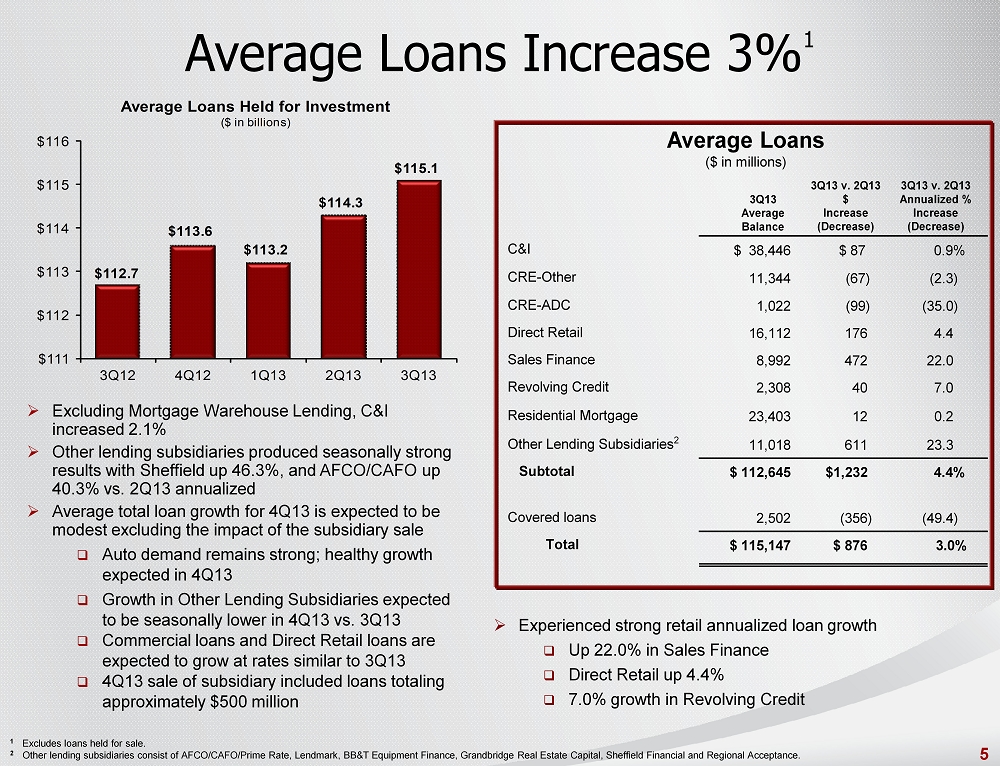
Average Loans Increase 3% 1 $112.7 $113.6 $113.2 $114.3 $115.1 $111 $112 $113 $114 $115 $116 3Q12 4Q12 1Q13 2Q13 3Q13 Average Loans Held for Investment ($ in billions) » Excluding Mortgage Warehouse Lending, C&I increased 2.1% » Other lending subsidiaries produced seasonally strong results with Sheffield up 46.3%, and AFCO/CAFO up 40.3% vs. 2Q13 annualized » Average total loan growth for 4Q13 is expected to be modest excluding the impact of the subsidiary sale □ Auto demand remains strong; healthy growth expected in 4Q13 □ Growth in Other Lending Subsidiaries expected to be seasonally lower in 4Q13 vs. 3Q13 □ Commercial loans and Direct Retail loans are expected to grow at rates similar to 3Q13 □ 4Q13 sale of subsidiary included loans totaling approximately $500 million 1 Excludes loans held for sale. 2 Other lending subsidiaries consist of AFCO/CAFO/Prime Rate, Lendmark, BB&T Equipment Finance, Grandbridge Real Estate Capital , Sheffield Financial and Regional Acceptance. C&I $ 38,446 $ 87 0.9% CRE - Other 11,344 (67) (2.3) CRE - ADC 1,022 (99) (35.0) Direct Retail 16,112 176 4.4 Sales Finance 8,992 472 22.0 Revolving Credit 2,308 40 7.0 Residential Mortgage 23,403 12 0.2 Other Lending Subsidiaries 2 11,018 611 23.3 Subtotal $ 112,645 $1,232 4.4% Covered loans 2,502 (356) (49.4) Total $ 115,147 $ 876 3.0% 3 Q13 v. 2Q13 Annualized % Increase (Decrease) Average Loans ($ in millions) 3Q13 v. 2Q13 $ Increase (Decrease) 3Q13 Average Balance 5 » Experienced strong retail annualized loan growth □ Up 22.0% in Sales Finance □ Direct Retail up 4.4% □ 7.0% growth in Revolving Credit

Improved Deposit Mix and Cost » Strong organic growth in noninterest - bearing deposits, up 7.8% vs. 2Q13 » Successfully reduced interest - bearing deposit cost to 31 bps during 3Q13 and management expects deposit cost to move below 30 bps in 4Q13 » Management currently expects continued growth in noninterest - bearing deposit balances during 4Q13 Noninterest - bearing deposits $ 34,244 $ 658 7.8% Interest checking 18,826 (450) (9.3) Money market & savings 48,676 536 4.4 Subtotal $ 101,746 $ 744 2.9% Certificates and other time deposits 25,562 (2,472) (35.0) Foreign office deposits – Interest - bearing 640 (307) (128.6) Total deposits $ 127,948 $ (2,035) (6.2)% Average Deposits ($ in millions) 3 Q13 v. 2Q13 Annualized % Increase (Decrease) 3Q13 v. 2Q13 $ Increase (Decrease) 3Q13 Average Balance $128.7 $131.8 $130.4 $130.0 $127.9 0.42% 0.38% 0.36% 0.32% 0.31% 0.20% 0.30% 0.40% 0.50% 0.60% 0.70% $90.0 $100.0 $110.0 $120.0 $130.0 $140.0 3Q12 4Q12 1Q13 2Q13 3Q13 Average Deposits ($ in billions) Total Interest - Bearing Deposit Cost 6
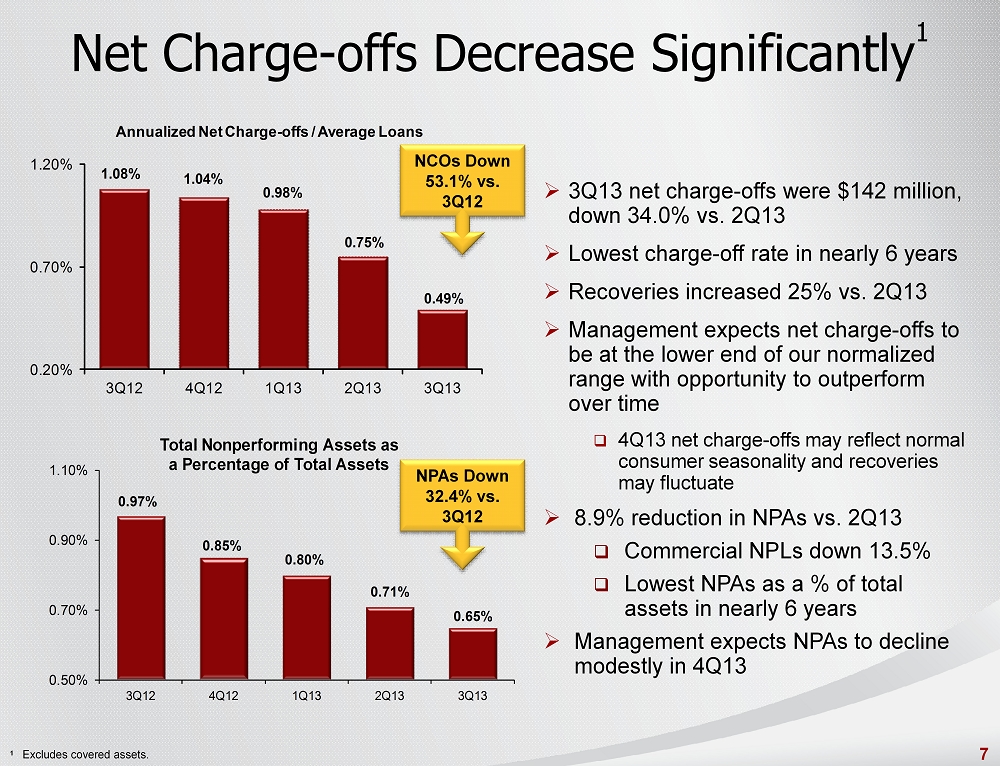
0.97% 0.85% 0.80% 0.71% 0.65% 0.50% 0.70% 0.90% 1.10% 3Q12 4Q12 1Q13 2Q13 3Q13 Total Nonperforming Assets as a Percentage of Total Assets Net Charge - offs Decrease Significantly 1 » 3Q13 net charge - offs were $142 million , down 34.0% vs. 2Q13 » Lowest charge - off rate in nearly 6 years » Recoveries increased 25% vs. 2Q13 » Management expects net charge - offs to be at the lower end of our normalized range with opportunity to outperform over time □ 4Q13 net charge - offs may reflect normal consumer seasonality and recoveries may fluctuate » 8.9% reduction in NPAs vs. 2Q13 □ Commercial NPLs down 13.5% □ Lowest NPAs as a % of total assets in nearly 6 years » Management expects NPAs to decline modestly in 4Q13 1 Excludes covered assets. 1.08% 1.04% 0.98% 0.75% 0.49% 0.20% 0.70% 1.20% 3Q12 4Q12 1Q13 2Q13 3Q13 Annualized Net Charge - offs / Average Loans 7 NCOs Down 53.1% vs. 3Q12 NPAs Down 32.4% vs. 3Q12
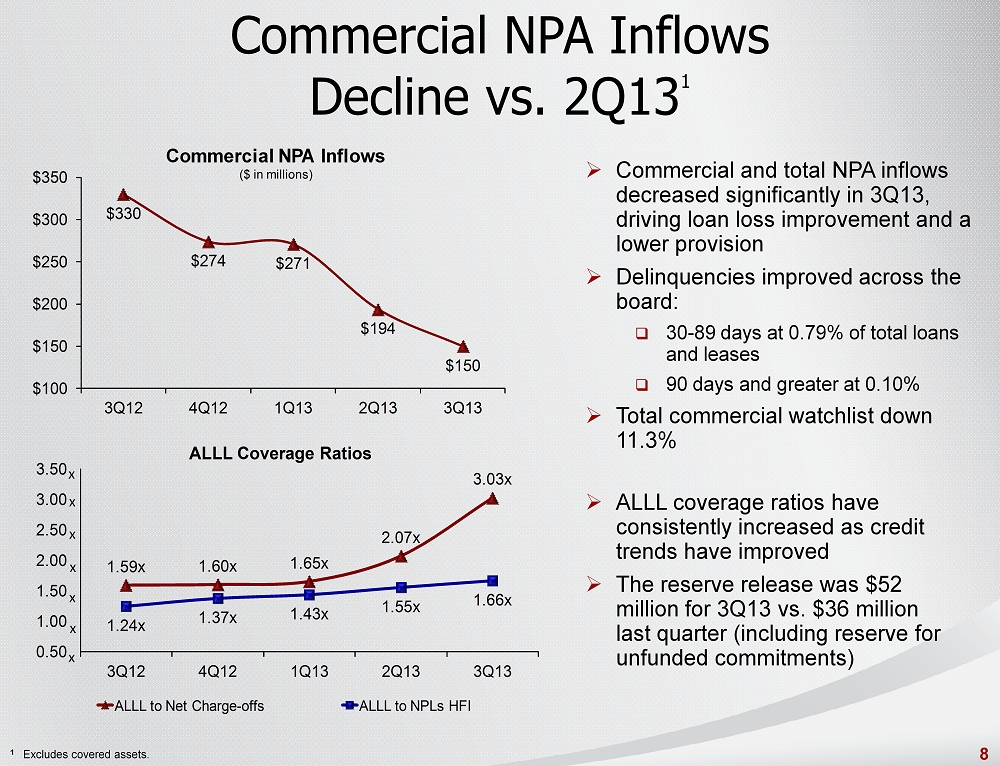
» Commercial and total NPA inflows decreased significantly in 3Q13, driving loan loss improvement and a lower provision » Delinquencies improved across the board: □ 30 - 89 days at 0.79% of total loans and leases □ 90 days and greater at 0.10% » Total c ommercial watchlist down 11.3% Commercial NPA Inflows Decline vs. 2Q13 1 1 Excludes covered assets. $330 $274 $271 $194 $150 $100 $150 $200 $250 $300 $350 3Q12 4Q12 1Q13 2Q13 3Q13 Commercial NPA Inflows ($ in millions) » ALLL coverage ratios have consistently increased as credit trends have improved » The reserve release was $52 million for 3Q13 vs. $36 million last quarter (including reserve for unfunded commitments) 8 1.59x 1.60x 1.65x 2.07x 3.03x 1.24x 1.37x 1.43x 1.55x 1.66x 0.50 1.00 1.50 2.00 2.50 3.00 3.50 3Q12 4Q12 1Q13 2Q13 3Q13 ALLL Coverage Ratios ALLL to Net Charge - offs ALLL to NPLs HFI x x x x x x x
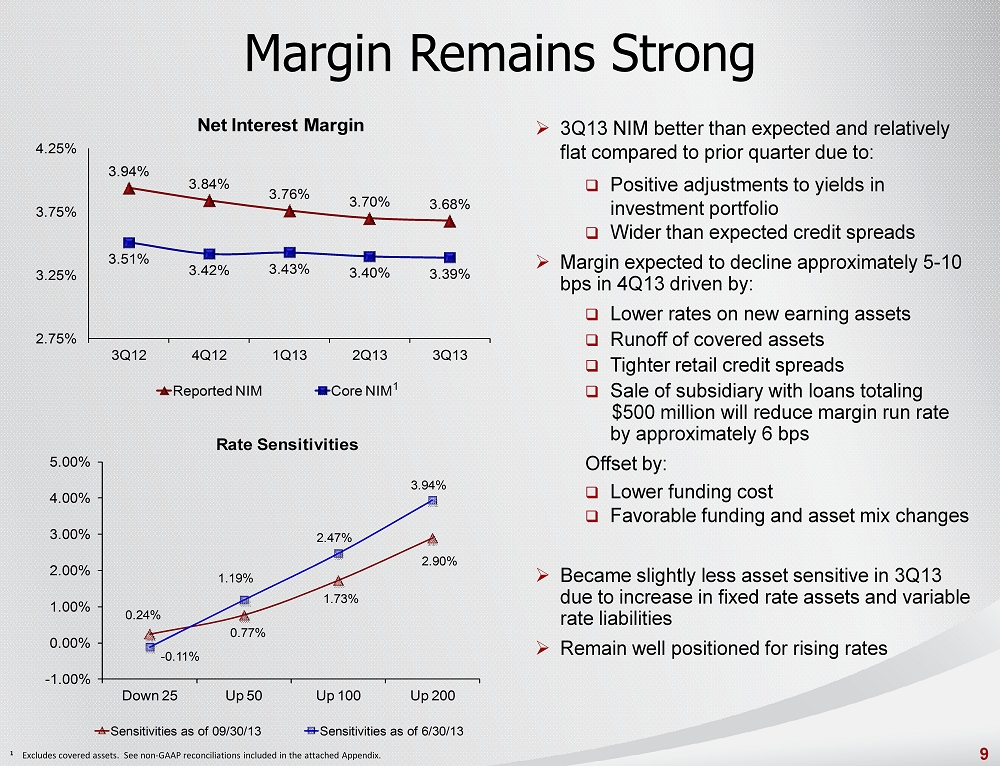
3.94% 3.84% 3.76% 3.70% 3.68% 3.51% 3.42% 3.43% 3.40% 3.39% 2.75% 3.25% 3.75% 4.25% 3Q12 4Q12 1Q13 2Q13 3Q13 Net Interest Margin Reported NIM Core NIM 1 Margin Remains Strong » 3Q13 NIM better than expected and relatively flat compared to prior quarter due to: □ Positive adjustments to yields in investment portfolio □ Wider than expected credit spreads » Margin expected to decline approximately 5 - 10 bps in 4Q13 driven by : □ Lower rates on new earning assets □ Runoff of covered assets □ Tighter retail credit spreads □ Sale of subsidiary with loans totaling $500 million will reduce margin run rate by approximately 6 bps Offset by: □ Lower funding cost □ Favorable funding and asset mix changes » Became slightly less asset sensitive in 3Q13 due to increase in fixed rate assets and variable rate liabilities » Remain well positioned for rising rates 1 Excludes covered assets. See non - GAAP reconciliations included in the attached Appendix. 0.24% 0.77% 1.73% 2.90% - 0.11% 1.19% 2.47% 3.94% - 1.00% 0.00% 1.00% 2.00% 3.00% 4.00% 5.00% Down 25 Up 50 Up 100 Up 200 Rate Sensitivities Sensitivities as of 09/30/13 Sensitivities as of 6/30/13 9

Fee Income Reflects Seasonality 42.4% 44.1% 42.9% 44.6% 41.6% 30.0% 35.0% 40.0% 45.0% 50.0% 3Q12 4Q12 1Q13 2Q13 3Q13 Fee Income Ratio 1 1 Excludes securities gains (losses), the impact of FDIC loss share accounting and other selected items. See non - GAAP reconciliat ions included in the attached Appendix. 2 Linked quarter percentages are annualized. 3Q13 3Q13 v. 2Q13 2 Increase (Decrease) 3Q13 v. 3Q12 Increase (Decrease) Insurance income $ 355 (66.1)% 6.6% Mortgage banking income 117 (120.4) (44.5) Service charges on deposits 152 25.0 7.0 Investment banking and brokerage fees and commissions 89 (40.1) (1.1) Bankcard fees and merchant discounts 67 12.2 8.1 Checkcard fees 51 - 6.3 Trust and investment advisory revenues 51 16.2 10.9 Income from bank - owned life insurance 27 15.3 (10.0) FDIC loss share income, net (74) (51.3) (17.8) Securities gains (losses), net - NM (100.0) Other income 70 (53.9) (23.9) Total noninterest income $ 905 (53.5)% (6.0)% » Insurance income decreased $71 million compared to 2Q13 due to seasonal factors in 3Q13 » Mortgage income declined $51 million vs. 2Q13, reflecting decreases in margins driven by increased competition and lower production » Investment banking and brokerage fees and commissions decreased $10 million primarily due to a decrease in investment banking activity vs. record 2Q13 performance » Other income reflects lower income related to assets for certain post - employment benefits, which is offset in personnel expense Noninterest Income ($ in millions) 10
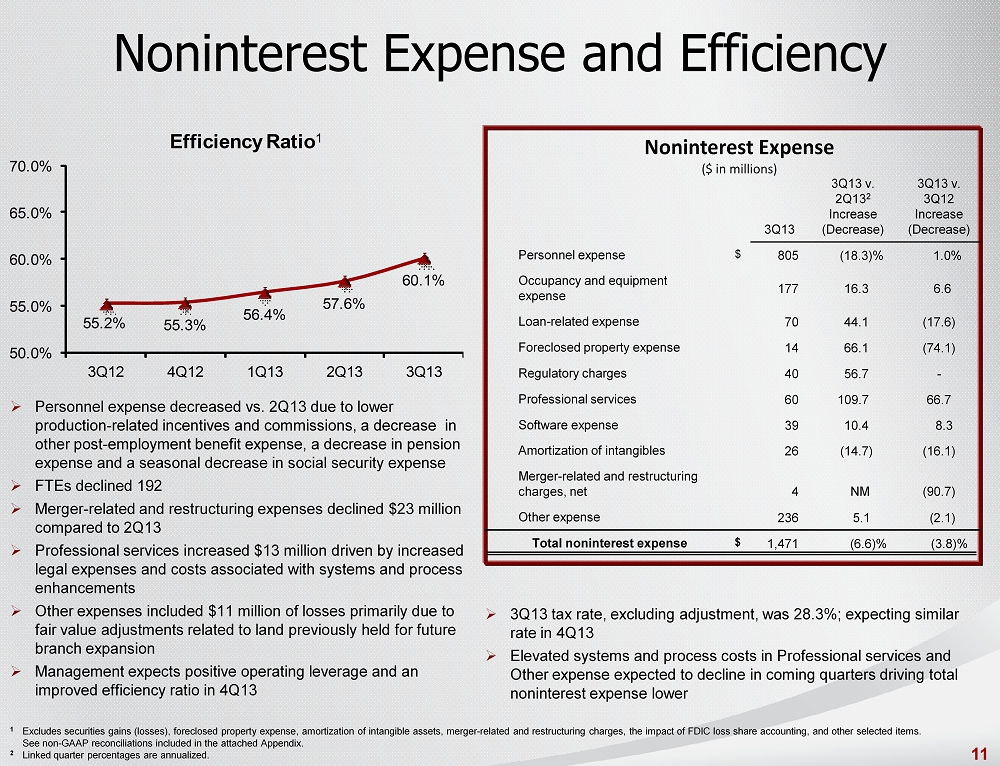
Noninterest Expense and Efficiency 3Q13 3Q13 v. 2Q13 2 Increase (Decrease) 3Q13 v. 3Q12 Increase (Decrease) Personnel expense $ 805 (18.3)% 1.0 % Occupancy and equipment expense 177 16.3 6.6 Loan - related expense 70 44.1 (17.6) Foreclosed property expense 14 66.1 (74.1) Regulatory charges 40 56.7 - Professional services 60 109.7 66.7 Software expense 39 10.4 8.3 Amortization of intangibles 26 (14.7) (16.1) Merger - related and restructuring charges, net 4 NM (90.7) Other expense 236 5.1 (2.1) Total noninterest expense $ 1,471 (6.6)% (3.8)% 1 Excludes securities gains (losses), foreclosed property expense, amortization of intangible assets, merger - related and restructu ring charges, the impact of FDIC loss share accounting, and other selected items. See non - GAAP reconciliations included in the attached Appendix. 2 Linked quarter percentages are annualized. 55.2% 55.3% 56.4% 57.6% 60.1% 50.0% 55.0% 60.0% 65.0% 70.0% 3Q12 4Q12 1Q13 2Q13 3Q13 Efficiency Ratio 1 Noninterest Expense ($ in millions) » Personnel expense decreased vs. 2Q13 due to lower production - related incentives and commissions, a decrease in other post - employment benefit expense, a decrease in pension expense and a seasonal decrease in social security expense » FTEs declined 192 » Merger - related and restructuring expenses declined $23 million compared to 2Q13 » Professional services increased $13 million driven by increased legal expenses and costs associated with systems and process enhancements » Other expenses included $11 million of losses primarily due to fair value adjustments related to land previously held for future branch expansion » Management expects positive operating leverage and an improved efficiency ratio in 4Q13 » 3 Q13 tax rate, excluding adjustment, was 28.3%; expecting similar rate in 4Q13 » Elevated systems and process costs in Professional services and Other expense expected to decline in coming quarters driving total noninterest expense lower 11

Capital Strength 1 8.8% 9.0% 9.1% 9.3% 9.4% 8.0% 9.0% 10.0% 3Q12 4Q12 1Q13 2Q13 3Q13 Basel I Tier 1 Common Ratio 1 Regulatory capital information is preliminary. Risk - weighted assets are determined based on regulatory capital requirements. Un der the regulatory framework for determining risk - weighted assets each asset class is assigned a risk - weighting of 0%, 20%, 50% or 100% based on the underlying risk of the specific asset class. In additio n, off balance sheet exposures are first converted to a balance sheet equivalent amount and subsequently assigned to one of the four risk - weightings. Tier 1 common equity ratio is a non - GAAP measure. BB&T use s the Tier 1 common equity definition used in the SCAP assessment to calculate these ratios. BB&T's management uses these measures to assess the quality of capital and believes that investors m ay find them useful in their analysis of the Corporation. These capital measures are not necessarily comparable to similar capital measures that may be presented by other companies. 2 The Basel III common equity Tier I ratio reflects management’s interpretation of the regulatory requirements. Common equity Tier 1 ratio under Basel III is approximately 9.0% at September 30, 2013 2 12 10.0% 10.5% 10.6% 11.1% 11.3% 9.0% 9.5% 10.0% 10.5% 11.0% 11.5% 12.0% 3Q12 4Q12 1Q13 2Q13 3Q13 Basel I Tier 1 Ratio
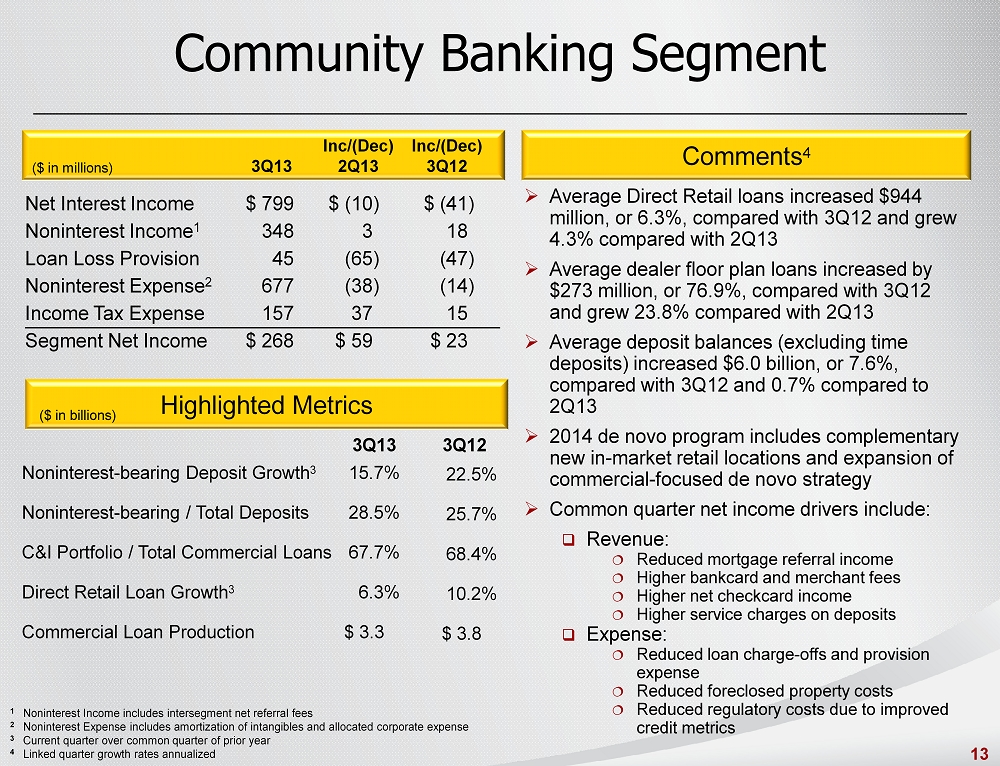
Community Banking Segment Comments 4 Highlighted Metrics 3Q13 3Q12 ($ in millions) Inc/(Dec) 2Q13 Inc/(Dec) 3Q12 3Q13 ($ in billions) Net Interest Income Noninterest Income 1 Loan Loss Provision Noninterest Expense 2 Income Tax Expense Segment Net Income $ (10) 3 (65) (38) 37 $ 59 $ (41) 18 (47) (14) 15 $ 23 Noninterest - bearing Deposit Growth 3 Noninterest - bearing / Total Deposits C&I Portfolio / Total Commercial Loans Direct Retail Loan Growth 3 Commercial Loan Production » Average Direct Retail loans increased $944 million, or 6.3%, compared with 3Q12 and grew 4.3% compared with 2Q13 » Average dealer floor plan loans increased by $273 million, or 76.9%, compared with 3Q12 and grew 23.8% compared with 2Q13 » Average deposit balances (excluding time deposits) increased $6.0 billion, or 7.6%, compared with 3Q12 and 0.7% compared to 2Q13 » 2014 de novo program includes complementary new in - market retail locations and expansion of commercial - focused de novo strategy » Common quarter net income drivers include: □ Revenue: Reduced mortgage referral income Higher bankcard and merchant fees Higher net checkcard income Higher service charges on deposits □ Expense: Reduced loan charge - offs and provision expense Reduced foreclosed property costs Reduced regulatory costs due to improved credit metrics 15.7% 28.5% 67.7% 6.3% $ 3.3 22.5% 25.7% 68.4% 10.2% $ 3.8 1 Noninterest Income includes intersegment net referral fees 2 Noninterest Expense includes amortization of intangibles and allocated corporate expense 3 Current quarter over common quarter of prior year 4 Linked quarter growth rates annualized $ 799 348 45 677 157 $ 268 13
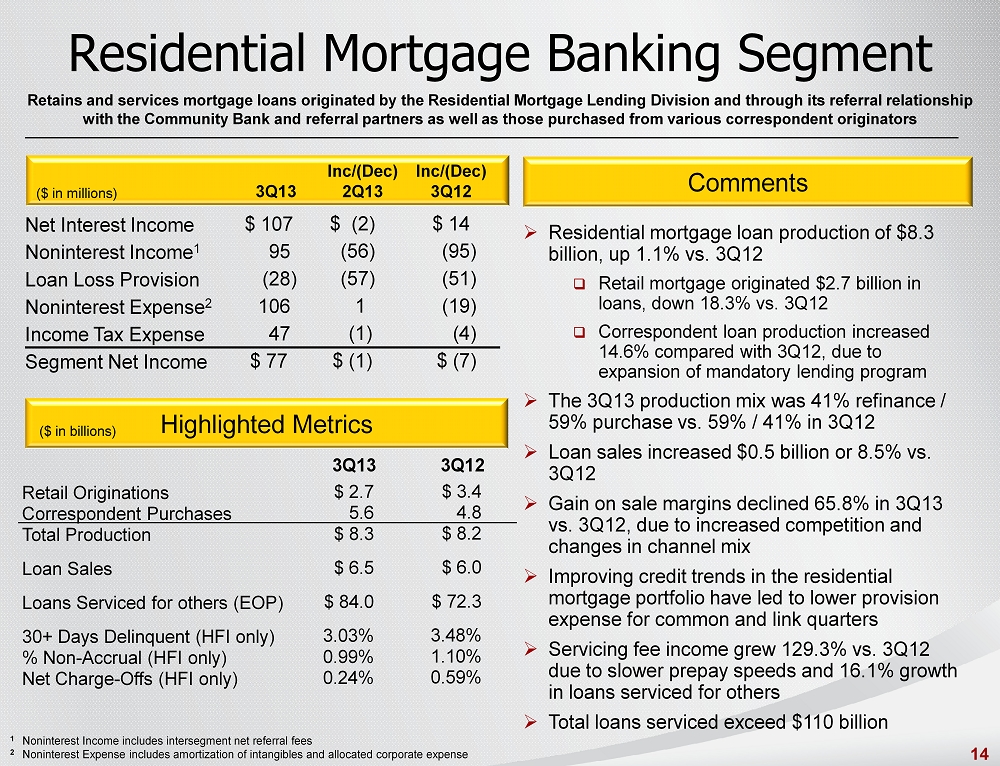
Net Interest Income Noninterest Income 1 Loan Loss Provision Noninterest Expense 2 Income Tax Expense Segment Net Income Retail Originations Correspondent Purchases Total Production Loan Sales Loans Serviced for others (EOP) 30+ Days Delinquent (HFI only) % Non - Accrual (HFI only) Net Charge - Offs (HFI only) Residential Mortgage Banking Segment Retains and services mortgage loans originated by the Residential Mortgage Lending Division and through its referral relation shi p with the Community Bank and referral partners as well as those purchased from various correspondent originators Comments Highlighted Metrics Inc/(Dec) 3Q12 Inc/(Dec) 4Q11 2Q13 1 Noninterest Income includes intersegment net referral fees 2 Noninterest Expense includes amortization of intangibles and allocated corporate expense ($ in billions) 3Q13 3Q12 ($ in millions) Inc/(Dec) 2Q13 Inc/(Dec) 3Q12 3Q13 $ 2.7 5.6 $ 8.3 $ 6.5 $ 84.0 3.03% 0.99% 0.24% » Residential mortgage loan production of $8.3 billion, up 1.1% vs. 3Q12 □ Retail mortgage originated $2.7 billion in loans, down 18.3% vs. 3Q12 □ Correspondent loan production increased 14.6% compared with 3Q12, due to expansion of mandatory lending program » The 3Q13 production mix was 41% refinance / 59% purchase vs. 59% / 41% in 3Q12 » Loan sales increased $0.5 billion or 8.5% vs. 3Q12 » Gain on sale margins declined 65.8% in 3Q13 vs. 3Q12, due to increased competition and changes in channel mix » Improving credit trends in the residential mortgage portfolio have led to lower provision expense for common and link quarters » Servicing fee income grew 129.3% vs. 3Q12 due to slower prepay speeds and 16.1% growth in loans serviced for others » Total loans serviced exceed $110 billion $ 107 95 ( 28) 106 47 $ 77 $ (2) ( 56) (57) 1 (1) $ ( 1) $ 14 (95) ( 51) ( 19) (4) $ ( 7) $ 3.4 4.8 $ 8.2 $ 6.0 $ 72.3 3.48% 1.10% 0.59% 14

Highlighted Metrics Net Interest Income Noninterest Income 1 Loan Loss Provision Noninterest Expense 2 Income Tax Expense Segment Net Income Primarily originates indirect loans to consumers on a prime and nonprime basis for the purchase of automobiles and other vehicles through approved dealers both in BB&T’s market and nationally (through Regional Acceptance Corporation) Dealer Financial Services Segment Comments 3 3Q13 3Q12 1 Noninterest Income includes intersegment net referral fees 2 Noninterest Expense includes amortization of intangibles and allocated corporate expense 3 Linked quarter growth rates annualized except for production ($ in billions) Loan Originations Loan Yield Operating Margin Net Charge - offs ($ in millions) Inc/(Dec) 2Q13 Inc/(Dec) 3Q12 3Q13 $1.6 7.5 % 52.0 % 1.5 % $ 170 1 47 35 34 $ 55 $ 1.2 8.4 % 54.5 % 1.2 % $ (2) - 5 (1) (2) $ (4) $ 4 - 4 2 (1) $ (1) » Dealer Finance continued to generate strong production. YTD loan originations are up 31.3% compared to 2012 and 3Q13 was up 51.5% vs. 3Q12 » Regional Acceptance generated solid loan production in 3Q13 despite intense market competition in the non - prime finance spectrum. 3Q13 production was up 5.9% over 2Q13 aided by acquisitions within its portfolio acquisition group » Regional Acceptance entered two new markets in the third quarter - California and Minnesota with additional expansion planned 15
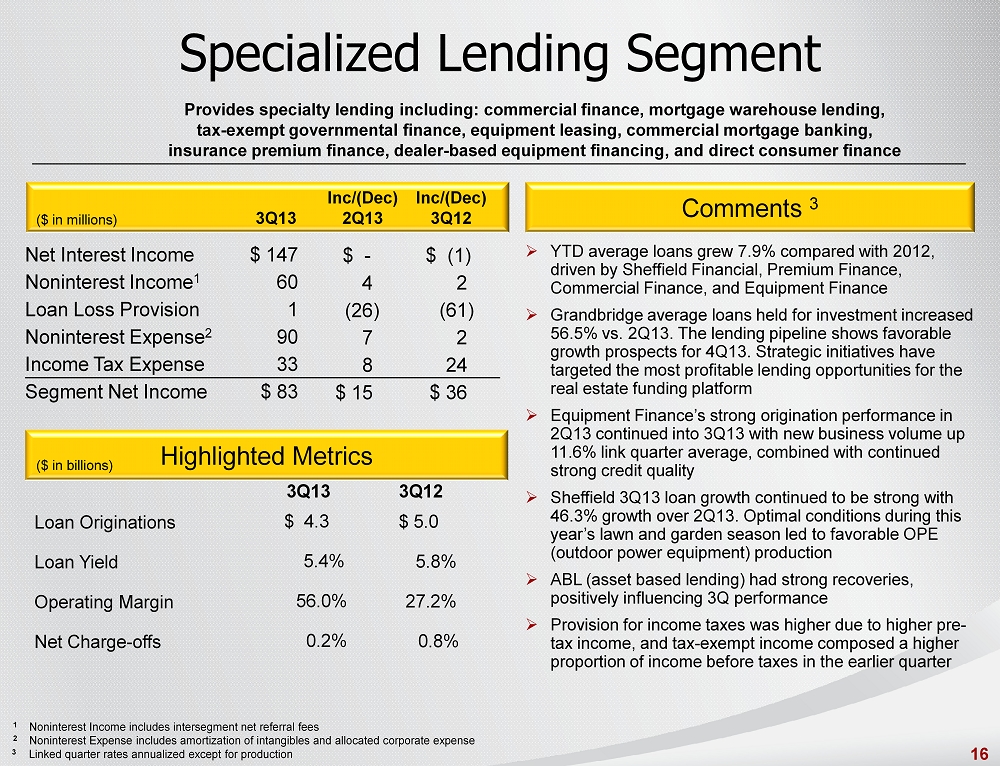
Highlighted Metrics Specialized Lending Segment Provides specialty lending including: commercial finance, mortgage warehouse lending, tax - exempt governmental finance, equipment leasing, commercial mortgage banking, insurance premium finance, dealer - based equipment financing, and direct consumer finance Net Interest Income Noninterest Income 1 Loan Loss Provision Noninterest Expense 2 Income Tax Expense Segment Net Income Loan Originations Loan Yield Operating Margin Net Charge - offs Comments 3 1 Noninterest Income includes intersegment net referral fees 2 Noninterest Expense includes amortization of intangibles and allocated corporate expense 3 Linked quarter rates annualized except for production ($ in billions) ($ in millions) Inc/(Dec) 2Q13 Inc/(Dec) 3Q12 3Q13 3Q13 3Q12 $ 147 60 1 90 33 $ 83 $ - 4 ( 26) 7 8 $ 15 $ ( 1) 2 (61) 2 24 $ 36 » YTD average loans grew 7.9% compared with 2012, driven by Sheffield Financial, Premium Finance, Commercial Finance, and Equipment Finance » Grandbridge average loans held for investment increased 56.5% vs. 2Q13. The lending pipeline shows favorable growth prospects for 4Q13. Strategic initiatives have targeted the most profitable lending opportunities for the real estate funding platform » Equipment Finance’s strong origination performance in 2Q13 continued into 3Q13 with new business volume up 11.6% link quarter average, combined with continued strong credit quality » Sheffield 3Q13 loan growth continued to be strong with 46.3% growth over 2Q13. Optimal conditions during this year’s lawn and garden season led to favorable OPE (outdoor power equipment) production » ABL (asset based lending) had strong recoveries, positively influencing 3Q performance » Provision for income taxes was higher due to higher pre - tax income, and tax - exempt income composed a higher proportion of income before taxes in the earlier quarter $ 5.0 5.8 % 27.2 % 0.8 % $ 4.3 5.4 % 56.0 % 0.2 % 16
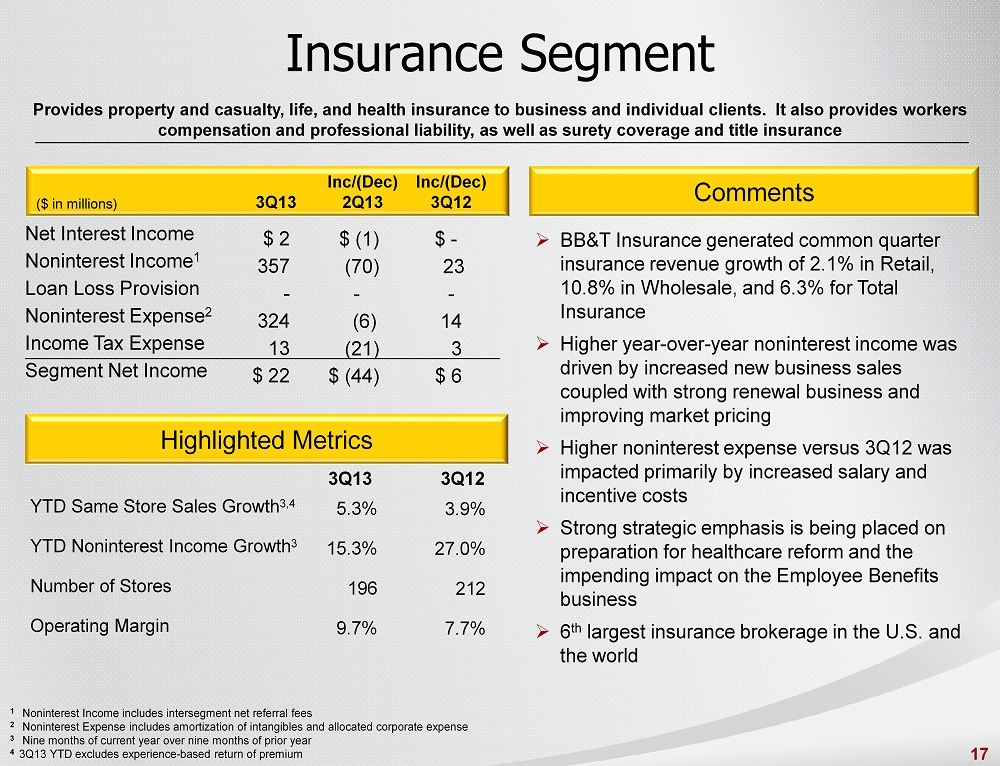
1 Noninterest Income includes intersegment net referral fees 2 Noninterest Expense includes amortization of intangibles and allocated corporate expense 3 Nine months of current year over nine months of prior year 4 3Q13 YTD excludes experience - based return of premium Insurance Segment Comments Net Interest Income Noninterest Income 1 Loan Loss Provision Noninterest Expense 2 Income Tax Expense Segment Net Income YTD Same Store Sales Growth 3,4 YTD Noninterest Income Growth 3 Number of Stores Operating Margin Provides property and casualty, life, and health insurance to business and individual clients. It also provides workers compensation and professional liability, as well as surety coverage and title insurance Highlighted Metrics ($ in millions) Inc/(Dec) 2Q13 Inc/(Dec) 3Q12 3Q13 3Q13 3Q12 5.3% 15.3% 196 9.7% $ 2 357 - 324 13 $ 22 3.9% 27.0% 212 7.7% $ (1) (70) - (6) (21) $ (44) $ - 23 - 14 3 $ 6 » BB&T Insurance generated common quarter insurance revenue growth of 2.1% in Retail, 10.8% in Wholesale, and 6.3% for Total Insurance » Higher year - over - year noninterest income was driven by increased new business sales coupled with strong renewal business and improving market pricing » Higher noninterest expense versus 3Q12 was impacted primarily by increased salary and incentive costs » Strong strategic emphasis is being placed on preparation for healthcare reform and the impending impact on the Employee Benefits business » 6 th largest insurance brokerage in the U.S. and the world 17

Highlighted Metrics Financial Services Segment Comments Average Loan Balances Average Deposits Total Assets Invested Operating Margin Provides trust services, wealth management, investment counseling, asset management , estate planning, employee benefits, corporate banking, and capital market services to individuals, corporations , governments, and other organizations 1 Noninterest Income includes intersegment net referral fees 2 Noninterest Expense includes amortization of intangibles and allocated corporate expense Net Interest Income Noninterest Income 1 Loan Loss Provision Noninterest Expense 2 Income Tax Expense Segment Net Income ($ in millions) Inc/(Dec) 2Q13 Inc/(Dec) 3Q12 3Q13 3Q13 3Q12 » Despite narrowing margins negatively impacting net interest income, volume was driven by: □ Corporate Banking, which generated 22.0% loan growth vs. 3Q12 □ BB&T Wealth, which generated 23.4% loan growth and 9.2% transaction deposit growth vs. 3Q12 » Total assets invested increased to $105.8 billion, representing 11.7% growth vs. 3Q12 » Decrease in noninterest income was driven by lower investment banking & brokerage income » New BB&T Scott & Stringfellow office opened in Naples, FL, their 3 rd new office in FL within the past 12 months » BB&T Wealth was ranked among the top 40 in Barron’s annual listing of top wealth management firms $ 9.0 29.1 105.8 41.6% $ 111 187 (2) 176 47 $ 77 $ 7.4 31.6 94.7 38.1% $ (3) (7) (16) (5) 5 $ 6 $ (8) (4) (15) (3) 2 $ 4 ($ in billions) 18

19

20
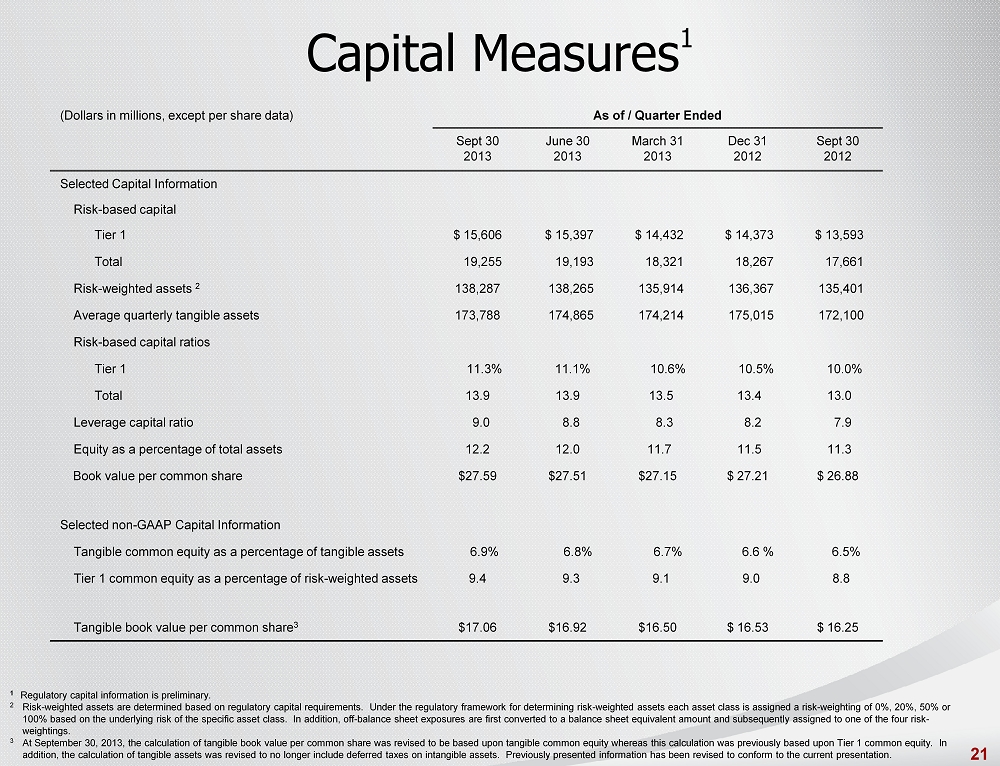
Capital Measures 1 (Dollars in millions, except per share data) As of / Quarter Ended Sept 30 2013 June 30 2013 March 31 2013 Dec 31 2012 Sept 30 2012 Selected Capital Information Risk - based capital Tier 1 $ 15,606 $ 15,397 $ 14,432 $ 14,373 $ 13,593 Total 19,255 19,193 18,321 18,267 17,661 Risk - weighted assets 2 138,287 138,265 135,914 136,367 135,401 Average quarterly tangible assets 173,788 174,865 174,214 175,015 172,100 Risk - based capital ratios Tier 1 11.3% 11.1% 10.6% 10.5% 10.0% Total 13.9 13.9 13.5 13.4 13.0 Leverage capital ratio 9.0 8.8 8.3 8.2 7.9 Equity as a percentage of total assets 12.2 12.0 11.7 11.5 11.3 Book value per common share $27.59 $27.51 $27.15 $ 27.21 $ 26.88 Selected non - GAAP Capital Information Tangible common equity as a percentage of tangible assets 6.9% 6.8% 6.7% 6.6 % 6.5% Tier 1 common equity as a percentage of risk - weighted assets 9.4 9.3 9.1 9.0 8.8 Tangible book value per common share 3 $17.06 $16.92 $16.50 $ 16.53 $ 16.25 1 Regulatory capital information is preliminary. 2 Risk - weighted assets are determined based on regulatory capital requirements. Under the regulatory framework for determining risk - weighted as sets each asset class is assigned a risk - weighting of 0%, 20%, 50% or 100% based on the underlying risk of the specific asset class. In addition, off - balance sheet exposures are first converted to a balance sheet equivalent amount and subsequently assigned to one of the four risk - weightings. 3 At September 30, 2013, the calculation of tangible book value per common share was revised to be based upon tangible common e qui ty whereas this calculation was previously based upon Tier 1 common equity. In addition, the calculation of tangible assets was revised to no longer include deferred taxes on intangible assets. Previousl y p resented information has been revised to conform to the current presentation. 21
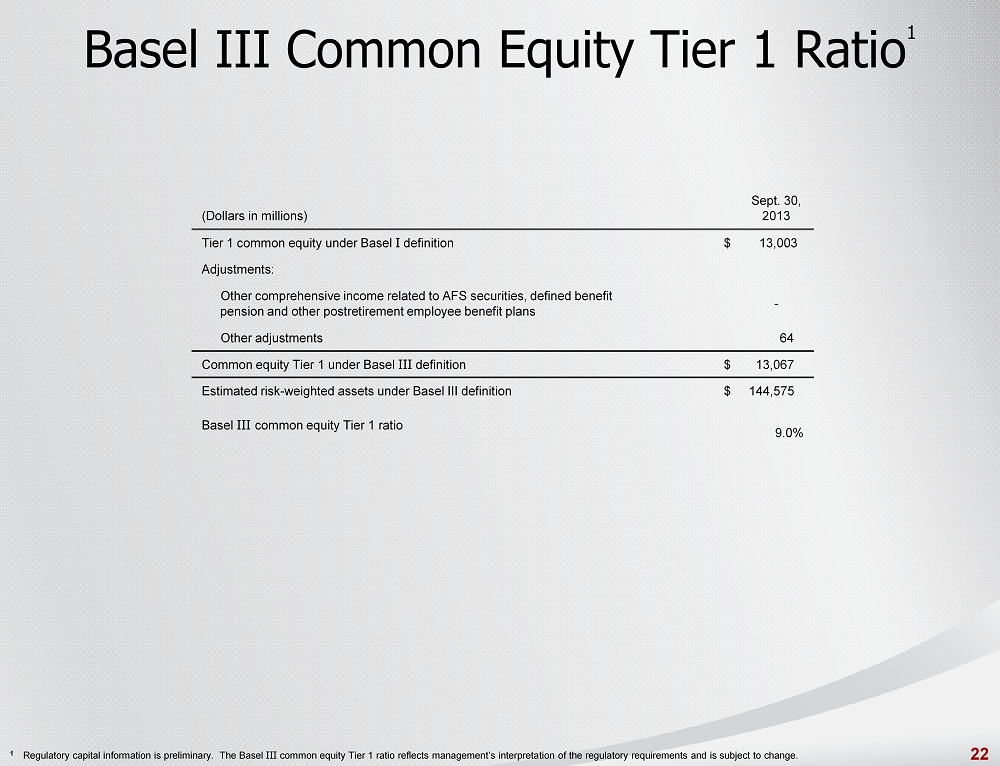
Basel III Common Equity Tier 1 Ratio 1 (Dollars in millions) Sept. 30, 2013 Tier 1 common equity under Basel I definition $ 13,003 Adjustments: Other comprehensive income related to AFS securities, defined benefit pension and other postretirement employee benefit plans - Other adjustments 64 Common equity Tier 1 under Basel III definition $ 13,067 Estimated risk - weighted assets under Basel III definition $ 144,575 Basel III common equity Tier 1 ratio 9.0% 1 Regulatory capital information is preliminary. The Basel III common equity Tier 1 ratio reflects management’s interpretation of the regulatory requirements and is subject to change. 22
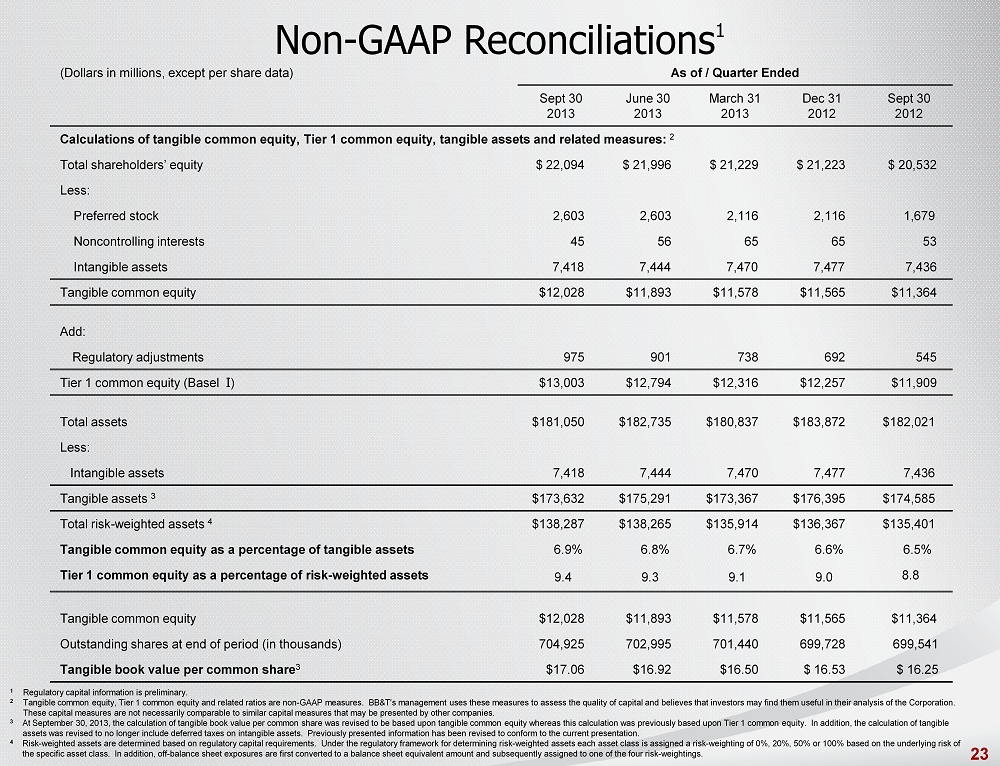
Non - GAAP Reconciliations 1 (Dollars in millions, except per share data) As of / Quarter Ended Sept 30 2013 June 30 2013 March 31 2013 Dec 31 2012 Sept 30 2012 Calculations of tangible common equity, Tier 1 common equity, tangible assets and related measures: 2 Total shareholders’ equity $ 22,094 $ 21,996 $ 21,229 $ 21,223 $ 20,532 Less: Preferred stock 2,603 2,603 2,116 2,116 1,679 Noncontrolling interests 45 56 65 65 53 Intangible assets 7,418 7,444 7,470 7,477 7,436 Tangible common equity $12,028 $11,893 $11,578 $11,565 $11,364 Add: Regulatory adjustments 975 901 738 692 545 Tier 1 common equity (Basel I ) $13,003 $12,794 $12,316 $12,257 $11,909 Total assets $181,050 $182,735 $180,837 $183,872 $182,021 Less: Intangible assets 7,418 7,444 7,470 7,477 7,436 Tangible assets 3 $173,632 $175,291 $173,367 $176,395 $174,585 Total risk - weighted assets 4 $138,287 $138,265 $135,914 $136,367 $135,401 Tangible common equity as a percentage of tangible assets 6.9% 6.8% 6.7% 6.6% 6.5% Tier 1 common equity as a percentage of risk - weighted assets 9.4 9.3 9.1 9.0 8.8 Tangible common equity $12,028 $11,893 $11,578 $11,565 $11,364 Outstanding shares at end of period (in thousands) 704,925 702,995 701,440 699,728 699,541 Tangible book value per common share 3 $17.06 $16.92 $16.50 $ 16.53 $ 16.25 1 Regulatory capital information is preliminary. 2 Tangible common equity, Tier 1 common equity and related ratios are non - GAAP measures. BB&T's management uses these measures to assess the quality of capital and believes that investors may find them useful in their analysis of the Corporation. These capital measures are not necessarily comparable to similar capital measures that may be presented by other companies. 3 At September 30, 2013, the calculation of tangible book value per common share was revised to be based upon tangible common e qui ty whereas this calculation was previously based upon Tier 1 common equity. In addition, the calculation of tangible assets was revised to no longer include deferred taxes on intangible assets. Previously presented information has been revis ed to conform to the current presentation. 4 Risk - weighted assets are determined based on regulatory capital requirements. Under the regulatory framework for determining ri sk - weighted assets each asset class is assigned a risk - weighting of 0%, 20%, 50% or 100% based on the underlying risk of the specific asset class. In addition, off - balance sheet exposures are first converted to a balance sheet equivalent amount and subsequently assigned to one of the four risk - weightings. 23

Non - GAAP Reconciliations Applicable ratios are annualized. 1 Excludes mortgage loans guaranteed by GNMA that BB&T does not have the obligation to repurchase. 2 Excludes mortgage loans guaranteed by the government. As of / Quarter Ended Sept 30 2013 June 30 2013 March 31 2013 Dec 31 2012 Sept 30 2012 Asset Quality Ratios (including amounts related to covered loans and covered foreclosed property) Loans 30 - 89 days past due and still accruing as a percentage of total loans and leases 1,2 0.87% 0.88% 0.91% 1.02% 1.02% Loans 90 days or more past due and still accruing as a percentage of total loans and leases 1,2 0.41 0.44 0.43 0.52 0.53 Nonperforming loans and leases as a percentage of total loans and leases 0.87 0.97 1.09 1.17 1.31 Nonperforming assets as a percentage of: Total assets 0.72 0.80 0.91 0.97 1.10 Loans and leases plus foreclosed property 1.10 1.23 1.39 1.51 1.70 Net charge - offs as a percentage of average loans and leases 0.48 0.74 1.00 1.02 1.05 Allowance for loan and lease losses as a percentage of loans and leases held for investment 1.59 1.64 1.73 1.76 1.80 Ratio of allowance for loan and lease losses to: Net charge - offs 3.22 X 2.18 X 1.69 X 1.69 X 1.69 X Nonperforming loans and leases held for investment 1.78 1.66 1.54 1.46 1.33 24
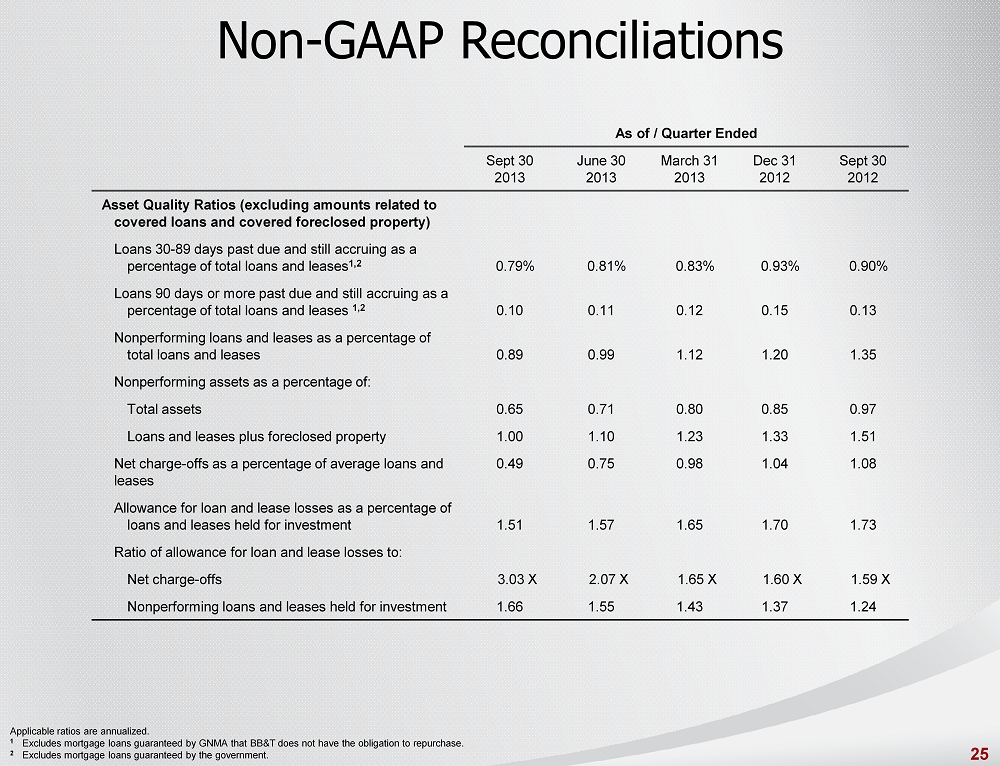
Non - GAAP Reconciliations Applicable ratios are annualized. 1 Excludes mortgage loans guaranteed by GNMA that BB&T does not have the obligation to repurchase. 2 Excludes mortgage loans guaranteed by the government. As of / Quarter Ended Sept 30 2013 June 30 2013 March 31 2013 Dec 31 2012 Sept 30 2012 Asset Quality Ratios (excluding amounts related to covered loans and covered foreclosed property) Loans 30 - 89 days past due and still accruing as a percentage of total loans and leases 1,2 0.79% 0.81% 0.83% 0.93% 0.90% Loans 90 days or more past due and still accruing as a percentage of total loans and leases 1,2 0.10 0.11 0.12 0.15 0.13 Nonperforming loans and leases as a percentage of total loans and leases 0.89 0.99 1.12 1.20 1.35 Nonperforming assets as a percentage of: Total assets 0.65 0.71 0.80 0.85 0.97 Loans and leases plus foreclosed property 1.00 1.10 1.23 1.33 1.51 Net charge - offs as a percentage of average loans and leases 0.49 0.75 0.98 1.04 1.08 Allowance for loan and lease losses as a percentage of loans and leases held for investment 1.51 1.57 1.65 1.70 1.73 Ratio of allowance for loan and lease losses to: Net charge - offs 3.03 X 2.07 X 1.65 X 1.60 X 1.59 X Nonperforming loans and leases held for investment 1.66 1.55 1.43 1.37 1.24 25
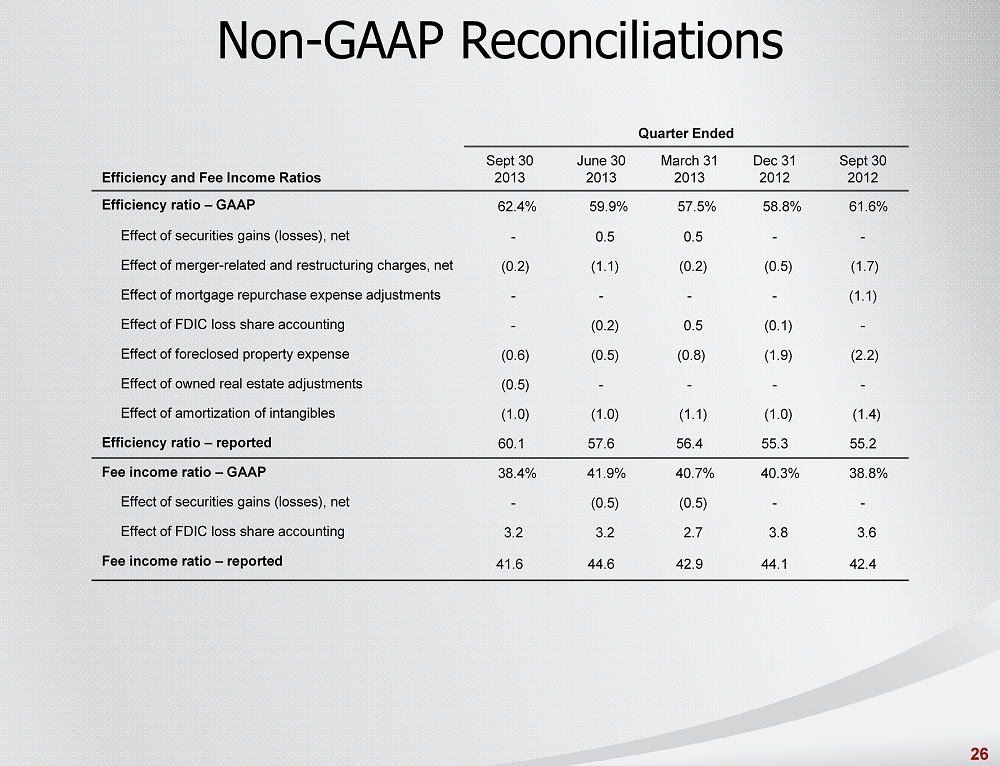
Non - GAAP Reconciliations Quarter Ended Efficiency and Fee Income Ratios Sept 30 2013 June 30 2013 March 31 2013 Dec 31 2012 Sept 30 2012 Efficiency ratio – GAAP 62.4% 59.9% 57.5% 58.8% 61.6% Effect of securities gains (losses), net - 0.5 0.5 - - Effect of merger - related and restructuring charges, net (0.2) (1.1) (0.2) (0.5) (1.7) Effect of mortgage repurchase expense adjustments - - - - (1.1) Effect of FDIC loss share accounting - (0.2) 0.5 (0.1) - Effect of foreclosed property expense (0.6) (0.5) (0.8) (1.9) (2.2) Effect of owned real estate adjustments (0.5) - - - - Effect of amortization of intangibles (1.0) (1.0) (1.1) (1.0) (1.4) Efficiency ratio – reported 60.1 57.6 56.4 55.3 55.2 Fee income ratio – GAAP 38.4% 41.9% 40.7% 40.3% 38.8% Effect of securities gains (losses), net - (0.5) (0.5) - - Effect of FDIC loss share accounting 3.2 3.2 2.7 3.8 3.6 Fee income ratio – reported 41.6 44.6 42.9 44.1 42.4 26

Non - GAAP Reconciliations (Dollars in millions) Quarter Ended Sept 30 June 30 March 31 Dec 31 Sept 30 Return on Average Tangible Common Shareholders' Equity 2013 2013 2013 2012 2012 Net income available to common shareholders $ 268 $ 547 $ 210 $ 506 $ 469 Plus: Amortization of intangibles, net of tax 16 17 17 17 19 Tangible net income available to common shareholders $ 284 $ 564 $ 227 $ 523 $ 488 Average common shareholders' equity $ 19,491 $ 19,293 $ 19,138 $ 19,160 $ 18,757 Less: Average intangible assets 7,431 7,456 7,464 7,463 7,341 Average tangible common shareholders' equity $ 12,060 $ 11,837 $ 11,674 $ 11,697 $ 11,416 Return on average tangible common shareholders' equity 9.33 % 19.12 % 7.87 % 17.80 % 17.01 % 27
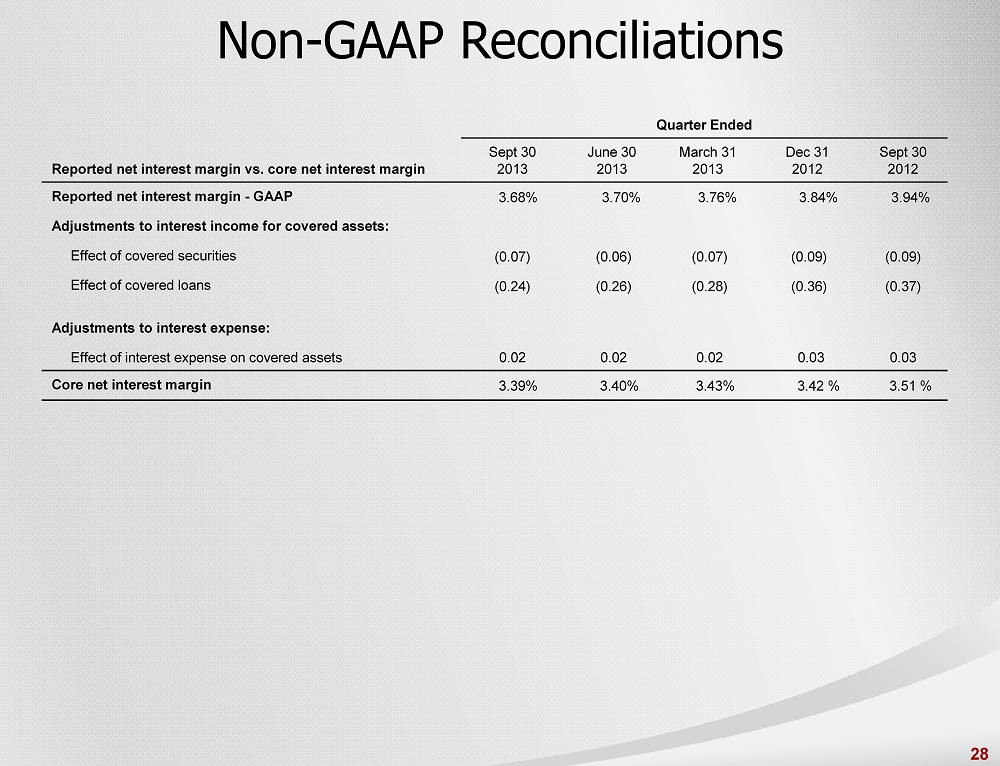
Non - GAAP Reconciliations Quarter Ended Reported net interest margin vs. core net interest margin Sept 30 2013 June 30 2013 March 31 2013 Dec 31 2012 Sept 30 2012 Reported net interest margin - GAAP 3.68% 3.70% 3.76% 3.84% 3.94% Adjustments to interest income for covered assets: Effect of covered securities (0.07) (0.06) (0.07) (0.09) (0.09) Effect of covered loans (0.24) (0.26) (0.28) (0.36) (0.37) Adjustments to interest expense: Effect of interest expense on covered assets 0.02 0.02 0.02 0.03 0.03 Core net interest margin 3.39% 3.40% 3.43% 3.42 % 3.51 % 28
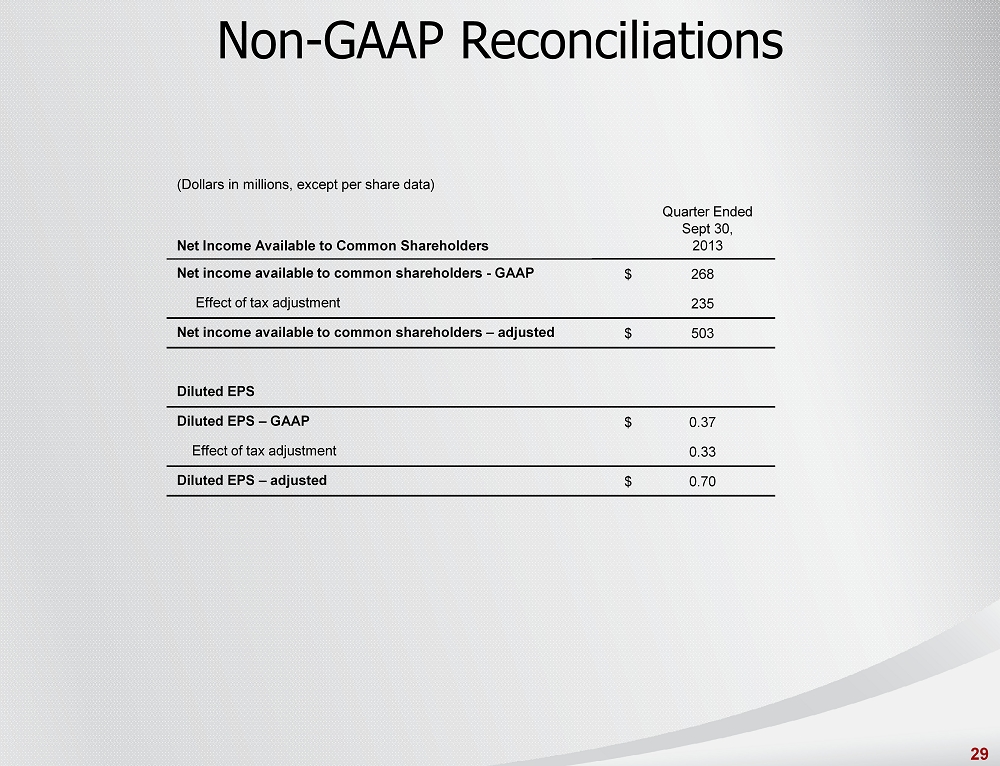
Non - GAAP Reconciliations (Dollars in millions, except per share data) Net Income Available to Common Shareholders Quarter Ended Sept 30, 2013 Net income available to common shareholders - GAAP $ 268 Effect of tax adjustment 235 Net income available to common shareholders – adjusted $ 503 Diluted EPS Diluted EPS – GAAP $ 0.37 Effect of tax adjustment 0.33 Diluted EPS – adjusted $ 0.70 29