Exhibit 99.3

Forward - Looking Information This presentation contains “forward - looking statements” within the meaning of the Private Securities Litigation Reform Act of 19 95, regarding the financial condition, results of operations, business plans and the future performance of BB&T that are based on the beliefs and assumptions of the management of BB&T and the information available to management at the time th at these disclosures were prepared. Words such as “anticipates,” “believes,” “estimates,” “expects,” “forecasts,” “intends,” “plans,” “projects,” “may,” “will,” “should,” “could,” and other similar expressions are intended to identify thes e f orward - looking statements. Such statements are subject to factors that could cause actual results to differ materially from anticipated results. Such factors include, but are not limited to, the following: general economic or business conditions, either nationally or regionally, may be less favorable than expected, resulting in, amo ng other things, a deterioration in credit quality and/or a reduced demand for credit, insurance or other services; disruptions to the credit and financial markets, either nationally or globally, including the impact of a downgrade of U.S. g ove rnment obligations by one of the credit ratings agencies and the adverse effects of recessionary conditions in Europe; changes in the interest rate environment and cash flow reassessments may reduce NIM and/or the volumes and values of loans ma de or held as well as the value of other financial assets held; competitive pressures among depository and other financial institutions may increase significantly; legislative, regulatory or accounting changes, including changes resulting from the adoption and implementation of the Dodd - Fran k Act may adversely affect the businesses in which BB&T is engaged; local, state or federal taxing authorities may take tax positions that are adverse to BB&T; a reduction may occur in BB&T’s credit ratings; adverse changes may occur in the securities markets; competitors of BB&T may have greater financial resources and develop products that enable them to compete more successfully t han BB&T and may be subject to different regulatory standards than BB&T; natural or other disasters could have an adverse effect on BB&T in that such events could materially disrupt BB&T’s operation s o r the ability or willingness of BB&T’s customers to access the financial services BB&T offers; costs or difficulties related to the integration of the businesses of BB&T and its merger partners may be greater than expect ed; expected cost savings or revenue growth associated with completed mergers and acquisitions may not be fully realized or reali zed within the expected time frames; significant litigation could have a material adverse effect on BB&T; deposit attrition, customer loss and/or revenue loss following completed mergers and acquisitions may be greater than expecte d ; cyber - security risks, including “denial of service,” “hacking” and “identity theft,” could adversely affect our business and fin ancial performance, or our reputation; and, failure to implement part or all of the Company’s new ERP system could result in impairment charges that adversely impact BB& T’s financial condition and results of operations and could result in significant additional costs to BB&T Readers are cautioned not to place undue reliance on these forward - looking statements, which speak only as of the date of this r eport. Actual results may differ materially from those expressed in or implied by any forward - looking statement. Except to the extent required by applicable law or regulation, BB&T undertakes no obligation to revise or update publicly any forwar d - l ooking statements for any reason. Non - GAAP Information This presentation contains financial information and performance measures determined by methods other than in accordance with ac counting principles generally accepted in the United States of America (“GAAP”). BB&T’s management uses these “non - GAAP” measures in their analysis of the Corporation’s performance and the efficiency of its operations. Management believes that these non - GAAP measures provide a greater understanding of ongoing operations and enhance comparability of results with prior periods as well as demonstrating the effects of significant gains and charges in the current period. The c omp any believes that a meaningful analysis of its financial performance requires an understanding of the factors underlying that performance. BB&T’s management believes that investors may use these non - GAAP financial measures to analyze financial performanc e without the impact of unusual items that may obscure trends in the company’s underlying performance. These disclosures should not be viewed as a substitute for financial measures determined in accordance with GAAP, nor are they nece ssa rily comparable to non - GAAP performance measures that may be presented by other companies. Below is a listing of the types of non - GAAP measures used in this presentation: Tangible common equity, Tier 1 common equity and related ratios are non - GAAP measures. The return on average risk - weighted asset s is a non - GAAP measure. The Basel III common equity Tier I ratio reflects management’s interpretation of the regulatory requirements, which is subject to change. BB&T's management uses these measures to assess th e q uality of capital and believes that investors may find them useful in their analysis of the Corporation. Asset quality ratios have been adjusted to remove the impact of acquired loans and foreclosed property covered by FDIC loss s har ing agreements from the numerator and denominator of these ratios. Management believes that their inclusion may result in distortion of these ratios such that they might not be comparable to other periods presented or to other portfolios that were not impacted by purchase accounting. Fee income and efficiency ratios are non - GAAP in that they exclude securities gains (losses), foreclosed property expense, amort ization of intangible assets, merger - related and restructuring charges, the impact of FDIC loss share accounting and other selected items. BB&T’s management uses these measures in their analysis of the Corporation’s perfo rma nce. Adjusted non - interest expenses exclude loss on early extinguishment of debt, FHA - insured mortgage loan reserve adjustment, mortgage loan indemnification reserve adjustment and owned real estate and related adj ustments and is a Non - GAAP measure. BB&T’s management believes these measures provide a greater understanding of ongoing operations and enhance comparability of results with prior periods, as well as demonstrating th e effects of significant gains and charges. Return on average tangible common shareholders’ equity (“ROTCE”), is a non - GAAP measure that calculates the return on average common shareholders’ equity without the impact of intangible assets and their related amortization . ROTCE is also presented excluding the impact of certain adjustments and is also a non - GAAP measure. These measures are useful for evaluating the performance of a business consistently, whether acquired or developed internally. Core net interest margin is a non - GAAP measure that adjusts net interest margin to exclude the impact of interest income and fun ding costs associated with loans and securities acquired in the Colonial acquisition. BB&T’s management believes that the exclusion of the generally higher yielding assets acquired in the Colonial acquisition from the cal culation of net interest margin provides investors with useful information related to the relative performance of the remainder of BB&T’s earning assets. Adjusted net charge - offs, the adjusted ratio of net charge - offs to average loans and the allowance to adjusted net charge - offs ratio are non - GAAP measures that adjust net charge - offs to exclude the impact of a process change that resulted in accelerated recognition of charge - offs in the non - prime automobile lending portfolio during the quarter ended March 31, 2014 and net charge - offs associated with certain loan sales during the quarter ended September 30, 2014. BB&T’s management believes these adjustments increase comparability of period - to - period results and believes that investors may find them useful in their analysis of the Corporation . Diluted EPS and the effective tax rate have been adjusted to exclude the impact of certain adjustments. BB&T’s management be lie ves these adjustments increase comparability of period - to - period results and uses these measures to assess performance and believes investors may find them useful in their analysis of the Corporation. A reconciliation of these non - GAAP measures to the most directly comparable GAAP measure is included in BB&T’s Third Quarter 2014 Quarterly Performance Summary, which is available on BB&T’s website at www.bbt.com.

3 3 Earnings Highlights Loans Loan Sale FHLB Extinguishment Strategic Announcements ▪ Net income 2 totaled $520 million vs. $268 million 3 in 3Q13 ▪ Diluted EPS was $0.71, compared with $0.37 3 in 3Q13 ▪ Earnings reduced by $0.01 due to merger - related and restructuring charges ▪ Average loans grew 4.9% vs. 2Q14, led by C&I, CRE, Direct retail, Sales finance, and Other lending subsidiaries 1 Linked quarter growth rates are annualized, except credit metrics 2 Available to common shareholders 3 3Q13 results were reduced by tax - related reserve adjustments that totaled $235 million, or $0.33 per diluted share. 2014 Third Quarter Performance Highlights 1 ▪ BB&T sold approximately $550 million in loans, primarily TDRs, recording a $42 million gain reflected as a reduction in the provision for credit losses ▪ The transaction resulted in net charge - offs of $15 million ▪ Will reduce regulatory and servicing costs going forward ▪ Extinguished $1.1 billion of FHLB advances costing 4.15% on average and incurred a $122 million pre - tax loss ▪ Replaced with less expensive shorter - term funding ▪ Announced agreement to acquire 41 branches and $2.3 billion in deposits in Texas from Citibank ▪ Announced agreement to acquire The Bank of Kentucky, with $1.9 billion in assets and 32 branches in northern Kentucky/Cincinnati MSA

4 4 Pre - Tax After Tax Diluted EPS Impact Gain on loan sale $ 42 $ 26 $ 0.04 Loss on early extinguishment of debt $ (122) $ (76) $ (0.11) Income tax adjustment N/A $ 50 $ 0.07 Merger - related and restructuring charges $ (7) $ (4) $ (0.01) Selected Items Affecting Earnings ($ in millions, except per share impact)
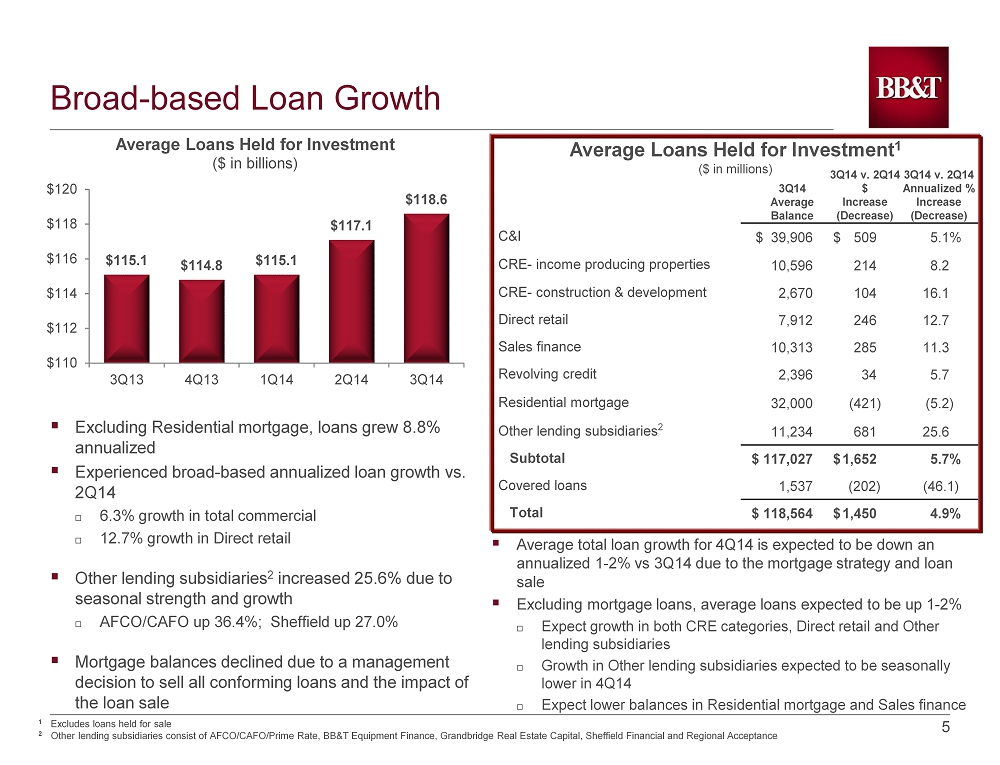
5 5 Broad - based Loan Growth ▪ Average total loan growth for 4Q14 is expected to be down an annualized 1 - 2% vs 3Q14 due to the mortgage strategy and loan sale ▪ Excluding mortgage loans, average loans expected to be up 1 - 2% Expect growth in both CRE categories, Direct retail and Other lending subsidiaries Growth in Other lending subsidiaries expected to be seasonally lower in 4Q14 Expect lower balances in Residential mortgage and Sales finance ▪ Excluding Residential mortgage, loans grew 8.8% annualized ▪ Experienced broad - based annualized loan growth vs. 2Q14 6.3% growth in total commercial 12.7% growth in Direct retail ▪ Other lending subsidiaries 2 increased 25.6% due to seasonal strength and growth AFCO/CAFO up 36.4%; Sheffield up 27.0% ▪ Mortgage balances declined due to a management decision to sell all conforming loans and the impact of the loan sale $115.1 $114.8 $115.1 $117.1 $118.6 $110 $112 $114 $116 $118 $120 3Q13 4Q13 1Q14 2Q14 3Q14 Average Loans Held for Investment ($ in billions) Average Loans Held for Investment 1 ($ in millions) C&I $ 39,906 $ 509 5.1% CRE - income producing properties 10,596 214 8.2 CRE - construction & development 2,670 104 16.1 Direct retail 7,912 246 12.7 Sales finance 10,313 285 11.3 Revolving credit 2,396 34 5.7 Residential mortgage 32,000 (421) (5.2) Other lending subsidiaries 2 11,234 681 25.6 Subtotal $ 117,027 $ 1,652 5.7% Covered loans 1,537 (202) (46.1) Total $ 118,564 $ 1,450 4.9% 3 Q14 Average Balance 3 Q14 v. 2 Q14 $ Increase (Decrease) 3Q14 v. 2Q14 Annualized % Increase (Decrease) 1 Excludes loans held for sale 2 Other l ending s ubsidiaries consist of AFCO/CAFO/Prime Rate, BB&T Equipment Finance, Grandbridge Real Estate Capital, Sheffield Financial and Regional Acceptance

6 6 Improved Deposit Mix and Cost $127.9 $125.9 $125.7 $129.6 $130.6 0.31% 0.28% 0.27% 0.26% 0.26% 0.20% 0.30% 0.40% $90.0 $100.0 $110.0 $120.0 $130.0 $140.0 3Q13 4Q13 1Q14 2Q14 3Q14 Total Interest-Bearing Deposit Cost Average Total Deposits ($ in billions) ▪ Strong DDA growth of 15.9% annualized vs. 2Q14 ▪ Personal, business and public funds DDA growth totaled 13.8%, 11.8% and 19.3% respectively vs. 3Q13 ▪ Average DDA mix was 29.2% in 3Q14 vs. 26.8% in 3Q13 ▪ Added $1.2 billion in deposits through Texas branch acquisition in June 2014 $34.2 $35.3 $35.4 $36.6 $38.1 $30.0 $32.0 $34.0 $36.0 $38.0 $40.0 3Q13 4Q13 1Q14 2Q14 3Q14 Average Noninterest - Bearing Deposits ($ in billions) Average Deposits ($ in millions) Noninterest - bearing deposits $ 38,103 $ 1,469 15.9% Interest checking 18,588 182 3.9 Money market & savings 49,974 1,009 8.2 Subtotal $ 106,665 $ 2,660 10.1% Time deposits and IRAs 23,304 (1,706) (27.1) Foreign office deposits – Interest - bearing 639 55 37.4 Total deposits $ 130,608 $ 1,009 3.1% 3Q14 Average Balance 3Q14 v. 2Q14 $ Increase (Decrease) 3Q14 v. 2Q14 Annualized % Increase (Decrease)
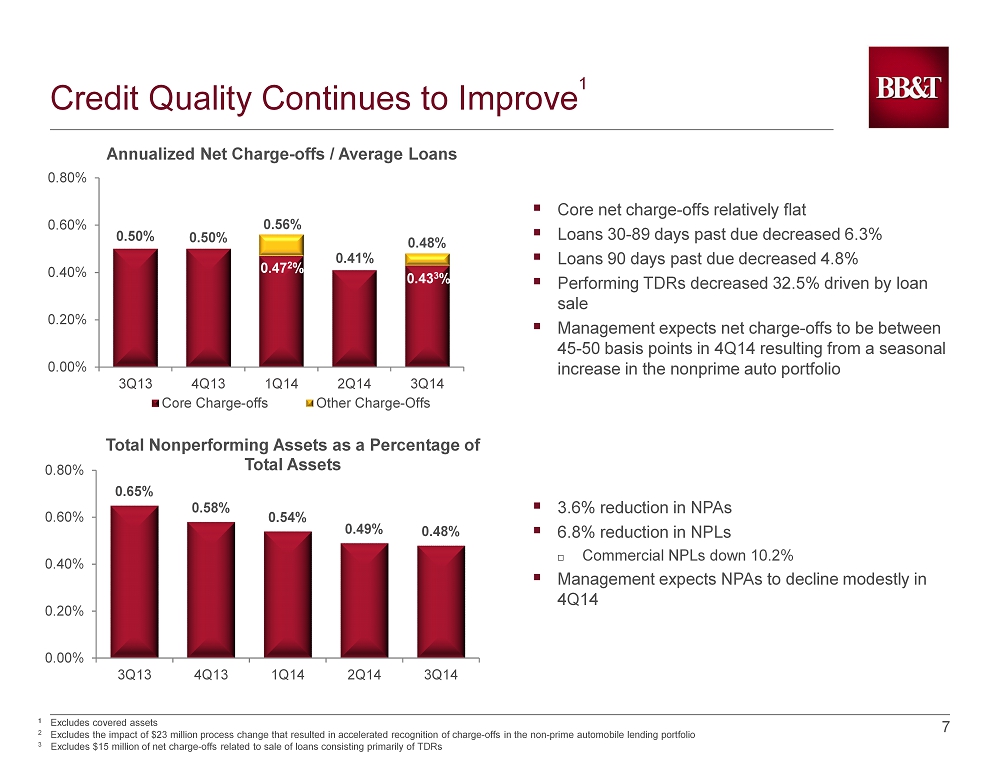
7 7 Credit Quality Continues to Improve 1 0.50% 0.50% 0.41% 0.47 2 % 0.43 3 % 0.56% 0.48% 0.00% 0.20% 0.40% 0.60% 0.80% 3Q13 4Q13 1Q14 2Q14 3Q14 Annualized Net Charge - offs / Average Loans Core Charge-offs Other Charge-Offs ▪ Core net charge - offs relatively flat ▪ Loans 30 - 89 days past due decreased 6.3% ▪ Loans 90 days past due decreased 4.8% ▪ Performing TDRs decreased 32.5% driven by loan sale ▪ Management expects net charge - offs to be between 45 - 50 basis points in 4Q14 resulting from a seasonal increase in the nonprime auto portfolio ▪ 3.6% reduction in NPAs ▪ 6.8% reduction in NPLs Commercial NPLs down 10.2% ▪ Management expects NPAs to decline modestly in 4Q14 0.65% 0.58% 0.54% 0.49% 0.48% 0.00% 0.20% 0.40% 0.60% 0.80% 3Q13 4Q13 1Q14 2Q14 3Q14 Total Nonperforming Assets as a Percentage of Total Assets 1 Excludes covered assets 2 Excludes the impact of $23 million process change that resulted in accelerated recognition of charge - offs in the non - prime auto mobile lending portfolio 3 Excludes $15 million of net charge - offs related to sale of loans consisting primarily of TDRs

8 8 Allowance Coverage Ratios Remain Strong 1 ▪ Coverage ratios remain strong at 2.84x and 1.82x for the allowance to net charge - offs and NPLs, respectively ▪ The ALLL release was $17 million for 3Q14 compared to $39 million in 2Q14 ▪ Management anticipates no further ALLL releases in future quarters 3.03x 2.88x 2.83x 3.19x 2.84x 1.66x 1.73x 1.70x 1.78x 1.82x 1.00 2.00 3.00 4.00 5.00 3Q13 4Q13 1Q14 2Q14 3Q14 ALLL to Net Charge-offs ALLL to NPLs HFI ALLL Coverage Ratios 2 1 Excludes covered assets, the reserve for unfunded lending commitments and the reduction in provision expense related to the loan sale 2 Excludes $15 million of net charge - offs recorded in connection with the mortgage loan sale in the quarter ended September 30, 2014 and $23 million of net charge - offs related to Regional Acceptance Corporation for the quarter ended March 31, 2014
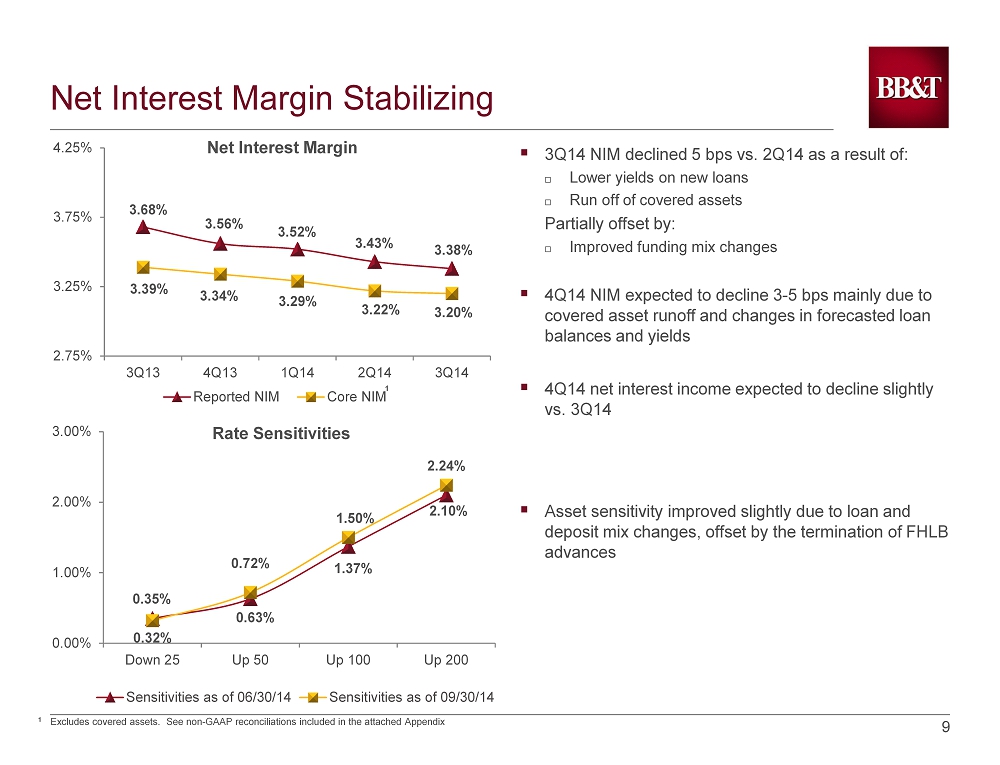
9 9 Net Interest Margin Stabilizing 3.68% 3.56% 3.52% 3.43% 3.38% 3.39% 3.34% 3.29% 3.22% 3.20% 2.75% 3.25% 3.75% 4.25% 3Q13 4Q13 1Q14 2Q14 3Q14 Reported NIM Core NIM ▪ 3Q14 NIM declined 5 bps vs. 2Q14 as a result of: Lower yields on new loans Run off of covered assets Partially offset by: Improved funding mix changes ▪ 4Q14 NIM expected to decline 3 - 5 bps mainly due to covered asset runoff and changes in forecasted loan balances and yields ▪ 4 Q14 net interest income expected to decline slightly vs. 3Q14 ▪ Asset sensitivity improved slightly due to loan and deposit mix changes, offset by the termination of FHLB advances Net Interest Margin 0.35% 0.63% 1.37% 2.10 % 0.32% 0.72% 1.50% 2.24% 0.00% 1.00% 2.00% 3.00% Down 25 Up 50 Up 100 Up 200 Sensitivities as of 06/30/14 Sensitivities as of 09/30/14 Rate Sensitivities 1 Excludes covered assets. See non - GAAP reconciliations included in the attached Appendix 1
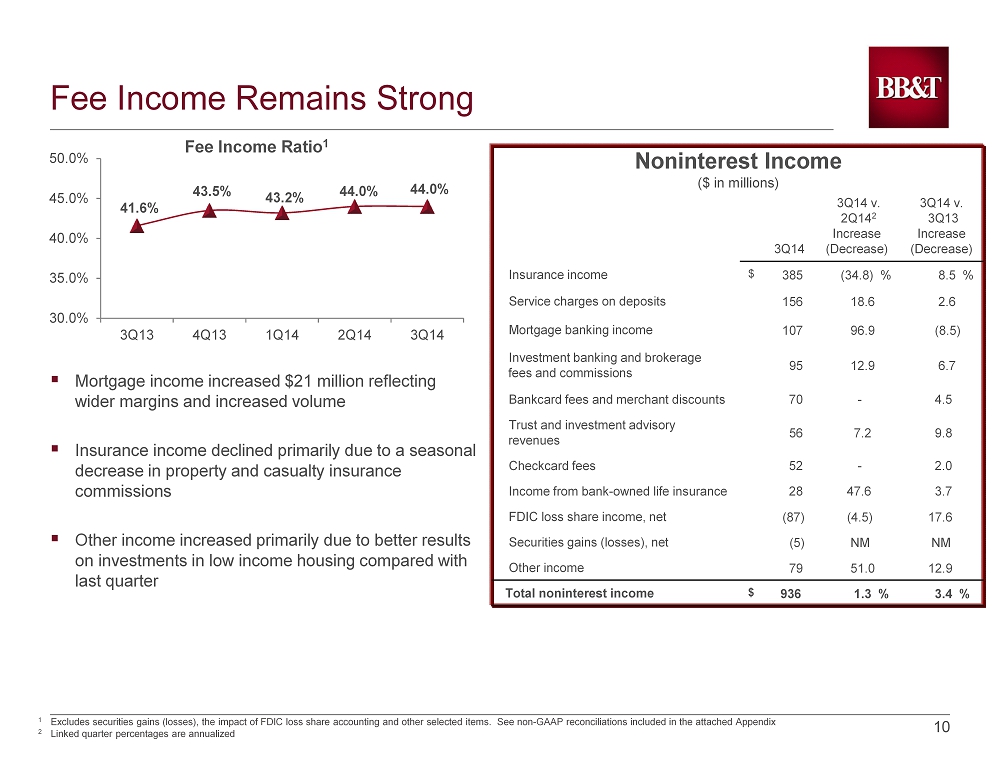
10 10 Fee Income Remains Strong ▪ Mortgage income increased $21 million reflecting wider margins and increased volume ▪ Insurance income declined primarily due to a seasonal decrease in property and casualty insurance commissions ▪ Other income increased primarily due to better results on investments in low income housing compared with last quarter 41.6% 43.5% 43.2% 44.0% 44.0% 30.0% 35.0% 40.0% 45.0% 50.0% 3Q13 4Q13 1Q14 2Q14 3Q14 Fee Income Ratio 1 3Q14 3Q14 v. 2Q14 2 Increase (Decrease) 3Q14 v. 3Q13 Increase (Decrease) Insurance income $ 385 (34.8) % 8.5 % Service charges on deposits 156 18.6 2.6 Mortgage banking income 107 96.9 (8.5) Investment banking and brokerage fees and commissions 95 12.9 6.7 Bankcard fees and merchant discounts 70 - 4.5 Trust and investment advisory revenues 56 7.2 9.8 Checkcard fees 52 - 2.0 Income from bank - owned life insurance 28 47.6 3.7 FDIC loss share income, net (87) (4.5) 17.6 Securities gains (losses), net (5) NM NM Other income 79 51.0 12.9 Total noninterest income $ 936 1.3 % 3.4 % Noninterest Income ($ in millions) 1 Excludes securities gains (losses), the impact of FDIC loss share accounting and other selected items. See non - GAAP reconcilia tions included in the attached Appendix 2 Linked quarter percentages are annualized
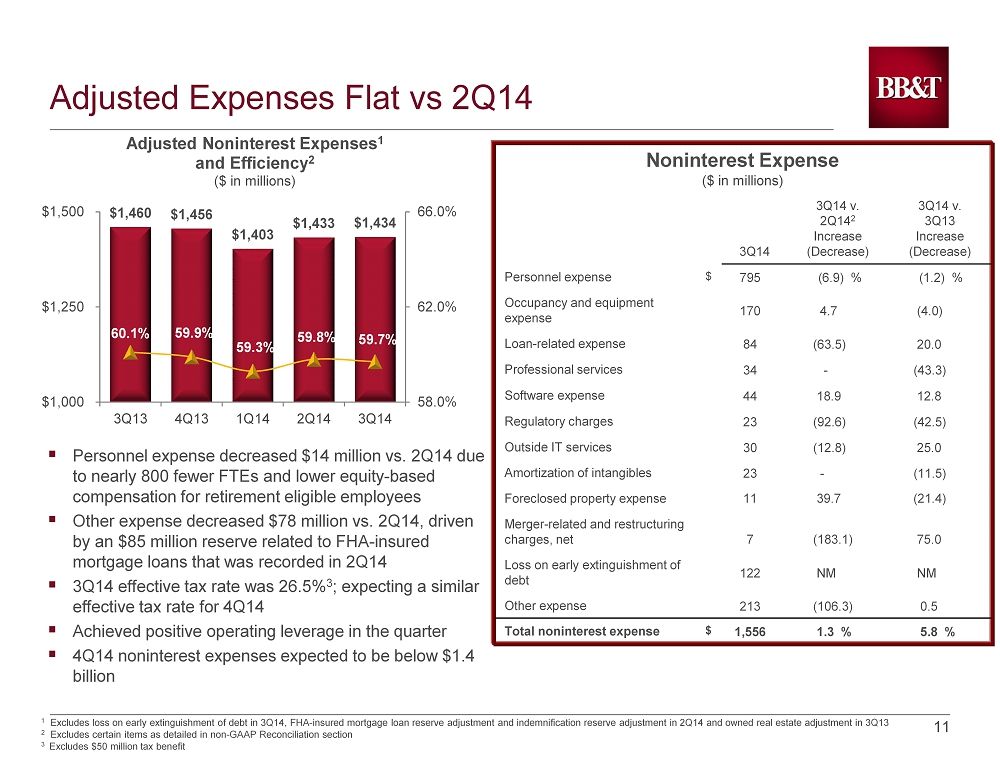
11 11 Adjusted Expenses Flat vs 2Q14 ▪ Personnel expense decreased $14 million vs. 2Q14 due to nearly 800 fewer FTEs and lower equity - based compensation for retirement eligible employees ▪ Other expense decreased $78 million vs. 2Q14, driven by an $85 million reserve related to FHA - insured mortgage loans that was recorded in 2Q14 ▪ 3Q14 effective tax rate was 26.5% 3 ; expecting a similar effective tax rate for 4 Q14 ▪ Achieved positive operating leverage in the quarter ▪ 4Q14 noninterest expenses expected to be below $1.4 billion 3Q14 3Q14 v. 2Q14 2 Increase (Decrease) 3Q14 v. 3Q13 Increase (Decrease) Personnel expense $ 795 (6.9) % (1.2) % Occupancy and equipment expense 170 4.7 (4.0) Loan - related expense 84 (63.5) 20.0 Professional services 34 - (43.3) Software expense 44 18.9 12.8 Regulatory charges 23 (92.6) (42.5) Outside IT services 30 (12.8) 25.0 Amortization of intangibles 23 - (11.5) Foreclosed property expense 11 39.7 (21.4) Merger - related and restructuring charges, net 7 (183.1) 75.0 Loss on early extinguishment of debt 122 NM NM Other expense 213 (106.3) 0.5 Total noninterest expense $ 1,556 1.3 % 5.8 % Noninterest Expense ($ in millions) 1 Excludes loss on early extinguishment of debt in 3Q14, FHA - insured mortgage loan reserve adjustment and indemnification reserv e adjustment in 2Q14 and owned real estate adjustment in 3Q13 2 Excludes certain items as detailed in non - GAAP Reconciliation section 3 Excludes $50 million tax benefit $1,460 $1,456 $1,403 $1,433 $1,434 60.1% 59.9% 59.3% 59.8% 59.7% 58.0% 62.0% 66.0% $1,000 $1,250 $1,500 3Q13 4Q13 1Q14 2Q14 3Q14 Adjusted Noninterest Expenses 1 and Efficiency 2 ($ in millions)
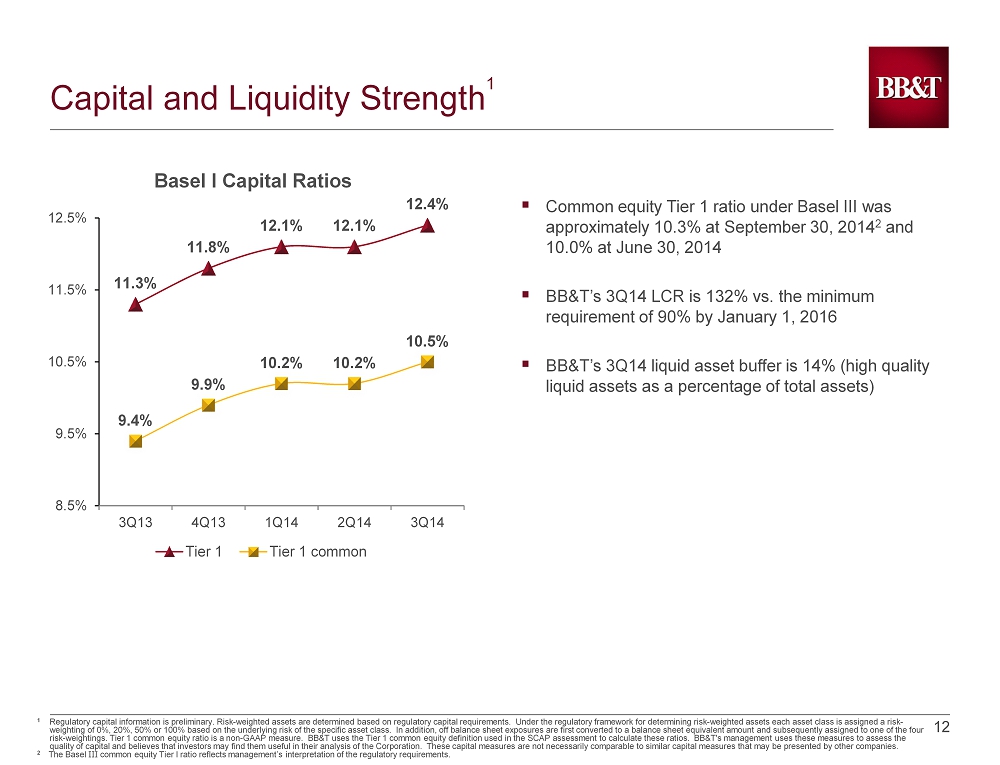
12 12 Capital and Liquidity Strength 1 11.3% 11.8% 12.1% 12.1% 12.4% 9.4% 9.9% 10.2% 10.2% 10.5% 8.5% 9.5% 10.5% 11.5% 12.5% 3Q13 4Q13 1Q14 2Q14 3Q14 Basel I Capital Ratios Tier 1 Tier 1 common ▪ Common equity Tier 1 ratio under Basel III was approximately 10.3% at September 30, 2014 2 and 10.0% at June 30, 2014 ▪ BB&T’s 3Q14 LCR is 132% vs. the minimum requirement of 90% by January 1, 2016 ▪ BB&T’s 3Q14 liquid asset buffer is 14% (high quality liquid assets as a percentage of total assets) 1 Regulatory capital information is preliminary. Risk - weighted assets are determined based on regulatory capital requirements. Un der the regulatory framework for determining risk - weighted assets each asset class is assigned a risk - weighting of 0%, 20%, 50% or 100% based on the underlying risk of the specific asset class. In addition, off balance sheet e xpo sures are first converted to a balance sheet equivalent amount and subsequently assigned to one of the four risk - weightings. Tier 1 common equity ratio is a non - GAAP measure. BB&T uses the Tier 1 common equity definition used in the SC AP assessment to calculate these ratios. BB&T's management uses these measures to assess the quality of capital and believes that investors may find them useful in their analysis of the Corporation. These capital meas ure s are not necessarily comparable to similar capital measures that may be presented by other companies. 2 The Basel III common equity Tier I ratio reflects management’s interpretation of the regulatory requirements.
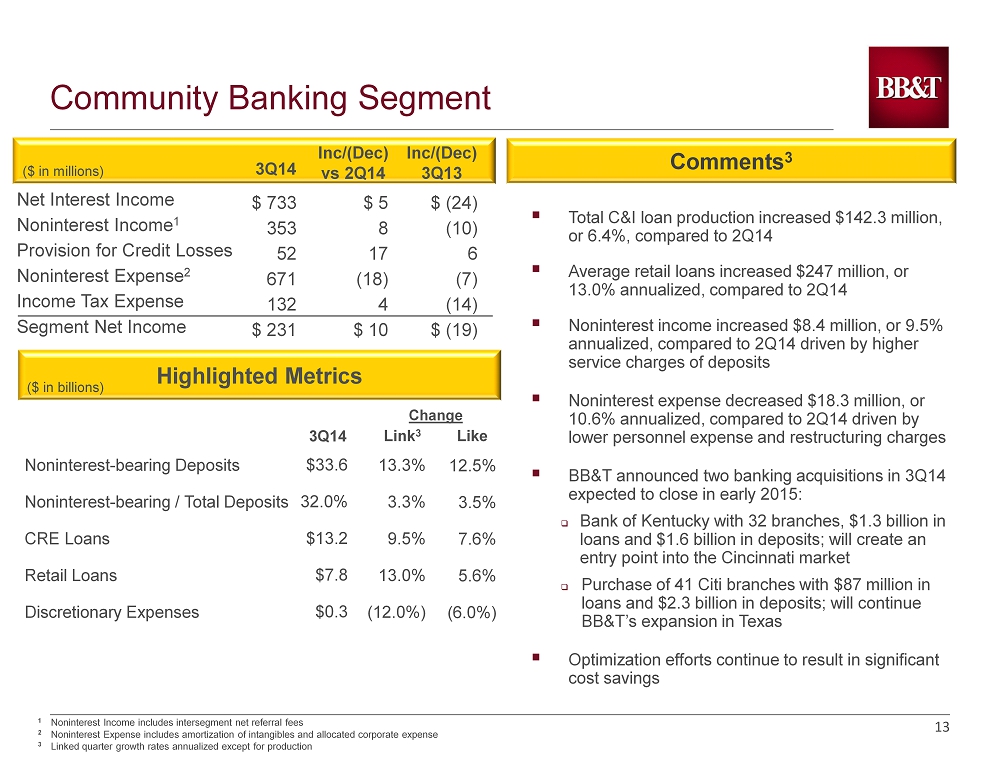
13 13 ▪ Total C&I loan production increased $142.3 million, or 6.4%, compared to 2Q14 ▪ Average retail loans increased $247 million, or 13.0% annualized, compared to 2Q14 ▪ Noninterest income increased $8.4 million, or 9.5% annualized, compared to 2Q14 driven by higher service charges of deposits ▪ Noninterest expense decreased $18.3 million, or 1 0.6% annualized, compared to 2Q14 driven by lower personnel expense and restructuring charges ▪ BB&T announced two banking acquisitions in 3Q14 expected to close in early 2015: □ Bank of Kentucky with 32 branches, $1.3 billion in loans and $1.6 billion in deposits; will create an entry point into the Cincinnati market □ Purchase of 41 Citi branches with $87 million in loans and $2.3 billion in deposits; will continue BB&T’s expansion in Texas ▪ Optimization efforts continue to result in significant cost savings ($ in millions) Inc/(Dec) vs 2Q14 Inc/(Dec) 3Q13 3Q14 Comments 3 Net Interest Income Noninterest Income 1 Provision for Credit Losses Noninterest Expense 2 Income Tax Expense Segment Net Income Highlighted Metrics $ 733 353 52 671 132 $ 231 $ 5 8 17 (18) 4 $ 10 $ (24) (10) 6 (7) (14) $ (19) ($ in billions) 1 Noninterest Income includes intersegment net referral fees 2 Noninterest Expense includes amortization of intangibles and allocated corporate expense 3 Linked quarter growth rates annualized except for production 3Q14 Like Noninterest - bearing Deposits Noninterest - bearing / Total Deposits CRE Loans Retail Loans Discretionary Expenses $33.6 32.0% $13.2 $7.8 $0.3 12.5% 3.5% 7.6% 5.6% (6.0%) Link 3 13.3% 3.3% 9.5% 13.0% (12.0%) Change Community Banking Segment

14 14 Retains and services mortgage loans originated by the Residential Mortgage Lending Division and through its referral relation shi p with the Community Bank and referral partners as well as those purchased from various correspondent originators ($ in millions) Inc /(Dec) vs 2Q14 Inc/(Dec) 3 Q13 3 Q14 Comments 4 Net Interest Income Noninterest Income 1 Provision for Credit Losses Noninterest Expense 2 Income Tax Expense Segment Net Income Highlighted Metrics Retail Originations Correspondent Purchases Total Production Loan Sales Loans Serviced for others (EOP) 3 Q14 Like $ 126 82 (48) 128 48 $ 80 $ 1 14 (47) (99) 60 $ 101 $ (24) (13) (19) 15 (13) $ (20) ▪ Gain on sale margins increased from 0.95% in 2Q14 to 1.10% in 3 Q14 due to stronger retail mix ▪ The 3Q14 and 2Q14 production mix was 71% purchase / 29% refinance ▪ Net servicing fees grew 53.8% vs. 2Q14 and 19.4% vs. 3Q13 due to growth in loans serviced for others and slower prepay speeds ▪ Credit quality remained strong with: □ 30+ day delinquency of 3.58% □ Non - accruals of 0.94% □ Net charge - offs of 0.40% of Loans HFI ▪ Approximately $550 million of loans (primarily performing TDRs) were sold in 3Q14 with an allowance release of $42 million ($ in billions) 1 Noninterest Income includes intersegment net referral fees 2 Noninterest Expense includes amortization of intangibles and allocated corporate expense 3 Highlighted Metrics do not include operating statistics for loans transferred from Community Banking in 1Q14 4 Linked quarter growth annualized except for production and sales Link 4 $2.0 3.0 $5.0 $3.7 $89.9 4.4% 7.3% 6.1% 20.2% 6.0% (26.5%) (46.6%) (40.0%) (42.9%) 7.0% Change Residential Mortgage Banking Segment
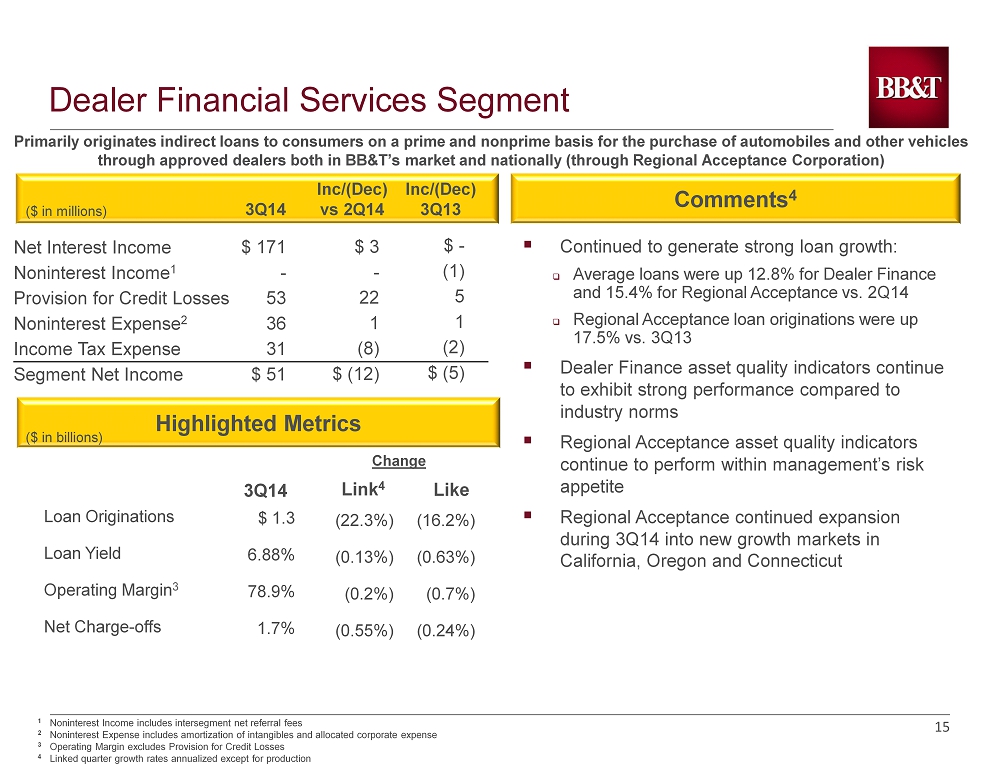
15 15 ▪ C ontinued to generate strong loan growth: □ Average loans were up 12.8% for Dealer Finance and 15.4% for Regional Acceptance vs. 2Q14 □ Regional Acceptance loan originations were up 17.5% vs. 3Q13 ▪ Dealer Finance asset quality indicators continue to exhibit strong performance compared to industry norms ▪ Regional Acceptance asset quality indicators continue to perform within management’s risk appetite ▪ Regional Acceptance continued expansion during 3Q14 into new growth markets in California, Oregon and Connecticut Primarily originates indirect loans to consumers on a prime and nonprime basis for the purchase of automobiles and other vehi cle s through approved dealers both in BB&T’s market and nationally (through Regional Acceptance Corporation) Comments 4 ($ in millions) Inc /(Dec) vs 2Q14 Inc /(Dec) 3Q13 3Q14 Net Interest Income Noninterest Income 1 Provision for Credit Losses Noninterest Expense 2 Income Tax Expense Segment Net Income Highlighted Metrics 3Q14 Like $ 171 - 53 36 31 $ 51 $ 3 - 22 1 (8) $ (12) $ - (1) 5 1 (2) $ (5) Loan Originations Loan Yield Operating Margin 3 Net Charge - offs $ 1.3 6.88% 78.9% 1.7% (16.2%) (0.63%) (0.7%) (0.24%) 1 Noninterest Income includes intersegment net referral fees 2 Noninterest Expense includes amortization of intangibles and allocated corporate expense 3 Operating Margin excludes Provision for Credit Losses 4 Linked quarter growth rates annualized except for production ($ in billions) Link 4 (22.3%) (0.13%) (0.2%) (0.55%) Change Dealer Financial Services Segment

16 16 Provides specialty lending including: commercial finance, mortgage warehouse lending, tax - exempt governmental finance, equipment leasing, commercial mortgage banking, insurance premium finance, dealer - based equipment financing, and direct consumer finance Comments 4 ($ in millions) Inc/(Dec) vs 2Q14 Inc /(Dec) 3Q13 3Q14 Net Interest Income Noninterest Income 1 Provision for Credit Losses Noninterest Expense 2 Income Tax Expense Segment Net Income Highlighted Metrics 3 Q14 Like $ 111 63 4 72 27 $ 71 $ 2 12 (9) 4 8 $ 11 $ (37) 5 3 (18) (6) $ (11) ($ in billions) Loan Originations Loan Yield Operating Margin 3 Net Charge - offs $ 4.3 4.45% 58.6% 0.22% 1.5% (0.96%) 2.3% (0.03%) ▪ Grandbridge’s average LHI increased 98.8% annualized vs. 2Q14 and 36.4% vs. 3Q13 □ A new portfolio product introduced in 2014 has generated $310 million in originations since April ▪ Strong commercial mortgage activity drove linked quarter noninterest income growth ▪ Grandbridge continued to implement their long - term growth plan, opening a new branch in Denver, CO ▪ Amid increased competition, Sheffield Financial’s loan growth continues to be solid: □ Average loans increased 27.0% annualized vs. 2Q14 and 15.2% vs. 3Q13 1 Noninterest Income includes intersegment net referral fees 2 Noninterest Expense includes amortization of intangibles and allocated corporate expense 3 Operating Margin excludes Provision for Credit Losses 4 Linked quarter growth rates annualized 2.9% (0.15)% 1.1% (0.07%) Link 4 Change Specialized Lending Segment
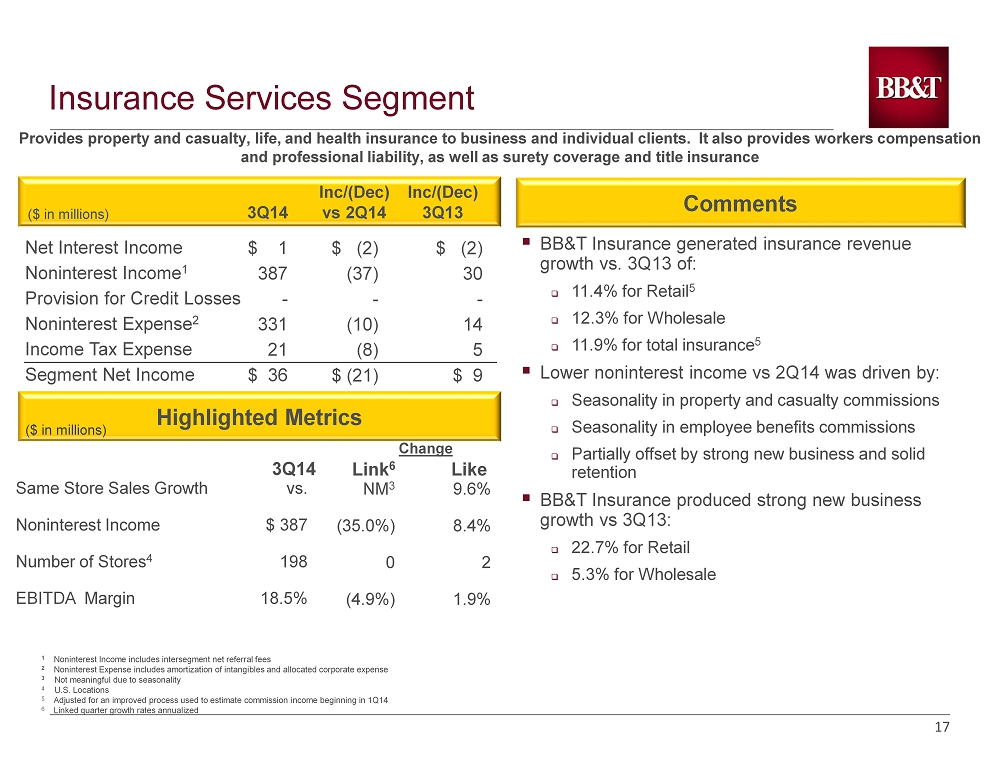
17 17 Insurance Services Segment Comments ($ in millions) Inc/(Dec) vs 2Q14 Inc/(Dec) 3Q13 3Q14 Net Interest Income Noninterest Income 1 Provision for Credit Losses Noninterest Expense 2 Income Tax Expense Segment Net Income Highlighted Metrics Same Store Sales Growth Noninterest Income Number of Stores 4 EBITDA Margin 3 Q14 Like Provides property and casualty, life, and health insurance to business and individual clients. It also provides workers comp ens ation and professional liability, as well as surety coverage and title insurance $ 1 387 - 331 21 $ 36 $ (2) (37) - (10) (8) $ (21) $ (2) 30 - 14 5 $ 9 vs. $ 387 198 18.5% 9.6% 8.4% 2 1.9% ▪ BB&T Insurance generated insurance revenue growth vs. 3Q13 of : □ 11.4% for Retail 5 □ 12.3% for Wholesale □ 11.9% for total insurance 5 ▪ Lower noninterest income vs 2Q14 was driven by: □ Seasonality in property and casualty commissions □ Seasonality in employee benefits commissions □ Partially offset by strong new business and solid retention ▪ BB&T Insurance produced strong new business growth vs 3Q13: □ 22.7% for Retail □ 5.3% for Wholesale Change NM 3 (35.0%) 0 (4.9%) Link 6 ($ in millions ) 1 Noninterest Income includes intersegment net referral fees 2 Noninterest Expense includes amortization of intangibles and allocated corporate expense 3 Not meaningful due to seasonality 4 U.S . Locations 5 Adjusted for an improved process used to estimate commission income beginning in 1Q14 6 Linked quarter growth rates annualized
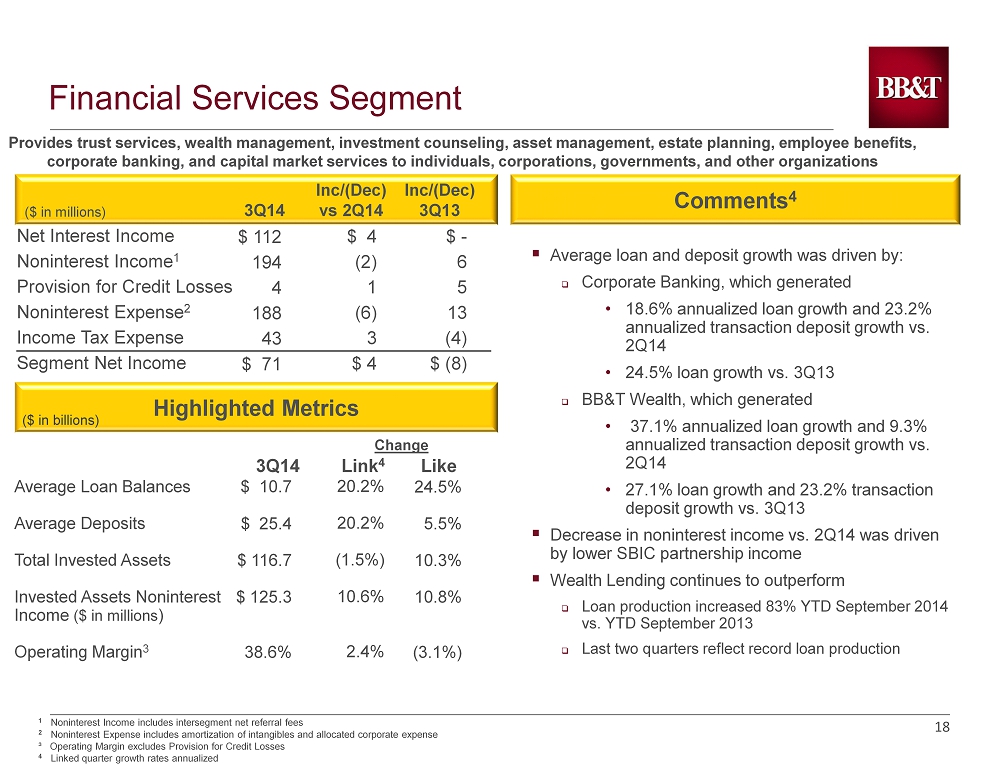
18 18 ▪ Average loan and deposit growth was driven by: □ Corporate Banking, which generated • 18.6% annualized loan growth and 23.2% annualized transaction deposit growth vs . 2Q14 • 24.5% loan growth vs. 3Q13 □ BB&T Wealth, which generated • 37.1% annualized loan growth and 9.3% annualized transaction deposit growth vs. 2Q14 • 27.1% loan growth and 23.2% transaction deposit growth vs. 3Q13 ▪ Decrease in noninterest income vs. 2Q14 was driven by lower SBIC partnership income ▪ Wealth Lending continues to outperform □ Loan production increased 83% YTD September 2014 vs. YTD September 2013 □ Last two quarters reflect record loan production Provides trust services, wealth management, investment counseling, asset management , estate planning, employee benefits, corporate banking, and capital market services to individuals, corporations , governments, and other organizations Comments 4 ($ in millions) Inc/(Dec) vs 2Q14 Inc/(Dec) 3Q13 3Q14 Net Interest Income Noninterest Income 1 Provision for Credit Losses Noninterest Expense 2 Income Tax Expense Segment Net Income Highlighted Metrics Average Loan Balances Average Deposits Total Invested Assets Invested Assets Noninterest Income ($ in millions ) Operating Margin 3 3Q14 Like $ 112 194 4 188 43 $ 71 $ 4 (2) 1 (6) 3 $ 4 $ - 6 5 13 (4) $ (8) $ 10.7 $ 25.4 $ 116.7 $ 125.3 38.6% 1 Noninterest Income includes intersegment net referral fees 2 Noninterest Expense includes amortization of intangibles and allocated corporate expense ³ Operating Margin excludes Provision for Credit Losses 4 Linked quarter growth rates annualized ($ in billions) Link 4 20.2% 20.2% (1.5%) 10.6% 2.4% Change Financial Services Segment 24.5% 5.5% 10.3% 10.8% (3.1%)

19

20
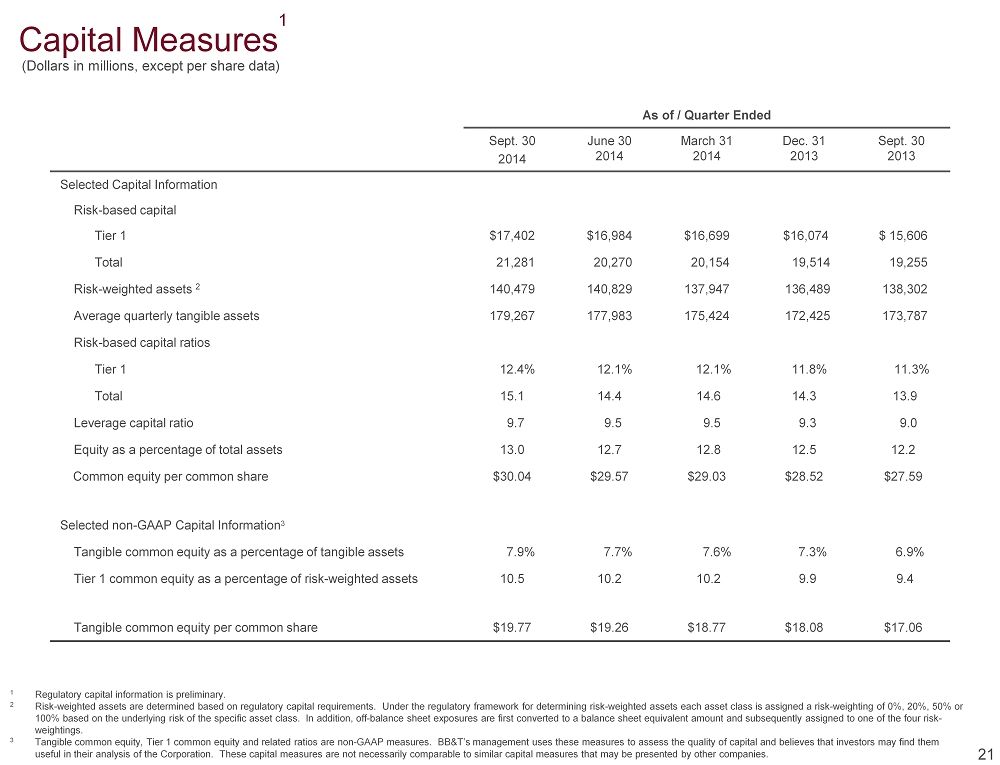
Capital Measures 1 As of / Quarter Ended Sept. 30 2014 June 30 2014 March 31 2014 Dec. 31 2013 Sept. 30 2013 Selected Capital Information Risk - based capital Tier 1 $17,402 $16,984 $16,699 $16,074 $ 15,606 Total 21,281 20,270 20,154 19,514 19,255 Risk - weighted assets 2 140,479 140,829 137,947 136,489 138,302 Average quarterly tangible assets 179,267 177,983 175,424 172,425 173,787 Risk - based capital ratios Tier 1 12.4% 12.1% 12.1% 11.8% 11.3% Total 15.1 14.4 14.6 14.3 13.9 Leverage capital ratio 9.7 9.5 9.5 9.3 9.0 Equity as a percentage of total assets 13.0 12.7 12.8 12.5 12.2 Common equity per common share $30.04 $29.57 $29.03 $28.52 $27.59 Selected non - GAAP Capital Information 3 Tangible common equity as a percentage of tangible assets 7.9% 7.7% 7.6% 7.3% 6.9% Tier 1 common equity as a percentage of risk - weighted assets 10.5 10.2 10.2 9.9 9.4 Tangible common equity per common share $19.77 $19.26 $18.77 $18.08 $17.06 21 1 Regulatory capital information is preliminary. 2 Risk - weighted assets are determined based on regulatory capital requirements. Under the regulatory framework for determining risk - weighted as sets each asset class is assigned a risk - weighting of 0%, 20%, 50% or 100% based on the underlying risk of the specific asset class. In addition, off - balance sheet exposures are first converted to a balance sheet equivalent amount and subsequently assigned to one of the four risk - weightings. 3 Tangible common equity, Tier 1 common equity and related ratios are non - GAAP measures. BB&T’s management uses these measures t o assess the quality of capital and believes that investors may find them useful in their analysis of the Corporation. These capital measures are not necessarily comparable to similar capital measur es that may be presented by other companies. (Dollars in millions, except per share data)
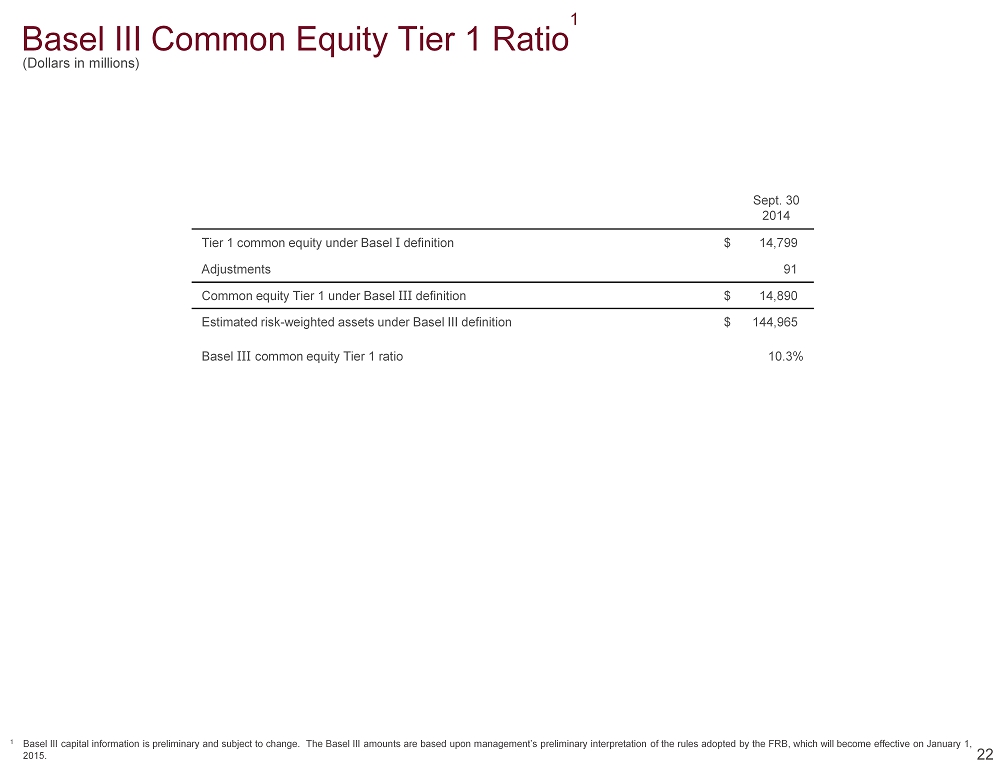
Basel III Common Equity Tier 1 Ratio 1 Sept. 30 2014 Tier 1 common equity under Basel I definition $ 14,799 Adjustments 91 Common equity Tier 1 under Basel III definition $ 14,890 Estimated risk - weighted assets under Basel III definition $ 144,965 Basel III common equity Tier 1 ratio 10.3% 1 Basel III capital information is preliminary and subject to change. The Basel III amounts are based upon management’s prelim ina ry interpretation of the rules adopted by the FRB, which will become effective on January 1, 2015. 22 (Dollars in millions)

Non - GAAP Reconciliations 1 As of / Quarter Ended Sept. 30 2014 June 30 2014 March 31 2014 Dec. 31 2013 Sept. 30 2013 Calculations of tangible common equity, Tier 1 common equity, tangible assets and related measures: Total shareholders’ equity $ 24,314 $ 23,965 $ 23,556 $ 22,809 $ 22,094 Less: Preferred stock 2,603 2,603 2,603 2,603 2,603 Noncontrolling interests 76 85 94 50 45 Intangible assets 7,396 7,420 7,370 7,383 7,418 Tangible common equity $14,239 $13,857 $13,489 $12,773 $12,028 Add: Regulatory adjustments 560 524 607 698 975 Tier 1 common equity (Basel I ) $14,799 $14,381 $14,096 $13,471 $13,003 Total assets $187,022 $188,012 $184,651 $183,010 $181,708 Less: Intangible assets 7,396 7,420 7,370 7,383 7,418 Tangible assets $179,626 $180,592 $177,281 $175,627 $174,290 Risk - weighted assets 2 $140,479 $140,829 $137,947 $136,489 $138,302 Tangible common equity as a percentage of tangible assets 7.9% 7.7% 7.6% 7.3% 6.9% Tier 1 common equity as a percentage of risk - weighted assets 10.5 10.2 10.2 9.9 9.4 Tangible common equity $14,239 $13,857 $13,489 $12,773 $12,028 Outstanding shares at end of period (in thousands) 720,298 719,584 718,497 706,620 704,925 Tangible common equity per common share $19.77 $19.26 $18.77 $18.08 $17.06 1 Regulatory capital information is preliminary. Tangible common equity, Tier 1 common equity and related ratios are non - GAAP measures. BB&T's management uses these measures to assess the quality of capital and believes that investors may find them useful in their analysis of the Corporation. These capital measures are not necess ari ly comparable to similar capital measures that may be presented by other companies . 2 Risk - weighted assets are determined based on regulatory capital requirements. Under the regulatory framework for determining risk - weighted as sets each asset class is assigned a risk - weighting of 0%, 20%, 50% or 100% based on the underlying risk of the specific asset class. In addition, off - balance sheet exposures are first converted to a balance sheet equivalent amount and subsequently assigned to one of the four risk - weightings. 23 (Dollars in millions, except per share data)
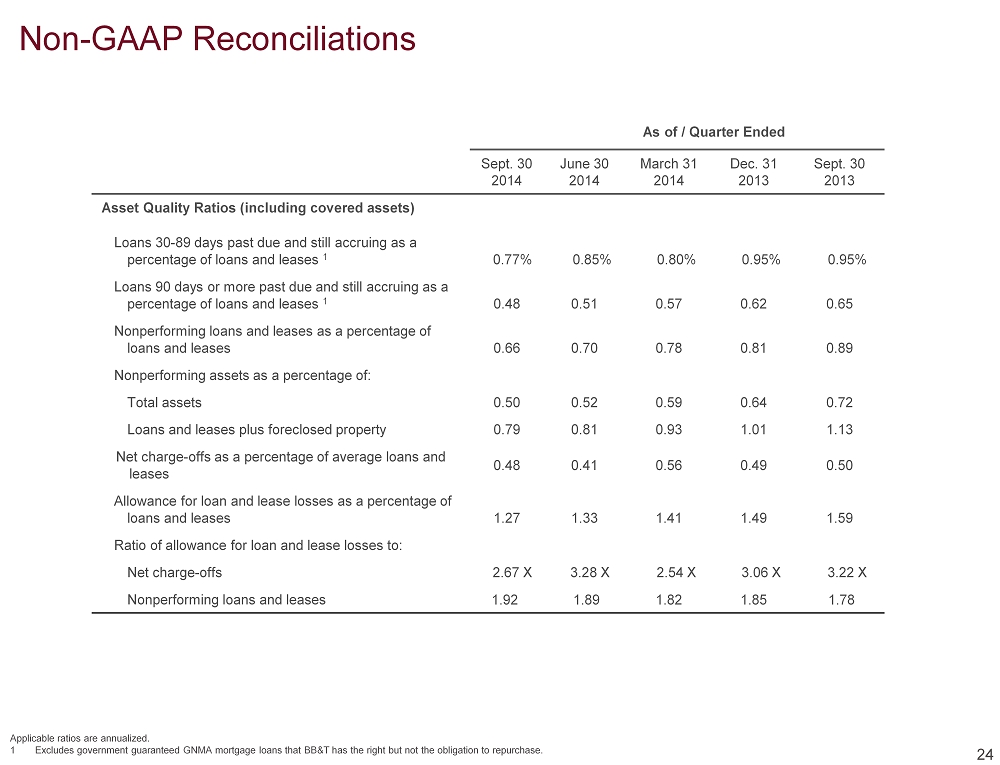
Non - GAAP Reconciliations As of / Quarter Ended Sept. 30 2014 June 30 2014 March 31 2014 Dec. 31 2013 Sept. 30 2013 Asset Quality Ratios (including covered assets) Loans 30 - 89 days past due and still accruing as a percentage of loans and leases 1 0.77% 0.85% 0.80% 0.95% 0.95% Loans 90 days or more past due and still accruing as a percentage of loans and leases 1 0.48 0.51 0.57 0.62 0.65 Nonperforming loans and leases as a percentage of loans and leases 0.66 0.70 0.78 0.81 0.89 Nonperforming assets as a percentage of: Total assets 0.50 0.52 0.59 0.64 0.72 Loans and leases plus foreclosed property 0.79 0.81 0.93 1.01 1.13 Net charge - offs as a percentage of average loans and leases 0.48 0.41 0.56 0.49 0.50 Allowance for loan and lease losses as a percentage of loans and leases 1.27 1.33 1.41 1.49 1.59 Ratio of allowance for loan and lease losses to: Net charge - offs 2.67 X 3.28 X 2.54 X 3.06 X 3.22 X Nonperforming loans and leases 1.92 1.89 1.82 1.85 1.78 24 Applicable ratios are annualized . 1 Excludes government guaranteed GNMA mortgage loans that BB&T has the right but not the obligation to repurchase.
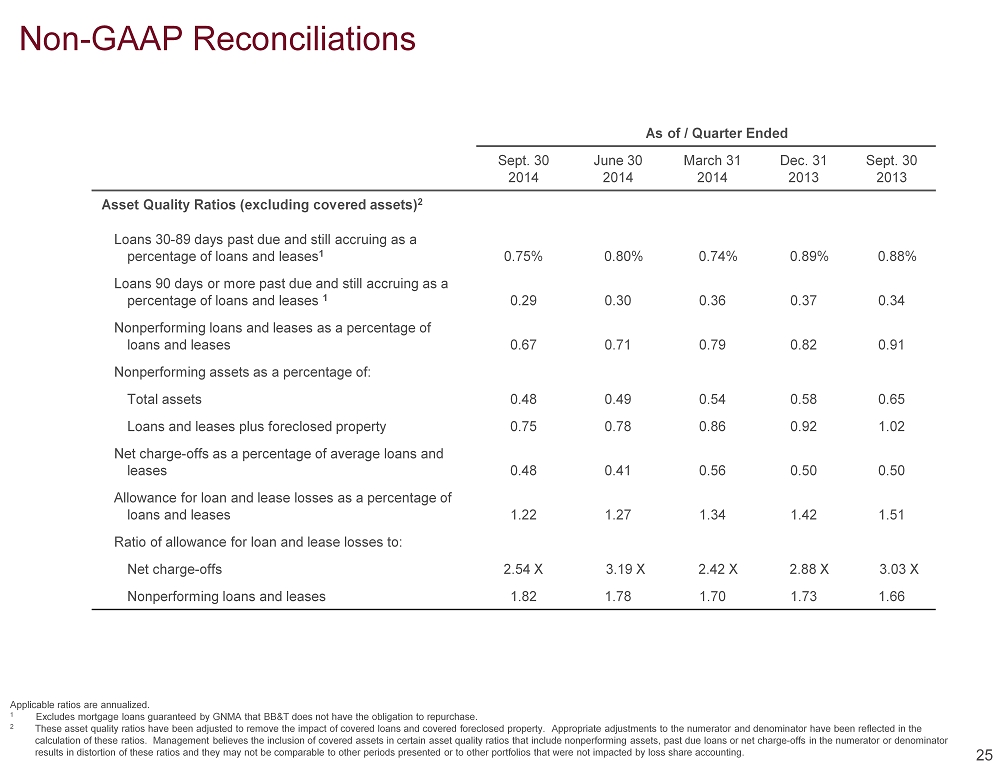
Non - GAAP Reconciliations Applicable ratios are annualized. 1 Excludes mortgage loans guaranteed by GNMA that BB&T does not have the obligation to repurchase. 2 These asset quality ratios have been adjusted to remove the impact of covered loans and covered foreclosed property. Appropr i ate adjustments to the numerator and denominator have been reflected in the calculation of these ratios. Management believes the inclusion of covered assets in certain asset quality ratios that includ e n onperforming assets, past due loans or net charge - offs in the numerator or denominator results in distortion of these ratios and they may not be comparable to other periods presented or to other portfolios that w ere not impacted by loss share accounting. As of / Quarter Ended Sept. 30 2014 June 30 2014 March 31 2014 Dec. 31 2013 Sept. 30 2013 Asset Quality Ratios (excluding covered assets) 2 Loans 30 - 89 days past due and still accruing as a percentage of loans and leases 1 0.75% 0.80% 0.74% 0.89% 0.88% Loans 90 days or more past due and still accruing as a percentage of loans and leases 1 0.29 0.30 0.36 0.37 0.34 Nonperforming loans and leases as a percentage of loans and leases 0.67 0.71 0.79 0.82 0.91 Nonperforming assets as a percentage of: Total assets 0.48 0.49 0.54 0.58 0.65 Loans and leases plus foreclosed property 0.75 0.78 0.86 0.92 1.02 Net charge - offs as a percentage of average loans and leases 0.48 0.41 0.56 0.50 0.50 Allowance for loan and lease losses as a percentage of loans and leases 1.22 1.27 1.34 1.42 1.51 Ratio of allowance for loan and lease losses to: Net charge - offs 2.54 X 3.19 X 2.42 X 2.88 X 3.03 X Nonperforming loans and leases 1.82 1.78 1.70 1.73 1.66 25
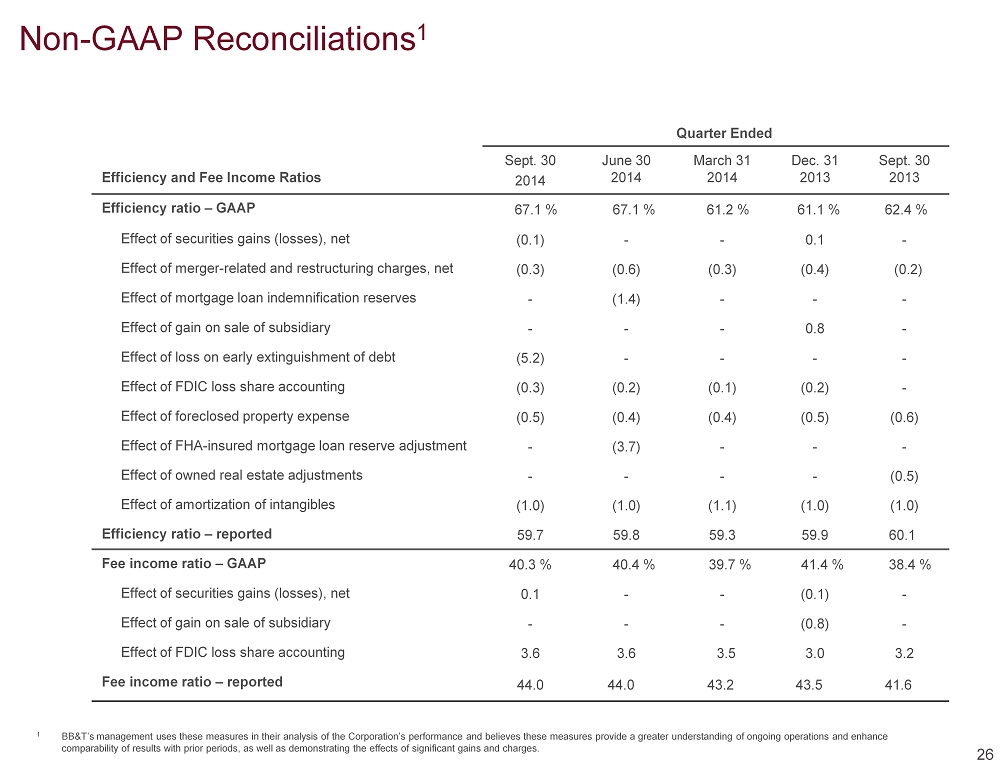
Non - GAAP Reconciliations 1 Quarter Ended Efficiency and Fee Income Ratios Sept. 30 2014 June 30 2014 March 31 2014 Dec. 31 2013 Sept. 30 2013 Efficiency ratio – GAAP 67.1 % 67.1 % 61.2 % 61.1 % 62.4 % Effect of securities gains (losses), net (0.1) - - 0.1 - Effect of merger - related and restructuring charges, net (0.3) (0.6) (0.3) (0.4) (0.2) Effect of mortgage loan indemnification reserves - (1.4) - - - Effect of gain on sale of subsidiary - - - 0.8 - Effect of loss on early extinguishment of debt (5.2) - - - - Effect of FDIC loss share accounting (0.3) (0.2) (0.1) (0.2) - Effect of foreclosed property expense (0.5) (0.4) (0.4) (0.5) (0.6) Effect of FHA - insured mortgage loan reserve adjustment - (3.7) - - - Effect of owned real estate adjustments - - - - (0.5) Effect of amortization of intangibles (1.0) (1.0) (1.1) (1.0) (1.0) Efficiency ratio – reported 59.7 59.8 59.3 59.9 60.1 Fee income ratio – GAAP 40.3 % 40.4 % 39.7 % 41.4 % 38.4 % Effect of securities gains (losses), net 0.1 - - (0.1) - Effect of gain on sale of subsidiary - - - (0.8) - Effect of FDIC loss share accounting 3.6 3.6 3.5 3.0 3.2 Fee income ratio – reported 44.0 44.0 43.2 43.5 41.6 26 1 BB&T’s management uses these measures in their analysis of the Corporation’s performance and believes these measures provide a greater understanding of ongoing operations and enhance comparability of results with prior periods, as well as demonstrating the effects of significant gains and charges.
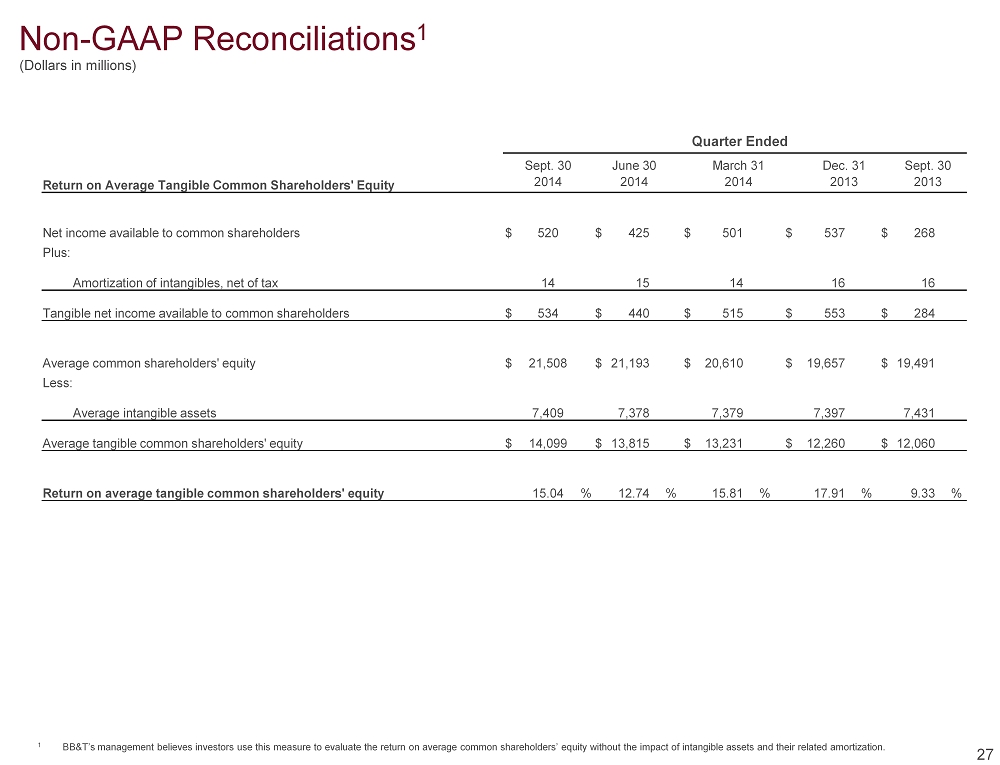
Quarter Ended Sept. 30 June 30 March 31 Dec. 31 Sept. 30 Return on Average Tangible Common Shareholders' Equity 2014 2014 2014 2013 2013 Net income available to common shareholders $ 520 $ 425 $ 501 $ 537 $ 268 Plus: Amortization of intangibles, net of tax 14 15 14 16 16 Tangible net income available to common shareholders $ 534 $ 440 $ 515 $ 553 $ 284 Average common shareholders' equity $ 21,508 $ 21,193 $ 20,610 $ 19,657 $ 19,491 Less: Average intangible assets 7,409 7,378 7,379 7,397 7,431 Average tangible common shareholders' equity $ 14,099 $ 13,815 $ 13,231 $ 12,260 $ 12,060 Return on average tangible common shareholders' equity 15.04 % 12.74 % 15.81 % 17.91 % 9.33 % 27 1 BB&T’s management believes investors use this measure to evaluate the return on average common shareholders’ equity without t he impact of intangible assets and their related amortization. Non - GAAP Reconciliations 1 (Dollars in millions)
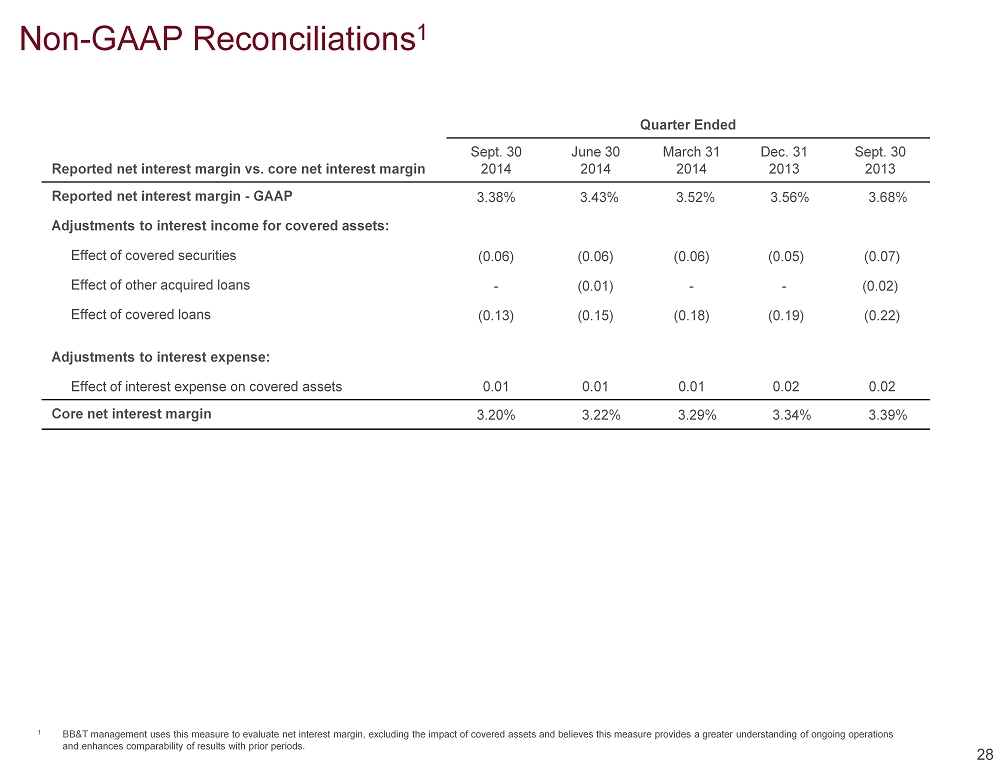
Non - GAAP Reconciliations 1 Quarter Ended Reported net interest margin vs. core net interest margin Sept. 30 2014 June 30 2014 March 31 2014 Dec. 31 2013 Sept. 30 2013 Reported net interest margin - GAAP 3.38% 3.43% 3.52% 3.56% 3.68% Adjustments to interest income for covered assets: Effect of covered securities (0.06) (0.06) (0.06) (0.05) (0.07) Effect of other acquired loans - (0.01) - - (0.02) Effect of covered loans (0.13) (0.15) (0.18) (0.19) (0.22) Adjustments to interest expense: Effect of interest expense on covered assets 0.01 0.01 0.01 0.02 0.02 Core net interest margin 3.20% 3.22% 3.29% 3.34% 3.39% 28 1 BB&T management uses this measure to evaluate net interest margin, excluding the impact of covered assets and believes this m ea sure provides a greater understanding of ongoing operations and enhances comparability of results with prior periods.
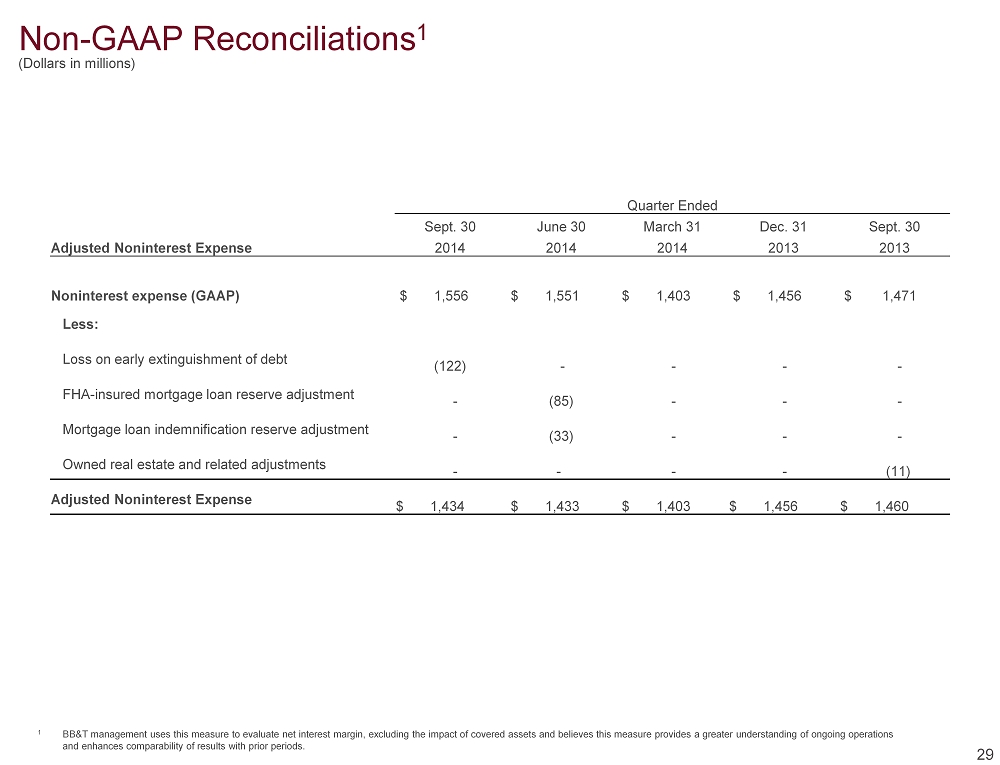
Non - GAAP Reconciliations 1 29 1 BB&T management uses this measure to evaluate net interest margin, excluding the impact of covered assets and believes this m ea sure provides a greater understanding of ongoing operations and enhances comparability of results with prior periods. Quarter Ended Sept. 30 June 30 March 31 Dec. 31 Sept. 30 Adjusted Noninterest Expense 2014 2014 2014 2013 2013 Noninterest expense (GAAP) $ 1 , 556 $ 1 , 551 $ 1 , 403 $ 1 , 456 $ 1 , 471 Less: Loss on early extinguishment of debt ( 122 ) - - - - FHA - insured mortgage loan reserve adjustment - ( 85) - - - Mortgage loan indemnification reserve adjustment - ( 33 ) - - - Owned real estate and related adjustments - - - - ( 11 ) Adjusted Noninterest Expense $ 1 , 434 $ 1 , 433 $ 1 , 403 $ 1 , 456 $ 1 , 460 (Dollars in millions)
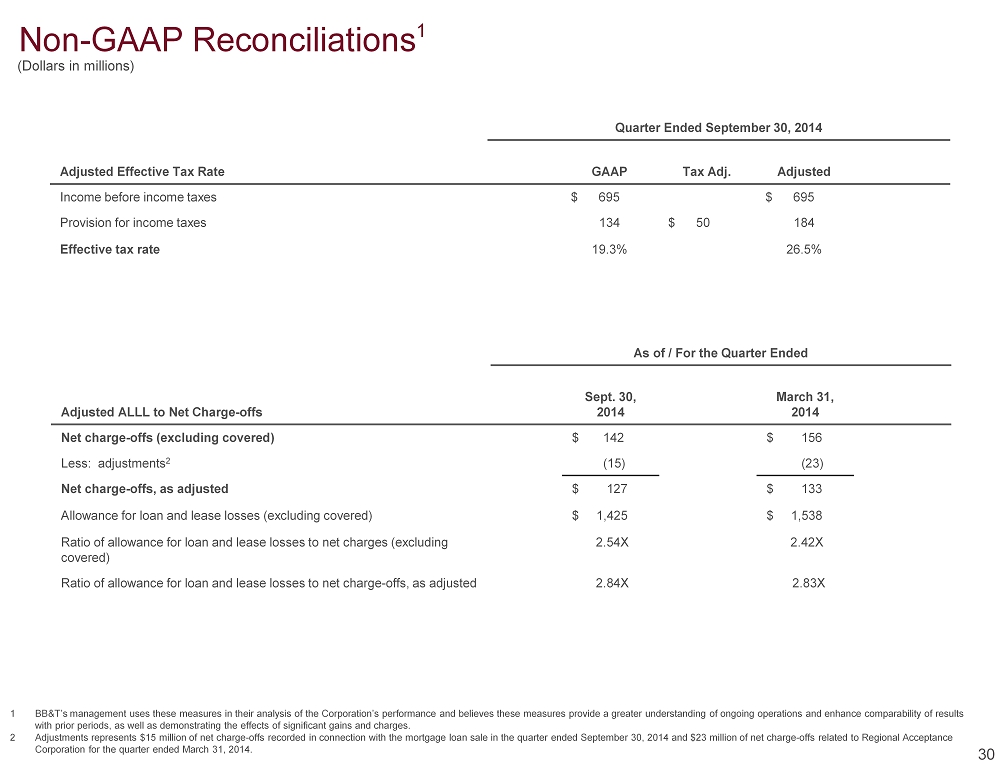
Non - GAAP Reconciliations 1 Quarter Ended September 30, 2014 Adjusted Effective Tax Rate GAAP Tax Adj. Adjusted Income before income taxes $ 695 $ 695 Provision for income taxes 134 $ 50 184 Effective tax rate 19.3% 26.5% 30 1 BB&T’s management uses these measures in their analysis of the Corporation’s performance and believes these measures provide a g reater understanding of ongoing operations and enhance comparability of results with prior periods, as well as demonstrating the effects of significant gains and charges. 2 Adjustments represents $15 million of net charge - offs recorded in connection with the mortgage loan sale in the quarter ended Se ptember 30, 2014 and $23 million of net charge - offs related to Regional Acceptance Corporation for the quarter ended March 31, 2014. As of / For the Quarter Ended Adjusted ALLL to Net Charge - offs Sept. 30, 2014 March 31, 2014 Net charge - offs (excluding covered) $ 142 $ 156 Less: adjustments 2 (15) (23) Net charge - offs, as adjusted $ 127 $ 133 Allowance for loan and lease losses (excluding covered) $ 1,425 $ 1,538 Ratio of allowance for loan and lease losses to net charges (excluding covered) 2.54X 2.42X Ratio of allowance for loan and lease losses to net charge - offs, as adjusted 2.84X 2.83X (Dollars in millions)