Exhibit 99.3


Forward - Looking Information This presentation contains “forward - looking statements” within the meaning of the Private Securities Litigation Reform Act of 19 95, regarding the financial condition, results of operations, business plans and the future performance of BB&T that are based on the beliefs and assumptions of the management of BB&T and the information available to management at the time th at these disclosures were prepared. Words such as “anticipates,” “believes,” “estimates,” “expects,” “forecasts,” “intends,” “plans,” “projects,” “may,” “will,” “should,” “could,” and other similar expressions are intended to identify thes e f orward - looking statements. Such statements are subject to factors that could cause actual results to differ materially from anticipated results. Such factors include, but are not limited to, the following: general economic or business conditions, either nationally or regionally, may be less favorable than expected, resulting in, amo ng other things, a deterioration in credit quality and/or a reduced demand for credit, insurance or other services; disruptions to the credit and financial markets, either nationally or globally, including the impact of a downgrade of U.S. g ove rnment obligations by one of the credit ratings agencies and the adverse effects of recessionary conditions in Europe; changes in the interest rate environment and cash flow reassessments may reduce NIM and/or the volumes and values of loans ma de or held as well as the value of other financial assets held; competitive pressures among depository and other financial institutions may increase significantly; legislative, regulatory or accounting changes, including changes resulting from the adoption and implementation of the Dodd - Fran k Act may adversely affect the businesses in which BB&T is engaged; local, state or federal taxing authorities may take tax positions that are adverse to BB&T; a reduction may occur in BB&T’s credit ratings; adverse changes may occur in the securities markets; competitors of BB&T may have greater financial resources and develop products that enable them to compete more successfully t han BB&T and may be subject to different regulatory standards than BB&T; natural or other disasters could have an adverse effect on BB&T in that such events could materially disrupt BB&T’s operation s o r the ability or willingness of BB&T’s customers to access the financial services BB&T offers; costs or difficulties related to the integration of the businesses of BB&T and its merger partners may be greater than expect ed; expected cost savings or revenue growth associated with completed mergers and acquisitions may not be fully realized or reali zed within the expected time frames; significant litigation could have a material adverse effect on BB&T; deposit attrition, customer loss and/or revenue loss following completed mergers and acquisitions may be greater than expecte d ; cyber - security risks, including “denial of service,” “hacking” and “identity theft,” could adversely affect our business and fin ancial performance, or our reputation; and, failure to implement part or all of the Company’s new ERP system could result in impairment charges that adversely impact BB& T’s financial condition and results of operations and could result in significant additional costs to BB&T. Readers are cautioned not to place undue reliance on these forward - looking statements, which speak only as of the date of this r eport. Actual results may differ materially from those expressed in or implied by any forward - looking statement. Except to the extent required by applicable law or regulation, BB&T undertakes no obligation to revise or update publicly any forwar d - l ooking statements for any reason. Non - GAAP Information This presentation contains financial information and performance measures determined by methods other than in accordance with ac counting principles generally accepted in the United States of America (“GAAP”). BB&T’s management uses these “non - GAAP” measures in their analysis of the Corporation’s performance and the efficiency of its operations. Management believes that these non - GAAP measures provide a greater understanding of ongoing operations and enhance comparability of results with prior periods as well as demonstrating the effects of significant gains and charges in the current period. The c omp any believes that a meaningful analysis of its financial performance requires an understanding of the factors underlying that performance. BB&T’s management believes that investors may use these non - GAAP financial measures to analyze financial performanc e without the impact of unusual items that may obscure trends in the company’s underlying performance. These disclosures should not be viewed as a substitute for financial measures determined in accordance with GAAP, nor are they nece ssa rily comparable to non - GAAP performance measures that may be presented by other companies. Below is a listing of the types of non - GAAP measures used in this presentation: Tangible common equity, Tier 1 common equity and related ratios are non - GAAP measures. The return on average risk - weighted asset s is a non - GAAP measure. The Basel III common equity Tier I ratio reflects management’s interpretation of the regulatory requirements, which is subject to change. BB&T's management uses these measures to assess th e q uality of capital and believes that investors may find them useful in their analysis of the Corporation. Fee income and efficiency ratios are non - GAAP in that they exclude securities gains (losses), foreclosed property expense, amortizat ion of intangible assets, merger - related and restructuring charges, the impact of FDIC loss share accounting and other selected items. BB&T’s management uses these measures in their analysis of the Corporation’s perfo rma nce. Adjusted non - interest expenses exclude loss on early extinguishment of debt, FHA - insured mortgage loan reserve adjustment, mortg age loan indemnification reserve adjustment and owned real estate and related adjustments and is a Non - GAAP measure. BB&T’s management believes these measures provide a greater understanding of ongoing operations and enhance comparability of results with prior periods, as well as demonstrating the effects of significant gains and charges. Return on average tangible common shareholders’ equity is a non - GAAP measure that calculates the return on average common shareholders’ equity without the impact of intangible assets and their related amortization . This measure is useful for evaluating the performance of a business consistently, whether acquired or developed internally. Core net interest margin is a non - GAAP measure that adjusts net interest margin to exclude the impact of interest income and fun ding costs associated with loans and securities acquired in the Colonial acquisition. BB&T’s management believes that the exclusion of the generally higher yielding assets acquired in the Colonial acquisition from the cal culation of net interest margin provides investors with useful information related to the relative performance of the remainder of BB&T’s earning assets. Adjusted net charge - offs, the adjusted ratio of net charge - offs to average loans and the allowance to adjusted net charge - offs ratio are non - GAAP measures that adjust net charge - offs to exclude the impact of a process change that resulted in accelerated recognition of charge - offs in the non - prime automobile lending portfolio during the quarter ended March 31, 2014 and net charge - offs associated with certain loan sales during the quarter ended September 30, 2014. BB&T’s management believes these adjustments increase comparability of period - to - period results and believes that investors may find them useful in their analysis of the Corporation . A reconciliation of these non - GAAP measures to the most directly comparable GAAP measure is included in BB&T’s Fourth Quarter 2014 Quarterly Performance Summary, which is available on BB&T’s website at www.bbt.com.
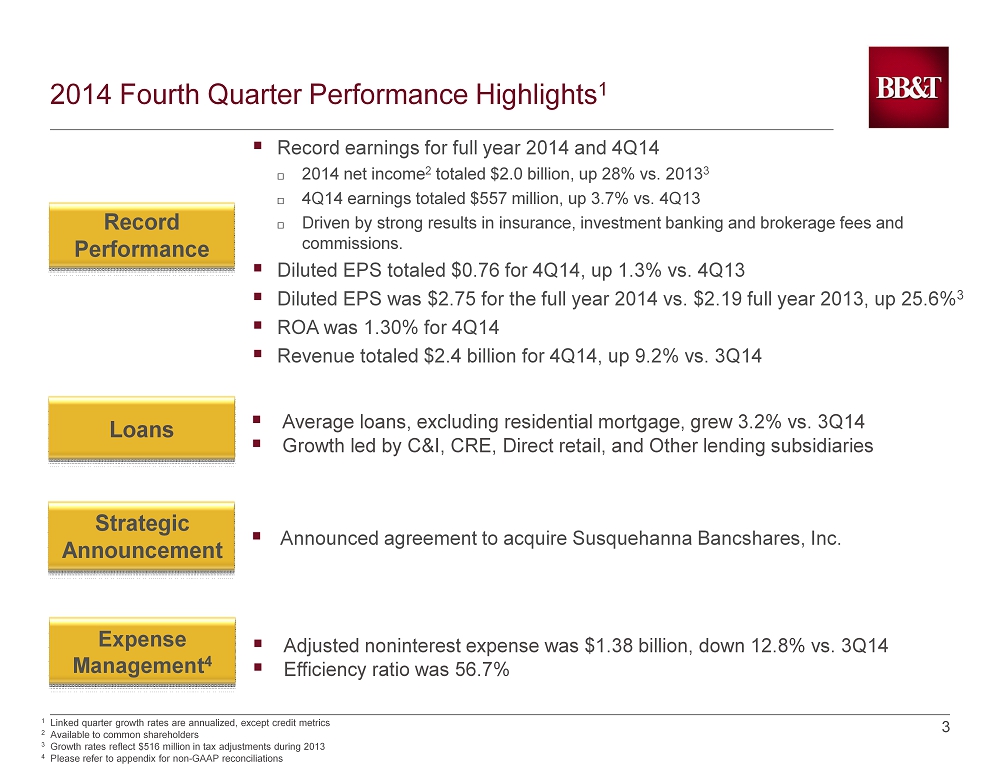
3 3 2014 Fourth Quarter Performance Highlights 1 ▪ Record earnings for full year 2014 and 4Q14 2014 net income 2 totaled $2.0 billion, up 28% vs. 2013 3 4Q14 earnings totaled $557 million, up 3.7% vs. 4Q13 Driven by strong results in insurance, investment banking and brokerage fees and commissions. ▪ Diluted EPS totaled $0.76 for 4Q14, up 1.3% vs. 4Q13 ▪ Diluted EPS was $2.75 for the full year 2014 vs. $2.19 full year 2013, up 25.6% 3 ▪ ROA was 1.30% for 4Q14 ▪ Revenue totaled $2.4 billion for 4Q14, up 9.2% vs. 3Q14 Record Performance Loans ▪ Average loans, excluding residential mortgage, grew 3.2% vs. 3Q14 ▪ Growth led by C&I, CRE, Direct retail, and Other lending subsidiaries Expense Management 4 Strategic Announcement ▪ Adjusted noninterest expense was $1.38 billion, down 12.8% vs. 3Q14 ▪ Efficiency ratio was 56.7% 1 Linked quarter growth rates are annualized, except credit metrics 2 Available to common shareholders 3 Growth rates reflect $516 million in tax adjustments during 2013 4 Please refer to appendix for non - GAAP reconciliations ▪ Announced agreement to acquire Susquehanna Bancshares, Inc.
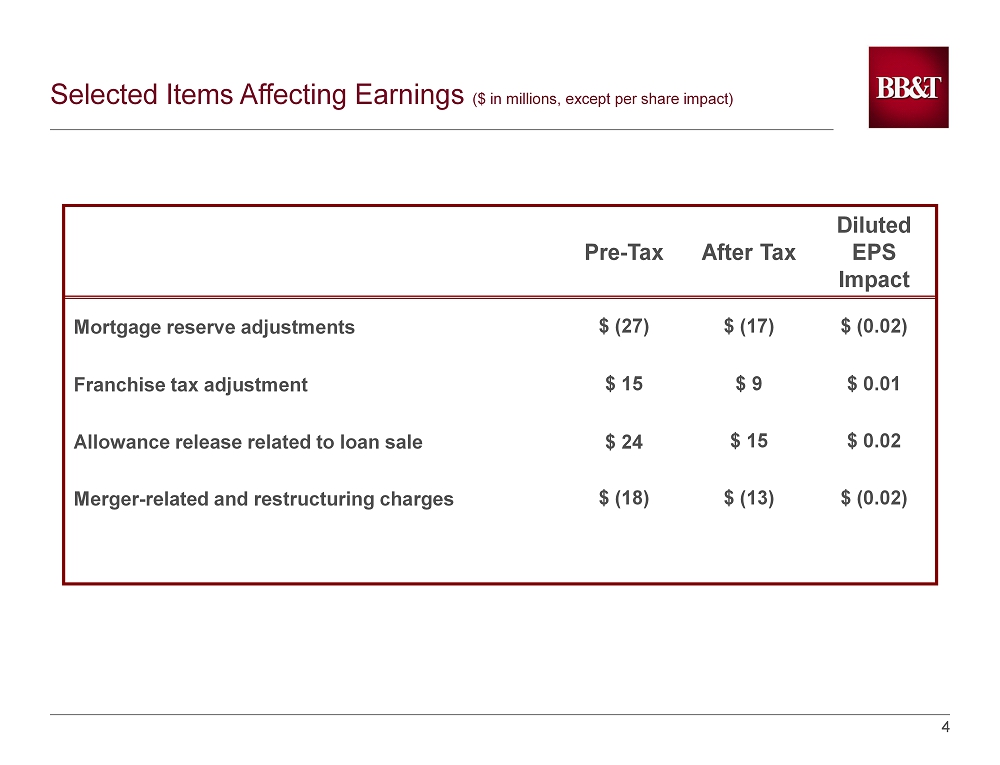
4 4 Pre - Tax After Tax Diluted EPS Impact Mortgage reserve adjustments $ (27) $ (17) $ (0.02) Franchise tax adjustment $ 15 $ 9 $ 0.01 Allowance release related to loan sale $ 24 $ 15 $ 0.02 Merger - related and restructuring charges $ (18) $ (13) $ (0.02) Selected Items Affecting Earnings ($ in millions, except per share impact)

5 5 Broad - based Loan Growth 1 ▪ Excluding Residential mortgage, loans grew 3.2% annualized ▪ Experienced broad - based loan growth vs. 3Q14 5.0% annualized growth in total commercial led by 23.3% growth in Corporate Banking ▪ Mortgage balances declined due to a 2Q14 management decision to sell all conforming loan production and the impact of the loan sales 1 Excludes loans held for sale 2 Other l ending s ubsidiaries consist of AFCO/CAFO/Prime Rate, BB&T Equipment Finance, Grandbridge Real Estate Capital, Sheffield Financial and Regional Acceptance $114.8 $115.1 $117.1 $118.6 $118.3 $110.0 $112.0 $114.0 $116.0 $118.0 $120.0 4Q13 1Q14 2Q14 3Q14 4Q14 Average Loans Held for Investment ($ in billions) C&I $ 40,383 $ 477 4.7% CRE – income producing properties 10,681 85 3.2 CRE – construction & development 2,772 102 15.2 Direct retail 8,085 173 8.7 Sales finance 10,247 (66) (2.5) Revolving credit 2,427 31 5.1 Residential mortgage 31,046 (954) (11.8) Other lending subsidiaries 2 11,351 117 4.1 Subtotal $ 116,992 $ (35) (0.1)% Acquired from FDIC 1,309 (228) (58.9) Total $ 118,301 $ (263) (0.9)% 4Q14 Average Balance 4 Q14 v. 3Q14 $ Increase (Decrease) 4 Q14 v. 3Q14 Annualized % Increase (Decrease) Average Loans Held for Investment ($ in millions) ▪ $1.4 billion oil and gas portfolio 78% upstream (89% reserve - based) 17% midstream 5% service & supply ▪ Expect loan growth of 2% - 4% (5% - 7% excluding mortgage) on a linked quarter basis in 1Q15
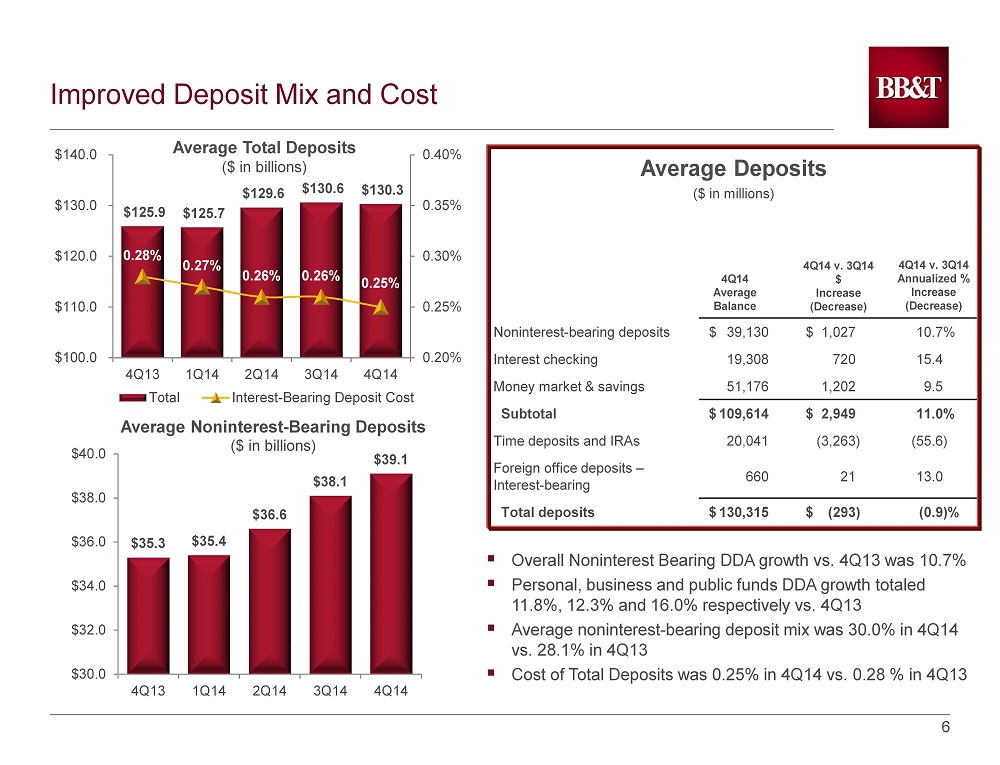
6 6 Improved Deposit Mix and Cost $125.9 $125.7 $129.6 $130.6 $130.3 0.28% 0.27% 0.26% 0.26% 0.25% 0.20% 0.25% 0.30% 0.35% 0.40% $100.0 $110.0 $120.0 $130.0 $140.0 4Q13 1Q14 2Q14 3Q14 4Q14 Total Interest-Bearing Deposit Cost ▪ Overall Noninterest Bearing DDA growth vs. 4Q13 was 10.7% ▪ Personal, business and public funds DDA growth totaled 11.8%, 12.3% and 16.0% respectively vs. 4Q13 ▪ Average noninterest - bearing deposit mix was 30.0% in 4Q14 vs. 28.1% in 4Q13 ▪ Cost of Total Deposits was 0.25% in 4Q14 vs. 0.28 % in 4Q13 Average Total Deposits ($ in billions) $35.3 $35.4 $36.6 $38.1 $39.1 $30.0 $32.0 $34.0 $36.0 $38.0 $40.0 4Q13 1Q14 2Q14 3Q14 4Q14 Average Noninterest - Bearing Deposits ($ in billions) Noninterest - bearing deposits $ 39,130 $ 1,027 10.7% Interest checking 19,308 720 15.4 Money market & savings 51,176 1,202 9.5 Subtotal $ 109,614 $ 2,949 11.0% Time deposits and IRAs 20,041 (3,263) (55.6) Foreign office deposits – Interest - bearing 660 21 13.0 Total deposits $ 130,315 $ (293) (0.9)% 4Q14 Average Balance 4Q14 v. 3Q14 $ Increase (Decrease) 4Q14 v. 3Q14 Annualized % Increase (Decrease) Average Deposits ($ in millions)
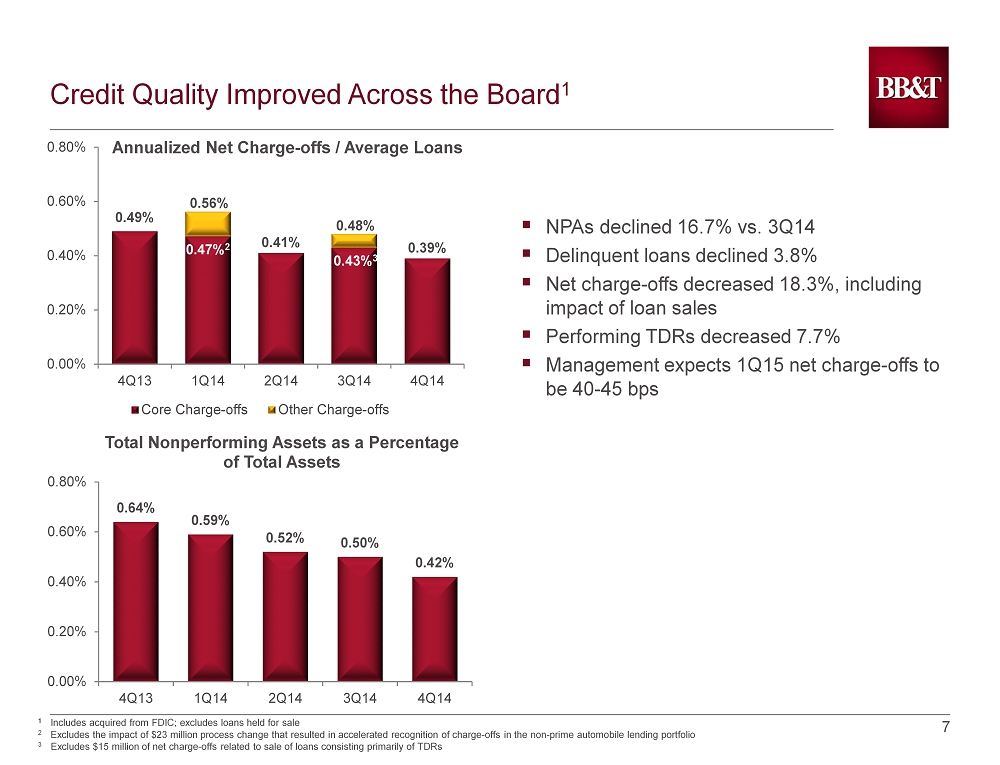
7 7 Credit Quality Improved Across the Board 1 0.49% 0.47% 2 0.41% 0.43% 3 0.39% 0.56% 0.48% 0.00% 0.20% 0.40% 0.60% 0.80% 4Q13 1Q14 2Q14 3Q14 4Q14 Core Charge-offs Other Charge-offs ▪ NPAs declined 16.7% vs. 3Q14 ▪ Delinquent loans declined 3.8% ▪ Net charge - offs decreased 18.3%, including impact of loan sales ▪ Performing TDRs decreased 7.7% ▪ Management expects 1Q15 net charge - offs to be 40 - 45 bps 0.64% 0.59% 0.52% 0.50% 0.42% 0.00% 0.20% 0.40% 0.60% 0.80% 4Q13 1Q14 2Q14 3Q14 4Q14 Total Nonperforming Assets as a Percentage of Total Assets Annualized Net Charge - offs / Average Loans 1 Includes acquired from FDIC; excludes loans held for sale 2 Excludes the impact of $23 million process change that resulted in accelerated recognition of charge - offs in the non - prime auto mobile lending portfolio 3 Excludes $15 million of net charge - offs related to sale of loans consisting primarily of TDRs
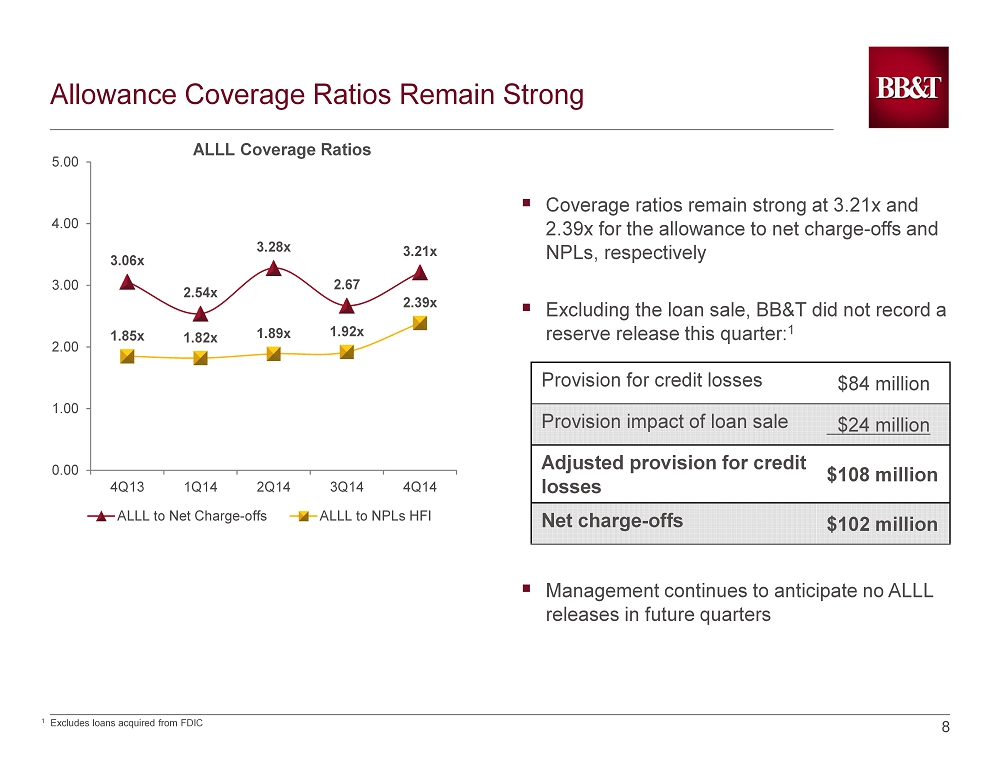
8 8 Allowance Coverage Ratios Remain Strong 3.06x 2.54x 3.28x 2.67 3.21x 1.85x 1.82x 1.89x 1.92x 2.39x 0.00 1.00 2.00 3.00 4.00 5.00 4Q13 1Q14 2Q14 3Q14 4Q14 ALLL to Net Charge-offs ALLL to NPLs HFI ▪ Coverage ratios remain strong at 3.21x and 2.39x for the allowance to net charge - offs and NPLs, respectively ▪ Excluding the loan sale, BB&T did not record a reserve release this quarter: 1 ▪ Management continues to anticipate no ALLL releases in future quarters ALLL Coverage Ratios 1 Excludes loans acquired from FDIC Provision for credit losses $84 million Provision impact of loan sale $24 million Adjusted provision for credit losses $108 million Net charge - offs $102 million
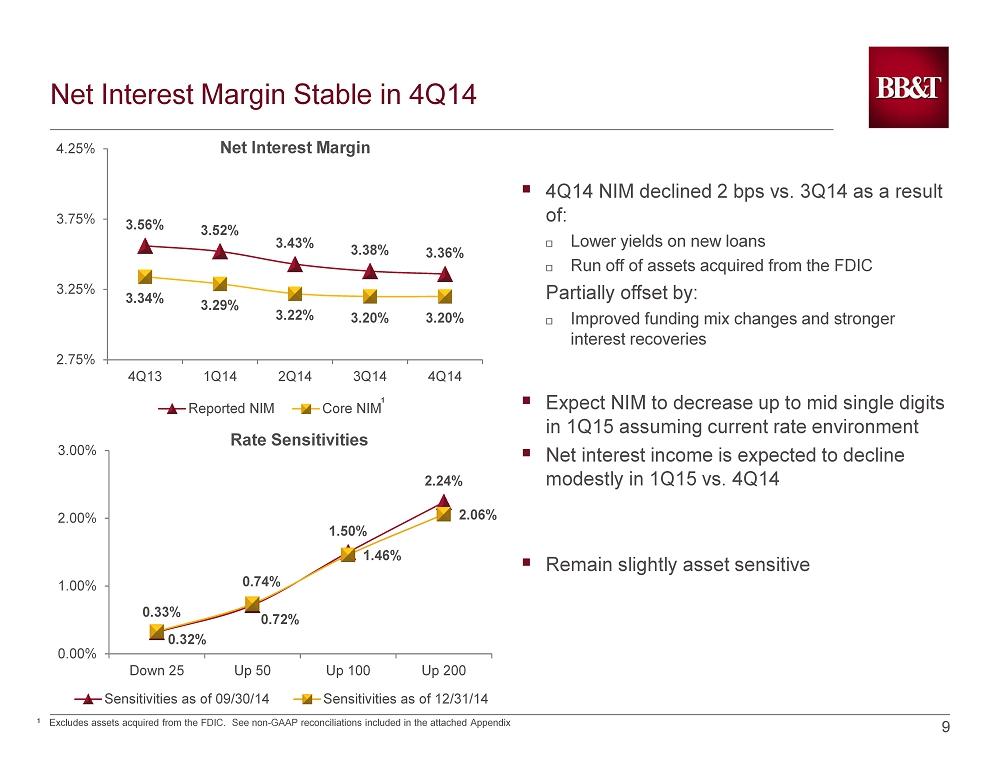
9 9 Net Interest Margin Stable in 4Q14 3.56% 3.52% 3.43% 3.38% 3.36% 3.34% 3.29% 3.22% 3.20% 3.20% 2.75% 3.25% 3.75% 4.25% 4Q13 1Q14 2Q14 3Q14 4Q14 Reported NIM Core NIM ▪ 4 Q14 NIM declined 2 bps vs. 3Q14 as a result of: Lower yields on new loans Run off of assets acquired from the FDIC Partially offset by: Improved funding mix changes and stronger interest recoveries ▪ Expect NIM to decrease up to mid single digits in 1Q15 assuming current rate environment ▪ Net interest income is expected to decline modestly in 1Q15 vs. 4Q14 ▪ Remain slightly asset sensitive Net Interest Margin 1 0.32% 0.72% 1.50% 2.24% 0.33% 0.74% 1.46% 2.06% 0.00% 1.00% 2.00% 3.00% Down 25 Up 50 Up 100 Up 200 Sensitivities as of 09/30/14 Sensitivities as of 12/31/14 Rate Sensitivities 1 Excludes assets acquired from the FDIC. See non - GAAP reconciliations included in the attached Appendix
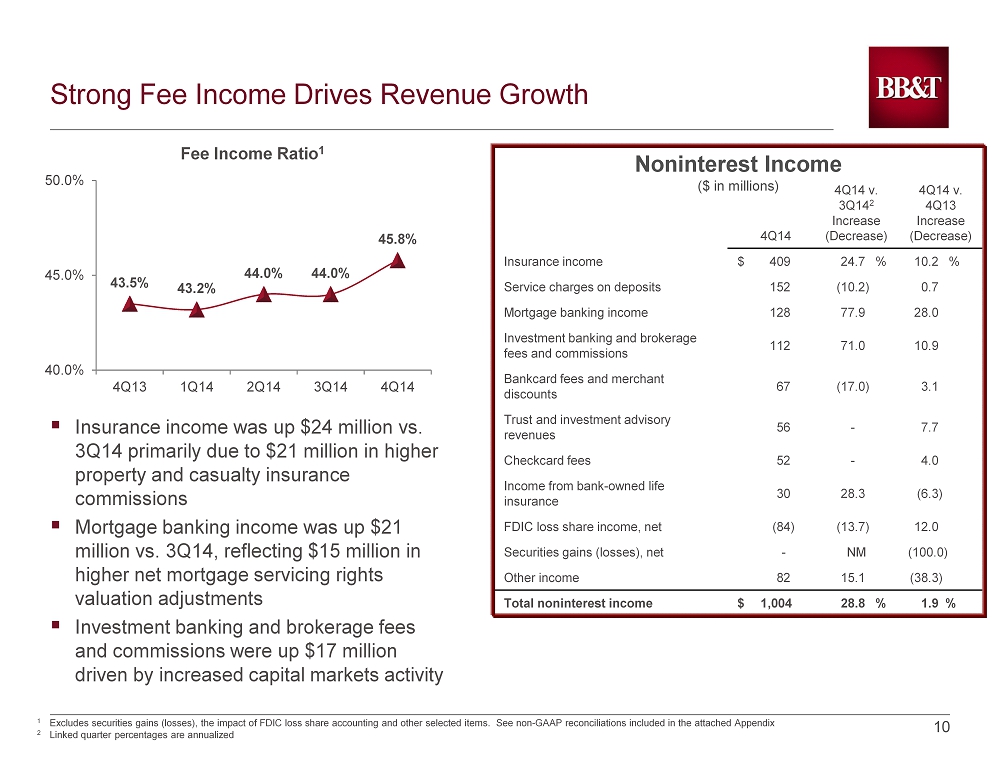
10 10 Strong Fee Income Drives Revenue Growth ▪ Insurance income was up $24 million vs. 3Q14 primarily due to $21 million in higher property and casualty insurance commissions ▪ Mortgage banking income was up $21 million vs. 3Q14, reflecting $15 million in higher net mortgage servicing rights valuation adjustments ▪ Investment banking and brokerage fees and commissions were up $17 million driven by increased capital markets activity 43.5% 43.2% 44.0% 44.0% 45.8% 40.0% 45.0% 50.0% 4Q13 1Q14 2Q14 3Q14 4Q14 Fee Income Ratio 1 4Q14 4Q14 v. 3Q14 2 Increase (Decrease) 4Q14 v. 4Q13 Increase (Decrease) Insurance income $ 409 24.7 % 10.2 % Service charges on deposits 152 (10.2) 0.7 Mortgage banking income 128 77.9 28.0 Investment banking and brokerage fees and commissions 112 71.0 10.9 Bankcard fees and merchant discounts 67 (17.0) 3.1 Trust and investment advisory revenues 56 - 7.7 Checkcard fees 52 - 4.0 Income from bank - owned life insurance 30 28.3 (6.3) FDIC loss share income, net (84) (13.7) 12.0 Securities gains (losses), net - NM (100.0) Other income 82 15.1 (38.3) Total noninterest income $ 1,004 28.8 % 1.9 % Noninterest Income ($ in millions) 1 Excludes securities gains (losses), the impact of FDIC loss share accounting and other selected items. See non - GAAP reconcilia tions included in the attached Appendix 2 Linked quarter percentages are annualized
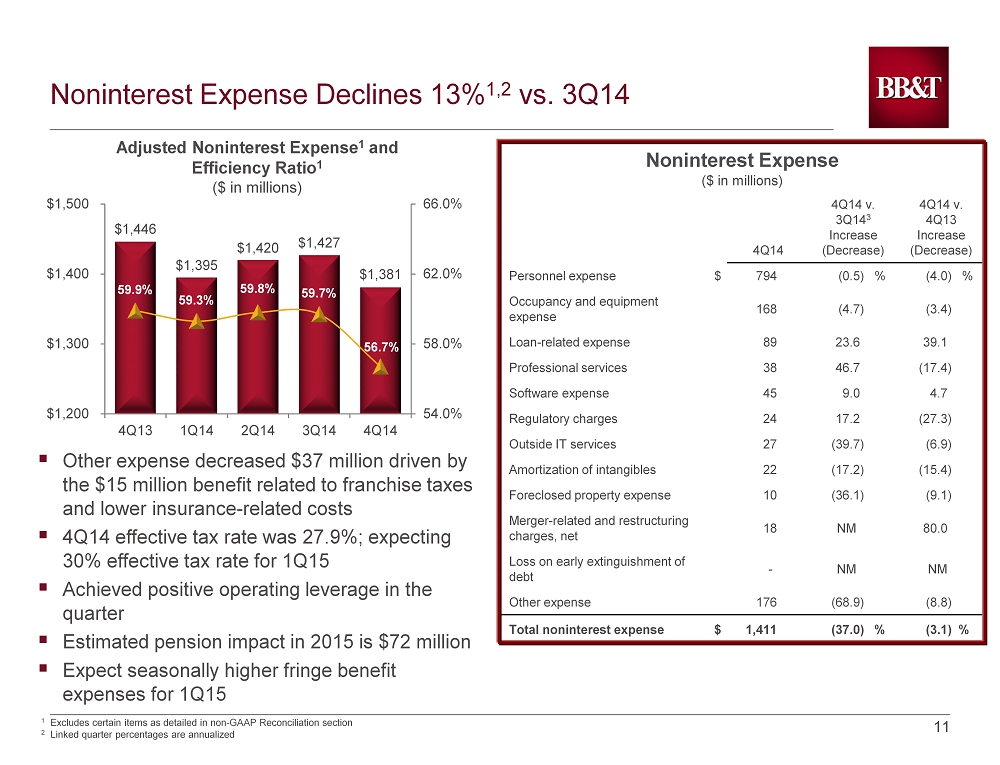
11 11 Noninterest Expense Declines 13% 1,2 vs. 3Q14 ▪ Other expense decreased $37 million driven by the $15 million benefit related to franchise taxes and lower insurance - related costs ▪ 4Q14 effective tax rate was 27.9%; expecting 30% effective tax rate for 1Q15 ▪ Achieved positive operating leverage in the quarter ▪ Estimated pension impact in 2015 is $72 million ▪ Expect seasonally higher fringe benefit expenses for 1Q15 $1,446 $1,395 $1,420 $1,427 $1,381 59.9% 59.3% 59.8% 59.7% 56.7% 54.0% 58.0% 62.0% 66.0% $1,200 $1,300 $1,400 $1,500 4Q13 1Q14 2Q14 3Q14 4Q14 Adjusted Noninterest Expense 1 and Efficiency Ratio 1 ($ in millions) 4Q14 4Q14 v. 3Q14 3 Increase (Decrease) 4Q14 v. 4Q13 Increase (Decrease) Personnel expense $ 794 (0.5) % (4.0) % Occupancy and equipment expense 168 (4.7) (3.4) Loan - related expense 89 23.6 39.1 Professional services 38 46.7 (17.4) Software expense 45 9.0 4.7 Regulatory charges 24 17.2 (27.3) Outside IT services 27 (39.7) (6.9) Amortization of intangibles 22 (17.2) (15.4) Foreclosed property expense 10 (36.1) (9.1) Merger - related and restructuring charges, net 18 NM 80.0 Loss on early extinguishment of debt - NM NM Other expense 176 (68.9) (8.8) Total noninterest expense $ 1,411 (37.0) % (3.1) % Noninterest Expense ($ in millions) 1 Excludes certain items as detailed in non - GAAP Reconciliation section 2 Linked quarter percentages are annualized
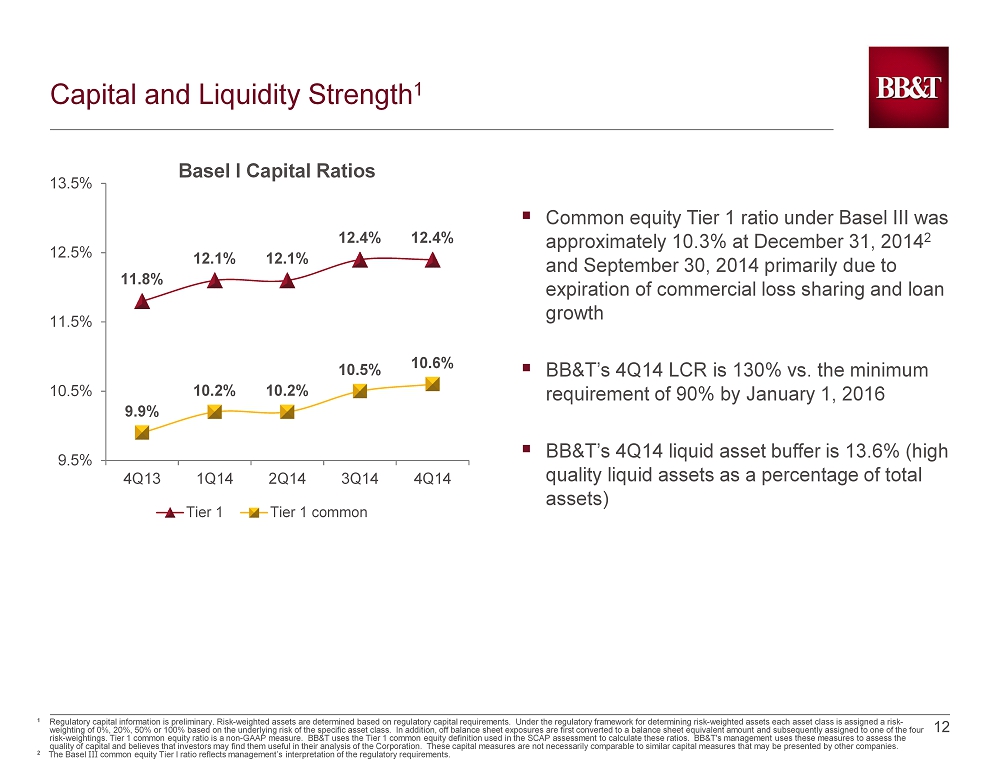
12 12 Capital and Liquidity Strength 1 11.8% 12.1% 12.1% 12.4% 12.4% 9.9% 10.2% 10.2% 10.5% 10.6% 9.5% 10.5% 11.5% 12.5% 13.5% 4Q13 1Q14 2Q14 3Q14 4Q14 Tier 1 Tier 1 common ▪ Common equity Tier 1 ratio under Basel III was approximately 10.3% at December 31, 2014 2 and September 30, 2014 primarily due to expiration of commercial loss sharing and loan growth ▪ BB&T’s 4Q14 LCR is 130% vs. the minimum requirement of 90% by January 1, 2016 ▪ BB&T’s 4Q14 liquid asset buffer is 13.6% (high quality liquid assets as a percentage of total assets) 1 Regulatory capital information is preliminary. Risk - weighted assets are determined based on regulatory capital requirements. Un der the regulatory framework for determining risk - weighted assets each asset class is assigned a risk - weighting of 0%, 20%, 50% or 100% based on the underlying risk of the specific asset class. In addition, off balance sheet e xpo sures are first converted to a balance sheet equivalent amount and subsequently assigned to one of the four risk - weightings. Tier 1 common equity ratio is a non - GAAP measure. BB&T uses the Tier 1 common equity definition used in the SC AP assessment to calculate these ratios. BB&T's management uses these measures to assess the quality of capital and believes that investors may find them useful in their analysis of the Corporation. These capital meas ure s are not necessarily comparable to similar capital measures that may be presented by other companies. 2 The Basel III common equity Tier I ratio reflects management’s interpretation of the regulatory requirements. Basel I Capital Ratios
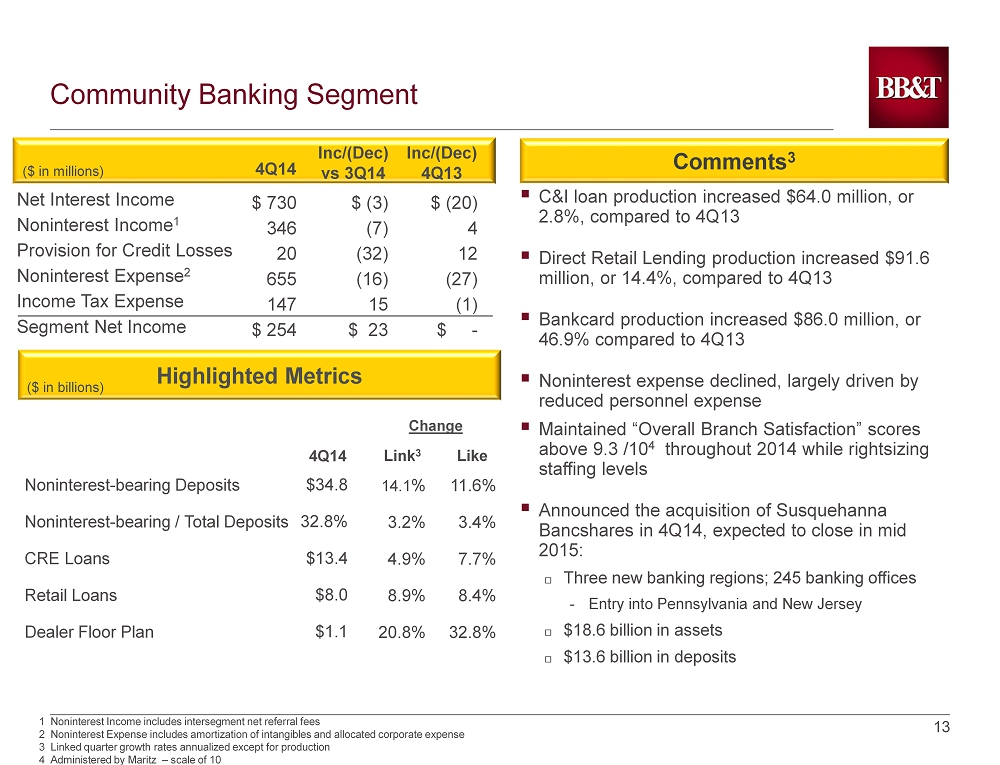
13 13 ($ in millions) Inc/(Dec) vs 3Q14 Inc/(Dec) 4Q13 4Q14 Comments 3 Net Interest Income Noninterest Income 1 Provision for Credit Losses Noninterest Expense 2 Income Tax Expense Segment Net Income Highlighted Metrics $ 730 346 20 655 147 $ 254 $ (3) (7) (32) (16) 15 $ 23 $ (20) 4 12 (27) (1) $ - ($ in billions) 1 Noninterest Income includes intersegment net referral fees 2 Noninterest Expense includes amortization of intangibles and allocated corporate expense 3 Linked quarter growth rates annualized except for production 4 Administered by Maritz – scale of 10 4 Q14 Like Noninterest - bearing Deposits Noninterest - bearing / Total Deposits CRE Loans Retail Loans Dealer Floor Plan $34.8 32.8% $13.4 $8.0 $1.1 11.6% 3.4% 7.7% 8.4% 32.8% Link 3 14.1 % 3.2% 4.9% 8.9% 20.8% Change Community Banking Segment ▪ C&I loan production increased $64.0 million, or 2.8%, compared to 4Q13 ▪ Direct Retail Lending production increased $91.6 million, or 14.4%, compared to 4Q13 ▪ Bankcard production increased $86.0 million, or 46.9% compared to 4Q13 ▪ Noninterest expense declined, largely driven by reduced personnel expense ▪ Maintained “Overall Branch Satisfaction” scores above 9.3 / 10 4 throughout 2014 while rightsizing staffing levels ▪ Announced the acquisition of Susquehanna Bancshares in 4Q14, expected to close in mid 2015: Three new banking regions; 245 banking offices - Entry into Pennsylvania and New Jersey $18.6 billion in assets $13.6 billion in deposits
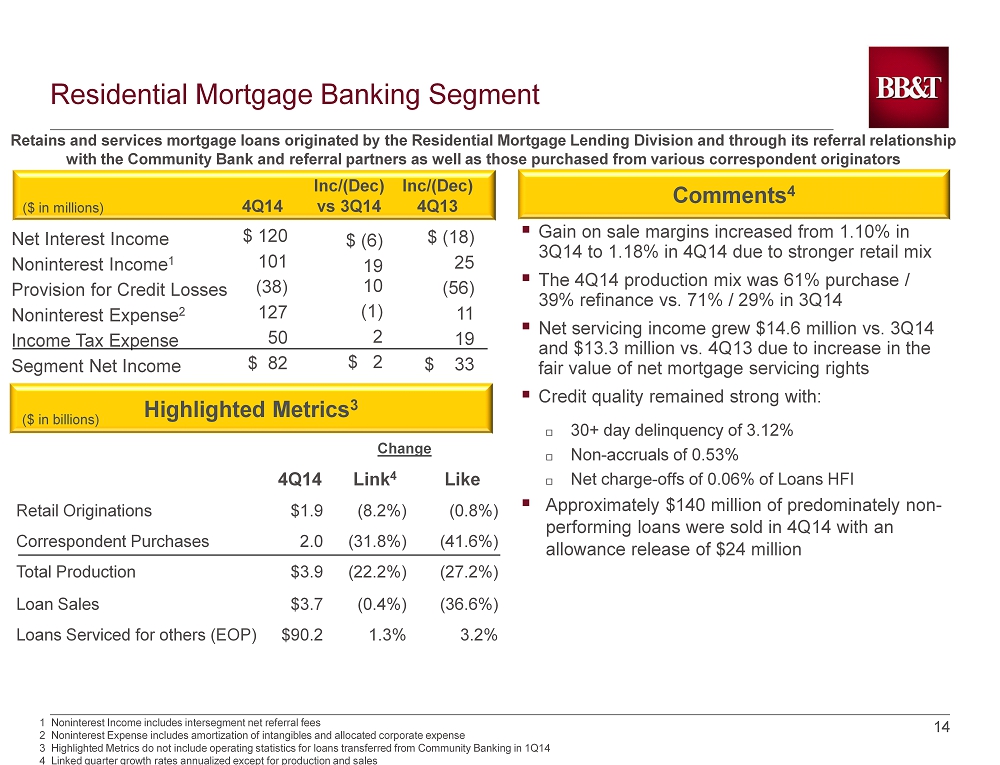
14 14 Retains and services mortgage loans originated by the Residential Mortgage Lending Division and through its referral relation shi p with the Community Bank and referral partners as well as those purchased from various correspondent originators ($ in millions) Inc /(Dec) vs 3Q14 Inc/(Dec) 4Q13 4Q14 Comments 4 Net Interest Income Noninterest Income 1 Provision for Credit Losses Noninterest Expense 2 Income Tax Expense Segment Net Income Highlighted Metrics 3 $ 120 101 (38) 127 50 $ 82 $ (6) 19 10 (1) 2 $ 2 $ (18) 25 (56) 11 19 $ 33 ($ in billions) 1 Noninterest Income includes intersegment net referral fees 2 Noninterest Expense includes amortization of intangibles and allocated corporate expense 3 Highlighted Metrics do not include operating statistics for loans transferred from Community Banking in 1Q14 4 Linked quarter growth rates annualized except for production and sales Change 4Q14 Link 4 Like Retail Originations $1.9 (8.2%) (0.8%) Correspondent Purchases 2.0 (31.8%) (41.6%) Total Production $3.9 (22.2%) (27.2%) Loan Sales $3.7 (0.4%) (36.6%) Loans Serviced for others (EOP) $90.2 1.3% 3.2% Residential Mortgage Banking Segment ▪ Gain on sale margins increased from 1.10% in 3Q14 to 1.18% in 4Q14 due to stronger retail mix ▪ The 4Q14 production mix was 61% purchase / 39% refinance vs. 71% / 29% in 3Q14 ▪ Net servicing income grew $ 14.6 million vs. 3Q14 and $ 13.3 million vs. 4Q13 due to increase in the fair value of net mortgage servicing rights ▪ Credit quality remained strong with: 30+ day delinquency of 3.12% Non - accruals of 0.53% Net charge - offs of 0.06% of Loans HFI ▪ Approximately $ 140 million of predominately non - performing loans were sold in 4Q14 with an allowance release of $24 million
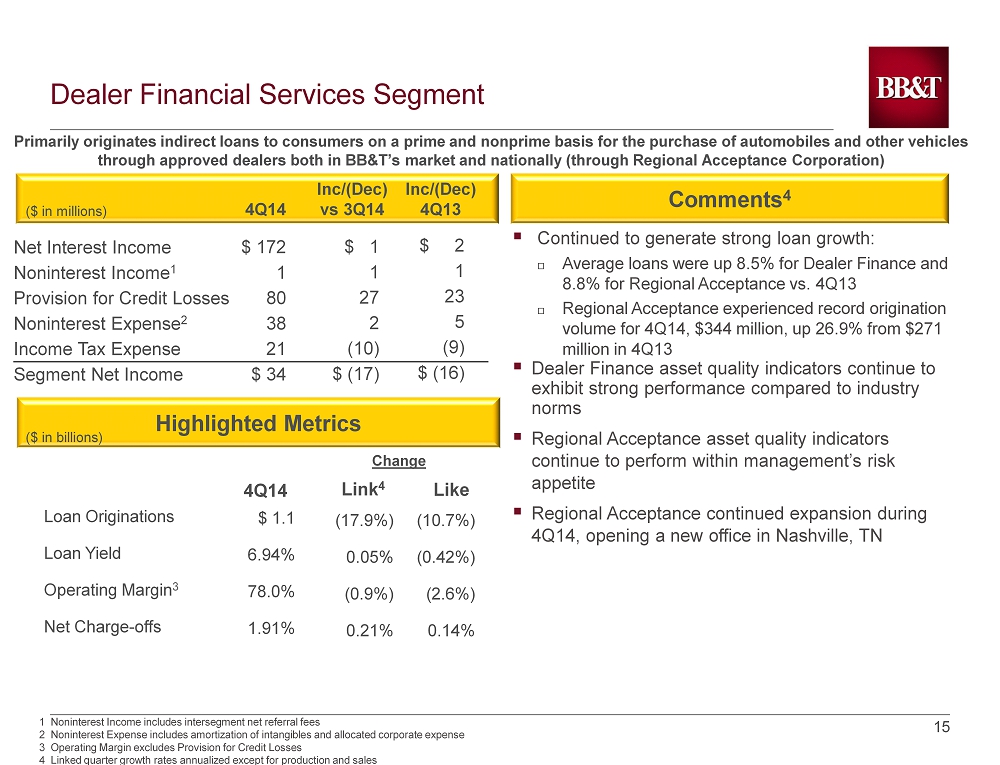
15 15 Primarily originates indirect loans to consumers on a prime and nonprime basis for the purchase of automobiles and other vehi cle s through approved dealers both in BB&T’s market and nationally (through Regional Acceptance Corporation) Comments 4 ($ in millions) Inc /(Dec) vs 3Q14 Inc /(Dec) 4Q13 4Q14 Net Interest Income Noninterest Income 1 Provision for Credit Losses Noninterest Expense 2 Income Tax Expense Segment Net Income Highlighted Metrics 4Q14 Like $ 172 1 80 38 21 $ 34 $ 1 1 27 2 (10) $ (17) $ 2 1 23 5 (9) $ (16) Loan Originations Loan Yield Operating Margin 3 Net Charge - offs $ 1.1 6.94% 78.0% 1.91% (10.7%) (0.42%) (2.6%) 0.14% 1 Noninterest Income includes intersegment net referral fees 2 Noninterest Expense includes amortization of intangibles and allocated corporate expense 3 Operating Margin excludes Provision for Credit Losses 4 Linked quarter growth rates annualized except for production and sales ($ in billions) Link 4 (17.9%) 0.05% (0.9%) 0.21% Change Dealer Financial Services Segment ▪ C ontinued to generate strong loan growth: Average loans were up 8.5% for Dealer Finance and 8.8% for Regional Acceptance vs. 4Q13 Regional Acceptance experienced record origination volume for 4Q14, $344 million, up 26.9% from $271 million in 4Q13 ▪ Dealer Finance asset quality indicators continue to exhibit strong performance compared to industry norms ▪ Regional Acceptance asset quality indicators continue to perform within management’s risk appetite ▪ Regional Acceptance continued expansion during 4Q14, opening a new office in Nashville, TN
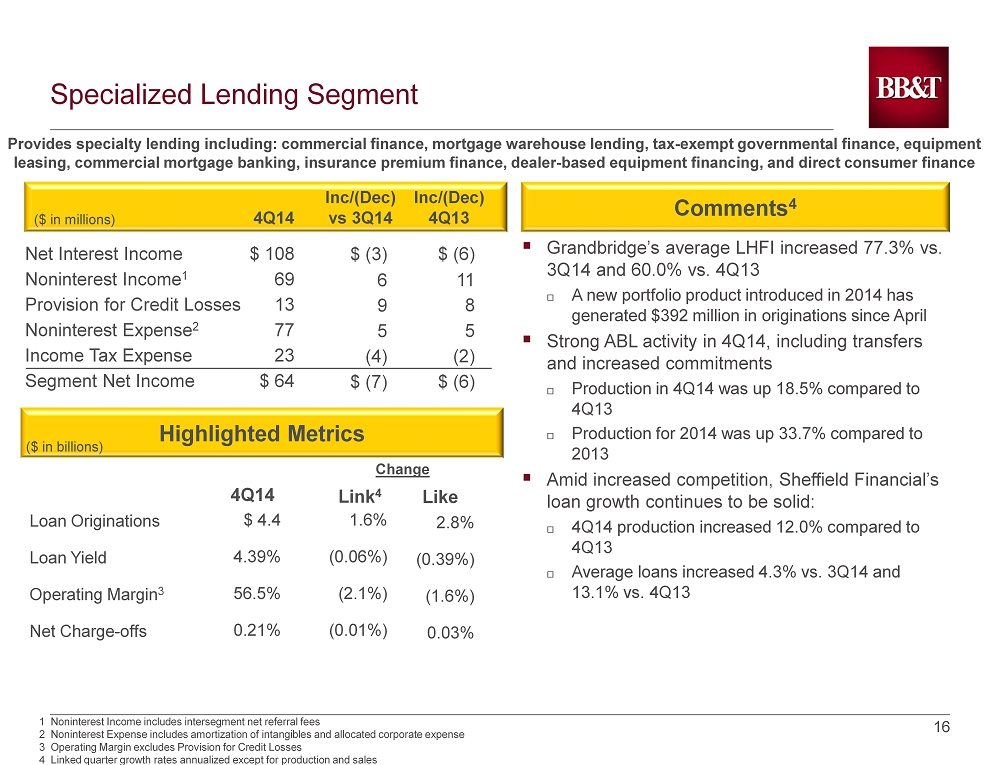
16 16 Provides specialty lending including: commercial finance, mortgage warehouse lending, tax - exempt governmental finance, equipment leasing, commercial mortgage banking, insurance premium finance, dealer - based equipment financing, and direct consumer finance Comments 4 ($ in millions) Inc/(Dec) vs 3Q14 Inc /(Dec) 4Q13 4Q14 Net Interest Income Noninterest Income 1 Provision for Credit Losses Noninterest Expense 2 Income Tax Expense Segment Net Income Highlighted Metrics 4Q14 Like $ 108 69 13 77 23 $ 64 $ (3) 6 9 5 (4) $ (7) $ (6) 11 8 5 (2) $ (6) ($ in billions) Loan Originations Loan Yield Operating Margin 3 Net Charge - offs $ 4.4 4.39% 56.5% 0.21% 2.8% (0.39%) (1.6%) 0.03% 1 Noninterest Income includes intersegment net referral fees 2 Noninterest Expense includes amortization of intangibles and allocated corporate expense 3 Operating Margin excludes Provision for Credit Losses 4 Linked quarter growth rates annualized except for production and sales 1.6% (0.06%) (2.1%) (0.01%) Link 4 Change Specialized Lending Segment ▪ Grandbridge’s average LHFI increased 77.3% vs . 3Q14 and 60.0% vs. 4Q13 A new portfolio product introduced in 2014 has generated $392 million in originations since April ▪ Strong ABL activity in 4Q14, including transfers and increased commitments Production in 4Q14 was up 18.5% compared to 4Q13 Production for 2014 was up 33.7% compared to 2013 ▪ Amid increased competition, Sheffield Financial’s loan growth continues to be solid: 4Q14 production increased 12.0% compared to 4Q13 Average loans increased 4.3% vs . 3Q14 and 13.1% vs. 4Q13
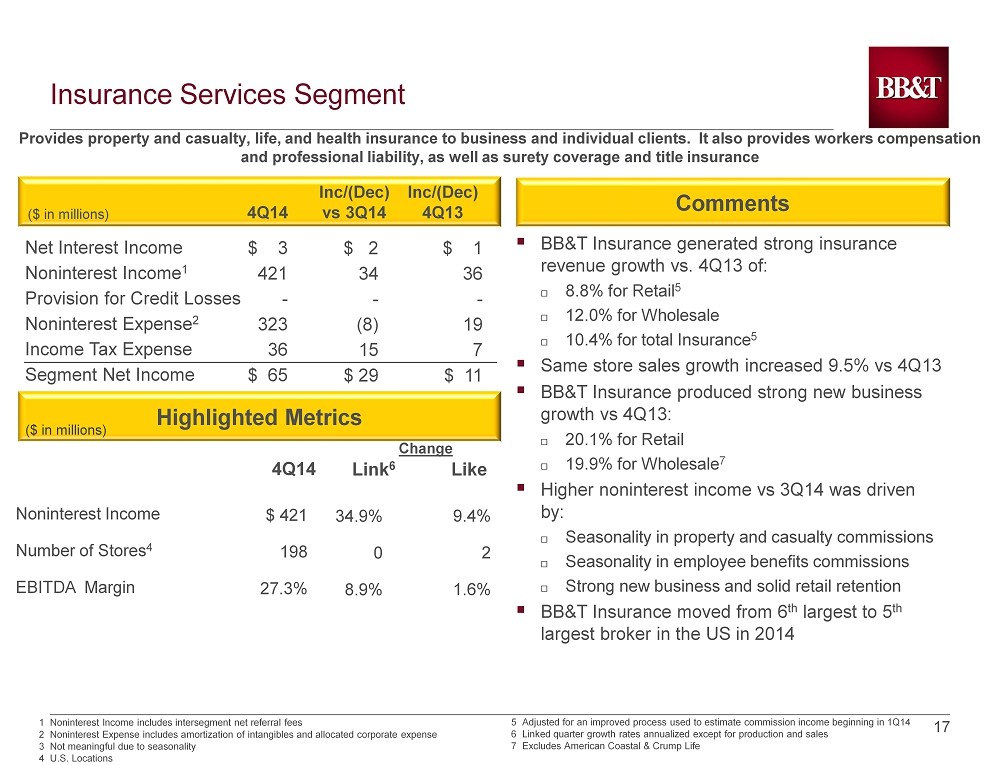
17 17 Comments ($ in millions) Inc/(Dec) vs 3Q14 Inc/(Dec) 4Q13 4Q14 Net Interest Income Noninterest Income 1 Provision for Credit Losses Noninterest Expense 2 Income Tax Expense Segment Net Income Highlighted Metrics Noninterest Income Number of Stores 4 EBITDA Margin 4Q14 Like Provides property and casualty, life, and health insurance to business and individual clients. It also provides workers comp ens ation and professional liability, as well as surety coverage and title insurance $ 3 421 - 323 36 $ 65 $ 2 34 - (8) 15 $ 29 $ 1 36 - 19 7 $ 11 $ 421 198 27.3% 9.4% 2 1.6% Change 34.9% 0 8.9% Link 6 ($ in millions ) Insurance Services Segment ▪ BB&T Insurance generated strong insurance revenue growth vs. 4Q13 of: 8.8% for Retail 5 12.0% for Wholesale 10.4% for total Insurance 5 ▪ Same store sales growth increased 9.5% vs 4Q13 ▪ BB&T Insurance produced strong new business growth vs 4Q13: 20.1% for Retail 19.9% for Wholesale 7 ▪ Higher noninterest income vs 3Q14 was driven by: Seasonality in property and casualty commissions Seasonality in employee benefits commissions Strong new business and solid retail retention ▪ BB&T Insurance moved from 6 th largest to 5 th largest broker in the US in 2014 1 Noninterest Income includes intersegment net referral fees 2 Noninterest Expense includes amortization of intangibles and allocated corporate expense 3 Not meaningful due to seasonality 4 U.S . Locations 5 Adjusted for an improved process used to estimate commission income beginning in 1Q14 6 Linked quarter growth rates annualized except for production and sales 7 Excludes American Coastal & Crump Life

18 18 Provides trust services, wealth management, investment counseling, asset management, estate planning, employee benefits, corporate banking, and capital market services to individuals, corporations, governments, and other organizations Comments 4 ($ in millions) Inc/(Dec) vs 3Q14 Inc/(Dec) 4Q13 4Q14 Net Interest Income Noninterest Income 1 Provision for Credit Losses Noninterest Expense 2 Income Tax Expense Segment Net Income Highlighted Metrics Average Loan Balances Average Deposits Total Invested Assets Invested Assets Noninterest Income ($ in millions ) Operating Margin 3 4Q14 Like $ 120 230 18 203 49 $ 80 $ 8 36 14 15 6 $ 9 $ 12 16 21 18 (4) $ (7) $ 11.4 $ 26.8 $ 119.0 $ 123.8 42.0% 1 Noninterest Income includes intersegment net referral fees 2 Noninterest Expense includes amortization of intangibles and allocated corporate expense 3 Operating Margin excludes Provision for Credit Losses 4 Linked quarter growth rates annualized except for production and sales ($ in billions) Link 4 23.9% 22.1% 7.6% (4.5%) 3.4% Change 27.3% 10.7% 7.0% 7.7% (0.5%) Financial Services Segment ▪ Average loan and deposit growth was driven by : Corporate Banking, which generated - 23.3% loan growth vs. 3Q14 - 27.2% loan growth vs. 4Q13 BB&T Wealth, which generated - 32.4% loan growth and 23.7% transaction deposit growth vs. 3Q14 - 32.4% loan growth and 22.5% transaction deposit growth vs. 4Q13 ▪ Retirement and Institutional Services received 33 Best in Class Awards in the annual PlanSponso r survey ▪ Increase in noninterest income vs. 3Q14 was driven by higher SBIC partnership income and Equity Capital Markets investment banking income ▪ Wealth Lending production increased 80.6% YTD December 2014 vs. YTD December 2013 ▪ BB&T Scott & Stringfellow opened a retail office in Lexington, KY

19

20
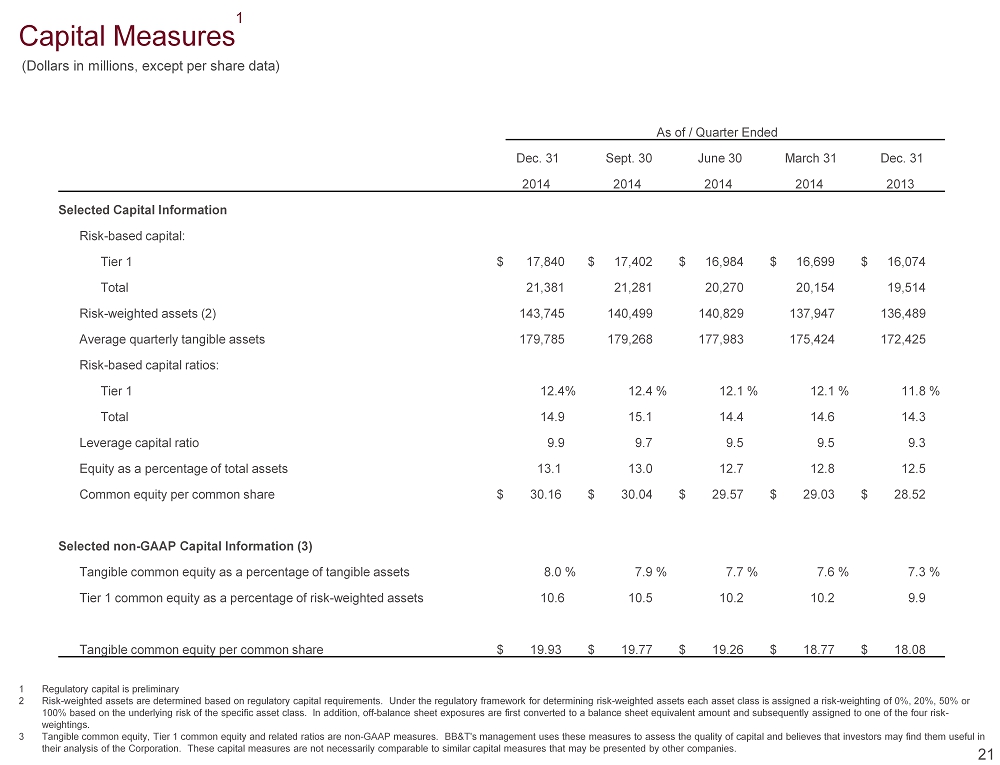
As of / Quarter Ended Dec. 31 Sept. 30 June 30 March 31 Dec. 31 2014 2014 2014 2014 2013 Selected Capital Information Risk - based capital: Tier 1 $ 17,840 $ 17,402 $ 16,984 $ 16,699 $ 16,074 Total 21,381 21,281 20,270 20,154 19,514 Risk - weighted assets (2) 143,745 140,499 140,829 137,947 136,489 Average quarterly tangible assets 179,785 179,268 177,983 175,424 172,425 Risk - based capital ratios: Tier 1 12.4 % 12.4 % 12.1 % 12.1 % 11.8 % Total 14.9 15.1 14.4 14.6 14.3 Leverage capital ratio 9.9 9.7 9.5 9.5 9.3 Equity as a percentage of total assets 13.1 13.0 12.7 12.8 12.5 Common equity per common share $ 30.16 $ 30.04 $ 29.57 $ 29.03 $ 28.52 Selected non - GAAP Capital Information (3) Tangible common equity as a percentage of tangible assets 8.0 % 7.9 % 7.7 % 7.6 % 7.3 % Tier 1 common equity as a percentage of risk - weighted assets 10.6 10.5 10.2 10.2 9.9 Tangible common equity per common share $ 19.93 $ 19.77 $ 19.26 $ 18.77 $ 18.08 Capital Measures 1 (Dollars in millions, except per share data) 1 2 Regulatory capital is preliminary Risk - weighted assets are determined based on regulatory capital requirements. Under the regulatory framework for determining risk - weighted as sets each asset class is assigned a risk - weighting of 0%, 20%, 50% or 100% based on the underlying risk of the specific asset class. In addition, off - balance sheet exposures are first converted to a balance sheet equivalent amount and subsequently assigned to one of the four risk - weightings. 3 Tangible common equity, Tier 1 common equity and related ratios are non - GAAP measures. BB&T's management uses these measures to assess the quality of capital and believes that investors may find them useful in their analysis of the Corporation. These capital measures are not necessarily comparable to similar capital measures that ma y b e presented by other companies. 21
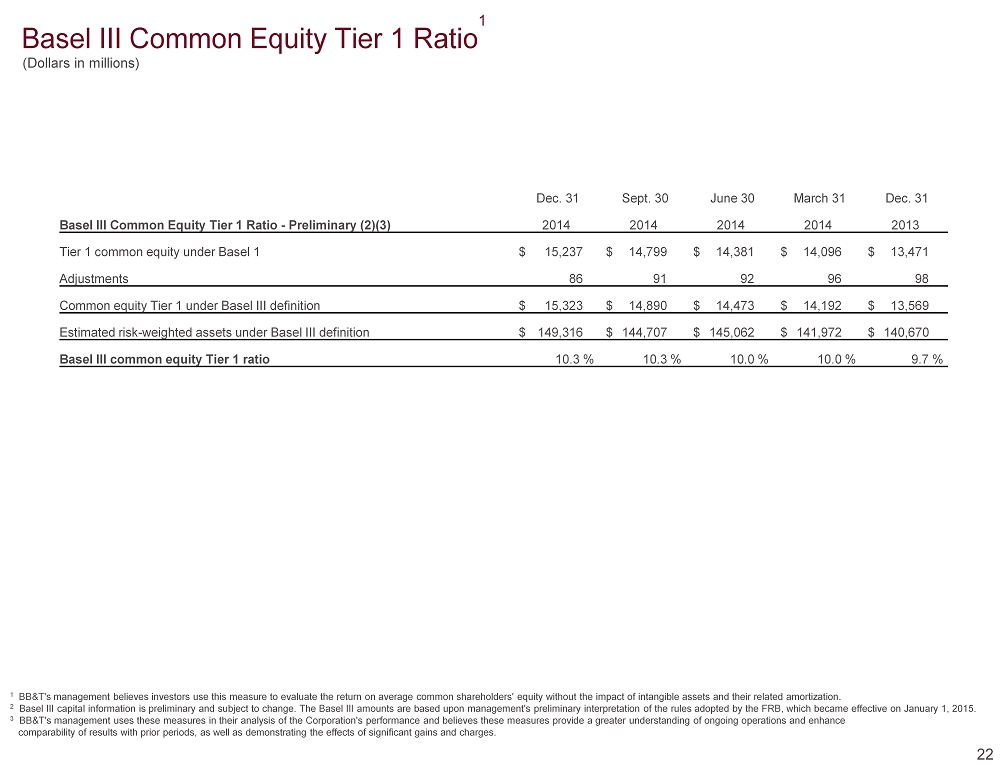
Basel III Common Equity Tier 1 Ratio 1 22 (Dollars in millions) Dec. 31 Sept. 30 June 30 March 31 Dec. 31 Basel III Common Equity Tier 1 Ratio - Preliminary (2)(3) 2014 2014 2014 2014 2013 Tier 1 common equity under Basel 1 $ 15,237 $ 14,799 $ 14,381 $ 14,096 $ 13,471 Adjustments 86 91 92 96 98 Common equity Tier 1 under Basel III definition $ 15,323 $ 14,890 $ 14,473 $ 14,192 $ 13,569 Estimated risk - weighted assets under Basel III definition $ 149,316 $ 144,707 $ 145,062 $ 141,972 $ 140,670 Basel III common equity Tier 1 ratio 10.3 % 10.3 % 10.0 % 10.0 % 9.7 % 1 BB&T's management believes investors use this measure to evaluate the return on average common shareholders' equity without the impa ct of intangible assets and their related amortization . 2 Basel III capital information is preliminary and subject to change. The Basel III amounts are based upon management's preliminary i nte rpretation of the rules adopted by the FRB, which became effective on January 1, 2015. 3 BB&T's management uses these measures in their analysis of the Corporation's performance and believes these measures provide a great er understanding of ongoing operations and enhance comparability of results with prior periods, as well as demonstrating the effects of significant gains and charges.
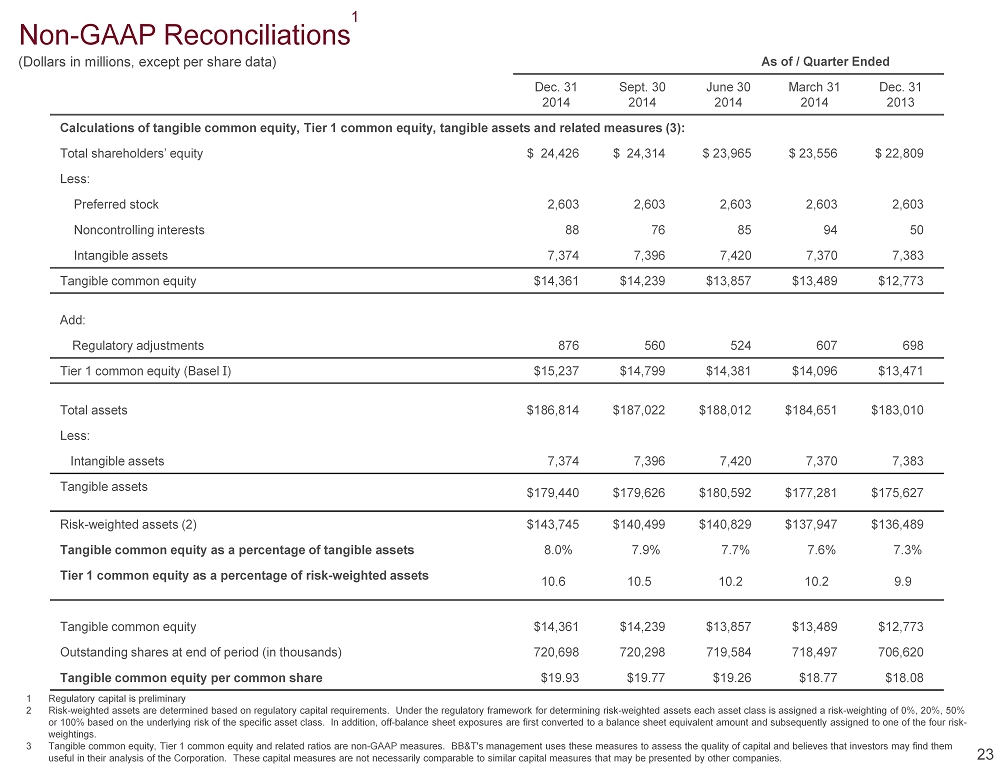
Non - GAAP Reconciliations 1 As of / Quarter Ended Dec. 31 2014 Sept. 30 2014 June 30 2014 March 31 2014 Dec. 31 2013 Calculations of tangible common equity, Tier 1 common equity, tangible assets and related measures (3): Total shareholders’ equity $ 24,426 $ 24,314 $ 23,965 $ 23,556 $ 22,809 Less: Preferred stock 2,603 2,603 2,603 2,603 2,603 Noncontrolling interests 88 76 85 94 50 Intangible assets 7,374 7,396 7,420 7,370 7,383 Tangible common equity $14,361 $14,239 $13,857 $13,489 $12,773 Add: Regulatory adjustments 876 560 524 607 698 Tier 1 common equity (Basel I ) $15,237 $14,799 $14,381 $14,096 $13,471 Total assets $186,814 $187,022 $188,012 $184,651 $183,010 Less: Intangible assets 7,374 7,396 7,420 7,370 7,383 Tangible assets $179,440 $179,626 $180,592 $177,281 $175,627 Risk - weighted assets (2) $143,745 $140,499 $140,829 $137,947 $136,489 Tangible common equity as a percentage of tangible assets 8.0% 7.9% 7.7% 7.6% 7.3% Tier 1 common equity as a percentage of risk - weighted assets 10.6 10.5 10.2 10.2 9.9 Tangible common equity $14,361 $14,239 $13,857 $13,489 $12,773 Outstanding shares at end of period (in thousands) 720,698 720,298 719,584 718,497 706,620 Tangible common equity per common share $19.93 $19.77 $19.26 $18.77 $18.08 23 (Dollars in millions, except per share data) 1 2 Regulatory capital is preliminary Risk - weighted assets are determined based on regulatory capital requirements. Under the regulatory framework for determining risk - weighted as sets each asset class is assigned a risk - weighting of 0%, 20%, 50% or 100% based on the underlying risk of the specific asset class. In addition, off - balance sheet exposures are first converted to a balance sheet equivalent amount and subsequently assigned to one of the four risk - weightings. 3 Tangible common equity, Tier 1 common equity and related ratios are non - GAAP measures. BB&T's management uses these measures to assess the quality of capital and believes that investors may find them useful in their analysis of the Corporation. These capital measures are not necessarily comparable to similar capital measur es that may be presented by other companies.
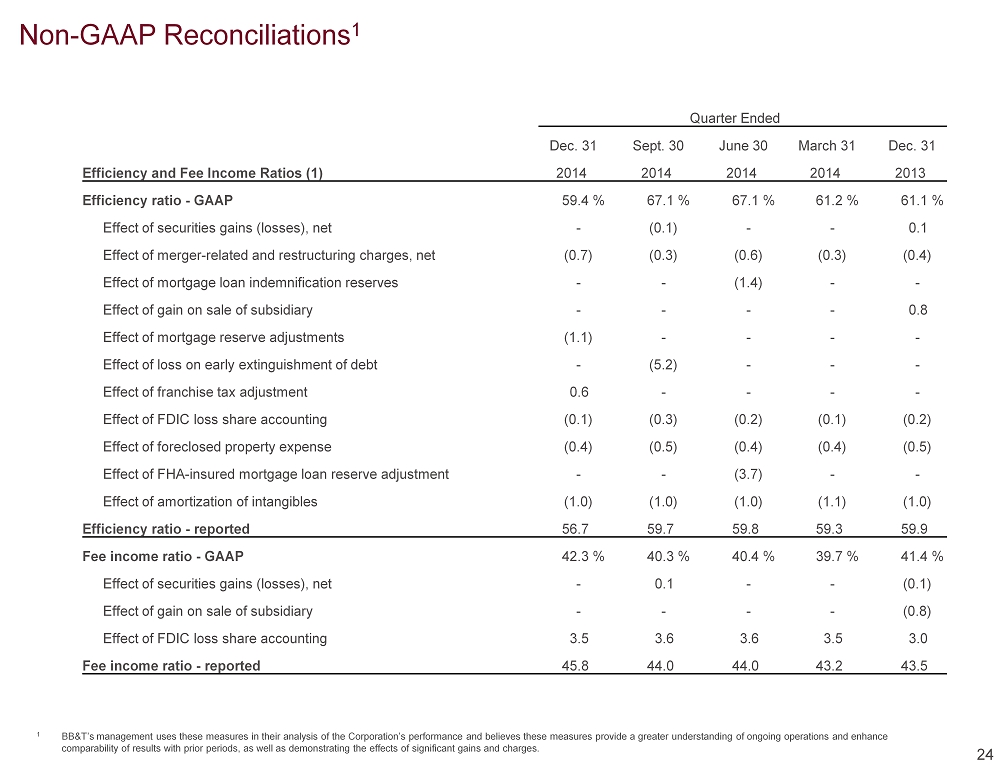
Non - GAAP Reconciliations 1 24 1 BB&T’s management uses these measures in their analysis of the Corporation’s performance and believes these measures provide a greater understanding of ongoing operations and enhance comparability of results with prior periods, as well as demonstrating the effects of significant gains and charges. Quarter Ended Dec. 31 Sept. 30 June 30 March 31 Dec. 31 Efficiency and Fee Income Ratios (1) 2014 2014 2014 2014 2013 Efficiency ratio - GAAP 59.4 % 67.1 % 67.1 % 61.2 % 61.1 % Effect of securities gains (losses), net - (0.1) - - 0.1 Effect of merger - related and restructuring charges, net (0.7) (0.3) (0.6) (0.3) (0.4) Effect of mortgage loan indemnification reserves - - (1.4) - - Effect of gain on sale of subsidiary - - - - 0.8 Effect of mortgage reserve adjustments (1.1) - - - - Effect of loss on early extinguishment of debt - (5.2) - - - Effect of franchise tax adjustment 0.6 - - - - Effect of FDIC loss share accounting (0.1) (0.3) (0.2) (0.1) (0.2) Effect of foreclosed property expense (0.4) (0.5) (0.4) (0.4) (0.5) Effect of FHA - insured mortgage loan reserve adjustment - - (3.7) - - Effect of amortization of intangibles (1.0) (1.0) (1.0) (1.1) (1.0) Efficiency ratio - reported 56.7 59.7 59.8 59.3 59.9 Fee income ratio - GAAP 42.3 % 40.3 % 40.4 % 39.7 % 41.4 % Effect of securities gains (losses), net - 0.1 - - (0.1) Effect of gain on sale of subsidiary - - - - (0.8) Effect of FDIC loss share accounting 3.5 3.6 3.6 3.5 3.0 Fee income ratio - reported 45.8 44.0 44.0 43.2 43.5
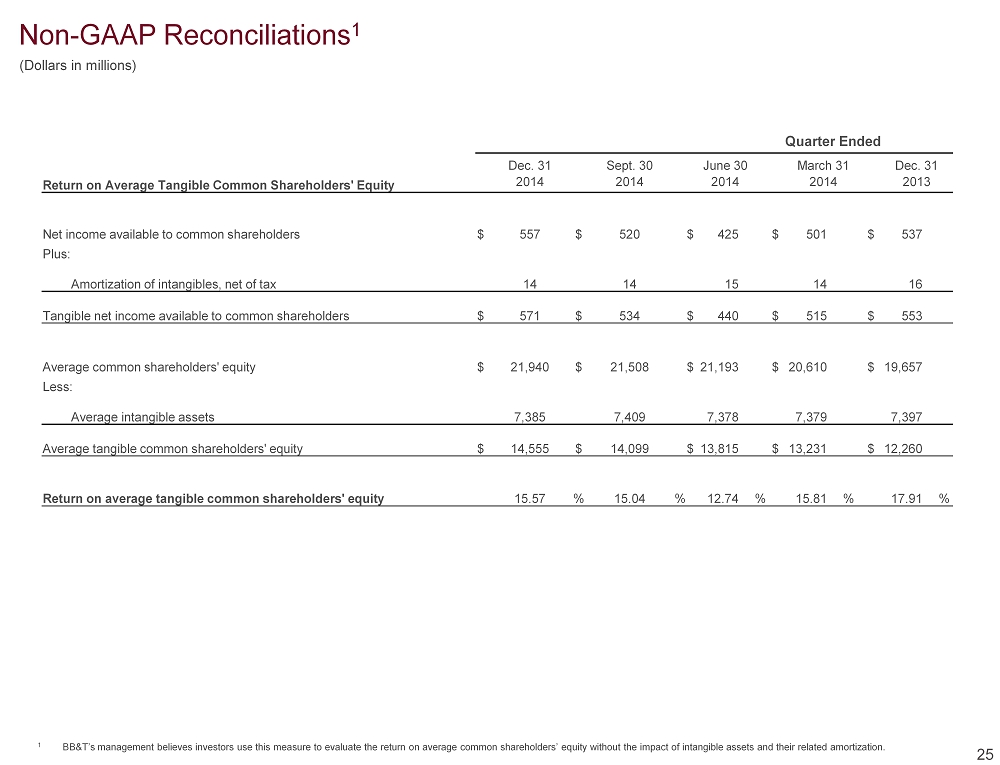
Quarter Ended Dec. 31 Sept. 30 June 30 March 31 Dec. 31 Return on Average Tangible Common Shareholders' Equity 2014 2014 2014 2014 2013 Net income available to common shareholders $ 557 $ 520 $ 425 $ 501 $ 537 Plus: Amortization of intangibles, net of tax 14 14 15 14 16 Tangible net income available to common shareholders $ 571 $ 534 $ 440 $ 515 $ 553 Average common shareholders' equity $ 21,940 $ 21,508 $ 21,193 $ 20,610 $ 19,657 Less: Average intangible assets 7,385 7,409 7,378 7,379 7,397 Average tangible common shareholders' equity $ 14,555 $ 14,099 $ 13,815 $ 13,231 $ 12,260 Return on average tangible common shareholders' equity 15.57 % 15.04 % 12.74 % 15.81 % 17.91 % 25 1 BB&T’s management believes investors use this measure to evaluate the return on average common shareholders’ equity without t he impact of intangible assets and their related amortization. Non - GAAP Reconciliations 1 (Dollars in millions)
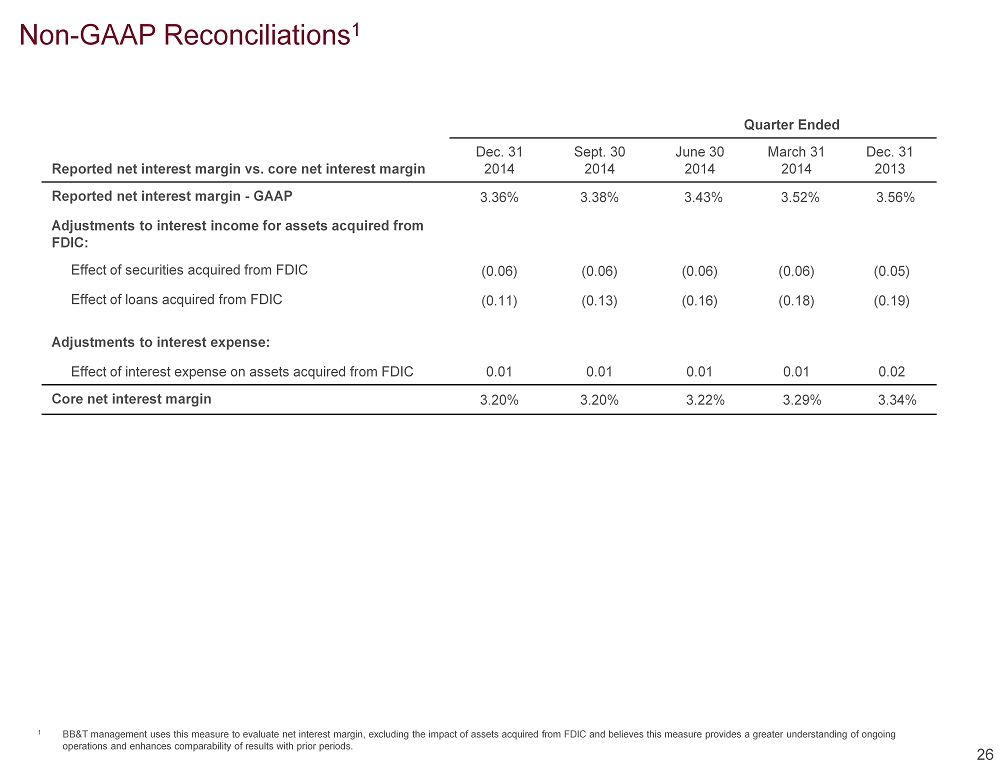
Non - GAAP Reconciliations 1 Quarter Ended Reported net interest margin vs. core net interest margin Dec. 31 2014 Sept. 30 2014 June 30 2014 March 31 2014 Dec. 31 2013 Reported net interest margin - GAAP 3.36% 3.38% 3.43% 3.52% 3.56% Adjustments to interest income for assets acquired from FDIC: Effect of securities acquired from FDIC (0.06) (0.06) (0.06) (0.06) (0.05) Effect of loans acquired from FDIC (0.11) (0.13) (0.16) (0.18) (0.19) Adjustments to interest expense: Effect of interest expense on assets acquired from FDIC 0.01 0.01 0.01 0.01 0.02 Core net interest margin 3.20% 3.20% 3.22% 3.29% 3.34% 26 1 BB&T management uses this measure to evaluate net interest margin, excluding the impact of assets acquired from FDIC and beli ev es this measure provides a greater understanding of ongoing operations and enhances comparability of results with prior periods.
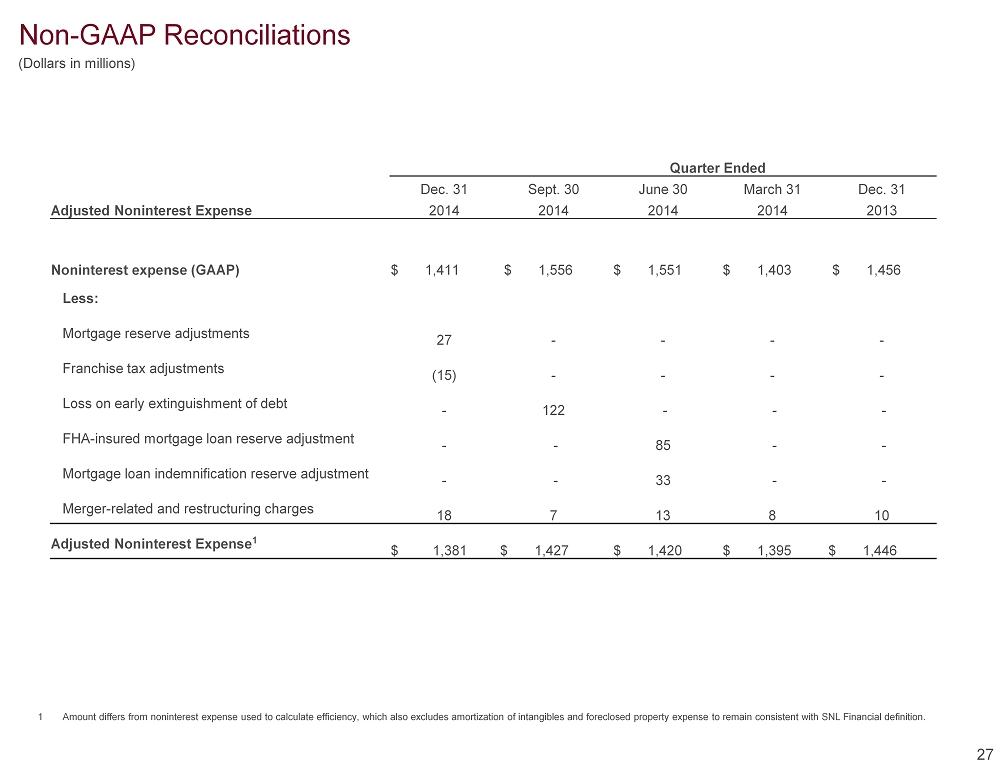
Non - GAAP Reconciliations 27 1 Amount differs from noninterest expense used to calculate efficiency, which also excludes amortization of intangibles and for ecl osed property expense to remain consistent with SNL Financial definition. Quarter Ended Dec. 31 Sept. 30 June 30 March 31 Dec. 31 Adjusted Noninterest Expense 2014 2014 2014 2014 2013 Noninterest expense (GAAP) $ 1 , 411 $ 1 , 556 $ 1 , 551 $ 1 , 403 $ 1 , 456 Less: Mortgage reserve adjustments 27 - - - - Franchise tax adjustments (15) - - - - Loss on early extinguishment of debt - 122 - - - FHA - insured mortgage loan reserve adjustment - - 85 - - Mortgage loan indemnification reserve adjustment - - 33 - - Merger - related and restructuring charges 18 7 13 8 10 Adjusted Noninterest Expense 1 $ 1 , 381 $ 1 , 427 $ 1 , 420 $ 1 , 395 $ 1 , 446 (Dollars in millions)