
CECL – The Lender’s Perspective Cindy Powell, Corporate Controller December 10, 2018 BB&T’s CECL program is under development and subject to continued testing; preliminary testing results contained herein are not necessarily indicative of the impact at adoption.

CECL Implementation Overview . Credit loss forecasting significantly enhanced through – 2009 Supervisory Capital Assessment Program (SCAP); and CCAR – Comprehensive Capital Analysis and Review (CCAR) . Foundational Models incorporated methodologies from ALLL recognizing the close Models relationship between loss forecasting, reserving, capital, and stress testing . Extensive use of models in BB&T risk management practices . CECL models heavily leverage CCAR investment . 11 framework models – C&I, CRE, Small Commercial, Mortgage, DRL, DFR, RAC, Bankcard - Retail and Comm., Sheffield and TDRs Model . Framework models will be leveraged for certain smaller portfolios (e.g., Premium Inventory Finance, CEC, etc.) . Each framework model has up to 9 model components designed to estimate probability of default, loss severity, payoffs/prepayments, etc. . Fit-for-purpose testing substantially complete – Model development continuing for certain smaller portfolios (e.g., Current Bankcard – Commercial); Status – Continued enhancements to certain model components . Sensitivity testing well underway; evaluates sensitivity to economic forecasts, length of reasonable and supportable period and reversion technique . Finalize decisions related to Reasonable and Supportable period and reversion technique Focus . Complete internal controls evaluation and design of CECL-related controls in 2019 . Execute on phased, parallel testing plan – Limited parallel testing in the 1st half of 2019; with more comprehensive testing anticipated in the 2nd half of 2019 2
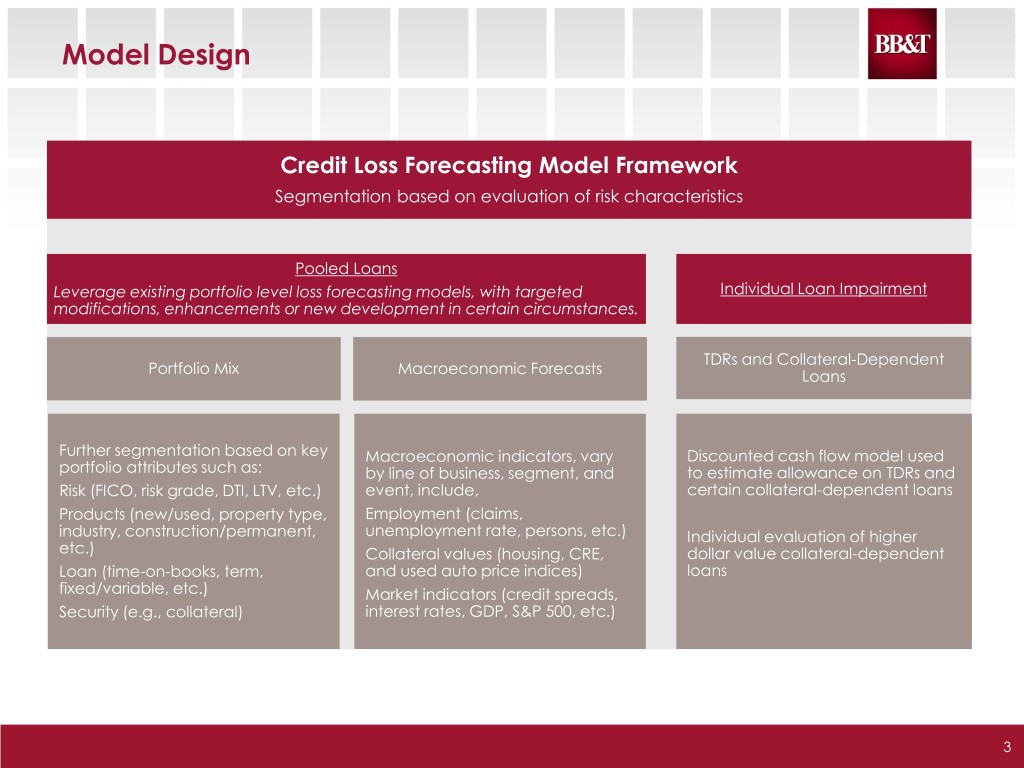
Model Design Credit Loss Forecasting Model Framework Segmentation based on evaluation of risk characteristics Pooled Loans Leverage existing portfolio level loss forecasting models, with targeted Individual Loan Impairment modifications, enhancements or new development in certain circumstances. TDRs and Collateral-Dependent Portfolio Mix Macroeconomic Forecasts Loans Further segmentation based on key Macroeconomic indicators, vary Discounted cash flow model used portfolio attributes such as: by line of business, segment, and to estimate allowance on TDRs and Risk (FICO, risk grade, DTI, LTV, etc.) event, include, certain collateral-dependent loans Products (new/used, property type, Employment (claims, industry, construction/permanent, unemployment rate, persons, etc.) Individual evaluation of higher etc.) Collateral values (housing, CRE, dollar value collateral-dependent Loan (time-on-books, term, and used auto price indices) loans fixed/variable, etc.) Market indicators (credit spreads, Security (e.g., collateral) interest rates, GDP, S&P 500, etc.) 3

CECL Testing Plan . CECL model evaluation is an iterative process – Test 1 – evaluate foundational model’s reasonableness in estimating credit losses with the benefit of perfect economic foresight – Test 2 – evaluate sensitivity of the models to changes and limitations of future economic forecasts – Test 3 – incorporate the use of CECL-specific assumptions (e.g., reasonable and supportable period, reversion) into model estimates . Testing goals – Evaluate fit-for-purpose by assessing reasonableness of model’s estimate of static pool lifetime losses; identify any conservative decisions or judgments not appropriate for reserve modeling – Assess model volatility over time including the impact from reliance on economic scenarios – Provide appropriate direction on key CECL decision points (e.g., reasonable and supportable forecast horizon, reversion process) via sensitivity analysis of these assumptions – Identify directional impact of CECL compared to incurred process across a business cycle . Test 1 - 2 has been substantially completed for all of BB&T’s core models 4
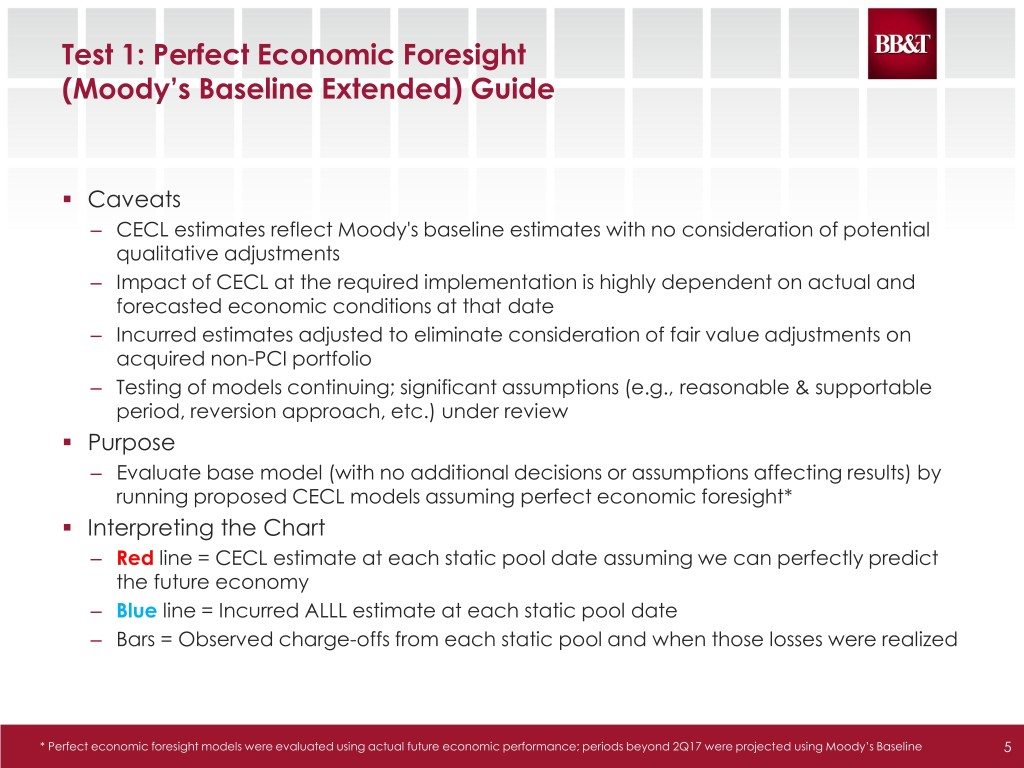
Test 1: Perfect Economic Foresight (Moody’s Baseline Extended) Guide . Caveats – CECL estimates reflect Moody's baseline estimates with no consideration of potential qualitative adjustments – Impact of CECL at the required implementation is highly dependent on actual and forecasted economic conditions at that date – Incurred estimates adjusted to eliminate consideration of fair value adjustments on acquired non-PCI portfolio – Testing of models continuing; significant assumptions (e.g., reasonable & supportable period, reversion approach, etc.) under review . Purpose – Evaluate base model (with no additional decisions or assumptions affecting results) by running proposed CECL models assuming perfect economic foresight* . Interpreting the Chart – Red line = CECL estimate at each static pool date assuming we can perfectly predict the future economy – Blue line = Incurred ALLL estimate at each static pool date – Bars = Observed charge-offs from each static pool and when those losses were realized * Perfect economic foresight models were evaluated using actual future economic performance; periods beyond 2Q17 were projected using Moody’s Baseline 5
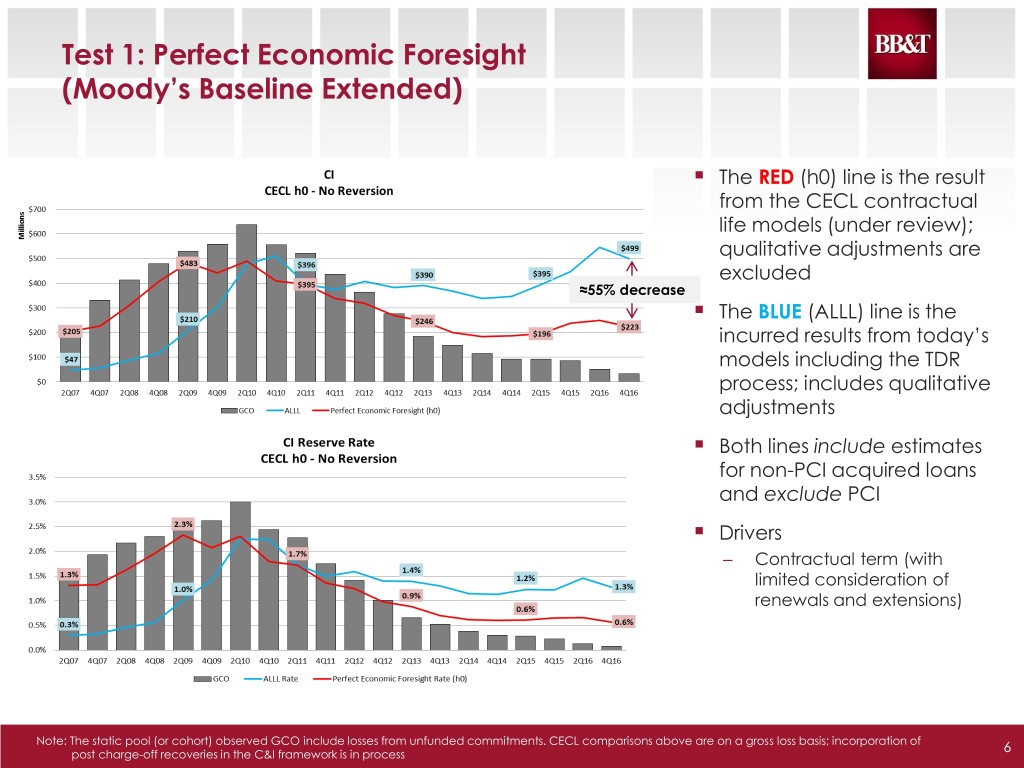
Test 1: Perfect Economic Foresight (Moody’s Baseline Extended) . The RED (h0) line is the result from the CECL contractual life models (under review); qualitative adjustments are excluded ≈55% decrease . The BLUE (ALLL) line is the incurred results from today’s models including the TDR process; includes qualitative adjustments . Both lines include estimates for non-PCI acquired loans and exclude PCI . Drivers – Contractual term (with limited consideration of renewals and extensions) Note: The static pool (or cohort) observed GCO include losses from unfunded commitments. CECL comparisons above are on a gross loss basis; incorporation of 6 post charge-off recoveries in the C&I framework is in process
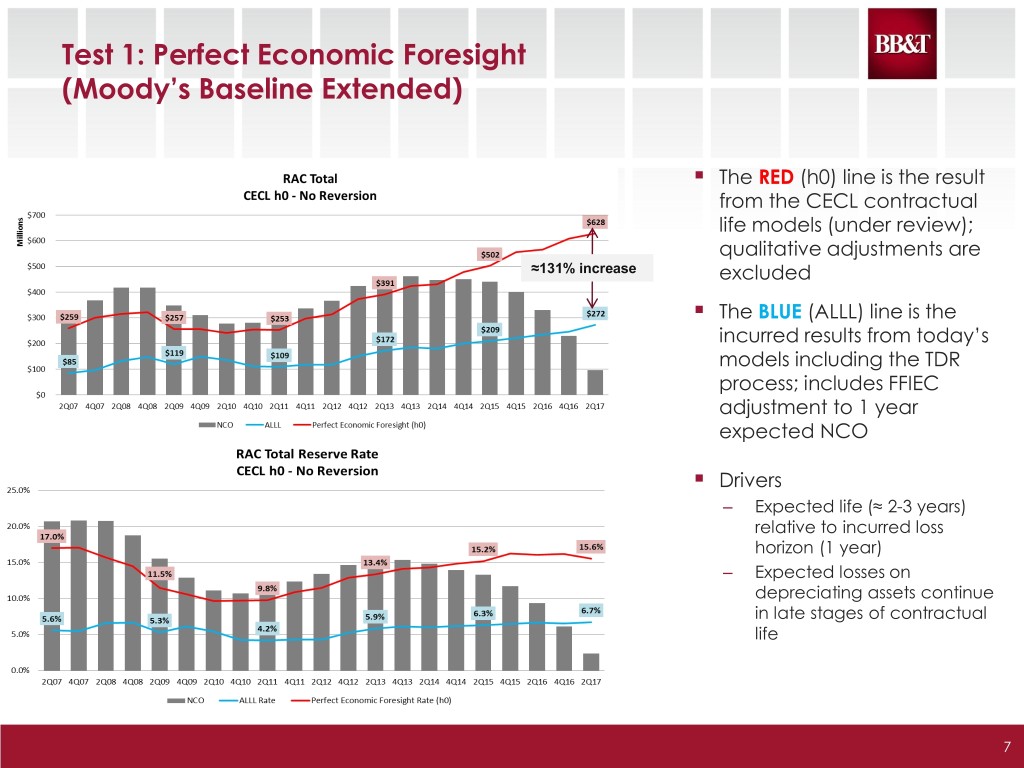
Test 1: Perfect Economic Foresight (Moody’s Baseline Extended) . The RED (h0) line is the result from the CECL contractual life models (under review); qualitative adjustments are ≈131% increase excluded . The BLUE (ALLL) line is the incurred results from today’s models including the TDR process; includes FFIEC adjustment to 1 year expected NCO . Drivers – Expected life (≈ 2-3 years) relative to incurred loss horizon (1 year) – Expected losses on depreciating assets continue in late stages of contractual life 7
Test 2: Economic Sensitivity Observations . Testing was performed on 3 economic scenarios to gauge the sensitivity of the results to the economic forecast; the determination of which scenarios to use in the ACL process is a key decision . CECL will not have the benefit of perfect economic foresight; the reliance on economic forecasts introduces additional uncertainty and imprecision into earnings . Macroeconomic forecasts are inexact; forecasters are generally unable to predict inflection points in an economic cycle . Test 2 General Observations – All scenarios tested were slow to recognize the recession, missed the peak, and were slow to recognize the turn – All 3 scenarios appear to underestimate until the peak and then overestimate losses during recovery and in the benign period – Very little difference between Moody’s baseline (s0) and strong near term growth (s1) scenarios through-the-cycle – Moody’s moderate recession scenario (s3) produces highest loss estimates 8
Test 2: Moody’s Economic Forecast Sensitivity Testing Guide . Description – Run proposed CECL models with Moody’s economic forecasts at each date (under multiple scenario conditions: baseline, strong near-term growth, moderate recession) . Purpose – Evaluate sensitivity and accuracy of economic forecast results . Interpreting the Chart – Red line (h0) = CECL estimate at each static pool date assuming we can perfectly predict the future economy – Green line = CECL estimate using Moody’s baseline at each static pool date – Purple line = CECL estimate using Moody’s s1 (strong near-term growth) scenario – Light Blue line = CECL estimate using Moody’s s3 (moderate recession) scenario – Blue line = Incurred ALLL estimate at each static pool date – Bars = Observed charge-offs from each static pool and when those losses were realized Note: The following charts do not include an assigned reversion (i.e., “No Reversion”); however, Moody’s economic forecasts do incorporate a reversion process 9

Test 2: Economic Sensitivity . The RED (h0) line is the result from the CECL contractual life models (under review); qualitative adjustments are excluded . The BLUE (ALLL) line is the incurred results from today’s models; includes qualitative adjustments . The Green (s0) line is the estimate relying on Moody’s Baseline estimate from each point; Purple (s1) is Moody’s strong near term growth and Light Blue (s3) is Moody’s Moderate Recession estimate at each point . Observations – Moody’s baseline modestly accelerated loss recognition in the crisis – Use of moderate recession forecast at inflection of business cycle likely not advisable 10

Test 2: Economic Sensitivity . The RED (h0) line is the result from the CECL contractual life models (under review); qualitative adjustments are excluded . The BLUE (ALLL) line is the incurred results from today’s models including the TDR process . The Green (s0) line is the estimate relying on Moody’s Baseline estimate from each point; Purple (s1) is Moody’s strong near term growth and Light Blue (s3) is Moody’s Moderate Recession estimate at each point . Observations – RAC losses are less sensitive to economic conditions – Qualitative adjustments may be required at inflection points in the economic cycle 11
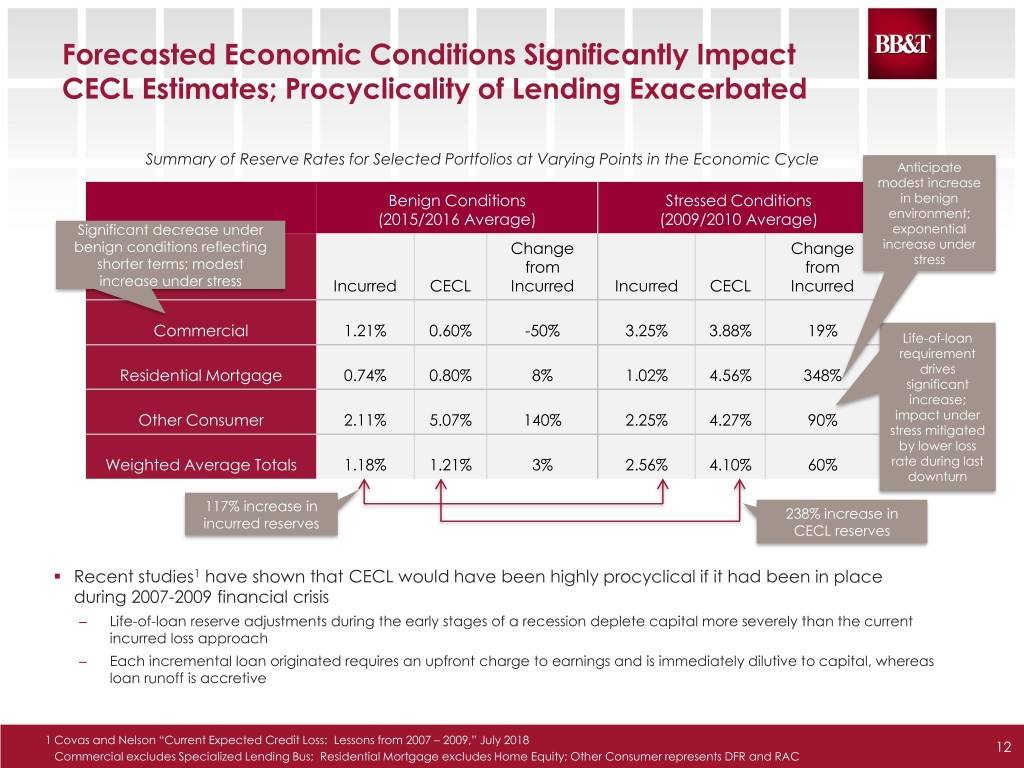
Forecasted Economic Conditions Significantly Impact CECL Estimates; Procyclicality of Lending Exacerbated Summary of Reserve Rates for Selected Portfolios at Varying Points in the Economic Cycle Anticipate modest increase Benign Conditions Stressed Conditions in benign (2015/2016 Average) (2009/2010 Average) environment; Significant decrease under exponential benign conditions reflecting Change Change increase under shorter terms; modest from from stress increase under stress Incurred CECL Incurred Incurred CECL Incurred Commercial 1.21% 0.60% -50% 3.25% 3.88% 19% Life-of-loan requirement Residential Mortgage 0.74% 0.80% 8% 1.02% 4.56% 348% drives significant increase; Other Consumer 2.11% 5.07% 140% 2.25% 4.27% 90% impact under stress mitigated by lower loss Weighted Average Totals 1.18% 1.21% 3% 2.56% 4.10% 60% rate during last downturn 117% increase in 238% increase in incurred reserves CECL reserves . Recent studies1 have shown that CECL would have been highly procyclical if it had been in place during 2007-2009 financial crisis – Life-of-loan reserve adjustments during the early stages of a recession deplete capital more severely than the current incurred loss approach – Each incremental loan originated requires an upfront charge to earnings and is immediately dilutive to capital, whereas loan runoff is accretive 1 Covas and Nelson “Current Expected Credit Loss: Lessons from 2007 – 2009,” July 2018 12 Commercial excludes Specialized Lending Bus; Residential Mortgage excludes Home Equity; Other Consumer represents DFR and RAC
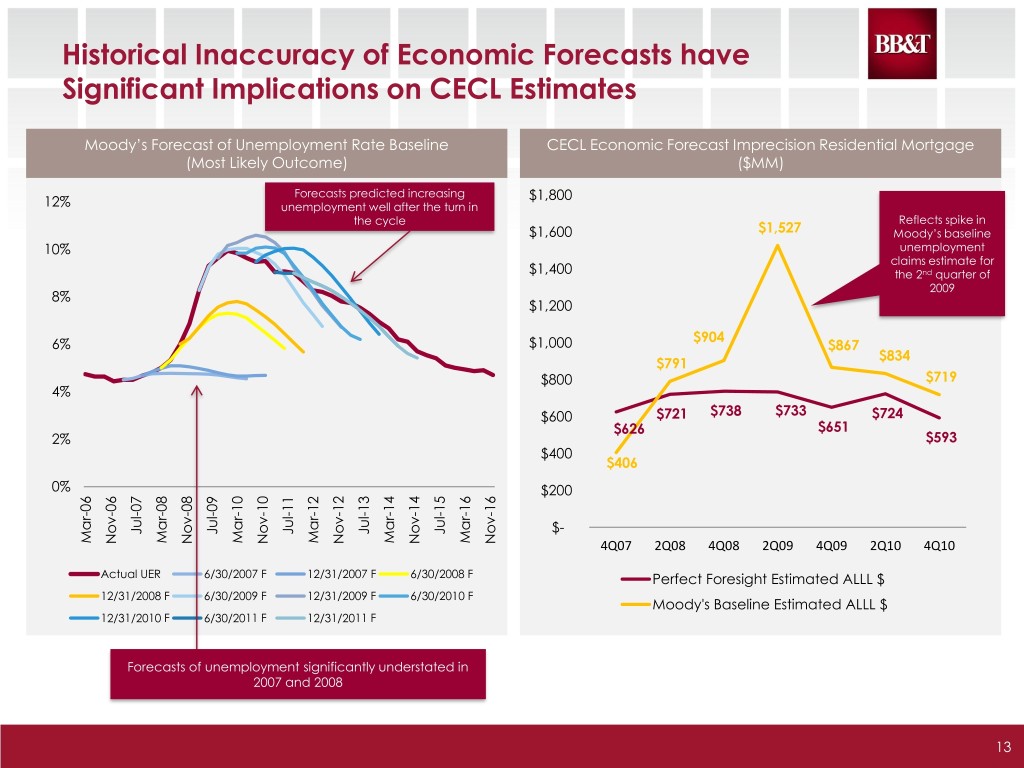
Historical Inaccuracy of Economic Forecasts have Significant Implications on CECL Estimates Moody’s Forecast of Unemployment Rate Baseline CECL Economic Forecast Imprecision Residential Mortgage (Most Likely Outcome) ($MM) Forecasts predicted increasing $1,800 12% unemployment well after the turn in the cycle Reflects spike in $1,600 $1,527 Moody’s baseline 10% unemployment claims estimate for $1,400 the 2nd quarter of 2009 8% $1,200 $904 6% $1,000 $867 $834 $791 $800 $719 4% $600 $721 $738 $733 $724 $626 $651 2% $593 $400 $406 0% $200 Jul-07 Jul-11 Jul-13 Jul-15 Jul-09 $- Mar-06 Mar-08 Mar-10 Mar-12 Mar-14 Mar-16 Nov-08 Nov-10 Nov-12 Nov-14 Nov-16 Nov-06 4Q07 2Q08 4Q08 2Q09 4Q09 2Q10 4Q10 Actual UER 6/30/2007 F 12/31/2007 F 6/30/2008 F Perfect Foresight Estimated ALLL $ 12/31/2008 F 6/30/2009 F 12/31/2009 F 6/30/2010 F Moody's Baseline Estimated ALLL $ 12/31/2010 F 6/30/2011 F 12/31/2011 F Forecasts of unemployment significantly understated in 2007 and 2008 13
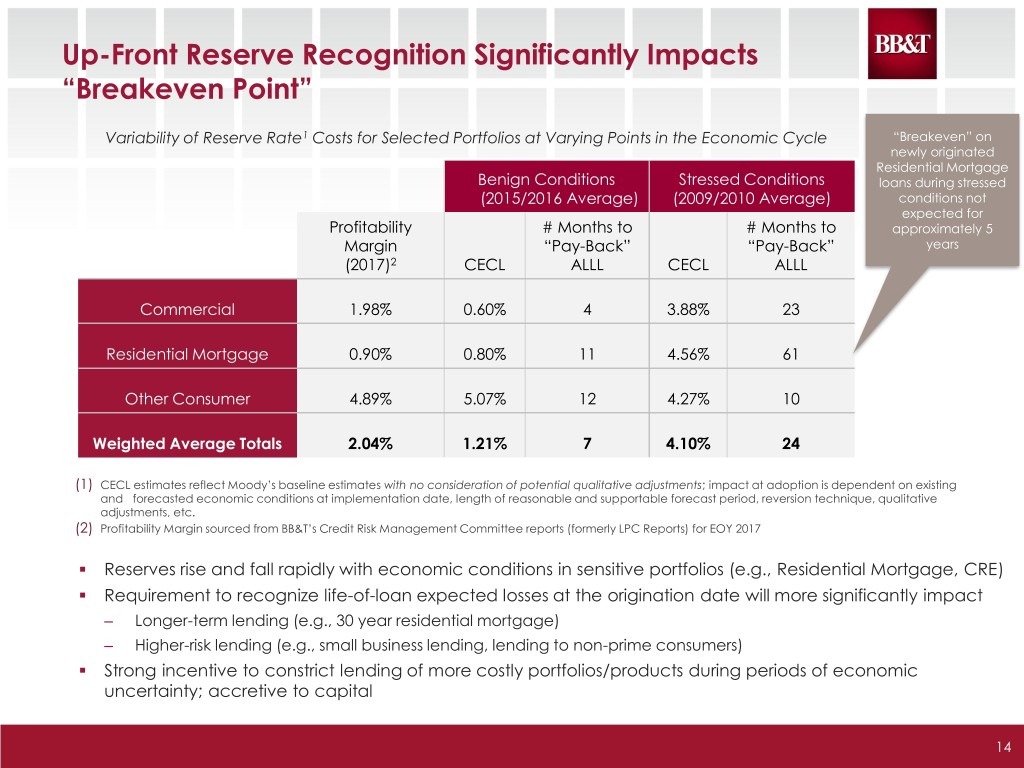
Up-Front Reserve Recognition Significantly Impacts “Breakeven Point” Variability of Reserve Rate1 Costs for Selected Portfolios at Varying Points in the Economic Cycle “Breakeven” on newly originated Residential Mortgage Benign Conditions Stressed Conditions loans during stressed (2015/2016 Average) (2009/2010 Average) conditions not expected for Profitability # Months to # Months to approximately 5 Margin “Pay-Back” “Pay-Back” years (2017)2 CECL ALLL CECL ALLL Commercial 1.98% 0.60% 4 3.88% 23 Residential Mortgage 0.90% 0.80% 11 4.56% 61 Other Consumer 4.89% 5.07% 12 4.27% 10 Weighted Average Totals 2.04% 1.21% 7 4.10% 24 (1) CECL estimates reflect Moody’s baseline estimates with no consideration of potential qualitative adjustments; impact at adoption is dependent on existing and forecasted economic conditions at implementation date, length of reasonable and supportable forecast period, reversion technique, qualitative adjustments, etc. (2) Profitability Margin sourced from BB&T’s Credit Risk Management Committee reports (formerly LPC Reports) for EOY 2017 . Reserves rise and fall rapidly with economic conditions in sensitive portfolios (e.g., Residential Mortgage, CRE) . Requirement to recognize life-of-loan expected losses at the origination date will more significantly impact – Longer-term lending (e.g., 30 year residential mortgage) – Higher-risk lending (e.g., small business lending, lending to non-prime consumers) . Strong incentive to constrict lending of more costly portfolios/products during periods of economic uncertainty; accretive to capital 14

Potential Modifications to CECL . Implementation of CECL in its current form could have detrimental impacts to Primary the availability, pricing and structure of credit . Upfront, life-of-loan loss recognition requirement is inconsistent with the Concerns economics of lending . CECL will negatively impact comparability of financial statements . Potential modifications to CECL described in a letter sent to FASB and the regulatory agencies in early November; supported by 21 banks . Initial recommendation was to modify P&L presentation of credit losses: CECL – P&L – 12 months of losses on non-impaired assets, full recognition on impaired assets Alternative – OCI – all remaining expected credit losses . Recent conversations with FASB related to other alternatives – P&L presentation driven by foreseeable future, reasonable and supportable period, or modified incurred loss approach . Leverages CECL framework; continues to provide investors with visibility into life- of-loan expected credit losses . Potential Mitigates income statement volatility related to uncertain forecasts of future economic conditions Benefits . Enhances comparability of credit losses recognized in the income statement . Easily incorporated into the regulatory capital framework in light of proposed AOCI capital relief for non-GSIB institutions BB&T is committed to working with FASB on potential modifications to the CECL standard 15