Exhibit 99.1
For more information, contact:
FalconStor Software, Inc.
Vincent Sita
Chief Financial Officer
vincent.sita@falconstor.com
FalconStor Software Announces First Quarter of 2022 Results
New Hybrid Cloud Reseller Relationship with IBM and Continued Managed Service Provider Adoption
•Developed new strategic reseller relationship with IBM, creating new joint solutions that enable hybrid cloud data migration, backup, and restore for IBM Power Virtual Server Cloud (IBM Power VS) clients and MSPs that will be resold with IBM Cloud sales force and partner channels
•Added four new MSP partners for the StorSafe secure backup-as-a-service solution while existing MSP partners expanded their business to protect new customers and systems, aligned with the FalconStor strategic shift to serve the MSP community
•Rolled out new initiatives with Hitachi Vantara to build pipeline for advanced disaster recovery and cloud-enabled protection that will be resold by Hitachi Vantara sales force and partner channels
AUSTIN, TEXAS (May 11, 2022) - FalconStor Software, Inc. (OTCQB: FALC), a trusted data protection leader modernizing disaster recovery and backup for the hybrid cloud world, today announced financial results for its first quarter 2022, which ended on March 31, 2022.
“Our strategic shift to recurring revenue-based hybrid cloud data protection solutions took a material step forward in the quarter as we worked aggressively to secure an important reseller relationship with IBM,” said Todd Brooks, FalconStor CEO. “IBM’s cloud push has been a centerpiece of its corporate strategy, as highlighted in its first quarter 2022 results. As we announced earlier today, enterprises can now leverage new joint hybrid cloud solutions from FalconStor and IBM. These solutions are especially important to the tens of thousands of companies around the globe that leverage IBM i environments, as they now have the ability to securely backup and restore to the cloud as well as migrate their IBM i workloads to IBM Power VS Cloud with secure backup and recovery on an on-going basis.”
“Despite the importance of this step forward in our efforts to reinvent FalconStor, our aggressive focus on advancing critical hybrid cloud relationships and our efforts to realign our sales team accordingly negatively impacted our legacy on-premises expansions and legacy on-premises new customer acquisition revenue during the quarter. We don’t view our poor legacy results in Q1 as being a signal of accelerated legacy decline in the future," stated Brooks. "In fact, legacy recurring revenue renewal rates were 86% and ARR increased 4% year-over-year during the quarter. As we continue to reinvent FalconStor, we must simultaneously focus on driving new strategic hybrid cloud ARR growth and maintaining a solid legacy on-premises revenue base.”
First Quarter 2022 Financial Results
•Annual Recurring Revenue (ARR): 4% year-over-year growth
•Ending Cash: $3.4 million, compared to $2.0 million in the first quarter of fiscal year 2021
•Total Revenue: $2.0 million, compared to $3.8 million in the first quarter of fiscal year 2021
•Total Cost of Revenue: $0.4 million, compared to $0.6 million in the first quarter of fiscal year 2021
•Total Operating Expenses: $2.7 million, compared to $3.2 million in the first quarter of fiscal year 2021
•GAAP Net Income (Loss): $(1.1) million, compared to $0.4 million in the first quarter of fiscal year 2021
1
Guidance
Given Q1 2022 results, we are reducing full-year guidance as follows:
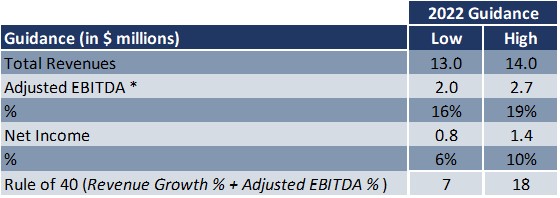
*Adjusted EBITDA adds back Non-Operating and Other Expenses and Income
Conference Call and Webcast Information
WHO: Todd Brooks, Chief Executive Officer, FalconStor and Vincent Sita, Chief Financial Officer, FalconStor
WHEN: Wednesday, May 11, 2022, 4:00 PM Central; 5:00 PM Eastern
To register for our earnings call, please click the following link:
FALCONSTOR FIRST QUARTER 2022 FINANCIAL TELECONFERENCE AND PRESENTATION
As an alternative, you can copy and paste the following link into your web browser to register:
https://register.gotowebinar.com/register/4946665852509096204
Conference Call:
Please dial the following if you would like to interact with and ask questions to FalconStor hosts:
Toll Free: 877-568-4108
Access Code: 399-172-649
Non-GAAP Financial Measures
The non-GAAP financial measures used in this press release are not prepared in accordance with generally accepted accounting principles and may be different from non-GAAP financial measures used by other companies. The Company’s management refers to these non-GAAP financial measures in making operating decisions because they provide meaningful supplemental information regarding the Company’s operating performance. In addition, these non-GAAP financial measures facilitate management’s internal comparisons to the Company’s historical operating results and comparisons to competitors’ operating results. We include these non-GAAP financial measures (which should be viewed as a supplement to, and not a substitute for, their comparable GAAP measures) in this press release because we believe they are useful to investors in allowing for greater transparency into the supplemental information used by management in its financial and operational decision-making. The non-GAAP financial measures exclude (i) restructuring costs, (ii) effects of our Series A redeemable convertible preferred stock, and (iii) non-cash stock-based compensation charges and any potential tax effects. For a reconciliation of our GAAP and non-GAAP financial results, please refer to our reconciliation of GAAP to Non-GAAP financial measures presented in this release.
About FalconStor Software
FalconStor is the trusted data protection software leader modernizing disaster recovery and backup operations for the hybrid cloud world. The Company enables enterprise customers and managed service providers to secure, migrate, and protect their data while reducing data storage and long-term retention costs by up to 95%. More than 1,000 organizations and managed service providers worldwide standardize on FalconStor as the foundation for their cloud first data protection future. Our
2
products are offered through and supported by a worldwide network of leading managed service providers, systems integrators, resellers, and original equipment manufacturers.
# # #
FalconStor and FalconStor Software are trademarks or registered trademarks of FalconStor Software, Inc., in the U.S. and other countries. All other company and product names contained herein may be trademarks of their respective holders.
Links to websites or pages controlled by parties other than FalconStor are provided for the reader's convenience and information only. FalconStor does not incorporate into this release the information found at those links nor does FalconStor represent or warrant that any information found at those links is complete or accurate. Use of information obtained by following these links is at the reader's own risk.
CONTACT INFORMATION
For more information, contact:
Vincent Sita
Chief Financial Officer FalconStor Software Inc.
investorrelations@falconstor.com
CONTACT US AROUND THE GLOBE
| Corporate Headquarters | Europe Headquarters | |||||||
| 501 Congress Avenue | GERMANY | |||||||
| Suite 150 | Landsberger Straße 302 | |||||||
| Austin, Texas 78701 | 80687 München, Germany | |||||||
| Tel: +1.631.777.5188 | salesemea@falconstor.com | |||||||
| salesinfo@falconstor.com | ||||||||
3
FalconStor Software, Inc. and Subsidiaries
CONDENSED CONSOLIDATED BALANCE SHEETS
| March 31, 2022 | December 31, 2021 | |||||||||||||
| (unaudited) | ||||||||||||||
| Assets | ||||||||||||||
| Current assets: | ||||||||||||||
| Cash and cash equivalents | $ | 3,381,639 | $ | 3,181,209 | ||||||||||
| Accounts receivable, net | 825,598 | 2,855,135 | ||||||||||||
| Prepaid expenses and other current assets | 1,264,231 | 1,074,972 | ||||||||||||
| Contract assets, net | 426,264 | 209,936 | ||||||||||||
| Inventory | — | 7,744 | ||||||||||||
| Total current assets | 5,897,732 | 7,328,996 | ||||||||||||
| Property and equipment, net | 128,203 | 153,904 | ||||||||||||
| Operating lease right-of-use assets | 90,893 | 112,405 | ||||||||||||
| Deferred tax assets, net | 29,173 | 30,190 | ||||||||||||
| Software development costs, net | 41,056 | 42,695 | ||||||||||||
| Other assets, net | 99,834 | 106,023 | ||||||||||||
| Goodwill | 4,150,339 | 4,150,339 | ||||||||||||
| Other intangible assets, net | 40,826 | 51,362 | ||||||||||||
| Contract assets | 463,264 | 692,712 | ||||||||||||
| Total assets | $ | 10,941,320 | $ | 12,668,626 | ||||||||||
| Liabilities and Stockholders' Deficit | ||||||||||||||
| Current liabilities: | ||||||||||||||
| Accounts payable | $ | 638,632 | $ | 297,033 | ||||||||||
| Accrued expenses | 801,815 | 1,099,257 | ||||||||||||
| Operating lease liabilities | 74,349 | 76,940 | ||||||||||||
| Deferred revenue, net | 4,049,503 | 4,557,317 | ||||||||||||
| Total current liabilities | 5,564,299 | 6,030,547 | ||||||||||||
| Other long-term liabilities | 957,860 | 950,843 | ||||||||||||
| Notes payable, net | 2,156,246 | 2,154,098 | ||||||||||||
| Operating lease liabilities | 16,544 | 35,465 | ||||||||||||
| Deferred tax liabilities, net | 500,499 | 500,499 | ||||||||||||
| Deferred revenue, net | 1,395,179 | 1,578,769 | ||||||||||||
| Total liabilities | 10,590,627 | 11,250,221 | ||||||||||||
| Commitments and contingencies | ||||||||||||||
| Series A redeemable convertible preferred stock | 14,700,124 | 14,384,388 | ||||||||||||
| Total stockholders' deficit | (14,349,431) | (12,965,983) | ||||||||||||
| Total liabilities and stockholders' deficit | $ | 10,941,320 | $ | 12,668,626 | ||||||||||
4
FalconStor Software, Inc. and Subsidiaries
CONDENSED CONSOLIDATED STATEMENTS OF OPERATIONS
(Unaudited)
| Three Months Ended March 31, | ||||||||||||||||||||||||||
| 2022 | 2021 | |||||||||||||||||||||||||
| Revenue: | ||||||||||||||||||||||||||
| Product revenue | $ | 594,928 | $ | 2,139,729 | ||||||||||||||||||||||
| Support and services revenue | 1,454,179 | 1,688,597 | ||||||||||||||||||||||||
| Total revenue | 2,049,107 | 3,828,326 | ||||||||||||||||||||||||
| Cost of revenue: | ||||||||||||||||||||||||||
| Product | 20,719 | 222,834 | ||||||||||||||||||||||||
| Support and service | 394,549 | 426,173 | ||||||||||||||||||||||||
| Total cost of revenue | 415,268 | 649,007 | ||||||||||||||||||||||||
| Gross profit | $ | 1,633,839 | $ | 3,179,319 | ||||||||||||||||||||||
| Operating expenses: | ||||||||||||||||||||||||||
| Research and development costs | 705,981 | 659,940 | ||||||||||||||||||||||||
| Selling and marketing | 1,189,846 | 1,396,640 | ||||||||||||||||||||||||
| General and administrative | 849,939 | 837,867 | ||||||||||||||||||||||||
| Restructuring costs | 744 | 302,313 | ||||||||||||||||||||||||
| Total operating expenses | 2,746,510 | 3,196,760 | ||||||||||||||||||||||||
| Operating income (loss) | (1,112,671) | (17,441) | ||||||||||||||||||||||||
| Gain on debt extinguishment | — | 754,000 | ||||||||||||||||||||||||
| Interest and other expense | (117,995) | (283,648) | ||||||||||||||||||||||||
| Income (loss) before income taxes | (1,230,666) | 452,911 | ||||||||||||||||||||||||
| Income tax expense (benefit) | (121,260) | 44,616 | ||||||||||||||||||||||||
| Net income (loss) | $ | (1,109,406) | $ | 408,295 | ||||||||||||||||||||||
| Less: Accrual of Series A redeemable convertible preferred stock dividends | 300,921 | 277,170 | ||||||||||||||||||||||||
| Less: Accretion to redemption value of Series A redeemable convertible preferred stock | 14,815 | 197,114 | ||||||||||||||||||||||||
| Net income (loss) attributable to common stockholders | $ | (1,425,142) | $ | (65,989) | ||||||||||||||||||||||
| Basic net income (loss) per share attributable to common stockholders | $ | (0.20) | $ | (0.01) | ||||||||||||||||||||||
| Diluted net income (loss) per share attributable to common stockholders | $ | (0.20) | $ | (0.01) | ||||||||||||||||||||||
| Weighted average basic shares outstanding | 7,082,276 | 5,949,463 | ||||||||||||||||||||||||
| Weighted average diluted shares outstanding | 7,082,276 | 5,949,463 | ||||||||||||||||||||||||
5
FalconStor Software, Inc. and Subsidiaries
Reconciliation of GAAP to Non-GAAP Financial Measures
(Unaudited)
| Three Months Ended March 31, | ||||||||||||||||||||||||||
| 2022 | 2021 | |||||||||||||||||||||||||
| GAAP income (loss) from operations | $ | (1,112,671) | $ | (17,441) | ||||||||||||||||||||||
| Non-cash stock option expense (1) | 8,184 | 4,471 | ||||||||||||||||||||||||
| Restructuring costs (3) | 744 | 302,313 | ||||||||||||||||||||||||
| Non-GAAP income (loss) from operations | $ | (1,103,743) | $ | 289,343 | ||||||||||||||||||||||
| GAAP net income (loss) attributable to common stockholders | $ | (1,425,142) | $ | (65,989) | ||||||||||||||||||||||
| Non-cash stock option expense, net of income taxes (2) | 8,184 | 4,471 | ||||||||||||||||||||||||
| Restructuring costs (3) | 744 | 302,313 | ||||||||||||||||||||||||
| Gain on debt extinguishment | — | (754,000) | ||||||||||||||||||||||||
| Effects of Series A redeemable convertible preferred stock (4) | 315,736 | 474,284 | ||||||||||||||||||||||||
| Embedded derivative fair value adjustment (7) | $ | 7,702 | $ | 14,323 | ||||||||||||||||||||||
| Non-GAAP net income (loss) attributable to common stockholders | $ | (1,092,776) | $ | (24,598) | ||||||||||||||||||||||
| GAAP gross margin | 80 | % | 83 | % | ||||||||||||||||||||||
| Non-cash stock option expense (1) | 0 | % | 0 | % | ||||||||||||||||||||||
| Non-GAAP gross margin | 80 | % | 83 | % | ||||||||||||||||||||||
| GAAP gross margin - Product | 97 | % | 90 | % | ||||||||||||||||||||||
| Non-cash stock option expense (1) | 0 | % | 0 | % | ||||||||||||||||||||||
| Non-GAAP gross margin - Product | 97 | % | 90 | % | ||||||||||||||||||||||
| GAAP gross margin - Support and Service | 73 | % | 75 | % | ||||||||||||||||||||||
| Non-cash stock option expense (1) | 0 | % | 0 | % | ||||||||||||||||||||||
| Non-GAAP gross margin - Support and Service | 73 | % | 75 | % | ||||||||||||||||||||||
| GAAP operating margin | (54 | %) | — | % | ||||||||||||||||||||||
| Non-cash stock option expense (1) | — | % | — | % | ||||||||||||||||||||||
| Restructuring costs (3) | 0 | % | 8 | % | ||||||||||||||||||||||
| Non-GAAP operating margin | (54 | %) | 8 | % | ||||||||||||||||||||||
| GAAP Basic EPS | $ | (0.20) | $ | (0.01) | ||||||||||||||||||||||
| Non-cash stock option expense, net of income taxes (2) | 0.00 | 0.00 | ||||||||||||||||||||||||
6
| Restructuring costs (3) | 0.00 | 0.05 | ||||||||||||||||||||||||
| Gain on litigation settlement (5) | 0.00 | 0.00 | ||||||||||||||||||||||||
| Gain on debt extinguishment (6) | 0.00 | (0.12) | ||||||||||||||||||||||||
| Effects of Series A redeemable convertible preferred stock (4) | 0.05 | 0.08 | ||||||||||||||||||||||||
| Embedded derivative fair value adjustment (7) | 0.00 | 0.00 | ||||||||||||||||||||||||
| Non-GAAP Basic EPS | $ | (0.15) | $ | — | ||||||||||||||||||||||
| GAAP Diluted EPS | $ | (0.20) | $ | (0.01) | ||||||||||||||||||||||
| Non-cash stock option expense, net of income taxes (2) | 0.00 | 0.00 | ||||||||||||||||||||||||
| Restructuring costs (3) | 0.00 | 0.05 | ||||||||||||||||||||||||
| Gain on litigation settlement (5) | 0.00 | 0.00 | ||||||||||||||||||||||||
| Gain on debt extinguishment (6) | 0.00 | (0.12) | ||||||||||||||||||||||||
| Effects of Series A redeemable convertible preferred stock (4) | 0.05 | 0.08 | ||||||||||||||||||||||||
| Embedded derivative fair value adjustment (7) | 0.00 | 0.00 | ||||||||||||||||||||||||
| Non-GAAP Diluted EPS | $ | (0.15) | $ | — | ||||||||||||||||||||||
| Weighted average basic shares outstanding (GAAP and Non-GAAP) | 7,082,276 | 5,949,463 | ||||||||||||||||||||||||
| Weighted average diluted shares outstanding (GAAP) | 7,082,276 | 5,949,463 | ||||||||||||||||||||||||
| Weighted average diluted shares outstanding (Non-GAAP) | 7,082,276 | 5,949,463 | ||||||||||||||||||||||||
Footnotes:
(1)Represents non-cash, stock-based compensation charges as follows:
| Three Months Ended March 31, | ||||||||||||||||||||||||||
| 2022 | 2021 | |||||||||||||||||||||||||
| Cost of revenue - Product | $ | 227 | $ | 227 | ||||||||||||||||||||||
| Cost of revenue - Support and Service | 181 | 181 | ||||||||||||||||||||||||
| Research and development costs | 1,879 | — | ||||||||||||||||||||||||
| Selling and marketing | 4,511 | 2,677 | ||||||||||||||||||||||||
| General and administrative | 1,386 | 1,386 | ||||||||||||||||||||||||
| Total non-cash stock based compensation expense | $ | 8,184 | $ | 4,471 | ||||||||||||||||||||||
(2)Represents the effects of non-cash stock-based compensation expense recognized, net of related income tax effects. For the three months ended March 31, 2022 and 2021, the tax expense for both GAAP and Non-GAAP basis approximate the same amount.
(3)Represents restructuring costs which were incurred during each respective period presented.
(4)Represents the effects of the accretion to redemption value of the Series A redeemable convertible preferred stock, accrual of Series A redeemable convertible preferred stock dividends and deemed dividend on Series A redeemable convertible preferred stock.
(5)Represents a gain for the legal settlement of a contractual dispute with a marketing/sales firm.
(6)Represents the gain recorded when the Company's loan with the Paycheck Protection Program under the Coronavirus Aid, Relief, and Economic Security Act was forgiven on March 30, 2021.
(7)Represents the income statement (gain) or loss resulting from the change in fair value of our embedded derivative liability associated with the Company's Series A redeemable convertible preferred stock.
7