| NAREIT June 2004 CSFB Real Estate Conference April 2005 |

| Table of Contents Aimco Overview Seven Ways Aimco Makes Money 2005 Outlook Assumptions 4th Quarter 2004 Review 2004 Highlights Review Common Stock Preferred Stock |

| A. Aimco Overview Largest owner/operator of multi-family properties in U.S. Own 215,000 units, 1,000 properties Manage an additional 49,000 units (principally asset managed) Enterprise value approximately $10 billion, real estate under Aimco management approximately $13 billion S & P 500 company Market capitalization exceeds $4 billion Generated 15+ % total annual return to common shareholders since 1994 IPO through year-end 2004 |

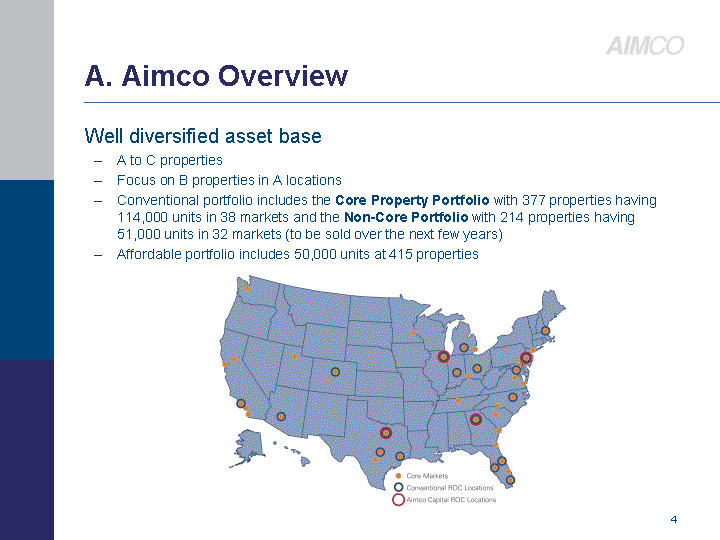
| A. Aimco Overview Well diversified asset base A to C properties Focus on B properties in A locations Conventional portfolio includes the Core Property Portfolio with 377 properties having 114,000 units in 38 markets and the Non-Core Portfolio with 214 properties having 51,000 units in 32 markets (to be sold over the next few years) Affordable portfolio includes 50,000 units at 415 properties |

| B. Seven Ways Aimco Makes Money Operating multi-family properties Conventional Affordable University Communities Generating fee income Redeveloping / reinvesting in properties Managing portfolio Increasing land values through entitlements Managing cost of capital Managing G&A / productivity Royal Crest - Warwick, RI Glenbridge Manors - Cincinnati, OH |

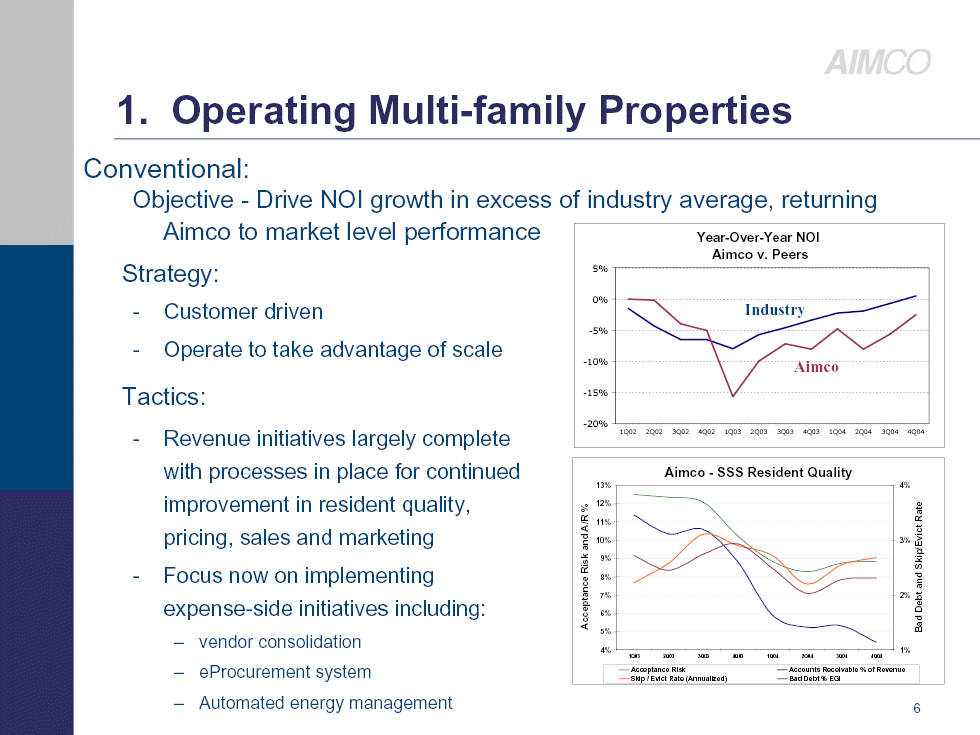
| 1. Operating Multi-family Properties Strategy: Customer driven Operate to take advantage of scale Tactics: Revenue initiatives largely complete with processes in place for continued improvement in resident quality, pricing, sales and marketing Focus now on implementing expense-side initiatives including: vendor consolidation eProcurement system Automated energy management 2004 2003 1Q02 -0.015 0 2Q02 -0.043 -0.002 3Q02 -0.065 -0.04 4Q02 -0.065 -0.05 1Q03 -0.08 -0.157 2Q03 -0.057 -0.1 3Q03 -0.046 -0.072 4Q03 -0.034 -0.081 1Q04 -0.023 -0.048 2Q04 -0.019 -0.081 3Q04 -0.007 -0.056 4Q04 0.005 -0.025 Conventional: Objective - Drive NOI growth in excess of industry average, returning Aimco to market level performance Industry Aimco |

| 1. Operating Multi-family Properties Affordable: Maintain stable occupancy while growing rental rates through HUD-subsidized increases University: Maintain academic year occupancy at 93-plus% Increase revenue through offering of additional services such as wireless Internet |

| Fee income: Generated from tax credit syndication, dispositions, refinancings Aimco owned properties are captive pipeline of ongoing activity Strong pipeline increases predictability of income stream Grow the business David Robertson now focused entirely on growing Aimco Capital as a more autonomous operation with dedicated capital and focused management team Market size is significant. Industry-wide, more than $5B in tax credit equity invested annually for > 100k units/ yr Uniquely positioned: Aimco Capital has the national structure, knowledge and pipeline Grow pipeline through acquisitions and third party relationships 2. Fee Income |

| Current projects: Belmont Place in Marietta, Georgia. Mid-2005 completion. Total $32 million. 13 active moderate-sized projects with total expenditures of $100 million Planned activity: Recruiting Chief Development Officer Expect to approve 20-25 additional projects in 2005 Target 8%-9% unlevered yields on moderate projects and 9%-10% on major projects 3. Redevelopment Belmont Place - Marietta, GA Belmont Place - Marietta, GA |

| Core and non-core portfolios: Target approximately 40 markets total Expect to exit an additional 10-12 markets in 2005 Higher expected growth in core portfolio 4. Portfolio Management Palazzo East - Los Angeles, CA |

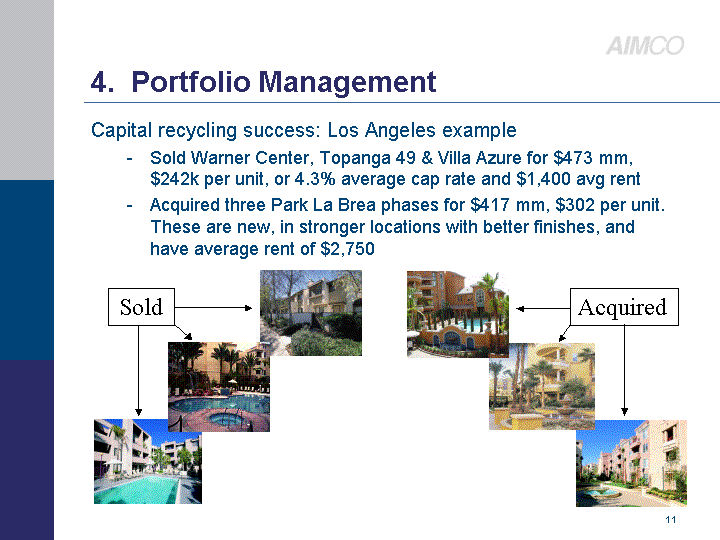
| Capital recycling success: Los Angeles example Sold Warner Center, Topanga 49 & Villa Azure for $473 mm, $242k per unit, or 4.3% average cap rate and $1,400 avg rent Acquired three Park La Brea phases for $417 mm, $302 per unit. These are new, in stronger locations with better finishes, and have average rent of $2,750 4. Portfolio Management Sold Acquired |

| Realize upside in land values through increasing density of use Focus on locations where land is scarce Low density properties 5. Entitlement |

| Maintain or improve financial ratios through increased profitability of conventional operations Maintain or improve 1.65x fixed charge ratio (EBITDA coverage of interest expenses and preferred dividends) Refinance $102 mm maturing loans with current rate of 7.62% with forecast new rate of 5.75%. Evaluate additional refinancing opportunities Maintain weighted average cost of capital at 8.59% 6. Cost of Capital |

| Objectives for improvement Increase the use of technology to increase efficiency Focus on applying consistent processes across portfolio Increase use of variable compensation to drive profitability Implement structured monthly reporting to improve timing and effectiveness of G&A management 7. G&A / Productivity |

| Aimco's expects its Same Store year-over-year NOI growth to exceed peer average C. 2005 Outlook (Guidance Assumptions) Aimco expects to achieve stronger Same Store performance: through earn-in of occupancy levels achieved in the second half of 2004 2005 average occupancy assumption of 92.2% is up 190 bp from the 2004 average; however, up only 70 bp from the fourth quarter moderate rent growth of approximately 1% expense growth of 3.25 to 3.75%, comparable with peer group expectations |

| Same Store delivered 2.8% sequential increase Highest sequential increase among peers Second quarter of sequential growth Met guidance for occupancy, revenue growth and controllable expense savings, partially offset by higher taxes and insurance Property sales totaled $500 million Completed four strategic sales for $279 mm at average 4.3% cap rate Sold 39 properties in total for $160 mm net cash proceeds to Aimco D. 4th Quarter 2004 Review |

| Operations: Same Store revenue in 2H 2004 up 4.4% over 1H2004 to $524.2 mm from $502.1mm "Turnaround" in progress Fee income: Totaled $35 mm, double guidance of $15-20 mm provided in February 2004 Increase indicates strength of pipeline Redevelopment: Completed Flamingo South Beach Expanded construction services Initiated moderate redevelopment program 4. Portfolio management: Sold 107 properties at average 5.3% cap rate Eliminated associated property debt on sales Provided $530 mm in net cash proceeds to Aimco for reinvestment in SoCal, Florida and NY markets with higher upside. Exited 7 markets E. 2004 Highlights Review Hyde Park Tower - Chicago, IL |

| 5. Entitlements: established roles and processes to expand this source of value creation 6. Cost of Capital: refinanced $881 mm in property debt at average 4.33% with average savings of 230 bp redeemed $473 mm in preferreds for an average dividend savings of 94 bp, modified credit facility reducing spread over LIBOR by average expected 125 bp and increasing flexibility 7. G&A / productivity: increased visibility and management of G&A function through dedicated finance function and monthly reviews E. 2004 Highlights Review |

| * Aimco implied cap rate at 03/31/05 is based on conventional properties, excluding redevelopment properties. Market implied cap rate includes the net effect of above market rate debt and tax exempt debt estimated at negative $120 million. F. Common stock CURRENT AIV INDUSTRY FFO/share multiple ('05) 12.7 14.9 AFFO/share multiple ('05) 17.3 18.0 EBITDA multiple (LTM) 13.8 17.1 Market implied cap rate * 7.6 6.6 Aimco stock trading at lower valuation than peers |

| G. Preferred stock Part of low risk capital structure Preferred stock accounts for 11% of capital structure 9 Classes (7 publicly traded) with coupons ranging between 7.75% and 10.1% CLASS NYSE TICKER DIVIDEND REDEM'N DATE $ ISSUE AMOUNT G AIVPRG 9.375% 7/15/08 101 mm Q AIVPRQ 10.1% 3/19/06 63 mm R AIVPRR 10.0% 7/20/06 174 mm T AIVPRT 8.0% 7/31/08 150 mm U AIVPRU 7.75% 3/24/09 200 mm V AIVPRV 8.0% 9/29/09 86 mm Y AIVPRY 7.875% 12/21/09 86 mm "We think AIV preferreds are an excellent income play." Andrew Rosivach, CSFB, March '05 |

| This Presentation Contains Forward-looking Statements This presentation contains forward-looking statements, including statements regarding future results. Forward-looking statements specifically contain statements regarding expected results in 2005 including results of operations and FFO. These statements are subject to certain risks and uncertainties, including but not limited to Aimco's ability to maintain occupancy, maintain and increase rental rates, lease-up redevelopment and acquisition properties and generate fee income as projected. Actual results may differ materially from projections and could be affected by a variety of factors, including factors beyond Aimco's control. These factors are described in Aimco's filings with the Securities and Exchange Commission, including Aimco's Annual Report on Form 10-K. These forward-looking statements reflect management's judgment as of this date, and Aimco assumes no obligation to revise or update them to reflect future events or circumstances. |