- AIV Dashboard
- Financials
- Filings
-
Holdings
- Transcripts
- ETFs
- Insider
- Institutional
- Shorts
-
8-K Filing
Apartment Investment and Management (AIV) 8-KRegulation FD Disclosure
Filed: 23 Feb 06, 12:00am

| Investor Day February 2006 |
| Forward Looking Statements & Non-GAAP Measures During today's presentation and the question and answer session that follows, we will make forward looking statements including projections related to 2006 results and 2007 earnings trends. Such statements are based on management's judgment and are subject to certain risks and uncertainties, a description of which can be found in Aimco's SEC filings. Actual results may differ materially from what may be discussed today and Aimco assumes no obligation to update these statements. Also, we will discuss non-GAAP financial measures, such as Funds From Operations. These are defined and are reconciled to the most comparable GAAP measures in the Supplemental Information that is part of the full fourth quarter 2005 earnings release, published on Aimco's Website. |
| TOM HERZOG - CFO |
| To Clarify, Simplify and Quantify Aimco You will hear Who we are You will learn What is our strategy We will seek to provide Transparency You will meet our talented Management team Today's Objective |
| TERRY CONSIDINE - CEO |
| Aimco has a high quality portfolio that can be fairly compared with any other apartment REIT portfolio The starting point to understand and value Aimco is its $8 billion Core portfolio Jeff Adler has re-tooled Aimco property operations to produce above average results during the past year and more 7 Key Themes There are seven main points that we will return to throughout the day: |
| Aimco has multiple drivers of its financial results in addition to property operations Redevelopment Entitlement Asset management Aimco's business plan is self funding We think of the Non-Core portfolio as highly liquid and a source of investment capital to fund new opportunities 7 Key Themes |
| 7 Key Themes Aimco's leverage will magnify increased contributions from operations, redevelopment, land sales and asset management Aimco has addressed its productivity in a systematic way to reduce G&A and operating expenses |
| The key to Aimco success is its people, and importantly, its management team. Here today: Tom Herzog - CFO Harry Alcock - CIO Jeff Adler - EVP, Head of Property Operations Mike Karsner - CFO Conventional Property Operations Tony D'Alto - SVP, Head of the Gulf Division Tim Beaudin - CDO Patti Shwayder - SVP, Government Relations David Robertson - President, Aimco Capital Patti Fielding - EVP and Treasurer, Capital Markets & Debt Jennifer Martin - VP, Investor Relations 7 Key Themes |

| TOM HERZOG - CFO |
| We are the largest owner/operator of apartment homes in the U.S. having 1,370 properties with 240,000 units We have 6,400 valued teammates led by a management team strengthened over the past three years We are one of nine REITs included in the S&P 500 We are uniquely positioned to add value through redevelopment and entitlement, owning a number of B and C assets in A locations Who We Are |
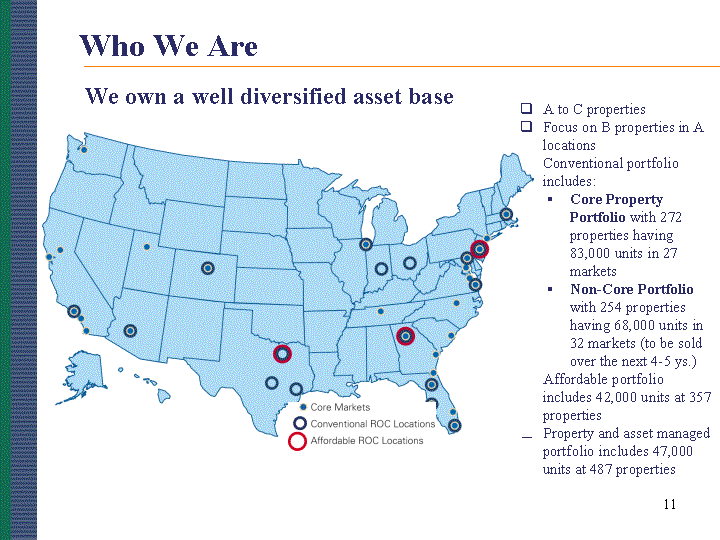
| Who We Are A to C properties Focus on B properties in A locations Conventional portfolio includes: Core Property Portfolio with 272 properties having 83,000 units in 27 markets Non-Core Portfolio with 254 properties having 68,000 units in 32 markets (to be sold over the next 4-5 ys.) Affordable portfolio includes 42,000 units at 357 properties Property and asset managed portfolio includes 47,000 units at 487 properties We own a well diversified asset base |
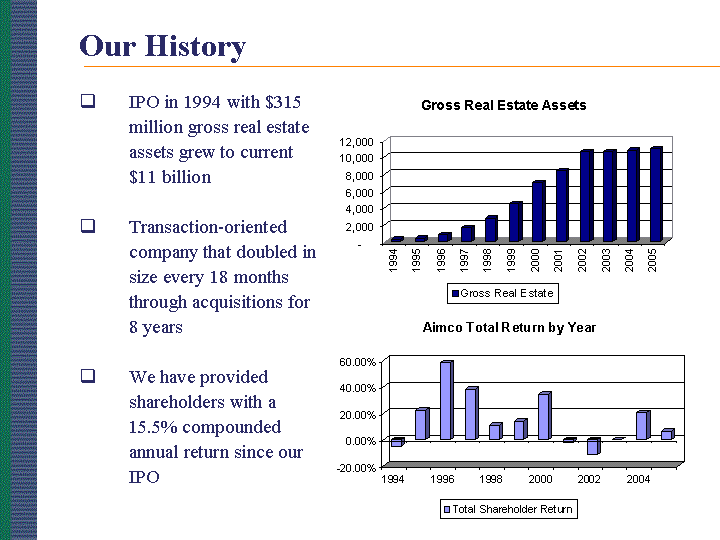
| IPO in 1994 with $315 million gross real estate assets grew to current $11 billion Transaction-oriented company that doubled in size every 18 months through acquisitions for 8 years We have provided shareholders with a 15.5% compounded annual return since our IPO Our History |

| How We See Aimco Each of the 7 Ways We Make Money drives our Core business Managing the portfolio Operating multi-family properties Redeveloping / reinvesting in properties Increasing land values through entitlements Generating fee income Managing cost of capital Managing G&A / productivity CORE OPERATIONS LAND FEE NON-CORE OPERATIONS |
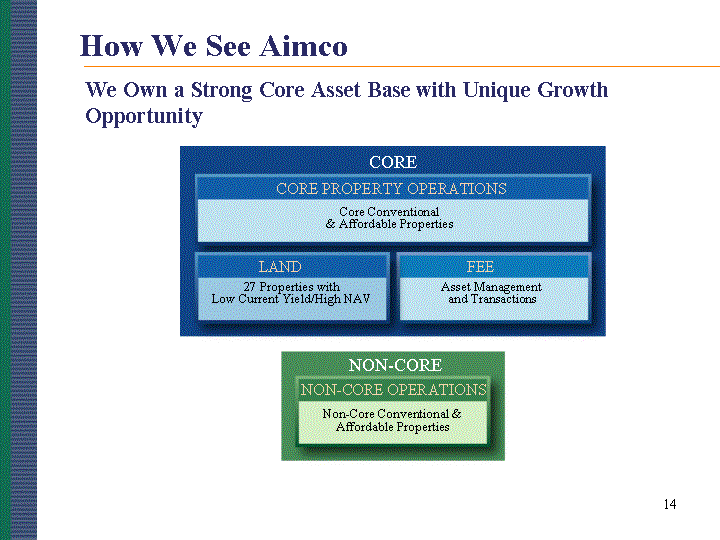
| We Own a Strong Core Asset Base with Unique Growth Opportunity CORE CORE PROPERTY OPERATIONS FEE LAND Core Conventional & Affordable Properties 27 Properties with Low Current Yield/High NAV Asset Management and Transactions NON-CORE NON-CORE OPERATIONS Non-Core Conventional & Affordable Properties How We See Aimco |

| How We See Aimco Sales of Non-Core assets are a source of funds that are re-invested in our Core Business in markets with higher growth potential CORE FEE LAND Core Conventional & Affordable Properties 27 Properties with Low Current Yield/High NAV Asset Management and Transactions NON-CORE Non-Core Conventional & Affordable Properties CORE PROPERTY OPERATIONS NON-CORE OPERATIONS |

| Our Vision Over the next 5 years, we will: Concentrate our invested assets in core markets with superior growth prospects Earn attractive returns while upgrading our properties Improve further our operating platform to satisfy customers Monetize our half billion $+ investment in low earning, high-value land assets Attract more capital, through joint ventures or tax credits, to expand our scale and to earn attractive returns on equity We are different from our peers in that: We already control the sites to support our 5-year development plans We are largely self funding - use non-recourse property debt to fund Redevelopment secured by the value created... and use tax credit equity We have a low WACC because our use of non-recourse property debt allows the prudent use of higher debt leverage in our capital structure |

| HARRY ALCOCK CHIEF INVESTMENT OFFICER CORE PORTFOLIO |
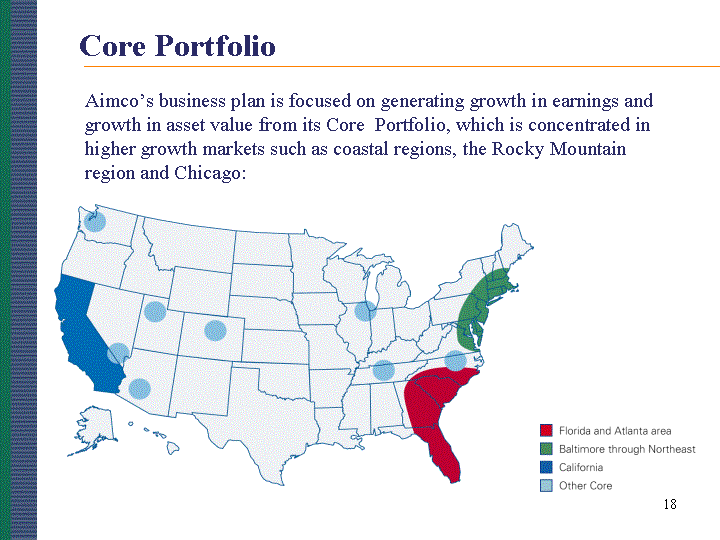
| Aimco's business plan is focused on generating growth in earnings and growth in asset value from its Core Portfolio, which is concentrated in higher growth markets such as coastal regions, the Rocky Mountain region and Chicago: Core Portfolio |
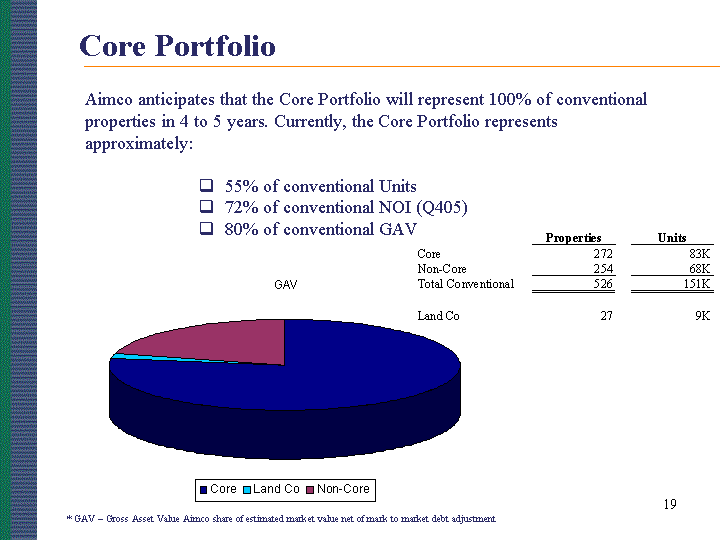
| Aimco anticipates that the Core Portfolio will represent 100% of conventional properties in 4 to 5 years. Currently, the Core Portfolio represents approximately: 55% of conventional Units 72% of conventional NOI (Q405) 80% of conventional GAV * GAV - Gross Asset Value Aimco share of estimated market value net of mark to market debt adjustment Core Portfolio |

| 27 Core Markets Plus university communities Contribution to GAV: Northeast = 32% Southeast = 20% California = 18% Other = 14% Core Markets *Includes Non Core properties within the Core Markets |
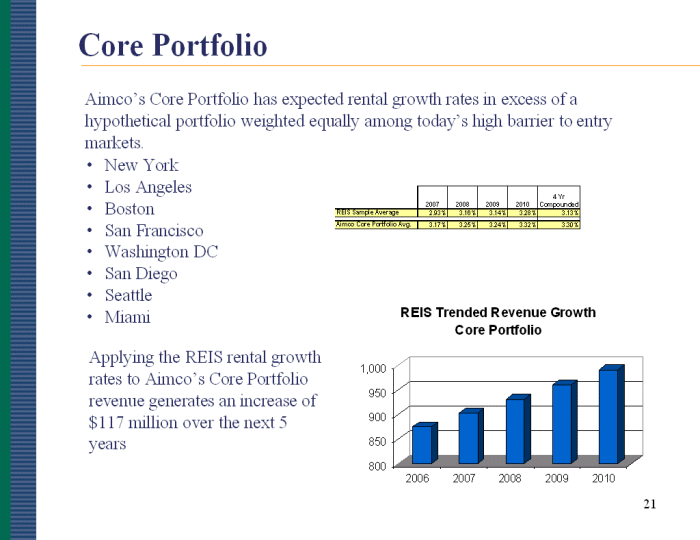
| Aimco's Core Portfolio has expected rental growth rates in excess of a hypothetical portfolio weighted equally among today's high barrier to entry markets. New York Los Angeles Boston San Francisco Washington DC San Diego Seattle Miami Applying the REIS rental growth rates to Aimco's Core Portfolio revenue generates an increase of $117 million over the next 5 years Core Portfolio |
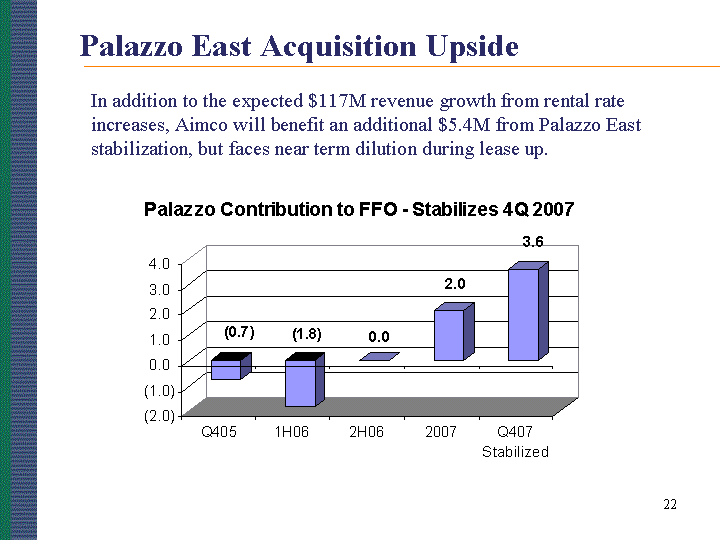
| Palazzo East Acquisition Upside In addition to the expected $117M revenue growth from rental rate increases, Aimco will benefit an additional $5.4M from Palazzo East stabilization, but faces near term dilution during lease up. |
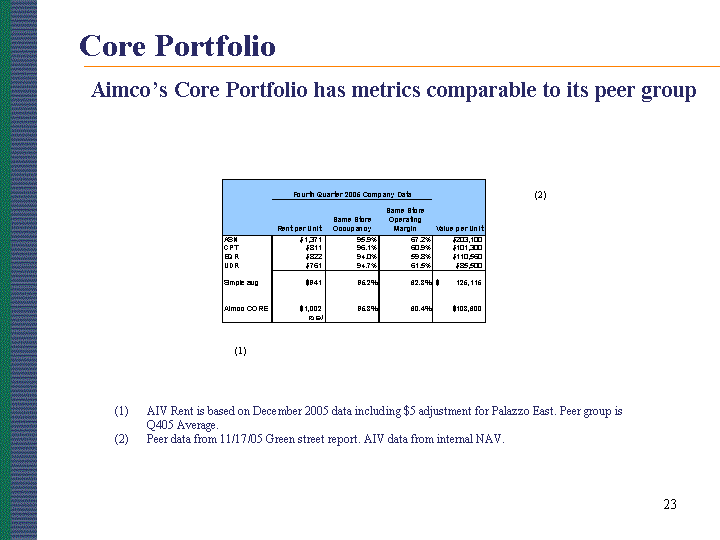
| Core Portfolio AIV Rent is based on December 2005 data including $5 adjustment for Palazzo East. Peer group is Q405 Average. Peer data from 11/17/05 Green street report. AIV data from internal NAV. Aimco's Core Portfolio has metrics comparable to its peer group (2) (1) |
| JEFF ADLER - EVP MIKE KARSNER - SVP TONY D'ALTO - DVP CONVENTIONAL OPERATIONS |
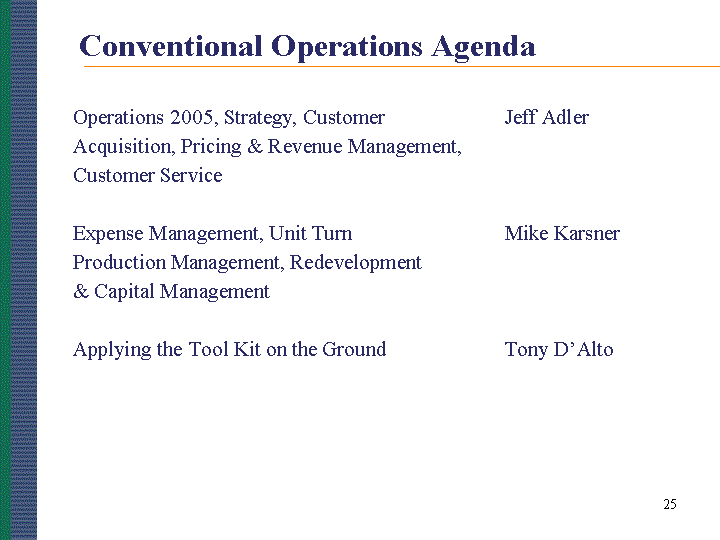
| Conventional Operations Agenda Operations 2005, Strategy, Customer Jeff Adler Acquisition, Pricing & Revenue Management, Customer Service Expense Management, Unit Turn Mike Karsner Production Management, Redevelopment & Capital Management Applying the Tool Kit on the Ground Tony D'Alto |
| Conventional Operations 2005: A Continuation of Aimco's New Operations Strategy |
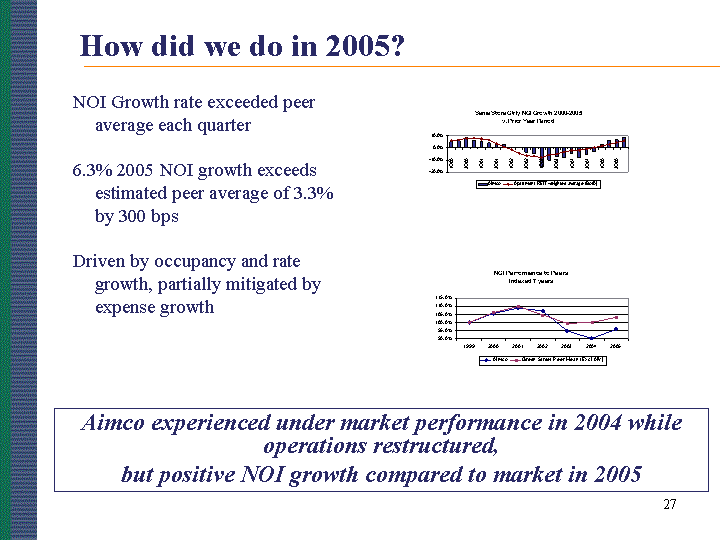
| How did we do in 2005? NOI Growth rate exceeded peer average each quarter 6.3% 2005 NOI growth exceeds estimated peer average of 3.3% by 300 bps Driven by occupancy and rate growth, partially mitigated by expense growth Aimco experienced under market performance in 2004 while operations restructured, but positive NOI growth compared to market in 2005 |
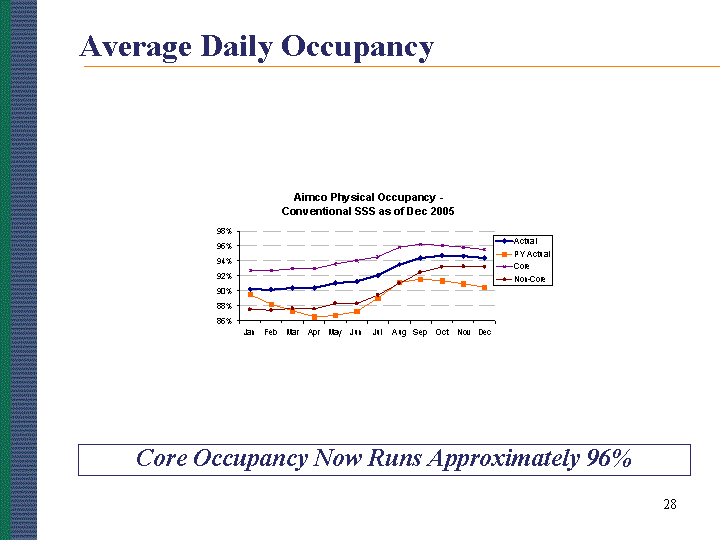
| Core Occupancy Now Runs Approximately 96% Average Daily Occupancy |
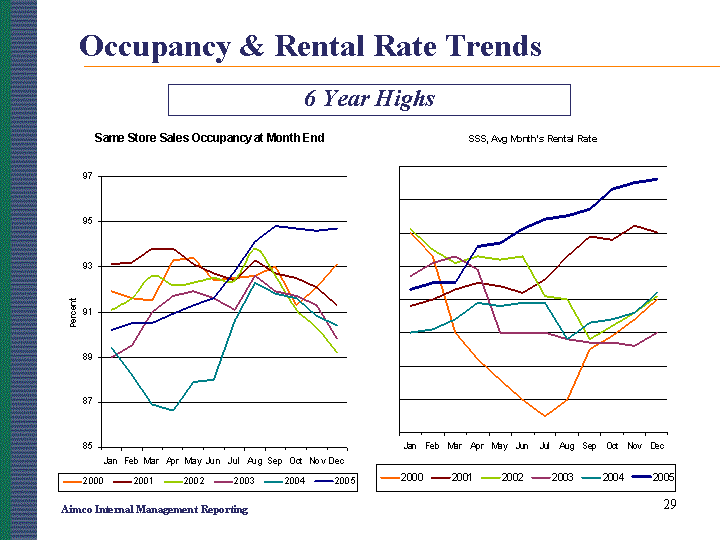
| Occupancy & Rental Rate Trends 6 Year Highs Aimco Internal Management Reporting |
| What is the Strategy behind the results? |
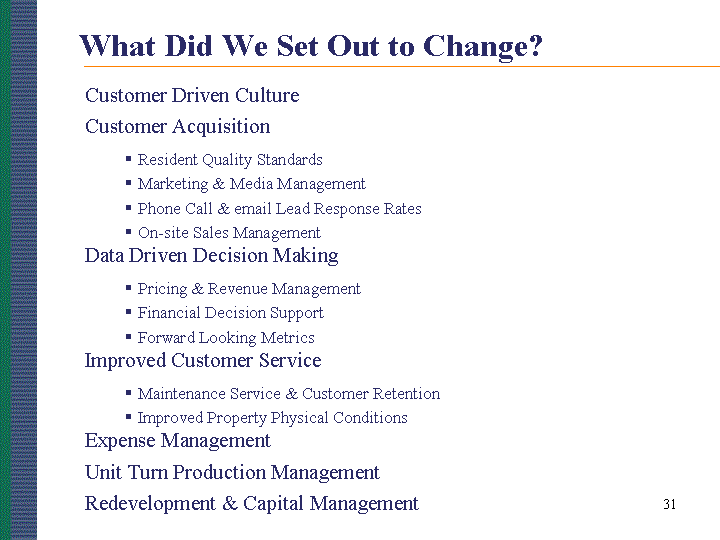
| What Did We Set Out to Change? Customer Driven Culture Customer Acquisition Resident Quality Standards Marketing & Media Management Phone Call & email Lead Response Rates On-site Sales Management Data Driven Decision Making Pricing & Revenue Management Financial Decision Support Forward Looking Metrics Improved Customer Service Maintenance Service & Customer Retention Improved Property Physical Conditions Expense Management Unit Turn Production Management Redevelopment & Capital Management |
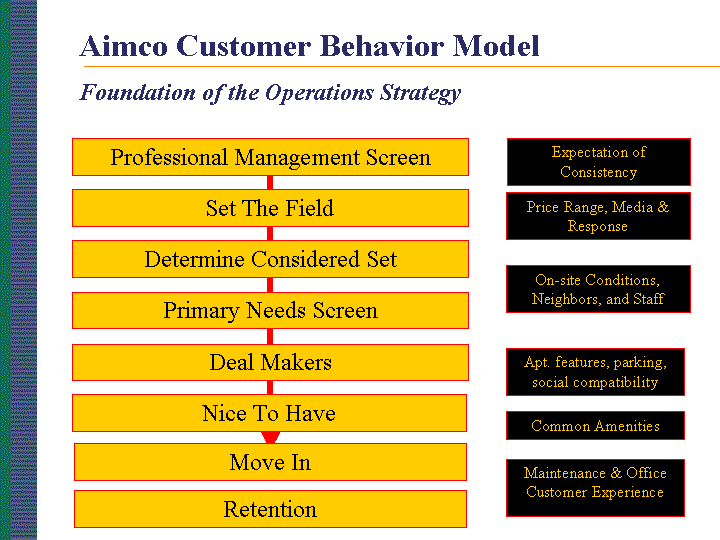
| Aimco Customer Behavior Model Professional Management Screen Set The Field Determine Considered Set Primary Needs Screen Deal Makers Nice To Have Retention Move In Expectation of Consistency Price Range, Media & Response On-site Conditions, Neighbors, and Staff Apt. features, parking, social compatibility Common Amenities Maintenance & Office Customer Experience Foundation of the Operations Strategy |
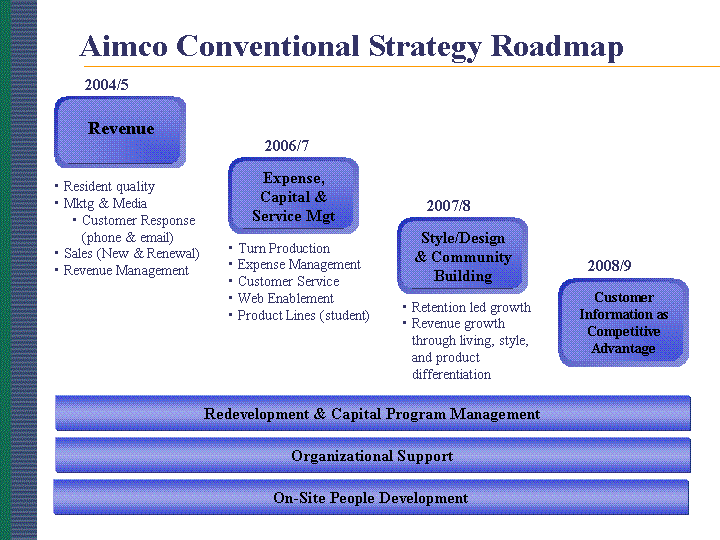
| Aimco Conventional Strategy Roadmap Revenue Expense, Capital & Service Mgt Style/Design & Community Building Customer Information as Competitive Advantage Resident quality Mktg & Media Customer Response (phone & email) Sales (New & Renewal) Revenue Management Turn Production Expense Management Customer Service Web Enablement Product Lines (student) Retention led growth Revenue growth through living, style, and product differentiation 2004/5 2006/7 2007/8 2008/9 Redevelopment & Capital Program Management Organizational Support On-Site People Development |

| On Site Strategy: Move High Volume/Peak Load Transactions Off-site Transaction category Timeline Incoming leasing calls 2005 Incoming leasing emails 2005 Outbound Appointment Confirmation 2005 Utility Bill payments 2005 Electronic procurement 2006 Electronic revenue management 2006 Electronic Lease documentation 2H06/2007 Centralized accounts payable 2H06/2007 Electronic resident payment platform 2H06/2007 Web Customer Self-Service 2H06/2007 Incoming Maintenance Service Calls 2007 "Automate the Routine, Humanize the Exception" |
| Customer Acquisition Resident Quality Standards Marketing & Media Management Phone Call & email Lead Response Rates On-site Sales Management |
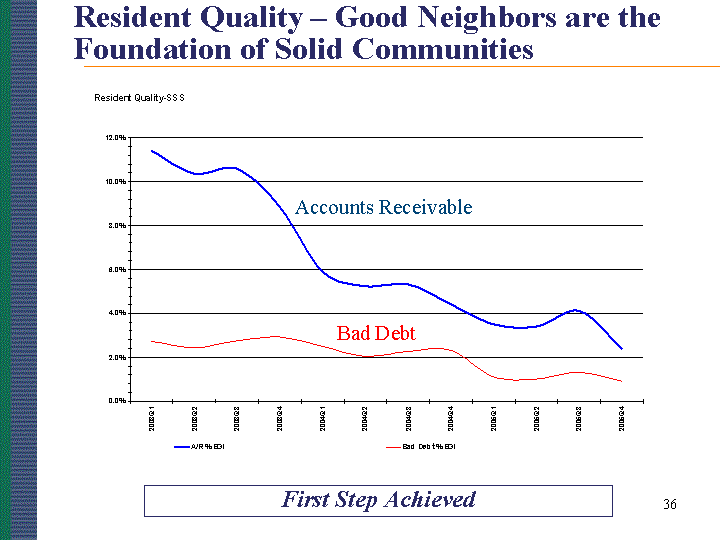
| Resident Quality - Good Neighbors are the Foundation of Solid Communities First Step Achieved Accounts Receivable Bad Debt |
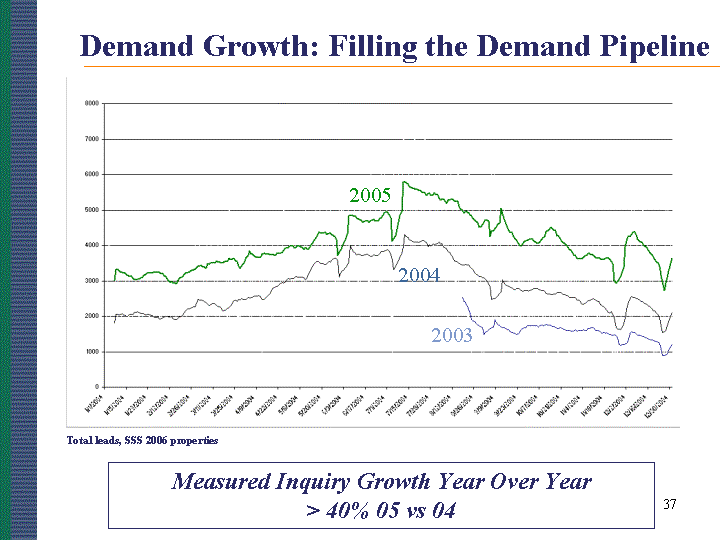
| Demand Growth: Filling the Demand Pipeline Total leads, SSS 2006 properties 2003 2004 2005 Measured Inquiry Growth Year Over Year > 40% 05 vs 04 |
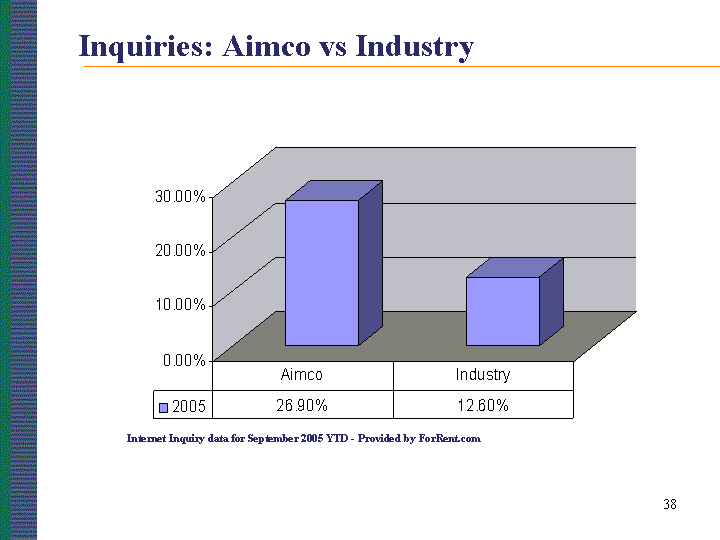
| Inquiries: Aimco vs Industry Internet Inquiry data for September 2005 YTD - Provided by ForRent.com |

| Where Do Customers Come From? 10% 15% 20% 25% 30% 35% 40% 45% Sept Oct Nov Dec Jan Feb Mar Apr May Jun Jul Aug Sept Oct Nov Dec Jan Feb Mar Apr May June July Aug 40% Web Referral Other Print 2003 2004 2005 Leases |
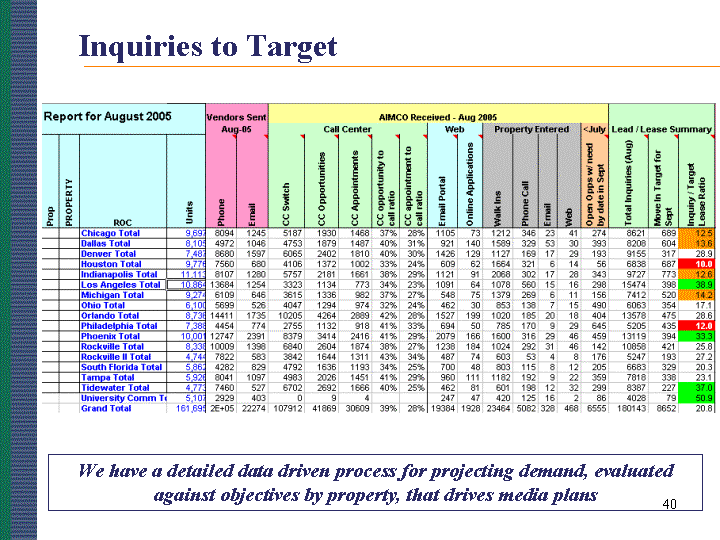
| Inquiries to Target We have a detailed data driven process for projecting demand, evaluated against objectives by property, that drives media plans |
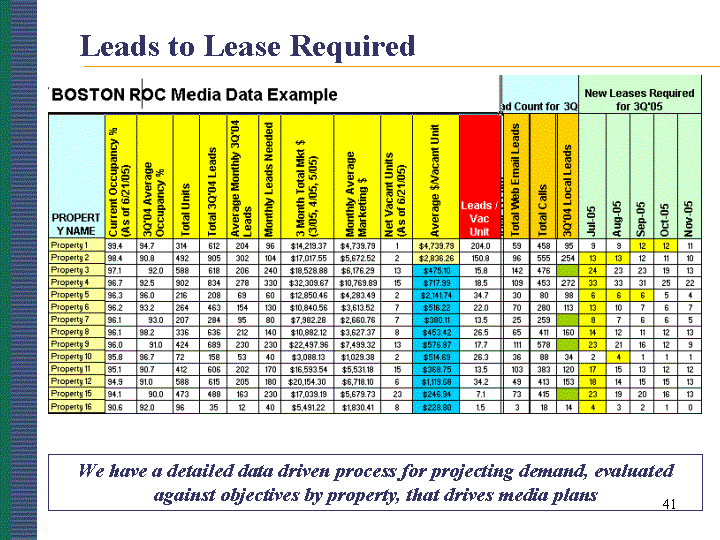
| Leads to Lease Required We have a detailed data driven process for projecting demand, evaluated against objectives by property, that drives media plans |
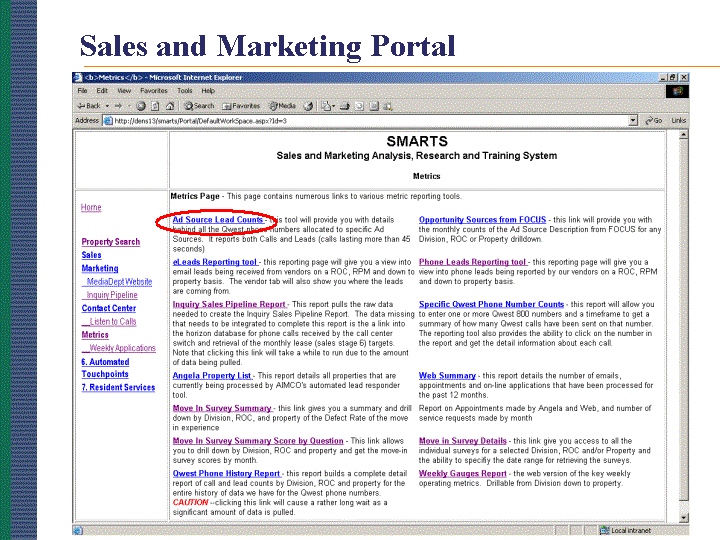
| Sales and Marketing Portal |
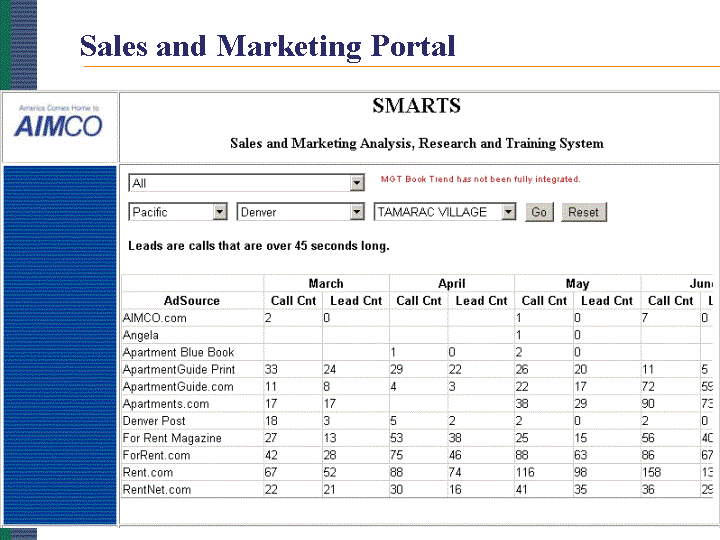
| Sales and Marketing Portal |
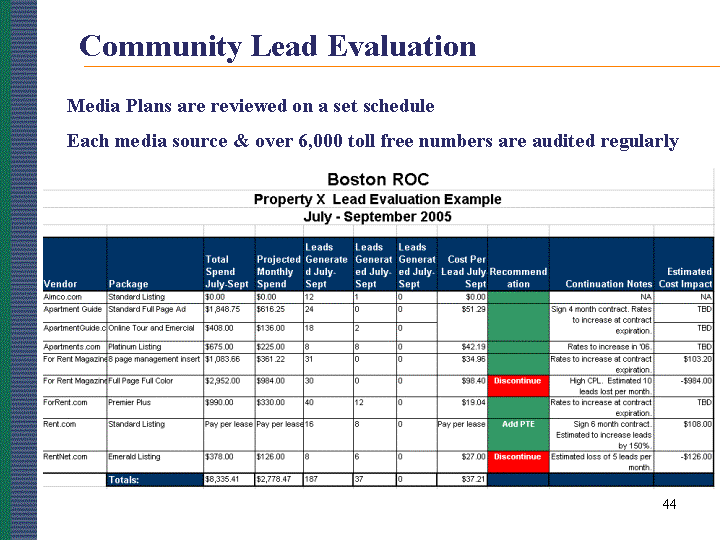
| Community Lead Evaluation Media Plans are reviewed on a set schedule Each media source & over 6,000 toll free numbers are audited regularly |
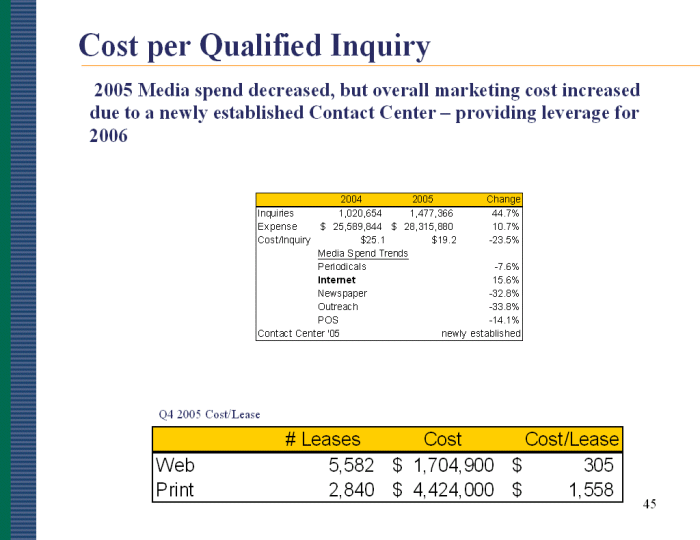
| Cost per Qualified Inquiry Q4 2005 Cost/Lease 2005 Media spend decreased, but overall marketing cost increased due to a newly established Contact Center - providing leverage for 2006 |
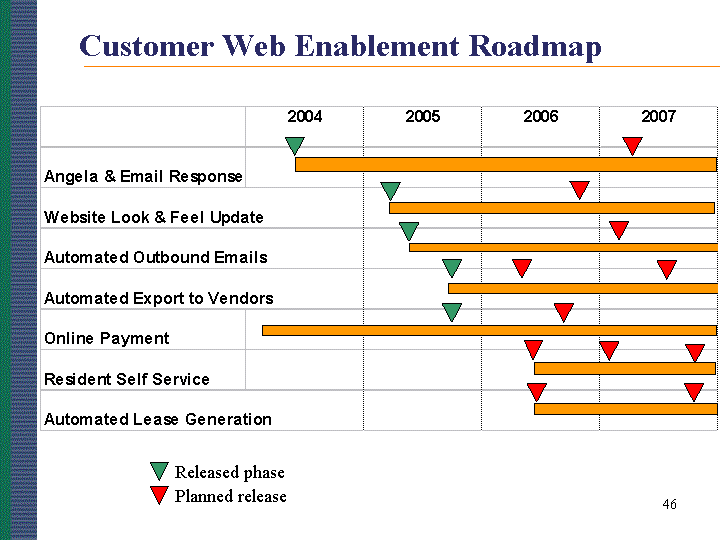
| Released phase Planned release Customer Web Enablement Roadmap |

| Improved Customer Acquisition |
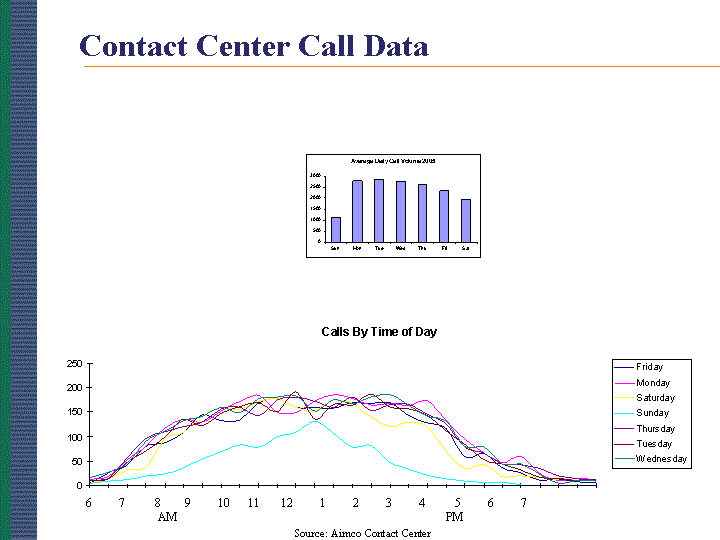
| Contact Center Call Data 6 7 8 9 10 11 12 1 2 3 4 5 6 7 AM PM Source: Aimco Contact Center |
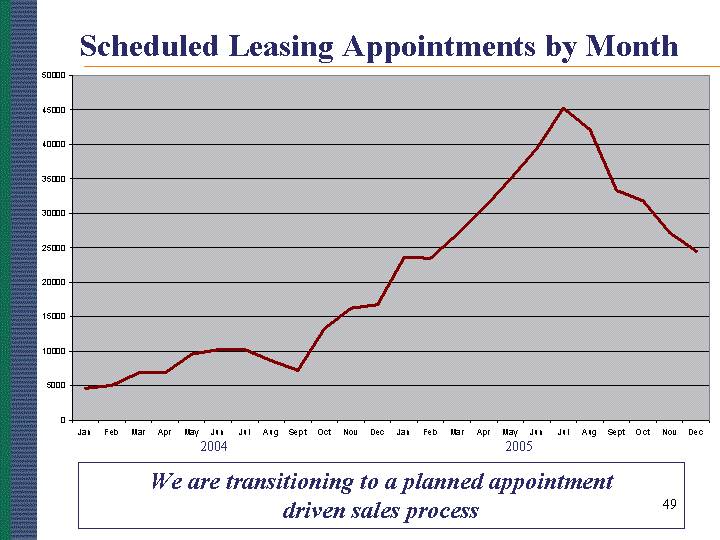
| Scheduled Leasing Appointments by Month We are transitioning to a planned appointment driven sales process 2004 2005 |
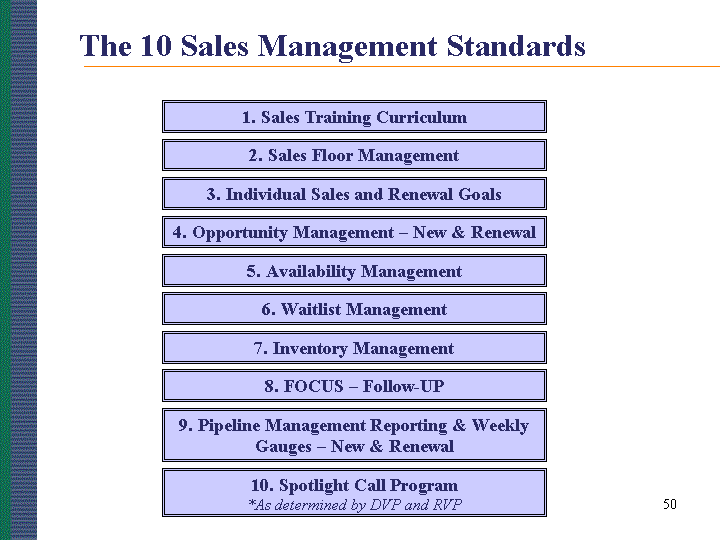
| 1. Sales Training Curriculum 2. Sales Floor Management 4. Opportunity Management - New & Renewal 6. Waitlist Management 5. Availability Management 7. Inventory Management 8. FOCUS - Follow-UP 9. Pipeline Management Reporting & Weekly Gauges - New & Renewal 3. Individual Sales and Renewal Goals 10. Spotlight Call Program *As determined by DVP and RVP The 10 Sales Management Standards |

| Acquisition Sales Pipeline: Need by Date by Stage Sales Pipeline Stages Open Sales Opportunity and Customer "Need By" date is Between 7/1/05 and 9/30/05 Open Sales Opportunity and Customer "Need By" date is after 9/30/05 TOTAL Open Sales Opportunities Scheduled Appointments 25,191 723 25,914 Sales Stage 0: Inquiries 48,155 2,421 50,576 Sales Stage 1: Prospecting/Visits 19,852 893 20,745 Sales Stage 2: Application Pending 3,906 173 4,079 Sales Stage 3: Application Approved 1,917 6 1,923 Sales Stage 4: Application Approved w/ Conditions 141 0 141 Sales Stage 5: Leased and Lease is signed, Move-in date is scheduled 3,331 3 3,334 TOTAL 102,493 4,219 106,712 |
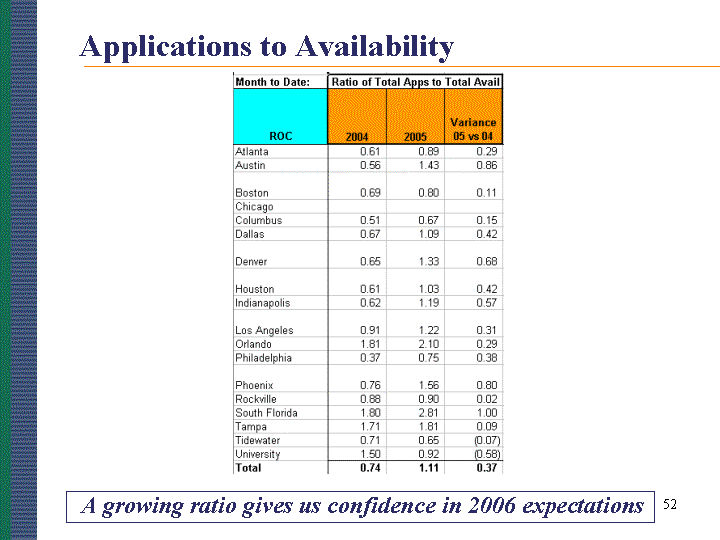
| Applications to Availability A growing ratio gives us confidence in 2006 expectations |
| Data Driven Decision Making Pricing & Revenue Management Financial Decision Support Forward Looking Metrics |

| Pricing Core Rent Growth Exceeds Total Same Store Sales Total SSS Core |
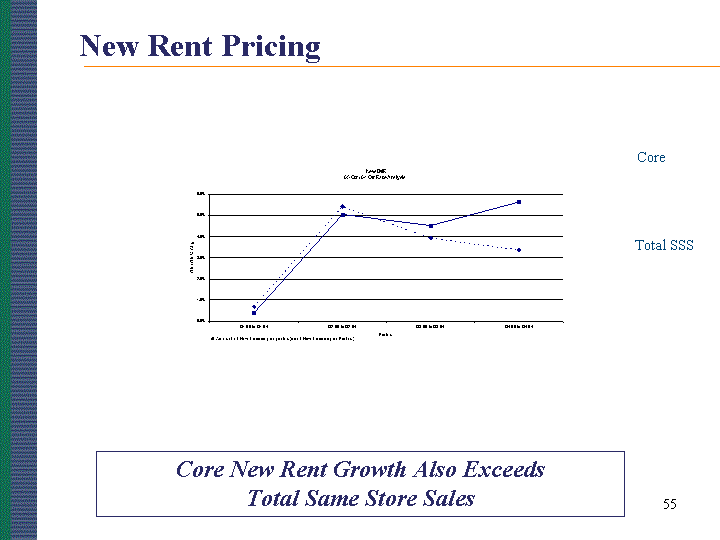
| New Rent Pricing Core New Rent Growth Also Exceeds Total Same Store Sales Total SSS Core |
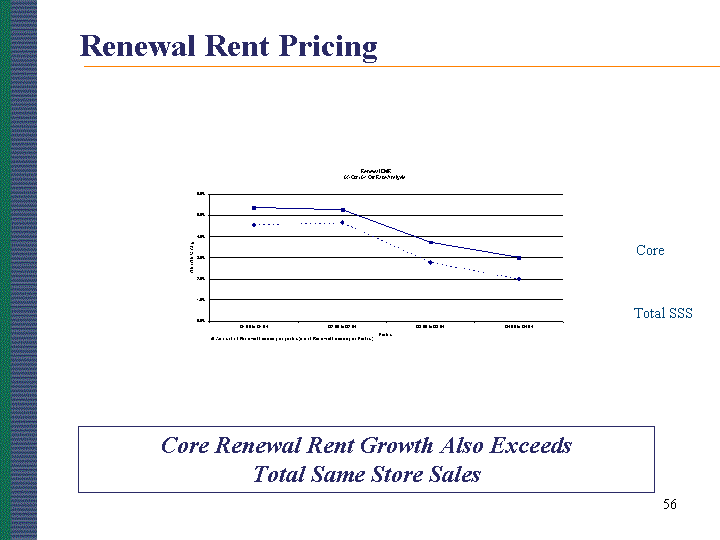
| Renewal Rent Pricing Core Renewal Rent Growth Also Exceeds Total Same Store Sales Total SSS Core |
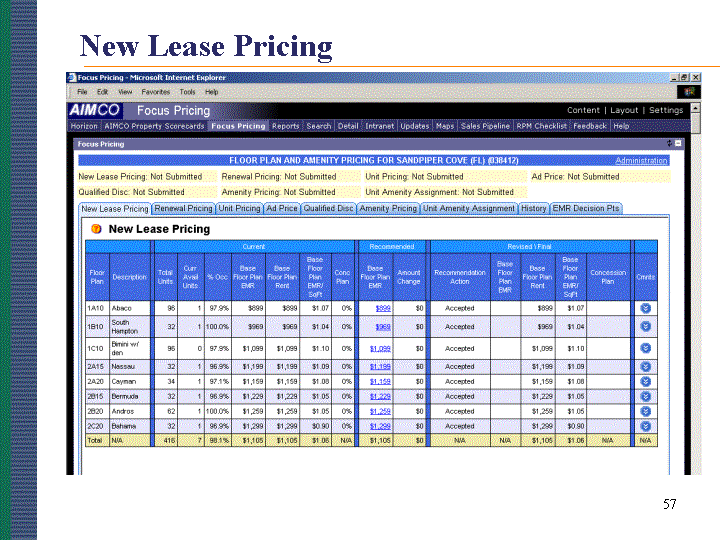
| New Lease Pricing |

| Renewal Lease Pricing |
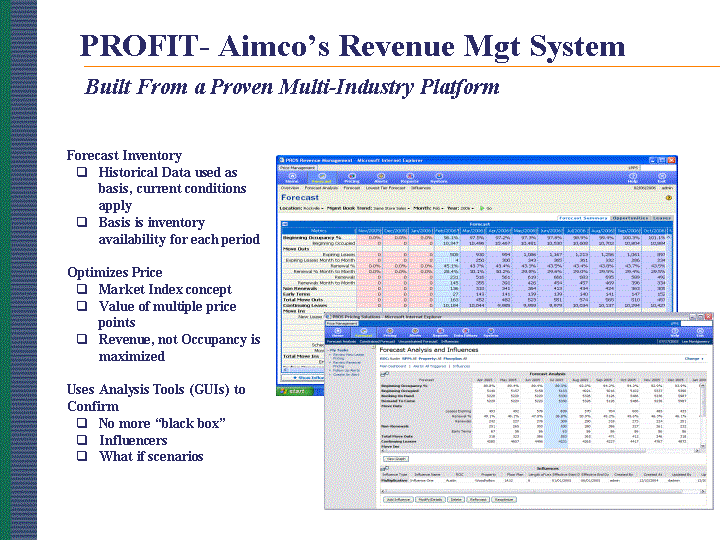
| PROFIT- Aimco's Revenue Mgt System PROFIT- Aimco's Revenue Mgt System Forecast Inventory Historical Data used as basis, current conditions apply Basis is inventory availability for each period Optimizes Price Market Index concept Value of multiple price points Revenue, not Occupancy is maximized Uses Analysis Tools (GUIs) to Confirm No more "black box" Influencers What if scenarios Built From a Proven Multi-Industry Platform |

| Improved Customer Service Maintenance Service & Customer Retention Improved Property Physical Conditions |
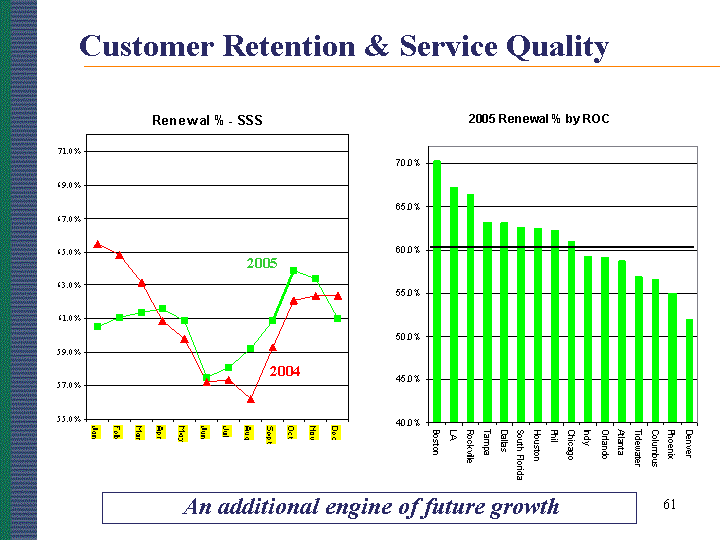
| Customer Retention & Service Quality An additional engine of future growth 2004 2005 |
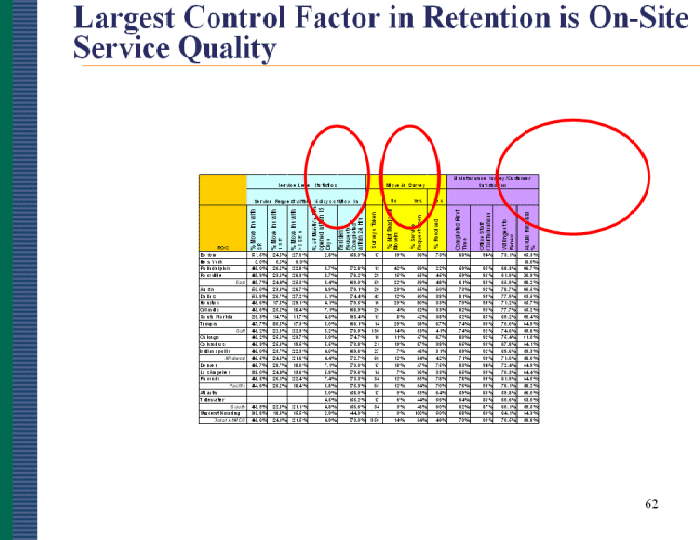
| Largest Control Factor in Retention is On-Site Service Quality |
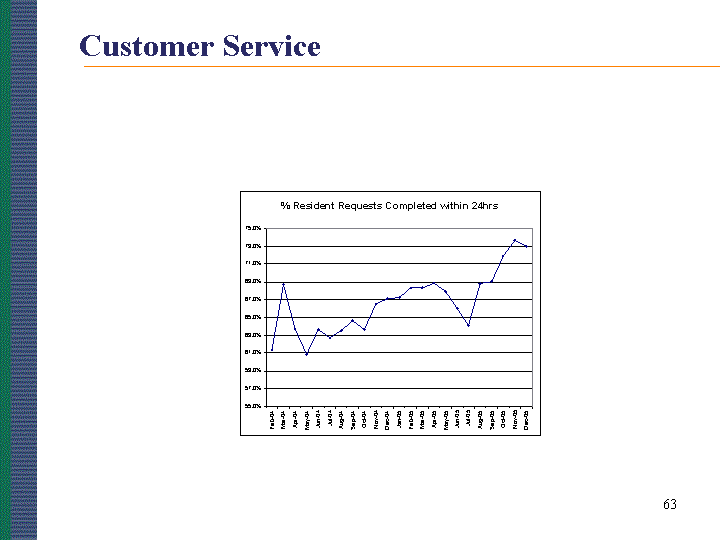
| Customer Service |

| Customized with customer and property name 2-day Move-in Survey |

| Conventional Operations: 2006 Financial Objectives Revenue + 5-6% Expenses + 3-4% NOI + 6.5-7.5% |
| Expense Management |
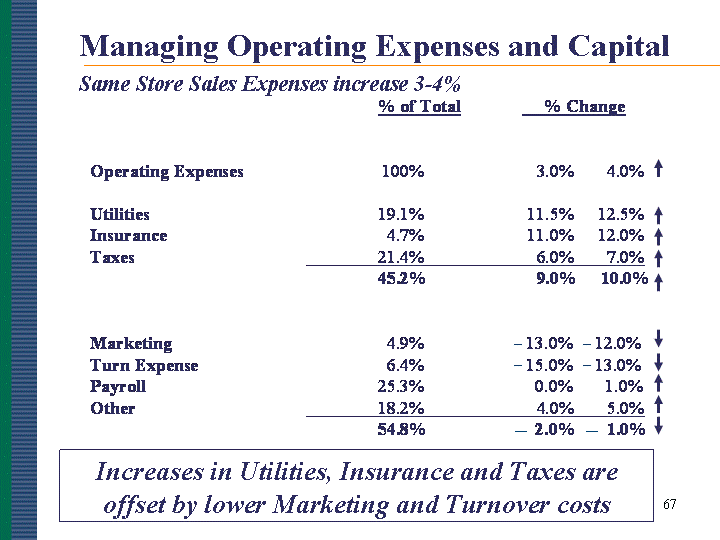
| Managing Operating Expenses and Capital Increases in Utilities, Insurance and Taxes are offset by lower Marketing and Turnover costs Same Store Sales Expenses increase 3-4% _ _ _ _ _ _ |

| Controlling Payroll Expense Salaries are expected to increase 2 - 3% Decrease in Benefit Costs Optimize seasonal and temporary work force Scheduled production by property 2005 NAA estimated at 3.5% Properties are adequately staffed 2006 increase 0 - 1% |

| Managing Utility Expense Utility expense components: Electric (28%) Natural Gas (27%) Water/Sewer (43%) Other Utilities (2%) Recoup 40% of Utility Expense 25% increase in Natural Gas Natural Gas is split 50/50 between deregulated and regulated markets Price is locked in deregulated markets until Q1 2007 Expand sub-metering for utilities in all markets where feasible 2006 increase 11.5 - 12.5% |
| Unit Turn Production Management |
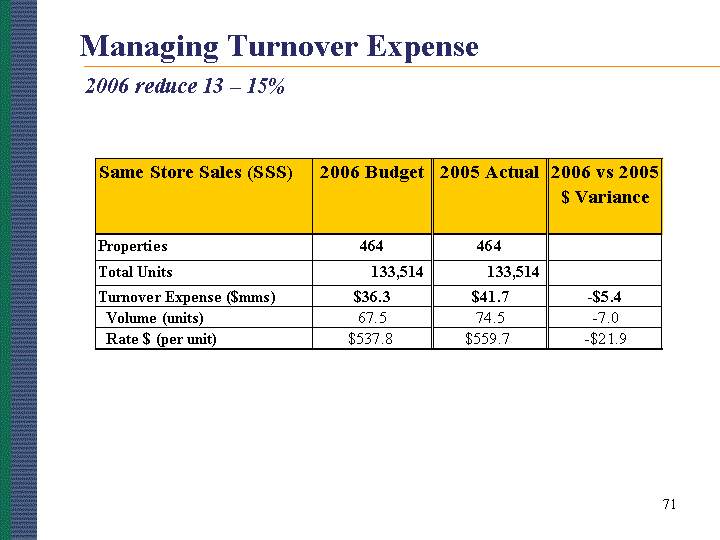
| Managing Turnover Expense 2006 reduce 13 - 15% |
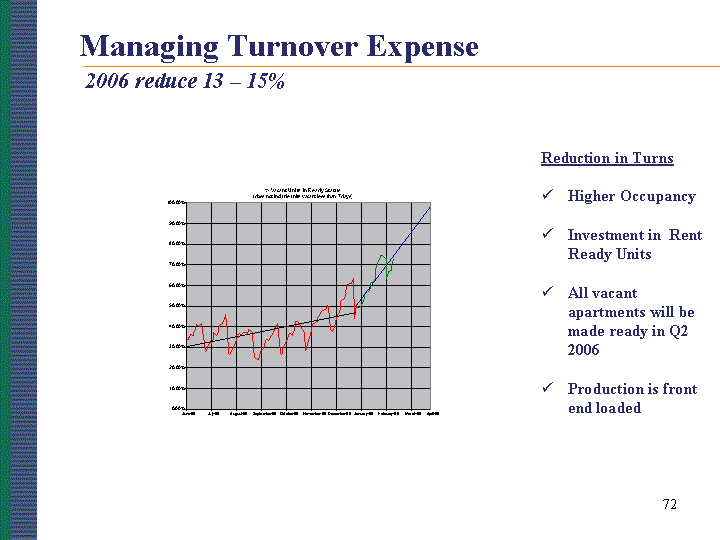
| Reduction in Turns Higher Occupancy Investment in Rent Ready Units All vacant apartments will be made ready in Q2 2006 Production is front end loaded Managing Turnover Expense 2006 reduce 13 - 15% |
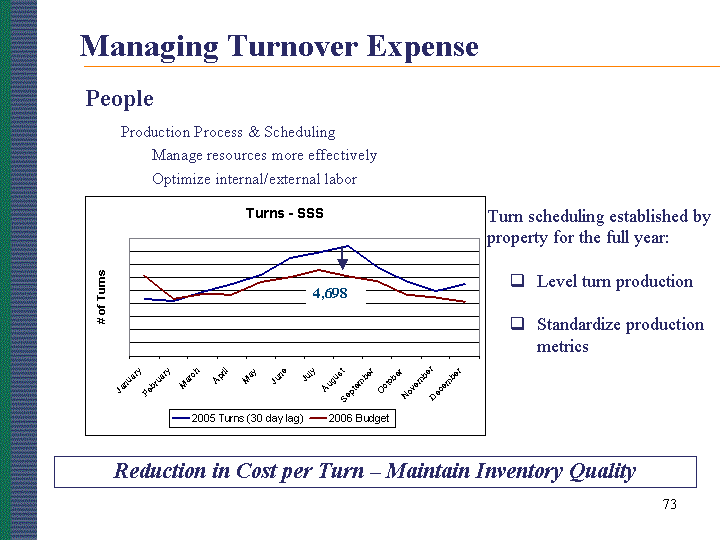
| Managing Turnover Expense People Production Process & Scheduling Manage resources more effectively Optimize internal/external labor Turn scheduling established by property for the full year: Level turn production Standardize production metrics Reduction in Cost per Turn - Maintain Inventory Quality 4,698 |
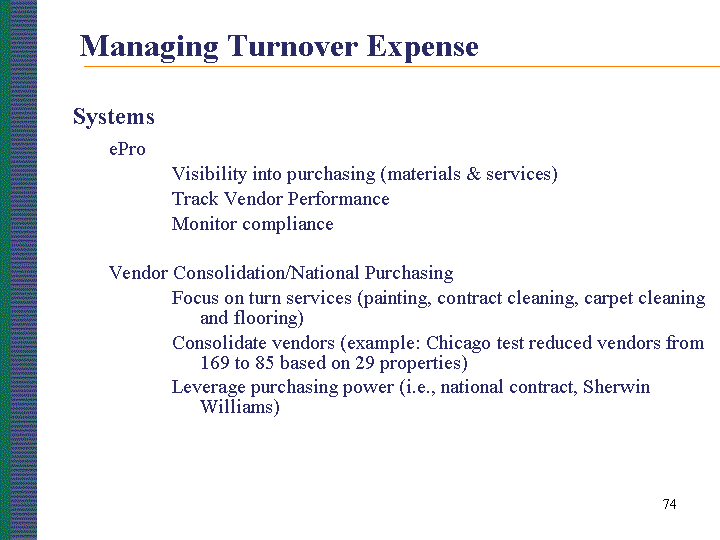
| Managing Turnover Expense Systems ePro Visibility into purchasing (materials & services) Track Vendor Performance Monitor compliance Vendor Consolidation/National Purchasing Focus on turn services (painting, contract cleaning, carpet cleaning and flooring) Consolidate vendors (example: Chicago test reduced vendors from 169 to 85 based on 29 properties) Leverage purchasing power (i.e., national contract, Sherwin Williams) |
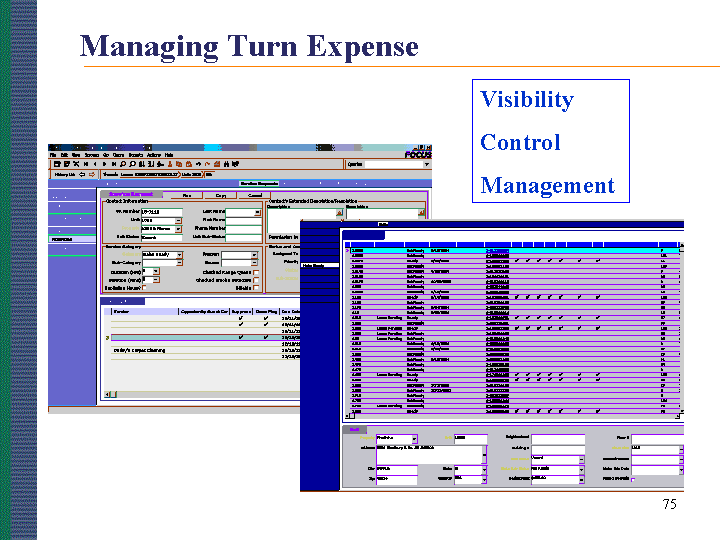
| Managing Turn Expense |

| Redevelopment & Capital Management |

| Managing Turn Capital Allows for Continued Investment in Project Capital Reduce Capital Spending on Turns Reduction in Turn CR Capital (AIV) $6.8mm - $63 per unit |
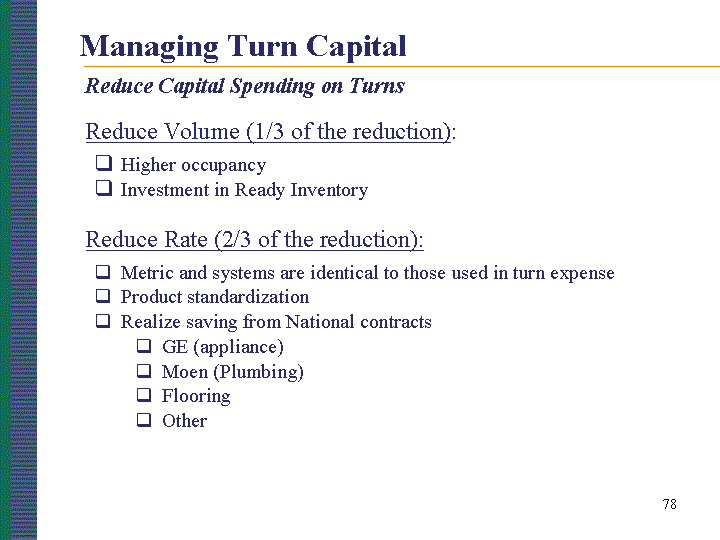
| Managing Turn Capital Reduce Volume (1/3 of the reduction): Higher occupancy Investment in Ready Inventory Reduce Rate (2/3 of the reduction): Metric and systems are identical to those used in turn expense Product standardization Realize saving from National contracts GE (appliance) Moen (Plumbing) Flooring Other Reduce Capital Spending on Turns |
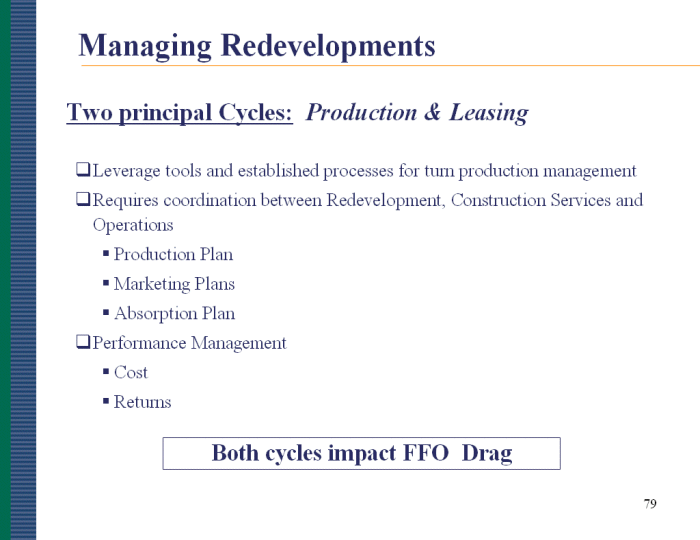
| Managing Redevelopments Two principal Cycles: Production & Leasing Leverage tools and established processes for turn production management Requires coordination between Redevelopment, Construction Services and Operations Production Plan Marketing Plans Absorption Plan Performance Management Cost Returns Both cycles impact FFO Drag |
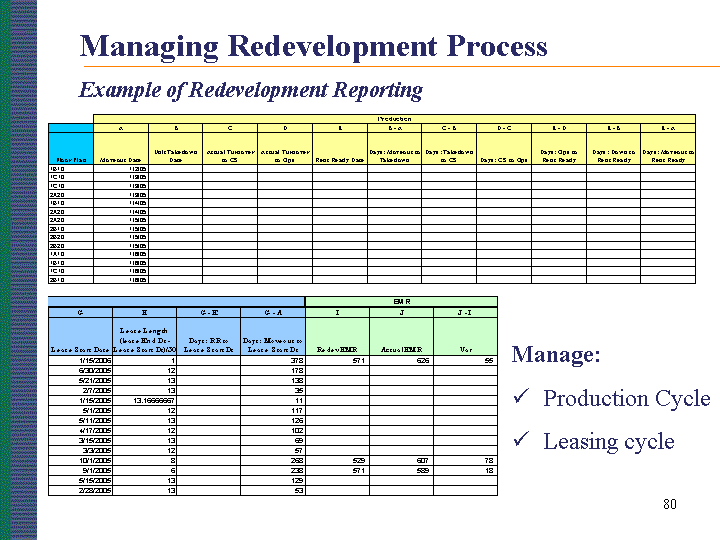
| Example of Redevelopment Reporting Manage: Production Cycle Leasing cycle Managing Redevelopment Process |

| Managing the Properties Scale team to accommodate changing portfolio size 63.6K Units 25.9K Units 33.1K Units 28.9K Units |

| Applying the Tool Kit on the Ground "Execution in the Field" People Leadership & Alignment Pricing / Rate Expense Management while Maintaining Quality / Effectiveness |
| TIM BEAUDIN CHIEF DEVELOPMENT OFFICER |
| The 15 person development team is focused on creating value by upgrading Aimco properties and by developing new ones We target returns of 100 to 150 basis points above the relevant cost of capital We have a deep pipeline and this is a multi-year opportunity Redevelopment - Objective |

| In 2006 we plan to invest between $150 and $200 million (not AIV ownership adjusted) in conventional redevelopment and target a 7.5% to 8.5% return This will impact approximately 70 communities representing nearly 30,000 units Affordable expenditures will be approximately $80 million, predominantly funded with tax credit equity This will impact approximately 20-25 communities representing more than 3,000 units Redevelopment - 2006 |
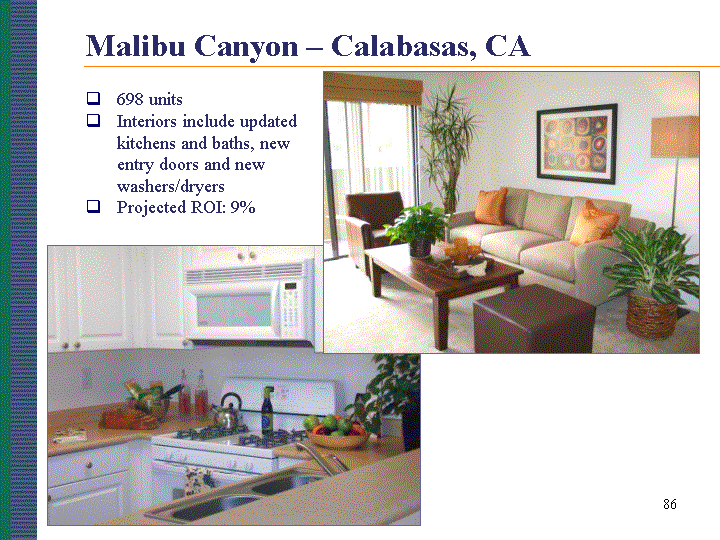
| Malibu Canyon - Calabasas, CA 698 units Interiors include updated kitchens and baths, new entry doors and new washers/dryers Projected ROI: 9% |
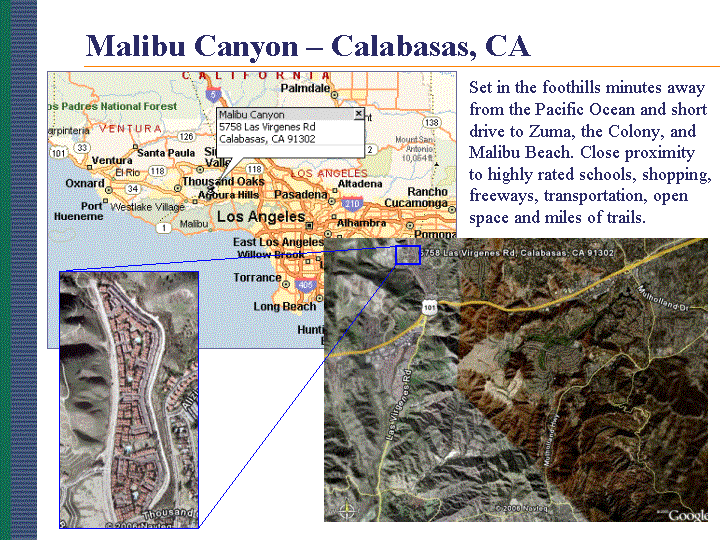
| Set in the foothills minutes away from the Pacific Ocean and short drive to Zuma, the Colony, and Malibu Beach. Close proximity to highly rated schools, shopping, freeways, transportation, open space and miles of trails. Malibu Canyon - Calabasas, CA |
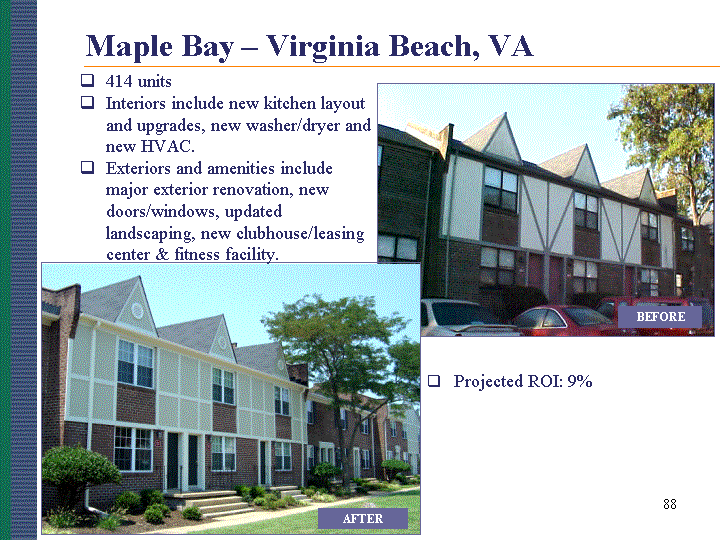
| AFTER BEFORE Maple Bay - Virginia Beach, VA 414 units Interiors include new kitchen layout and upgrades, new washer/dryer and new HVAC. Exteriors and amenities include major exterior renovation, new doors/windows, updated landscaping, new clubhouse/leasing center & fitness facility. Projected ROI: 9% |

| Located less than a mile from the Atlantic Ocean beachfront and boardwalk attractions. Set on high ground amid upscale retail and restaurants on Laskin Boulevard, running directly to the beach. Close to Norfolk International Airport and the new MacArthur Center Mall in downtown Norfolk. Maple Bay - Virginia Beach, VA |
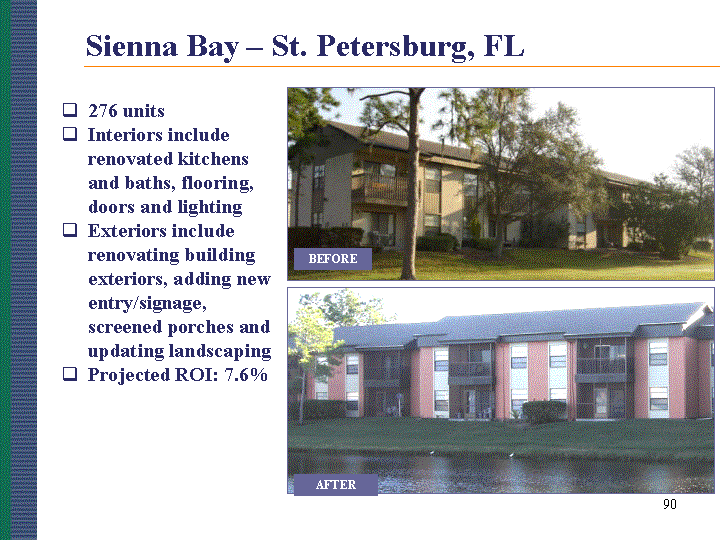
| BEFORE AFTER Sienna Bay - St. Petersburg, FL 276 units Interiors include renovated kitchens and baths, flooring, doors and lighting Exteriors include renovating building exteriors, adding new entry/signage, screened porches and updating landscaping Projected ROI: 7.6% |
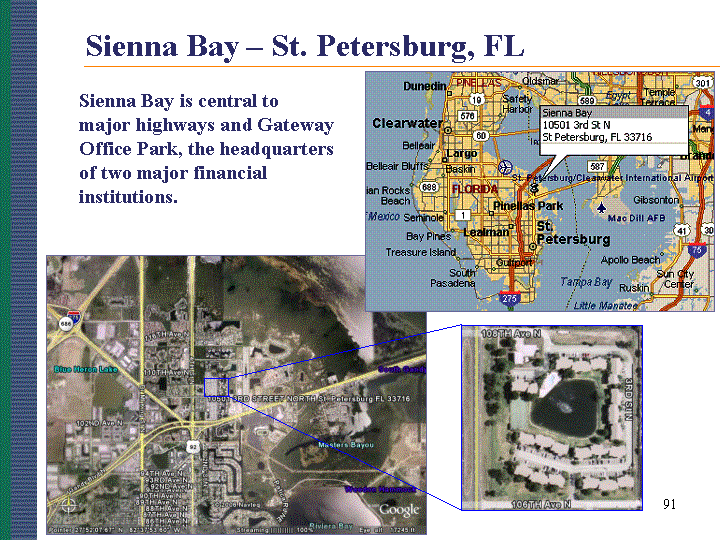
| Sienna Bay is central to major highways and Gateway Office Park, the headquarters of two major financial institutions. Sienna Bay - St. Petersburg, FL |
| Redevelopment projects will have a broad range of upgrades and may typically include: Renovated kitchens and bathrooms including appliances, cabinets, and counters tops New flooring, lighting and paint New/updated amenities (clubhouse, leasing center, pool) Exterior renovation and updated landscaping Energy conservation measures We target a 90 day redevelopment cycle including 60 days down time for redevelopment work and 30 days lease-up causing an approximate drag on earnings of $0.02 cents per quarter Currently, new rents on redevelopment lease-up are averaging +33% Redevelopment - 2006 |

| Major redevelopment project included all new buildings (326 units), landscaping and common area amenities. Interiors include vaulted ceilings, crown molding, hardwood floors & tiled bathrooms. Belmont Place - Marietta, GA Amenities include pool area with waterfall, modern fitness center, and many resident services. Projected ROI: 9% |
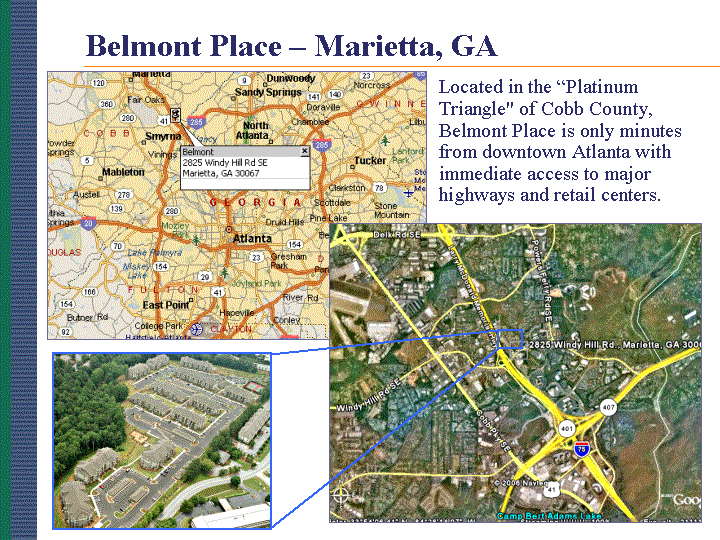
| Located in the "Platinum Triangle" of Cobb County, Belmont Place is only minutes from downtown Atlanta with immediate access to major highways and retail centers. Belmont Place - Marietta, GA |
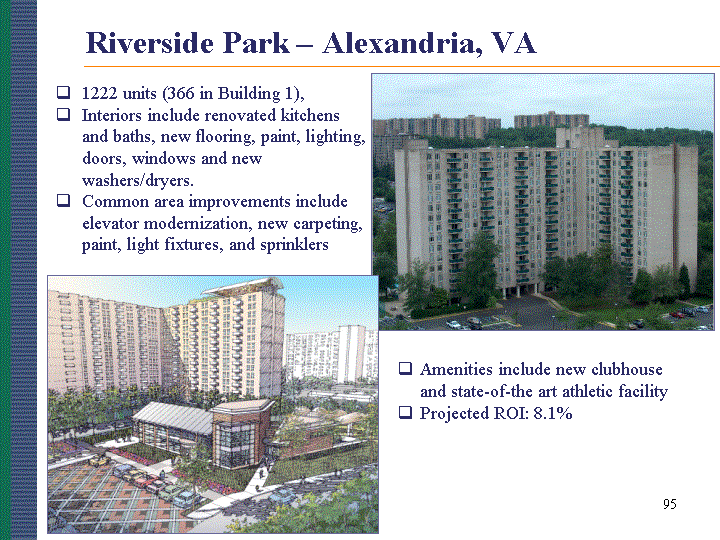
| Riverside Park - Alexandria, VA 1222 units (366 in Building 1), Interiors include renovated kitchens and baths, new flooring, paint, lighting, doors, windows and new washers/dryers. Common area improvements include elevator modernization, new carpeting, paint, light fixtures, and sprinklers Amenities include new clubhouse and state-of-the art athletic facility Projected ROI: 8.1% |
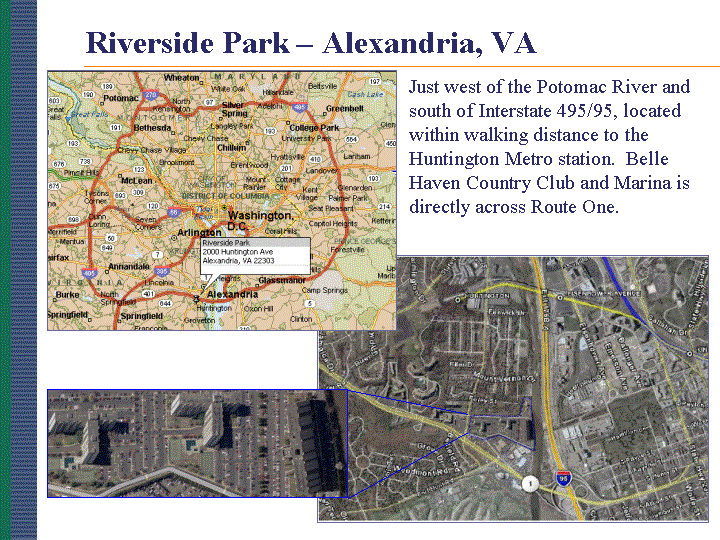
| Just west of the Potomac River and south of Interstate 495/95, located within walking distance to the Huntington Metro station. Belle Haven Country Club and Marina is directly across Route One. Riverside Park - Alexandria, VA |
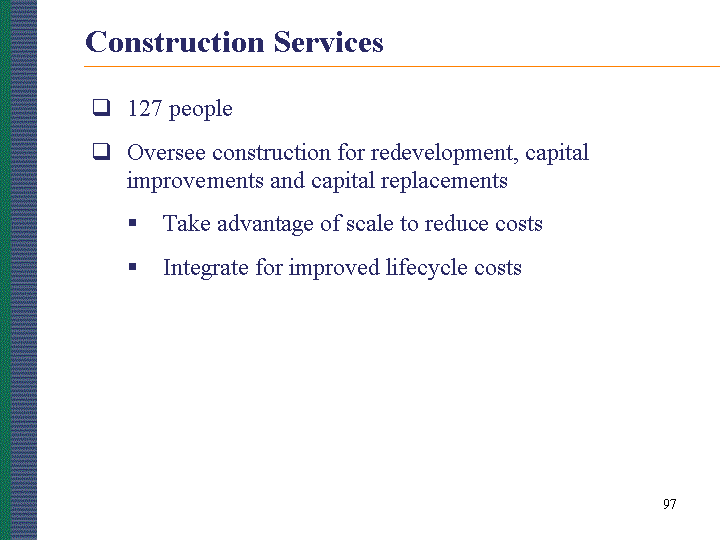
| 127 people Oversee construction for redevelopment, capital improvements and capital replacements Take advantage of scale to reduce costs Integrate for improved lifecycle costs Construction Services |
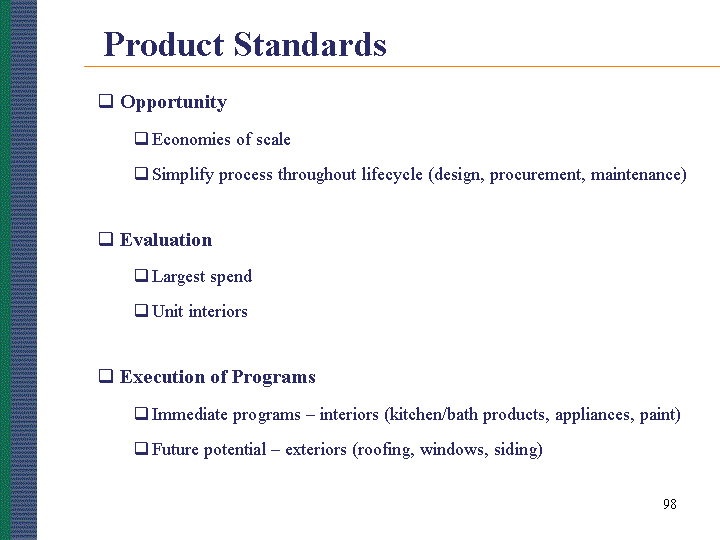
| Product Standards Opportunity Economies of scale Simplify process throughout lifecycle (design, procurement, maintenance) Evaluation Largest spend Unit interiors Execution of Programs Immediate programs - interiors (kitchen/bath products, appliances, paint) Future potential - exteriors (roofing, windows, siding) |
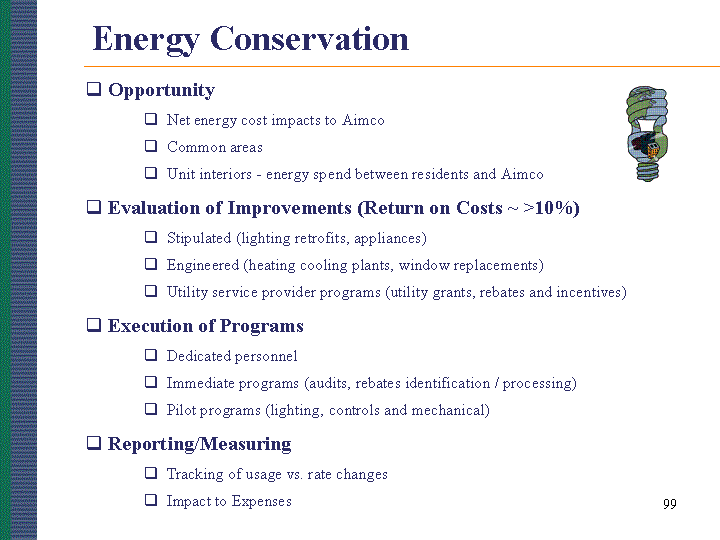
| Energy Conservation Opportunity Net energy cost impacts to Aimco Common areas Unit interiors - energy spend between residents and Aimco Evaluation of Improvements (Return on Costs ~ >10%) Stipulated (lighting retrofits, appliances) Engineered (heating cooling plants, window replacements) Utility service provider programs (utility grants, rebates and incentives) Execution of Programs Dedicated personnel Immediate programs (audits, rebates identification / processing) Pilot programs (lighting, controls and mechanical) Reporting/Measuring Tracking of usage vs. rate changes Impact to Expenses |
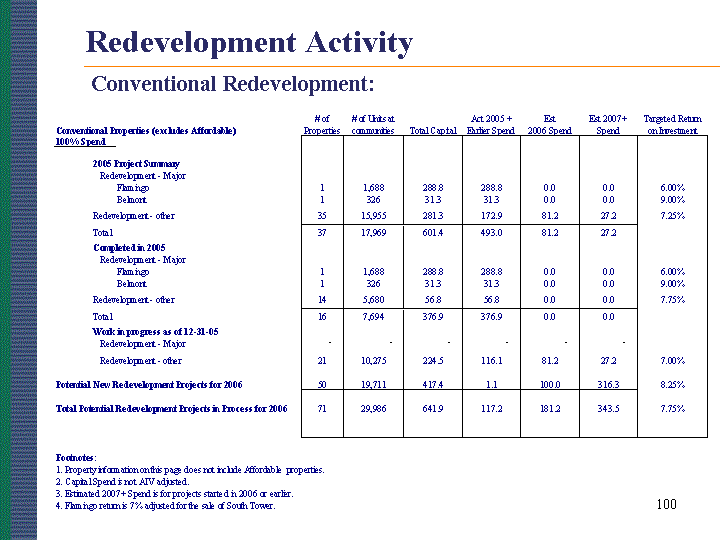
| Redevelopment Activity Conventional Redevelopment: |

| HARRY ALCOCK CHIEF INVESTMENT OFFICER LAND & ENTITLEMENTS |
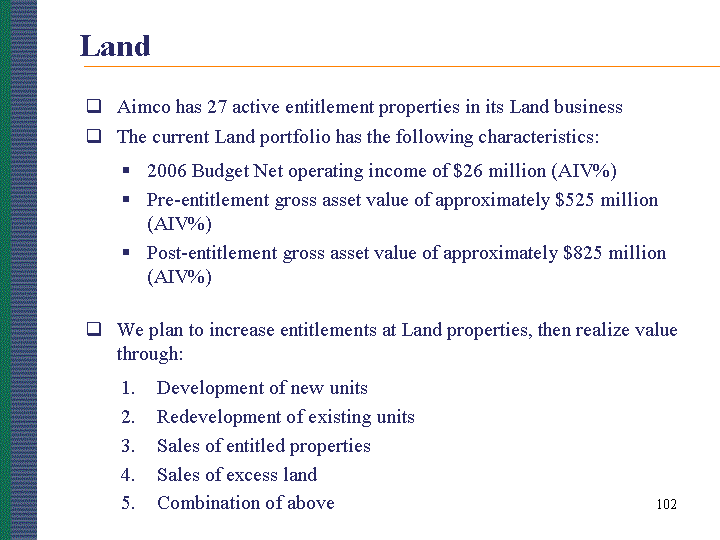
| Land Aimco has 27 active entitlement properties in its Land business The current Land portfolio has the following characteristics: 2006 Budget Net operating income of $26 million (AIV%) Pre-entitlement gross asset value of approximately $525 million (AIV%) Post-entitlement gross asset value of approximately $825 million (AIV%) We plan to increase entitlements at Land properties, then realize value through: Development of new units Redevelopment of existing units Sales of entitled properties Sales of excess land Combination of above |
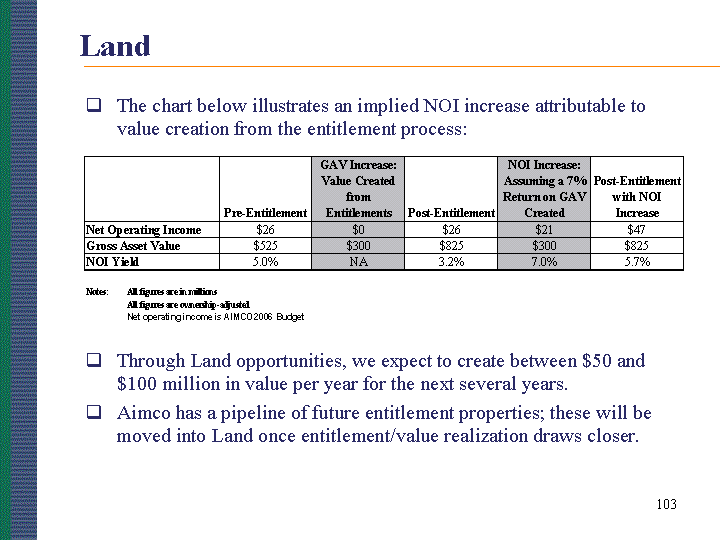
| Land The chart below illustrates an implied NOI increase attributable to value creation from the entitlement process: Through Land opportunities, we expect to create between $50 and $100 million in value per year for the next several years. Aimco has a pipeline of future entitlement properties; these will be moved into Land once entitlement/value realization draws closer. |
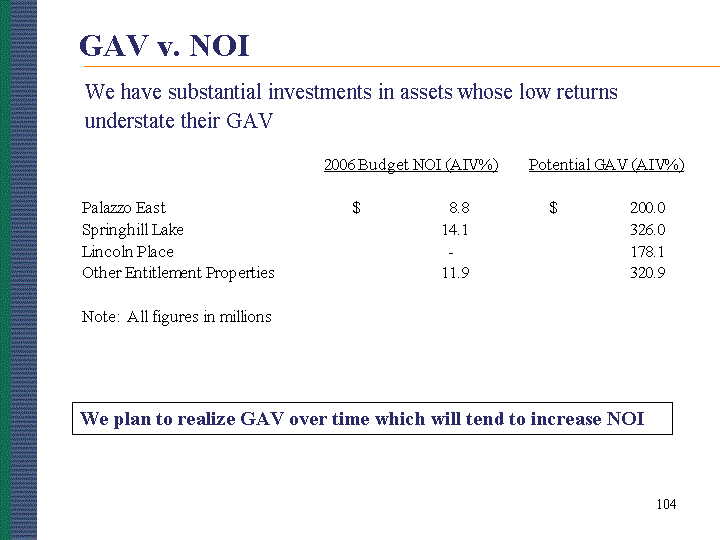
| GAV v. NOI We have substantial investments in assets whose low returns understate their GAV We plan to realize GAV over time which will tend to increase NOI |

| PATTI SHWAYDER - SVP ENTITLEMENTS |
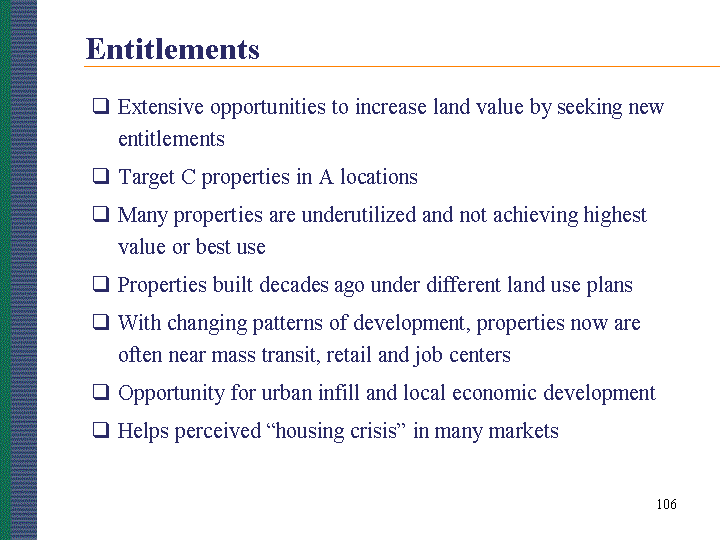
| Entitlements Extensive opportunities to increase land value by seeking new entitlements Target C properties in A locations Many properties are underutilized and not achieving highest value or best use Properties built decades ago under different land use plans With changing patterns of development, properties now are often near mass transit, retail and job centers Opportunity for urban infill and local economic development Helps perceived "housing crisis" in many markets |

| Urban infill on 157 acres in Greenbelt, MD Inside Washington, D.C. Beltway Garden apartments built in 1969 1,800 feet from METRO transit New retail and mixed use planned adjacent to property Springhill Lake |

| Springhill Lake New Urbanism plan doubled density from 2,899 to 5,800 units Transit-oriented development with walk-way to METRO Master planned community includes town square and lake New educational complex to be built south of site Variety of product including live/work lofts, walk-ups, perimeter block buildings, town homes and towers Designed by renowned planner Andres Duany and architectural team including Michael Graves, Robert A.M. Stern |
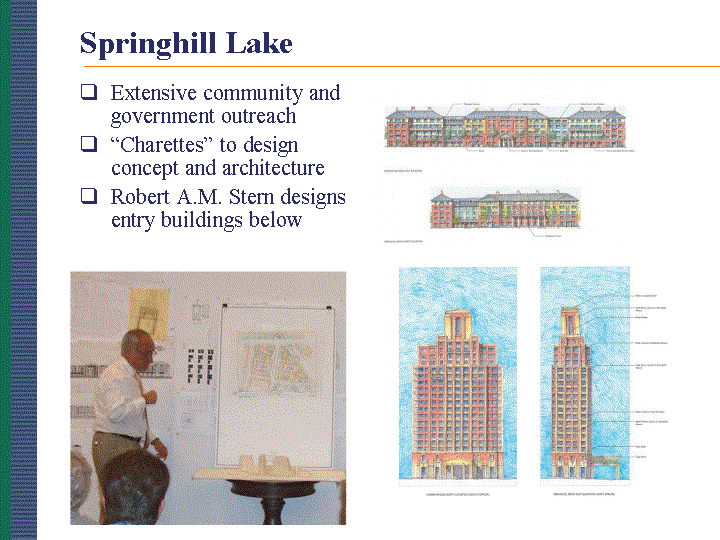
| Springhill Lake Extensive community and government outreach "Charettes" to design concept and architecture Robert A.M. Stern designs entry buildings below entry buildings below entry buildings below entry buildings below entry buildings below entry buildings below entry buildings below |
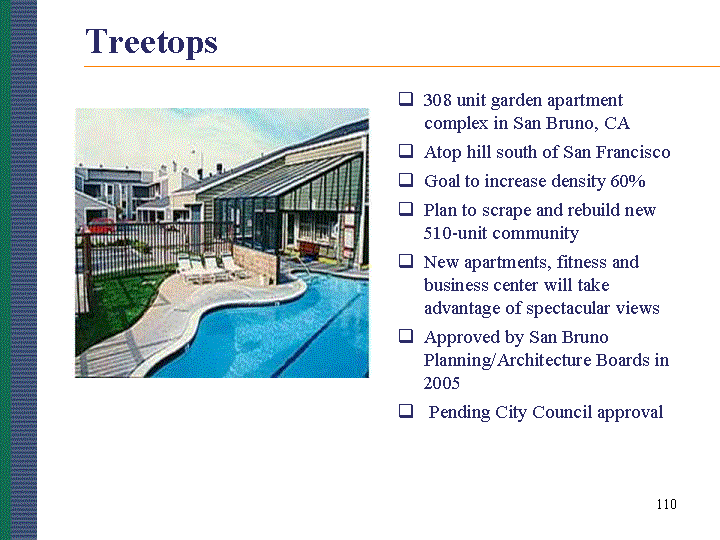
| 308 unit garden apartment complex in San Bruno, CA Atop hill south of San Francisco Goal to increase density 60% Plan to scrape and rebuild new 510-unit community New apartments, fitness and business center will take advantage of spectacular views Approved by San Bruno Planning/Architecture Boards in 2005 Pending City Council approval Treetops |
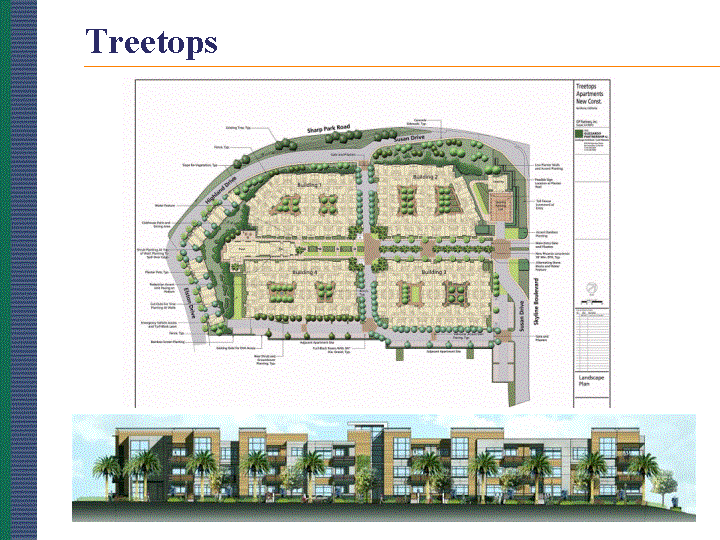
| Treetops |

| 278 unit garden apartment community Located at the gateway to Scottsdale, Arizona Built in 1971 Next to high-end retail center Underutilized site in premier location premier location premier location premier location premier location premier location premier location premier location premier location premier location Orchidtree |

| Increase density to 353 units Change zoning to include in downtown zone Flexible zoning to build as apartments or condos Architectural design of the buildings to create public art Pedestrian streetscape and entrance to downtown Scottsdale Expected approval 2006 Orchidtree |
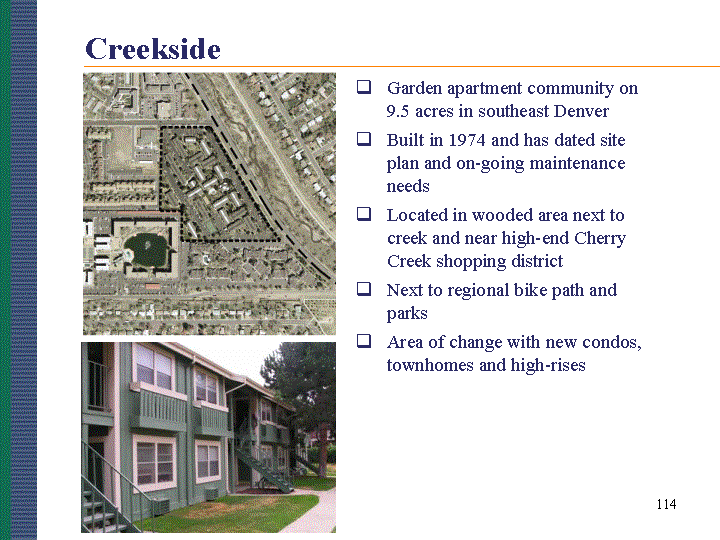
| Creekside Garden apartment community on 9.5 acres in southeast Denver Built in 1974 and has dated site plan and on-going maintenance needs Located in wooded area next to creek and near high-end Cherry Creek shopping district Next to regional bike path and parks Area of change with new condos, townhomes and high-rises |
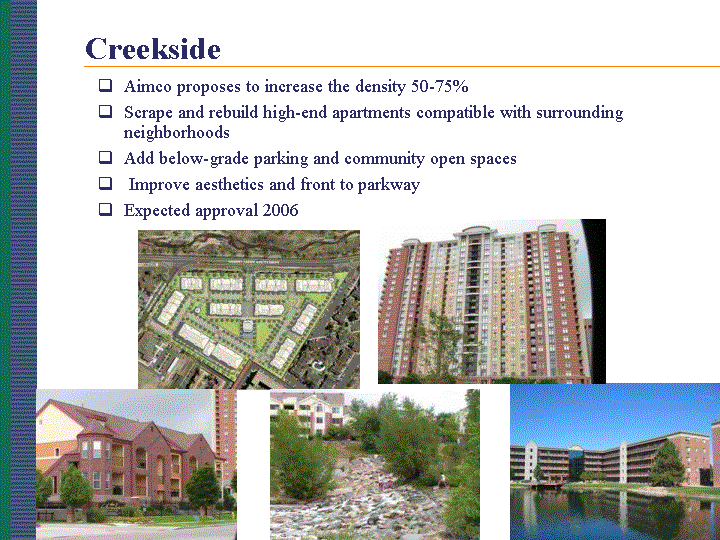
| Creekside Aimco proposes to increase the density 50-75% Scrape and rebuild high-end apartments compatible with surrounding neighborhoods Add below-grade parking and community open spaces Improve aesthetics and front to parkway Expected approval 2006 |
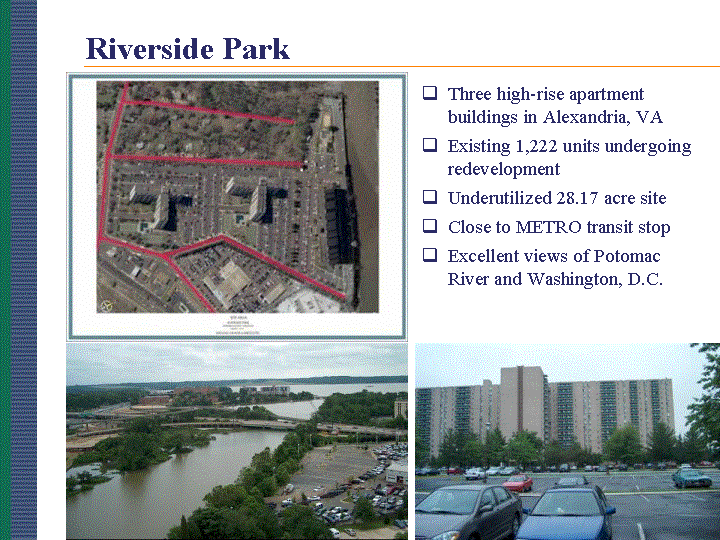
| Three high-rise apartment buildings in Alexandria, VA Existing 1,222 units undergoing redevelopment Underutilized 28.17 acre site Close to METRO transit stop Excellent views of Potomac River and Washington, D.C. Riverside Park |
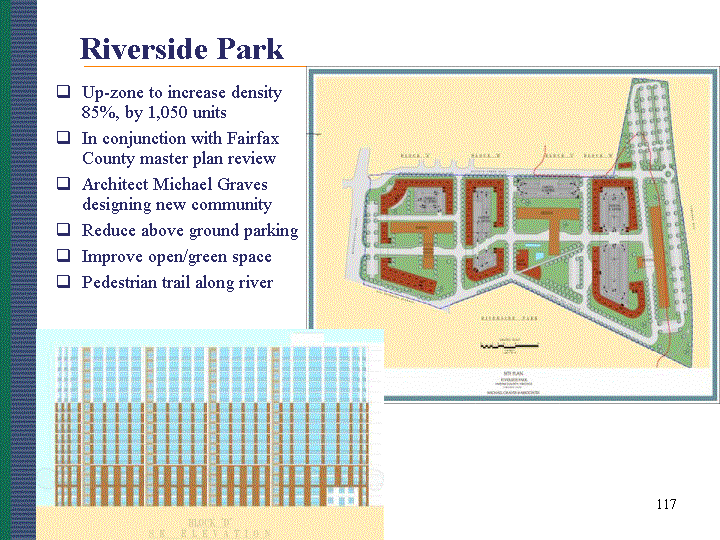
| Up-zone to increase density 85%, by 1,050 units In conjunction with Fairfax County master plan review Architect Michael Graves designing new community Reduce above ground parking Improve open/green space Pedestrian trail along river Riverside Park |

| DAVID ROBERTSON - EVP AIMCO CAPITAL |
| Aimco Capital is the umbrella for Aimco's affordable property activities Three lines of business Property ownership and management Asset management for third party investors Transactions and tax credit redevelopment Aimco Capital Overview |
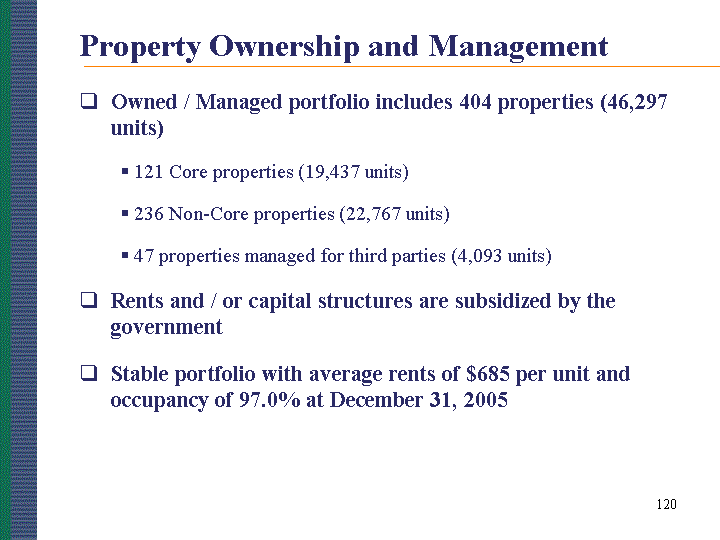
| Owned / Managed portfolio includes 404 properties (46,297 units) 121 Core properties (19,437 units) 236 Non-Core properties (22,767 units) 47 properties managed for third parties (4,093 units) Rents and / or capital structures are subsidized by the government Stable portfolio with average rents of $685 per unit and occupancy of 97.0% at December 31, 2005 Property Ownership and Management |
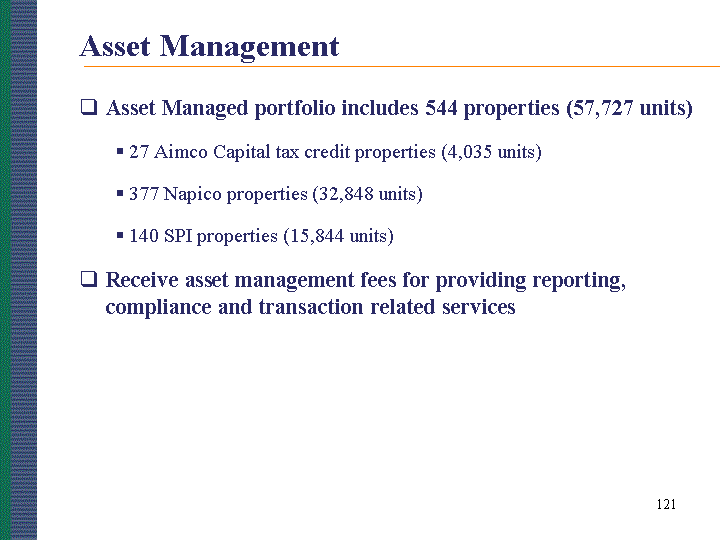
| Asset Managed portfolio includes 544 properties (57,727 units) 27 Aimco Capital tax credit properties (4,035 units) 377 Napico properties (32,848 units) 140 SPI properties (15,844 units) Receive asset management fees for providing reporting, compliance and transaction related services Asset Management |
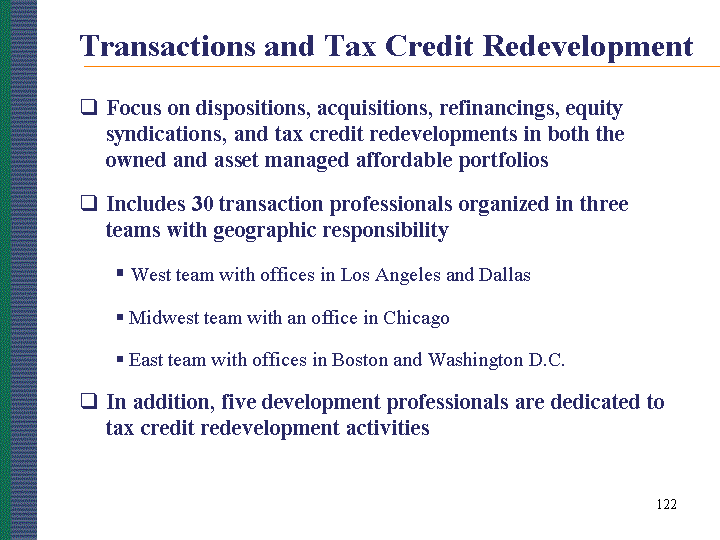
| Focus on dispositions, acquisitions, refinancings, equity syndications, and tax credit redevelopments in both the owned and asset managed affordable portfolios Includes 30 transaction professionals organized in three teams with geographic responsibility West team with offices in Los Angeles and Dallas Midwest team with an office in Chicago East team with offices in Boston and Washington D.C. In addition, five development professionals are dedicated to tax credit redevelopment activities Transactions and Tax Credit Redevelopment |
| While we earn many different types of fees, they can be grouped into the following three categories General Partner Fees Asset Management Fees Tax Credit Fees Types of Fee Revenue |
| Many partnership agreements provide that the General Partner receive fees for providing transaction related services Refinance Fees - for arranging new debt Disposition Fees - for managing the sales process Promotes - for achieving or exceeding specified returns These fees amounted to $6.4 million in 2005, or about 20% of total Aimco Capital fees General Partner Fees |
| Average fees range from $15,000 to $20,000 per property Fees are recorded as earned, but fully reserved if there is not cash available to pay them on a current basis Current Asset Management Fees represent fees that are paid on a current basis by cash generated at the property level Deferred Asset Management Fees represent previously reserved fees that are paid in connection with transactions (e.g., sales or refinancings of properties) These fees amounted to $6.5 million in 2005, or about 20% of total Aimco Capital fees Asset Management Fees |
| Fees are earned for managing tax credit redevelopments for the benefit of limited partners Syndication Fees range from 5% - 15% of equity capital raised Developer Fees typically 12% to 17% of the cost of the redevelopment Other Fees and Cash Flow Participation up to 90% in the aggregate of operating cash flow and residual value These fees amounted to $20.4 million in 2005, or about 60% of total Aimco Capital fees Tax Credit Fees |
| Low Income Housing Tax Credits (LIHTCs) were introduced in 1986 to help stimulate development of affordable housing LIHTCs are allocated to each state based on population, and then awarded to projects on a competitive basis Developers sell the LIHTCs to syndicators, who then resell them to investors (primarily banks and insurance companies) More than $550mm of LIHTCs were allocated in 2005, representing nearly $6 billion of equity capital More than 130,000 (approximately 37%) of the 350,000 new multi- family / senior housing construction starts in 2005 were financed with LIHTCs Provides opportunity for Aimco to acquire and redevelop properties while investing little if any of our own capital Low Income Housing Tax Credits |
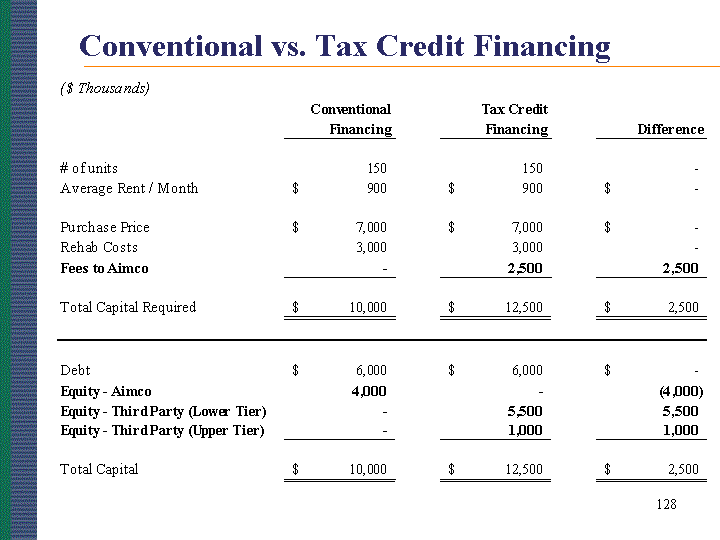
| Conventional vs. Tax Credit Financing |
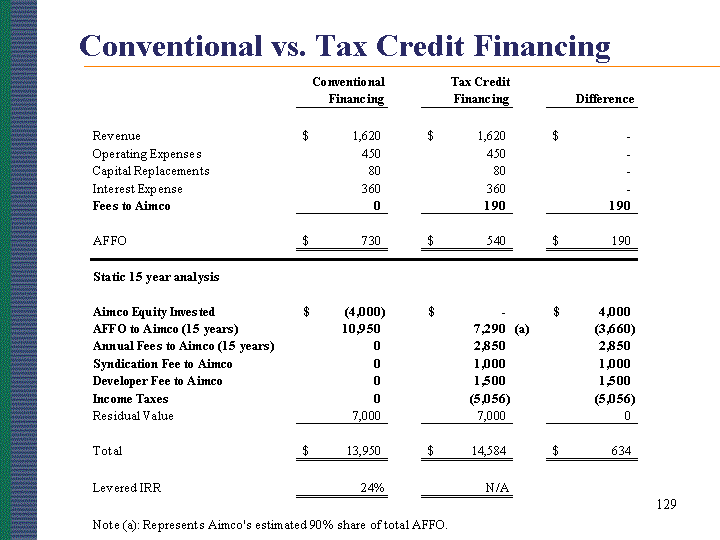
| Conventional vs. Tax Credit Financing |

| 2005 Project Park Place Apartments, 242 units in St. Louis, MO $6.1 million acquisition price and $9.6 million redevelopment Funded by $8.6 million of tax credit equity and $10.0 million of bonds One Time Fees $1.8 million Developer Fee $1.2 million Syndication Fee $120,000 Lease-Up Monitoring Fee Recurring Fees $48,000 Asset Management Fee $100,000 Property Management Fee Up to 90% of cash flow and residual Tax Credit Redevelopment |

| Aimco Capital Fee Revenue by Category |

| Total Fee Revenue |
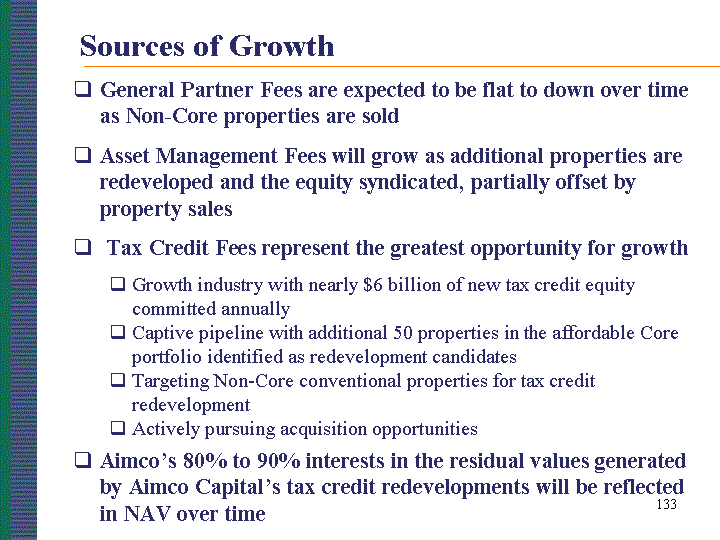
| General Partner Fees are expected to be flat to down over time as Non-Core properties are sold Asset Management Fees will grow as additional properties are redeveloped and the equity syndicated, partially offset by property sales Tax Credit Fees represent the greatest opportunity for growth Growth industry with nearly $6 billion of new tax credit equity committed annually Captive pipeline with additional 50 properties in the affordable Core portfolio identified as redevelopment candidates Targeting Non-Core conventional properties for tax credit redevelopment Actively pursuing acquisition opportunities Aimco's 80% to 90% interests in the residual values generated by Aimco Capital's tax credit redevelopments will be reflected in NAV over time Sources of Growth |

| HARRY ALCOCK CHIEF INVESTMENT OFFICER NON CORE PORTFOLIO |
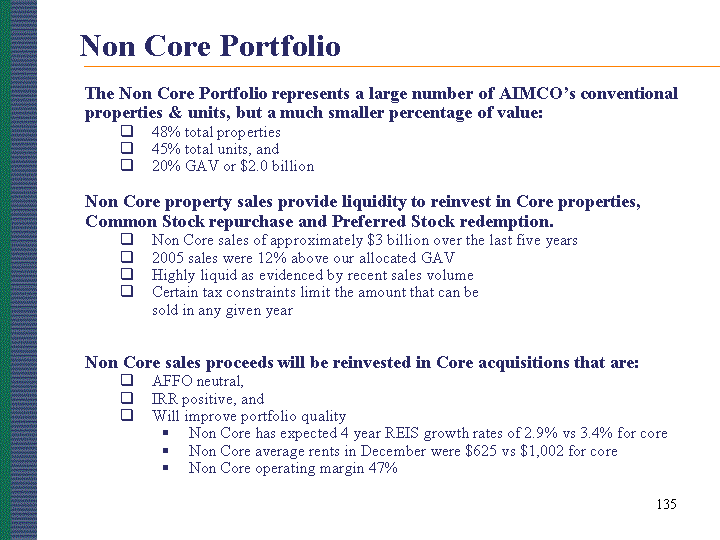
| The Non Core Portfolio represents a large number of AIMCO's conventional properties & units, but a much smaller percentage of value: 48% total properties 45% total units, and 20% GAV or $2.0 billion Non Core property sales provide liquidity to reinvest in Core properties, Common Stock repurchase and Preferred Stock redemption. Non Core sales of approximately $3 billion over the last five years 2005 sales were 12% above our allocated GAV Highly liquid as evidenced by recent sales volume Certain tax constraints limit the amount that can be sold in any given year Non Core sales proceeds will be reinvested in Core acquisitions that are: AFFO neutral, IRR positive, and Will improve portfolio quality Non Core has expected 4 year REIS growth rates of 2.9% vs 3.4% for core Non Core average rents in December were $625 vs $1,002 for core Non Core operating margin 47% Non Core Portfolio |
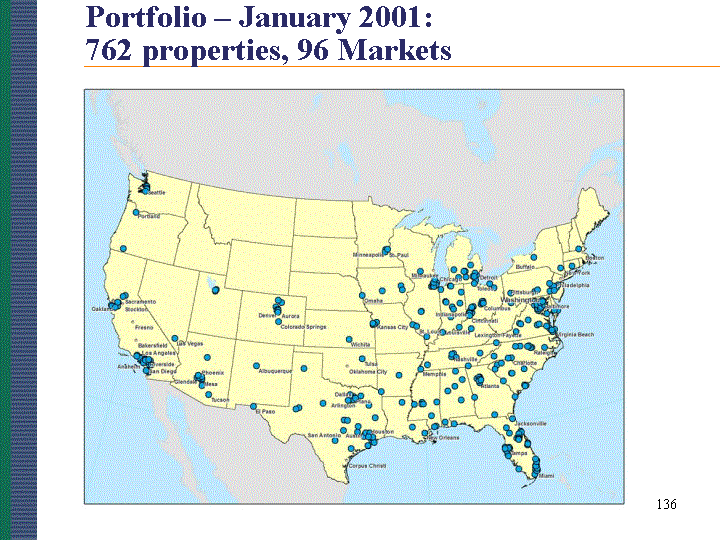
| Portfolio - January 2001: 762 properties, 96 Markets |

| Portfolio - Acquisitions January 2001 - December 2005 Acquired 61 Core Properties, For $2.2 billion Blue = Core acquisitions ($2.0 billion) Green = UComm acquisitions ($152M) |
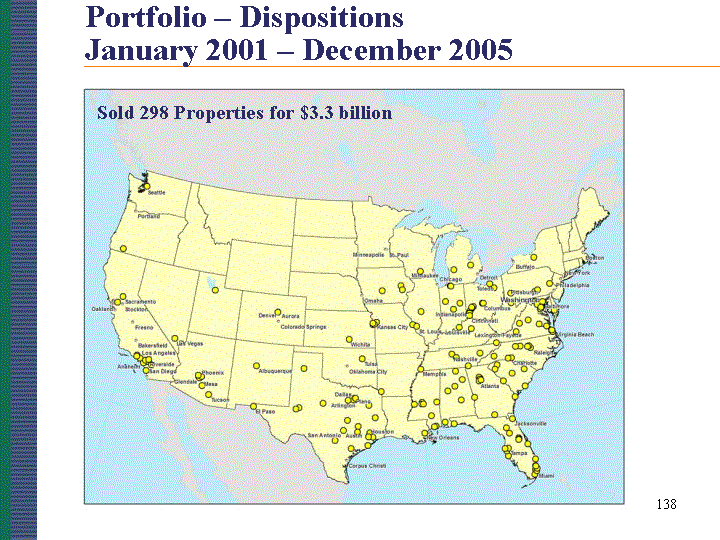
| Portfolio - Dispositions January 2001 - December 2005 Sold 298 Properties for $3.3 billion |
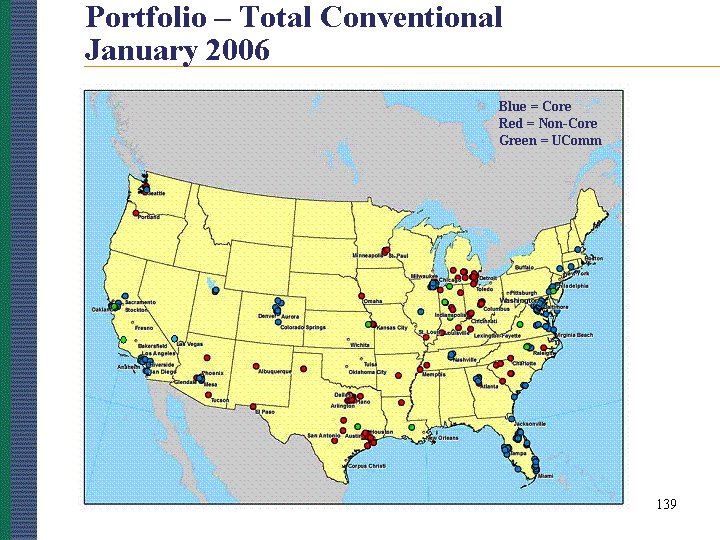
| Portfolio - Total Conventional January 2006 Blue = Core Red = Non-Core Green = UComm |
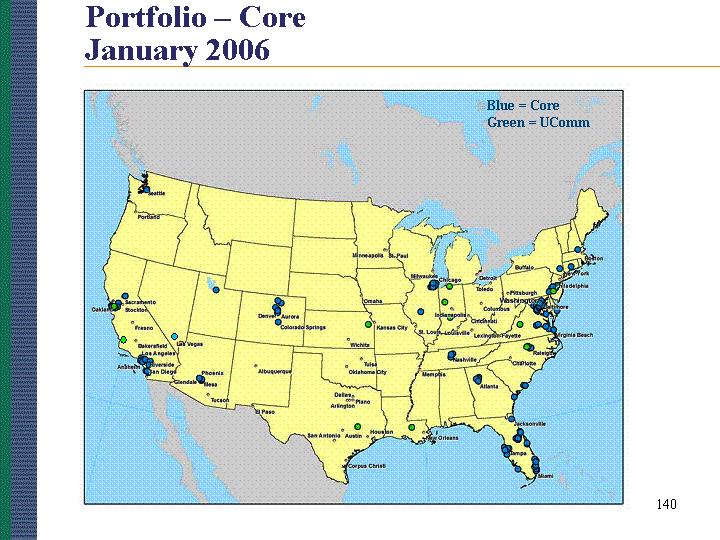
| Portfolio - Core January 2006 Blue = Core Green = UComm |
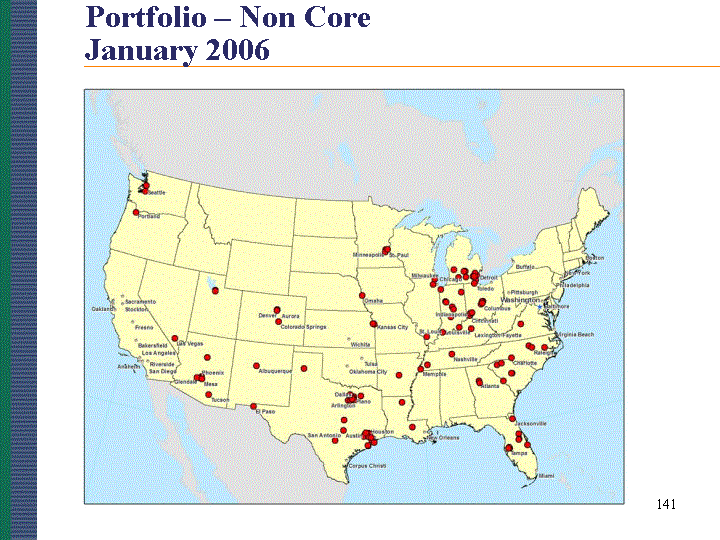
| Portfolio - Non Core January 2006 |

| PATTI FIELDING - EVP CAPITAL MARKETS |
| Aimco has a deliberate policy, different than its peers, of using non-recourse property debt. The lower risk inherent in non- recourse property debt permits Aimco to operate with higher debt leverage and a lower weighted average cost of capital Aimco's reliance on secured debt has the following advantages: Price Lower Risk Flexibility Ability to match debt terms to asset-specific strategies Capitalization Strategy |

| Floating rate debt at year-end 2005 was $2.0 billion. FFO exposure to LIBOR fluctuations is mitigated by tax exempt debt, capitalized interest and floating rate assets: Capitalization - Floating Rate Exposure |

| Aimco funds its redevelopment spending in the following three ways: Releveraging the property to 65% LTV, via a new first or a supplemental mortgage. New financing is sized based on current property economic performance. Securing construction financing sized at 65% of the projected construction costs. Securing long-term financing sized at 65% of stabilized value after construction. Final stabilized funding is sized based on new, stabilized economic performance. Redevelopment - Funding Methodology |

| Capitalization - Liquidity Aimco 2006 Sources and Uses ($mm) |

| TOM HERZOG - CFO |
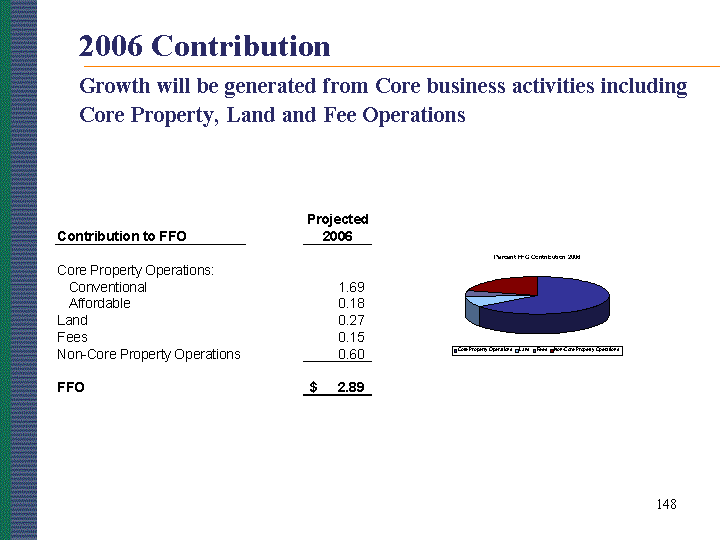
| 2006 Contribution Growth will be generated from Core business activities including Core Property, Land and Fee Operations |
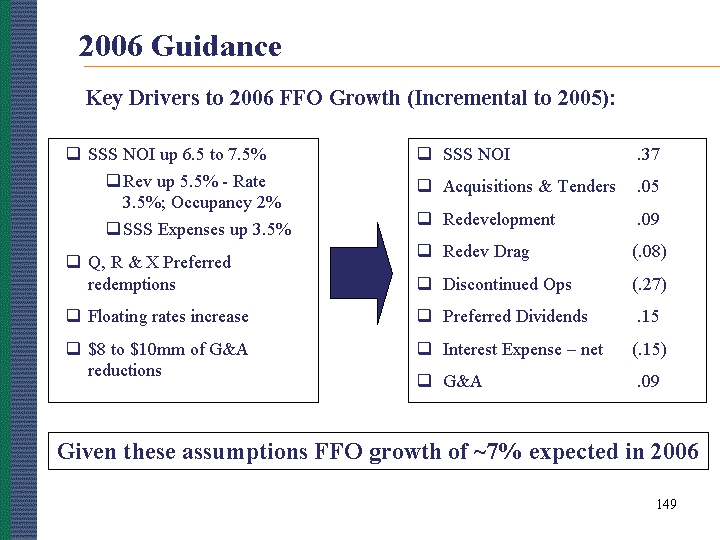
| 2006 Guidance Key Drivers to 2006 FFO Growth (Incremental to 2005): SSS NOI .37 Acquisitions & Tenders .05 Redevelopment .09 Redev Drag (.08) Discontinued Ops (.27) Preferred Dividends .15 Interest Expense - net (.15) G&A .09 SSS NOI up 6.5 to 7.5% Rev up 5.5% - Rate 3.5%; Occupancy 2% SSS Expenses up 3.5% Q, R & X Preferred redemptions Floating rates increase $8 to $10mm of G&A reductions Given these assumptions FFO growth of ~7% expected in 2006 |
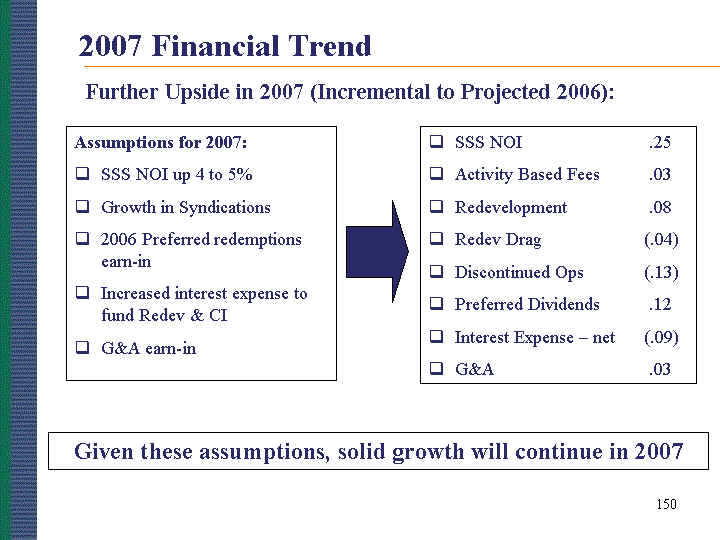
| 2007 Financial Trend Further Upside in 2007 (Incremental to Projected 2006): SSS NOI .25 Activity Based Fees .03 Redevelopment .08 Redev Drag (.04) Discontinued Ops (.13) Preferred Dividends .12 Interest Expense - net (.09) G&A .03 Assumptions for 2007: SSS NOI up 4 to 5% Growth in Syndications 2006 Preferred redemptions earn-in Increased interest expense to fund Redev & CI G&A earn-in Given these assumptions, solid growth will continue in 2007 |
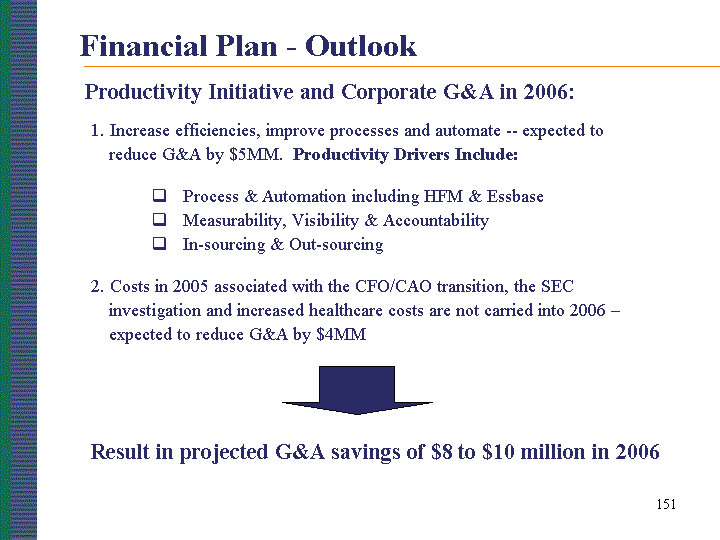
| Financial Plan - Outlook Process & Automation including HFM & Essbase Measurability, Visibility & Accountability In-sourcing & Out-sourcing Productivity Initiative and Corporate G&A in 2006: Result in projected G&A savings of $8 to $10 million in 2006 2. Costs in 2005 associated with the CFO/CAO transition, the SEC investigation and increased healthcare costs are not carried into 2006 - expected to reduce G&A by $4MM 1. Increase efficiencies, improve processes and automate -- expected to reduce G&A by $5MM. Productivity Drivers Include: |
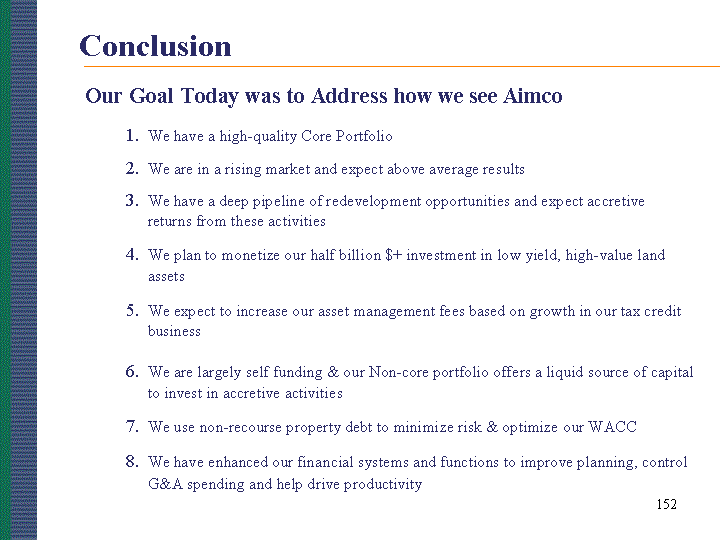
| Conclusion Our Goal Today was to Address how we see Aimco We have a high-quality Core Portfolio We are in a rising market and expect above average results We have a deep pipeline of redevelopment opportunities and expect accretive returns from these activities We plan to monetize our half billion $+ investment in low yield, high-value land assets We expect to increase our asset management fees based on growth in our tax credit business We are largely self funding & our Non-core portfolio offers a liquid source of capital to invest in accretive activities We use non-recourse property debt to minimize risk & optimize our WACC We have enhanced our financial systems and functions to improve planning, control G&A spending and help drive productivity |
| Q&A and CLOSING COMMENTS |