Exhibit 99.1
FORWARD LOOKING STATEMENTS
Aimco has prepared this presentation in an effort to provide investors with additional information about Aimco and its 2003 Outlook. Included in this presentation are expected results for 2002 and projected financial information for 2003 as well as the forward-looking business strategies that support Aimco’s financial projections. This information is forward-looking under the Federal securities laws. Actual results may differ materially from those presented. In order to develop its 2003 Outlook, Aimco has made assumptions relating to many factors including, but not limited to, occupancy, rent revenue, estimates of ongoing costs and capital expenditures as set forth in the “2003 Outlook” released on December 19, 2002. Although Aimco management believes the assumptions underlying its forward-looking statements are reasonable, such information is necessarily subject to uncertainties and involves certain risks, many of which are difficult to predict and are beyond management’s control. As such, these statements and information are not guarantees of future performance, and actual results may differ materially from what is expressed or forecast in this presentation. Actual results could be affected by a variety of factors including: changes in economic conditions, including changes in employment rates and interest rates; government regulations; litigation; competition from other providers of multi-family housing; possible environmental liabilities; insurance losses; failure to meet estimates for property sales; timely completion of development projects; completing the expected transactional activity; and other risks as described in Aimco’s filings with the Securities and Exchange Commission. These forward-looking statements reflect management’s judgment as of this date, and Aimco assumes no obligation to revise or update them to reflect future events or circumstances.
2
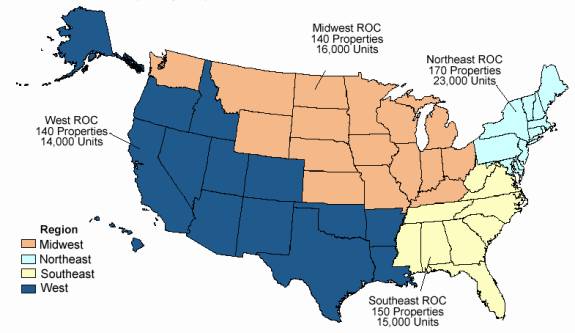
| ||
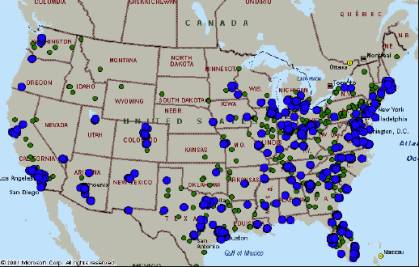
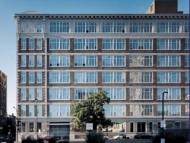
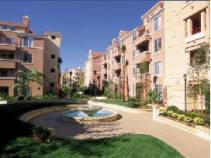
327,000 units at 1,800 |
| Largest multi-family |
| 47 states with a range of |
|

3
Terry Considine
Chief Executive Officer
4
Wholly focused on acquisition, |
|
|
| |||
ownership, operation and redevelopment |
|
|
| |||
|
|
|
| |||
|
| |||||
1,800 Properties Include: | ||||||
|
|
| ||||
|
| 740 conventional | ||||
|
| 500 affordable | ||||
|
|
| ||||
|
| 560 NAPICO and 3rd party managed (not shown) | ||||
|
|
|
| |||
• Operate through two major business components: conventional and affordable
• $15 billion total capitalization includes long-term property debt, modest short-term debt, partnership and JV equity, preferred and common stock
5
Well Diversified Portfolio Offers |
| ||
Stability & Upside |
| ||
|
| ||
Aimco: |
| ||
| |||
• | Is nationwide | ||
|
| ||
• | Owns a broad range of assets | ||
| — | A to C conventional properties with a focus on Bs | |
| — | plus affordable and student housing | |
|
| ||
• | Serves approximately one million people each year | ||
| |||
• | Operates with the benefit of national efficiencies and the focused attention of regional management | ||
6
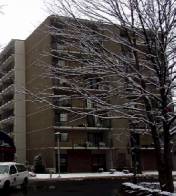
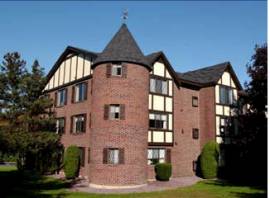
Conventional Business — |
| |||
|
|
| ||
440 properties |
| |||
130,000 units | ||||
|
| |||
|
| property concentrations | ||
|
| ROC locations and focus markets | ||
|
| Other focus markets | ||
|
|
| ||
|
|
| ||

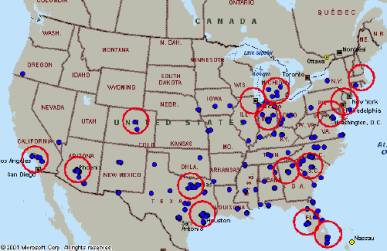
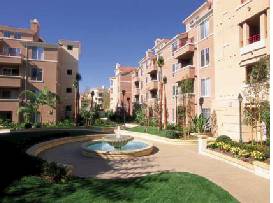
• Focused in 27 markets
• Average rent $815
• Gross asset value $9.2 billion (Aimco share $7.5 billion)
• NAV estimated at $3.5 billion or $30.50 per share
• Largest five markets, generating 32% of real estate FCF, are now Washington, D.C., greater Los Angeles, greater Boston, Chicago and southeast Florida
7
Conventional Business — |
|
Long-term Portfolio |
|
|
|
• Our aim is to hold these properties for the long-term and to invest in their upgrade through generous capital replacement (CR), capital enhancement (CE) and redevelopment. |
|
| |
• These properties are presently funded with: | |
— Long-term property debt (52%) | |
— Partnership equity (10%) | |
— Aimco preferred and common equity (38%) | |
| |
• Improvements will be funded with retained earnings and proceeds from the sale of the Intermediate term portfolio |
|

8
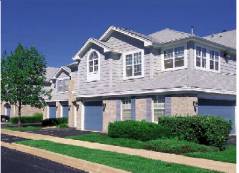
Conventional Business — |
| ||
Intermediate Term Hold Portfolio |
| ||
|
|
| |
|
|
| |
|
| ||
|
| ||
|
| ||
|
| ||
300 properties | |||
75,000 units | |||
|
| ||
| Intermediate hold properties | ||
| ROC locations | ||
|
| ||
|
| ||
|
|
| |
• Average rent $540
• Gross asset value $2.1 billion (Aimco share $1.7 billion)
• NAV estimated at $700 million or $6.00 per share
• 32% are presently available for sale
• 2002 gross sales of $472 million slightly exceeded estimated NAV
9
• Our aim is to sell these properties over the next four years redeploying the proceeds to fund:
— Repayment of short-term debt
— Improvements to long-term portfolio properties
— Opportunistic investments including LP acquisitions and share repurchases
• These properties are funded with:
— Long-term property debt (59%)
— Partnership equity (11%)
— Aimco preferred and common equity (30%)
10
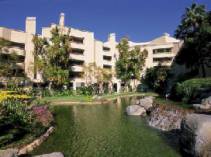
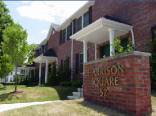
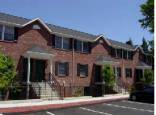
Affordable Business — |
| |
Real Estate Portfolio |
| |
500 properties |
|
|
|
|
|

• Average rent $650
• Gross asset value $2.1 billion (Aimco share $850 million)
• Current NAV estimated at $310 million or $2.70 per share
• 2002 sales of $77 million slightly exceeded estimated NAV
• 10 to 15 properties to be redeveloped in 2003
• 15% are presently available for sale
11
Affordable Business —
Real Estate Portfolio
Our aim is to
• Redevelop 20%, or approximately 100, of these properties with the cost of redevelopment funded by
— Long-term, generally tax exempt, property debt
— Sale of tax credits
• Hold the balance of these properties for their predictable cash flow or sell and redeploy the proceeds to
— Repayment of short-term debt
— Improvements to the long-term portfolio
— Opportunistic investments such as LP acquisitions and share repurchases
• These properties are funded with:
— Long-term property debt (59%)
— Partnership equity (26%)
— Aimco preferred and common equity (15%)
12
| |
| Real Estate Growth Strategy We will grow our AFFO and NAV through: • Enhancement of long-term portfolio assets • Redevelopment of conventional and affordable properties • Reinvestment of retained earnings and property sale proceeds • Superior property management |
| |


13
Growth Realization in the | |
Long-term Portfolio | |
| |
Operating results are expected to improve as: • The national economy improves • Rents increase faster in Aimco’s long-term markets than in the market as a whole |
|
| |
Operating results are also expected to improve as a result of a substantial redevelopment program. For example, at Riverloft $5 million of value was created: • FMV prior to redevelopment $14 million • FMV after redevelopment $40 million • Cost of redevelopment $21 million • Funded by long-term property debt without increase in leverage | |
| |
| |

14
Growth Realization in the |
|
|
|
Operating results expected to improve as: • Government agreements renegotiated • Properties are re-capitalized For example, in one instance: • Negotiated increase in voucher rent levels from $350 to $700 per unit and refinanced Section 236 mortgage • FMV before rent increase $10.3 million • FMV after rent increase $20.3 million with no additional Aimco investment • Received $6.4 million cash proceeds (including distribution of $1.6 million of restricted cash) • Plan to increase FCF by up to an additional $500,000 by adding independent senior living service income
|
|
15
Growth Realization — | |
2002 Results | |
|
|
• Acquired Casden and New England properties for $1.6 billion • Increased presence in strong markets — greater Los Angeles and greater Boston — now among Aimco’s top five markets • Increased portfolio quality as average monthly rent for acquired properties is $1,300 versus $545 for properties sold in 2002 |
|
| |

16
Superior property management • 2002 “Same Store” net operating income for first nine months compared with 2001 — Aimco (0.6)% — Peer average (5.0)% • For example, risk management activities yielded substantial savings — Changes in claims management led to 45% (or $8.5 million) decline in property loss costs — Risk management converted from local outside contractors to internal functions including claims, loss prevention, etc. — Year to year costs were flat
|
|

17
Real Estate Operations —
2003 Objectives
• Continue exclusive focus on multi-family ownership
• Maintain broad geographic diversification
• Focus conventional ownership in fewer markets with better prospects and significant operating scale ($500 million plus)
• Increase contribution from redevelopment
• Increasingly fund middle market opportunities with tax exempt debt and tax credit equity
18
Ron Monson
Property Operations
19
| |
|
• Completion of FOCUS and other key automation efforts of onsite operations • Integration of Casden and New England properties, including completion of ICE and purchase of Park La Brea • Maintain and improve physical condition of the assets • Focus on resident selection • Focus on employee recruitment, training and retention • Focus on largest free cash flow properties
|

20
Conventional Operations — 2003
Build on strong relative performance in 2002
Complete FOCUS and key automation efforts to improve onsite operations
1. FOCUS
• New property operation system based on Siebel customer relationship management system
• Enforces business rules and uniformity nationwide through business rules engine
• Initial functionality will be implemented at all conventional properties by first quarter of 2003
• Automates lease production process
• Reduces on-site accounting time
• Improves customer service of community teams
21
2. Automation of Supply Chain Management
• Purchase order/fulfillment cycle that is integrated with FOCUS
• Provide better control and visibility of purchasing decisions before commitments are made
• Aggregate spending decisions to create volume discounts
• Completion in second quarter 2003
22
3. Continued Horizon Upgrades
• Data warehouse of property performance information
• Advises property management at all levels on actions that will lead to enhanced performance
• Provides to-do list and a visual dashboard based on prior day activities and results
• Leads to faster action at Community and ROC when opportunities exist
• Upgraded version due second quarter 2003
23
Integration of Casden and New England Properties Acquisitions
• Casden portfolio is fully integrated into Southern California ROC — Physical occupancy has improved to 96% — On track to achieve NOI per underwriting — First phase of Park La Brea, 250 units, closed in the fourth quarter at a purchase price of $55 million
|
|
24
• New England portfolio of 11 suburban Boston properties — Boston ROC fully staffed to ensure local management focus — ICE including kitchen and bath improvements underway — Occupancy is currently less than underwriting, consistent with soft Boston market — NOI 1% to 2% below underwriting, expect to meet pro forma by year end 2003 • Casden and New England will provide an incremental contribution of $5 million to $6 million NOI over the 2002 run-rate
|
|
25
Continued focus on physical condition of the assets • Formalize property inspections including apartment interiors for zero defects • Higher priority in common areas and exteriors, including painting and landscape • $500 -$525 per unit spending for CR & CE
|
|
26
Conventional Operations — 2003
Improve the quality and quantity of our residents
Marketing:
• Created a resident acquisition and retention department and selected Jeff Adler to lead this effort
• Creating a national infrastructure to take advantage of scale in buying media
• Pricing decisions are made by revenue managers located in the regions
• Redirected ROC resources to front line sales management and training activities
27
Resident Quality:
• Increasing the qualification standard for residency
• Your neighbor is part of the product

28
Improve quality of on-site employees
Recruiting
• The economic environment for finding qualified employees has improved
• 10 resumes per posted position on Aimco.com website
Training
• Rolling out new employee training programs for leasing and maintenance
• Over 60% of new employee training takes place on-line
Retention
• Reduced employee turnover correlates with lower resident move-outs
29
Continued management focus on top cash flow contributing properties
Properties as Ranked |
| % of FCF |
| Average FCF |
|
|
|
|
|
|
|
Top 25 |
| 23 | % | $6.6 million |
|
26 - 100 |
| 26 | % | $2.4 million |
|
101 - 300 |
| 28 | % | $1.0 million |
|
Lower 400 |
| 23 | % | $0.4 million |
|
30
Management decision making close to the properties
• 20 of the largest 25 properties report directly to RVP
• 81 of the top 100 are within one hour drive of ROC offices
• 15 ROCs all fully staffed with expertise to implement 2003 priorities, including:
— 45 sales and marketing managers
— 21 technical services managers
— 7 construction managers
— 26 human resources managers
— 21 information/systems services managers
31
2003 Same Store outlook
Same Store Sales
• Revenue
— Flat to negative 2% compared to 2002
— Occupancy expected to average 91% to 92% for the year
— Incorporates seasonal fluctuations in occupancy
• Expenses
— Up 2% to 3% compared with 2002
• NOI
— Down 1% to 4% compared to 2002
32
David Robertson
Aimco Capital
33
Aimco Capital |
|
|
|
Overview Aimco Capital was formed in 2002 to integrate Aimco’s Affordable property operations, asset management and transaction activities • Affordable Property Operations — Manages tax credit and HUD subsidized properties • Affordable Asset Management — Provides asset management services to NAPICO and SPI portfolio properties • Affordable Transactions — Twenty professionals focused on maximizing value in both portfolios through redevelopments, “subsidized rent increases,” refinancings and dispositions |
|
34
Affordable Property Operations
• Manages 500 owned properties (57,000 units) with an average ownership interest of 36%, and 100 third party properties (11,000 units)
• Stable portfolio with predictable cash flow
— Approximately $70 million of FCF in 2003
— Average occupancy of approximately 97%
— Average rents of approximately $650 per unit
• Portfolio generates above average returns with reduced risk
— Largely unaffected by the economy
— Subsidized rents and capital structures
— Annual subsidized increases in revenues to offset increased operating expenses
— Operational stability allows for a cost efficient “4-ROC” support structure, costing $120 per door annually
35
Affordable Property Operations
36
Affordable Asset Management
• Provides asset management services primarily to tax credit financed properties
— 435 NAPICO properties totaling 40,000 units
— 170 SPI properties totaling 20,000 units
• Has compliance oversight responsibility for owned Affordable portfolio
• Earns approximately $2.5 million of annual fee income currently, substantially covering operating expenses
• Additional $8 million of annual fee income is deferred and earned upon a transaction (deferred fee balance of approximately $20 million as of 2002 year-end)
• Will earn incremental asset management fee income from future redevelopments financed with tax credit equity
37
Affordable Transactions
• Team of twenty professionals who are well versed in all aspects of HUD and tax credit programs
— Dedicated resources assigned to each ROC
— Work closely with property operations personnel to determine and execute the highest value added strategy for each property in their region
— Leverage housing agency relationships maintained by property operations personnel
• In addition to reviewing the Aimco-owned properties, the transaction team analyzes opportunities to create value in the asset managed portfolio in return for fee income
38
Strategy and Objectives
• Primary objective is to provide a predictable and increasing FCF and NAV through ownership and expertise in affordable properties
— Negotiate subsidized rent increases to market and/or redevelop approximately 20 to 25 properties per year
— Redevelopments will be financed primarily with tax exempt debt and tax credit equity
— Balance of the owned portfolio will be held for its predictable cash flow, or sold to other affordable housing operators at or above NAV
• With more than 100,000 affordable units, plus future acquisitions, this is a long-term growth business for Aimco with high expected returns on Aimco equity
39
Typical Affordable Transactions
• There are two primary transactions employed to maximize the value of well located Affordable properties
— Negotiated Increase in Subsidized Rents to Market Rates — Subsidy program is maintained, but rents are marked up to market rates. Often done in connection with a refinancing and cash distribution
— Tax Credit Redevelopment — Attractive source of equity capital, often paired with tax exempt debt. In addition to increased property FCF, presents opportunity to earn developer, placement and asset management fees
• Also earn fee income for refinancings and dispositions
40
Case Study — Negotiated Rent • 101 unit senior living property • Section 8 rents increased from $919 to $1,175 per unit • Redevelopment budget of approximately $1 million • Raised $2.2 million of tax credit equity, covering all costs including a $950,000 developer fee • Expect to increase FCF by $110,000 per annum and NAV by $1.1 million
|
|

41
Affordable Transactions
• | In 2002, we completed more than 90 transactions |
| |
| — | More than $50 million of net proceeds to Aimco | |
| — | Approximately $15 million of fee income, including $6 million in the fourth quarter | |
| — | Increased annualized FCF by $1.5 million | |
• | In 2003, we expect to complete more than 125 transactions | ||
| — | $75 to $100 million of net proceeds to Aimco | |
| — | $17 to $20 million of fee income | |
| — | Increase annualized FCF by $2 to $3 million | |

42
Paul McAuliffe
Chief Financial Officer
43
Financial Reporting
Completed:
• Breakout of Operating FFO and Transaction FFO components
• Quarterly NAV calculation
• Reconciliation of all reporting formats to GAAP income statement
• Depreciable lives based on individual property study
• Pro rata consolidated balance sheet
— 95% of assets and liabilities consolidated
44
• Free cash flow from business segments
— 91% of FCF consolidated
• Outlook detail
• AFFO and NAV focused
2003 Financial Reporting Objectives:
• Breakout of all capital spending in Schedule III of 2002 10-K
• More detail on real estate components in first quarter 2003 earnings release reconciled to GAAP income statement
45
Earnings Outlook — Summary
Macro-economic outlook |
|
|
|
| |
• Economic recovery underway |
| |
|
| |
• Apartment demand tied to job growth |
| |
— Job creation lags recovery, expected second half 2003 |
| |
|
| |
• Assumes no material adverse change due to: |
| |
— War with Iraq |
| |
— Acts of terrorism |
| |
|
| |
• Interest rates expected to rise in second half 2003 |
| |
— Positively impacts supply and demand |
|

46
Guidance general assumptions: |
|
|
|
| |
Operations |
| |
• “Same Store” occupancy and rent flat with fourth quarter in “low” case to some seasonal benefits in occupancy in “high” case |
| |
• 2002 acquisitions add $5 to $6 million incremental NOI |
| |
• Property management contributes $22 to $27 million incremental to NOI |
| |
|
| |
Transactions |
| |
• Mark to market loan reviews completed by year-end 2002 contributing net $7 to $9 million for 2003 |
| |
• Activity based fees are expected to increase to $20 to $25 million due to Aimco Capital activity |
|
47
Earnings Outlook —
Summary Per Share
2003 OUTLOOK SUMMARY (per share)
|
| 2003 Outlook |
| 2002 Outlook |
| 2003 v. 2002 |
| ||||||||||||||||||
Operating FFO |
| $ | 3.96 |
| to |
| $ | 4.12 |
| $ | 4.22 |
| to |
| $ | 4.24 |
| $ | (0.26 | ) | to |
| $ | (0.12 | ) |
Transaction FFO |
| 0.24 |
| to |
| 0.30 |
| 0.41 |
| to |
| 0.45 |
| (0.17 | ) | to |
| (0.15 | ) | ||||||
Total FFO |
| $ | 4.20 |
| to |
| $ | 4.42 |
| $ | 4.63 |
| to |
| $ | 4.69 |
| $ | (0.43 | ) | to |
| $ | (0.27 | ) |
|
|
|
|
|
|
|
|
|
|
|
|
|
|
|
|
|
|
|
| ||||||
Capital replacements(1) |
| (0.78 | ) | to |
| (0.76 | ) | (0.76 | ) | to |
| (0.76 | ) | (0.02 | ) | to |
| — |
| ||||||
AFFO before capital enhancements |
| $ | 3.42 |
| to |
| $ | 3.66 |
| $ | 3.87 |
| to |
| $ | 3.93 |
| $ | (0.45 | ) | to |
| $ | (0.27 | ) |
Capital enhancements (CE) |
| (0.06 | ) | to |
| (0.04 | ) | (0.07 | ) | to |
| (0.07 | ) | 0.01 |
| to |
| 0.03 |
| ||||||
AFFO |
| $ | 3.36 |
| to |
| $ | 3.62 |
| $ | 3.80 |
| to |
| $ | 3.86 |
| $ | (0.44 | ) | to |
| $ | (0.24 | ) |
|
|
|
|
|
|
|
|
|
|
|
|
|
|
|
|
|
|
|
| ||||||
Dividend(2) |
| $ | 3.28 |
|
|
| $ | 3.28 |
| $ | 3.28 |
|
|
| $ | 3.28 |
|
|
|
|
|
|
| ||
Dividend payout ratio (before CE) |
| 96 | % | to |
| 90 | % | 85 | % | to |
| 83 | % |
|
|
|
|
|
| ||||||
|
|
|
|
|
|
|
|
|
|
|
|
|
|
|
|
|
|
|
| ||||||
Share count (mm): |
|
|
|
|
|
|
|
|
|
|
|
|
|
|
|
|
|
|
| ||||||
FFO |
| 112 |
|
|
|
|
| 113 |
|
|
|
|
|
|
|
|
|
|
| ||||||
AFFO(1) |
| 108 |
|
|
|
|
| 108 |
|
|
|
|
|
|
|
|
|
|
| ||||||
(1) Due to anti-dilutive adjustments, the share count used for AFFO is lower than for FFO.
(2) Dividends are determined and declared by the Board of Directors on a quarterly basis. For purposes of this 2003 Outlook Summary, no change in the common share dividend is assumed.
48
Earnings Outlook —
Simplified Model — Free Cash Flow
($mm except per share)
|
| Low |
| High |
| ||
Operations |
|
|
|
|
| ||
Real Estate Operations |
| $ | 765 |
| $ | 782 |
|
Investment Management |
| $ | 22 |
| $ | 27 |
|
Interest Income |
| $ | 25 |
| $ | 27 |
|
G&A Expense |
| $ | (18 | ) | $ | (20 | ) |
Free Cash Flow |
| $ | 794 |
| $ | 816 |
|
Interest Expense |
| $ | (365 | ) | $ | (365 | ) |
Preferred Dividends |
| $ | (74 | ) | $ | (74 | ) |
Addback CR & CE |
| $ | 90 |
| $ | 86 |
|
Operating FFO |
| $ | 445 |
| $ | 463 |
|
Operating FFO per Share |
| $ | 3.96 |
| $ | 4.12 |
|
Transactions |
|
|
|
|
| ||
Activity Based Fees |
| $ | 20 |
| $ | 25 |
|
Net Transactional Income |
| $ | 7 |
| $ | 9 |
|
Transaction FFO |
| $ | 27 |
| $ | 34 |
|
Transaction FFO per Share |
| $ | 0.24 |
| $ | 0.30 |
|
|
|
|
|
|
| ||
FFO |
| $ | 472 |
| $ | 497 |
|
FFO / Share |
| $ | 4.20 |
| $ | 4.42 |
|
|
|
|
|
|
| ||
CR & CE |
| $ | (90 | ) | $ | (86 | ) |
Dividend adjustment for Anti-dilution Calculation |
| $ | (19 | ) | $ | (19 | ) |
AFFO |
| $ | 363 |
| $ | 392 |
|
AFFO per Share |
| $ | 3.36 |
| $ | 3.62 |
|
|
|
|
|
|
| ||
Diluted FFO Shares |
| 112.5 |
| 112.5 |
| ||
Diluted AFFO Shares |
| 108 |
| 108 |
| ||
49
Earnings Outlook —
Common Dividend
2002 AFFO Payout — 83% to 85% |
|
|
2003 AFFO Payout — 90% to 96% |
| |
|
| |
While the Aimco AFFO payout ratio has increased, Aimco’s earnings base benefits from: |
| |
|
| |
• Broad property diversification |
| |
— Geographic |
| |
— Price point |
| |
• Long duration, largely fixed rate mortgage debt |
| |
• Opportunities to redeem perpetual preferred securities with lower cost mortgage debt |
| |
• Greater visibility of Operating and Transaction earnings |
| |
• AFFO payout calculated using Capital Replacements of $475 to $485 per unit in 2003 |
|
|

50
Capital Plan & Liquidity
• Sale of intermediate term hold and select affordable properties
• Repayment of short-term debt in first half 2003 based on property sales
• Investment in redevelopment
• Investment in acquisitions, including LP transactions
• Possible refunding of preferreds
• Refinance property debt
51
Sources and Uses
Sources |
|
|
| |
Operations: |
|
|
| |
FFO @ $4.31 - mid point |
| $ | 483 |
|
Capital Replacements @ $480 - mid point |
| (83 | ) | |
Common and Convertible Preferred Dividends |
| (382 | ) | |
Cash Cushion |
| 18 |
| |
|
|
|
| |
Sales proceeds (Aimco share of net cash) |
| 300 |
| |
Refinancing proceeds (Aimco share of net cash) |
| 125 |
| |
Net Sources |
| $ | 443 |
|
|
|
|
| |
Uses |
|
|
| |
Principal amortization |
| (100 | ) | |
Term debt paydown (subject to sales and refis) |
| (115 | ) | |
Investments: |
|
|
| |
Redevelopment, ICE and CE |
| (100 | ) | |
Tenders (net cash) |
| (30 | ) | |
Acquisitions (net cash) |
| (70 | ) | |
|
|
|
| |
Net Uses |
| $ | 415 |
|
|
|
|
| |
Net Sources and Uses |
| $ | 28 |
|
52
Capital Plan & Liquidity —
Balance Sheet
2003 Balance Sheet Changes
(In millions) |
|
|
|
|
|
|
|
|
| ||
|
| Actual |
| % |
| Projected |
| % |
| ||
|
|
|
|
|
|
|
|
|
| ||
Mortgage debt |
| $ | 5,521 |
| 49 | % | $ | 5,118 |
| 48 | % |
|
|
|
|
|
|
|
|
|
| ||
Short term debt |
| 420 |
| 4 | % | 298 |
| 3 | % | ||
|
|
|
|
|
|
|
|
|
| ||
Perpetual Preferred stock |
| 553 |
| 5 | % | 553 |
| 5 | % | ||
|
|
|
|
|
|
|
|
|
| ||
Convertible Preferred stock |
| 531 |
| 5 | % | 531 |
| 5 | % | ||
|
|
|
|
|
|
|
|
|
| ||
Common equity(1) |
| 4,104 |
| 37 | % | 4,123 |
| 39 | % | ||
Total Capitalization |
| $ | 11,129 |
| 100 | % | $ | 10,622 |
| 100 | % |
|
|
|
|
|
|
|
|
|
| ||
% Debt and Preferred Leverage to Total Capitalization |
| 63.1 | % |
|
| 61.3 | % |
|
| ||
|
|
|
|
|
|
|
|
|
| ||
FCF to Interest |
| 2.37 |
|
|
| 2.40 |
|
|
| ||
|
|
|
|
|
|
|
|
|
| ||
FCF to Interest and Preferred Dividends |
| 1.82 |
|
|
| 1.85 |
|
|
| ||
(1) Share price used: Actual $38.85 third quarter 2002; Projected $39.01 based on price 1/6/03
53
Valuation — Long-term Growth
Components of Annual AFFO Per Share Growth |
| 2004 - 2008 |
|
(Based on midpoint of $3.49 per share in 2003 AFFO) |
| (%) |
|
|
|
|
|
OPERATING |
|
|
|
|
|
|
|
Economy |
|
|
|
• Real |
| 0 |
|
• CPI |
| 2.0 to 3.0 |
|
|
|
|
|
Superior Market Locations |
| 0.5 |
|
• Reflected in SSS Growth |
|
|
|
|
|
|
|
More Efficient Operations |
| 0.5 |
|
• Reflected in SSS Growth |
|
|
|
|
|
|
|
Impact of Leverage |
| 2.0 to 2.5 |
|
|
|
|
|
Retained Earnings |
| 0 to 1.0 |
|
|
|
|
|
TRANSACTIONS |
|
|
|
|
|
|
|
Aimco Capital |
| 0.5 to 1.0 |
|
• Funding with Tax Credit Equity and Tax Exempt Debt |
|
|
|
• Asset Management and Transaction Fees |
|
|
|
54
Components of Annual AFFO Per Share Growth |
| 2004 - 2008 |
| |
(Based on midpoint of $3.49 per share in 2003 AFFO) |
| (%) |
| |
|
|
|
| |
INVESTMENTS |
|
|
| |
|
|
|
| |
Opportunity to Redevelop Existing Assets |
| 0.5 |
| |
• 130,000+ Long-term Hold Units |
|
|
| |
• Older Properties/Stronger Locations |
|
|
| |
• $150 Million Per Year |
|
|
| |
• 10.5% Return on Capital/9% Cost of Capital |
|
|
| |
|
|
|
| |
Opportunistic Acquisitions |
|
|
| |
• NHP, Insignia, Oxford, Casden, New England |
| ? |
| |
• Limited Partner Acquisitions — $250 Million Equity |
| 0.3 |
| |
|
|
|
| |
BALANCE SHEET |
|
|
| |
|
|
|
| |
Deleveraging Activity |
|
|
| |
• Cost of Reduction of Short Term Debt |
| (0.3) to (0.6) |
| |
|
|
|
| |
Total per share Annual AFFO Growth |
| 6.0% to 8.7% |
| |
|
|
|
| |
| 2003 |
| 2008 |
|
|
|
|
|
|
AFFO — Mid-point of 2003 Outlook | $3.49 |
|
|
|
AFFO — Range of 2008 AFFO |
|
| $4.67 to $5.30 |
|
|
|
|
|
|
NAV — Mid-point of 3Q 2002 NAV(1) | $42 |
|
|
|
NAV — Range of 2008 NAV |
|
| $56 to $64 |
|
(1) NAV of $42.20 per share comprised of $30.50 per share for conventional long-term hold portfolio, $6.00 per share for conventional intermediate term hold portfolio, $2.70 per share for the affordable real estate portfolio and $3.00 per share for the investment management business and other net assets.
55
Valuation — Comparative Data
Aimco Compares Favorably
|
| Peer Average(1) |
| AIV(1) |
|
Better track record |
|
|
|
|
|
Annual return since IPO |
| 13.1 | % | 16.1 | % |
|
|
|
|
|
|
Projected superior growth |
|
|
|
|
|
FFO per share CAGR 2002-2006 |
| 2.4 | % | 4.2 | % |
|
|
|
|
|
|
Higher dividend yield |
| 7.3 | % | 9.0 | % |
|
|
|
|
|
|
However, more leveraged |
| 51.0 | % | 65.8 | % |
(1) Peers are comprised of EQR, ASN, AVB and UDR
Data sources: Merrill Lynch fourth quarter 2002 and Morgan Stanley fourth quarter 2002
56
Valuation — Comparative Data
Favorable Comparison not
Reflected in Share Price
|
| Peer Average(1) |
| AIV(1) |
|
2002 estimated FFO multiple |
| 10.4 |
| 7.9 |
|
2003 estimated FFO multiple |
| 11.0 |
| 8.4 |
|
|
|
|
|
|
|
2002 estimated AFFO multiple |
| 11.4 |
| 8.9 |
|
Forward 12 month AFFO multiple |
| 12.5 |
| 10.0 |
|
|
|
|
|
|
|
EBITDA multiple LTM |
| 12.3 |
| 11.6 |
|
|
|
|
|
|
|
Cash NOI cap rate |
| 8.2 | % | 9.2 | % |
Current discount to NAV |
| -2.4 | % | -6.1 | % |
(1) Peers are comprised of EQR, ASN, AVB and UDR
Data sources: Merrill Lynch fourth quarter 2002 and Morgan Stanley fourth quarter 2002
57