Exhibit 99.1
Link to searchable text of slide shown above

Link to searchable text of slide shown above
Link to searchable text of slide shown above

Link to searchable text of slide shown above
Link to searchable text of slide shown above

Link to searchable text of slide shown above
Link to searchable text of slide shown above
Link to searchable text of slide shown above
Link to searchable text of slide shown above
Link to searchable text of slide shown above
Link to searchable text of slide shown above
Link to searchable text of slide shown above
Link to searchable text of slide shown above

Link to searchable text of slide shown above

Link to searchable text of slide shown above
Link to searchable text of slide shown above
Link to searchable text of slide shown above
Link to searchable text of slide shown above
Link to searchable text of slide shown above
Link to searchable text of slide shown above
Link to searchable text of slide shown above
Searchable text section of graphics shown above
[LOGO]
ORGANIZATIONAL IMPROVEMENTS | | PORTFOLIO ACTIVITIES |
| | |
| [GRAPHIC] | |
| | |
| AIMCO | |
| Apartment Investment and Management Company | |
| | |
| March 2004 | |
| | |
OPERATING STRATEGIES | | |
Discussion Subjects
1. Organizational Improvements
2. Operating Strategies
3. Portfolio Activities
4. 4Q 2003 Summary
5. 2004 Guidance
6. 2004 Sources and Uses
2
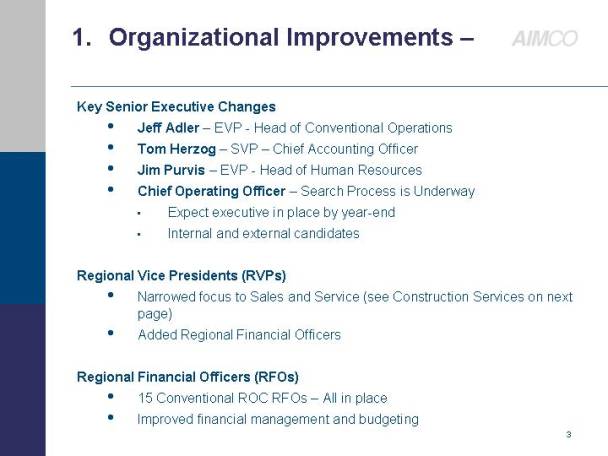
1 Organizational Improvements –
Key Senior Executive Changes
• Jeff Adler – EVP - Head of Conventional Operations
• Tom Herzog – SVP – Chief Accounting Officer
• Jim Purvis – EVP - Head of Human Resources
• Chief Operating Officer – Search Process is Underway
• Expect executive in place by year-end
• Internal and external candidates
Regional Vice Presidents (RVPs)
• Narrowed focus to Sales and Service (see Construction Services on next page)
• Added Regional Financial Officers
Regional Financial Officers (RFOs)
• 15 Conventional ROC RFOs – All in place
• Improved financial management and budgeting
3
Construction Services
• Responsible for oversight of more complicated design and construction activities within Capital Replacement spending
• Oversees the construction of redevelopment properties
• Monitors compliance with “Aimco physical asset standards”
• Allows greater focus by RVP on operational responsibilities
• Headed by Gary Polodna who reports to David Robertson
Increased Performance Measurement at ROC Level
• 15 conventional RVPs have ultimate ROC P&L accountability
• 30 day review cycle for each ROC with corporate management team including EVP Ops and CEO
• Accelerates internal communication and decision making
• Scorecard built to be an integrated management tool providing key operations metrics – 11 key controllable metrics that drive Free Cash Flow
Improved Property Level Information System
• FOCUS, a Siebel-based CRM system, is fully operational and supports the scorecard metrics – new leasing pipeline, pricing by floorplan, renewal touchpoints, some quality metrics
4
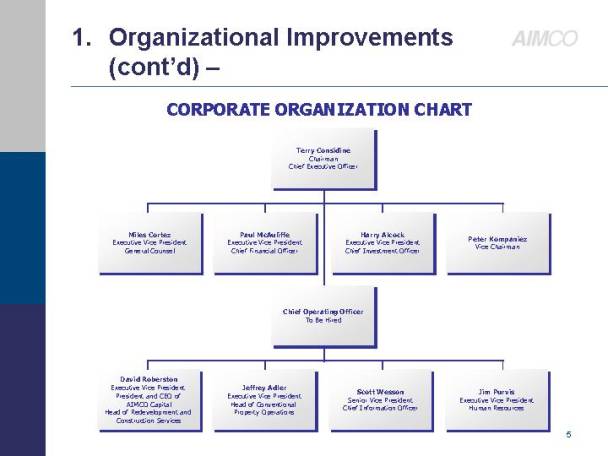
CORPORATE ORGANIZATION CHART
| | | Terry Considine | | | | |
| | | Chairman | | | | |
| | | Chief Executive Officer | | | | |
| | | | | | | |
| | | | | | | |
Miles Cortez | | Paul McAuliffe | | Harry Alcock | | Peter Kompaniez | |
Executive Vice President | | Executive Vice President | | Executive Vice President | | Vice Chairman | |
General Counsel | | Chief Financial Officer | | Chief Investment Officer | | | |
| | | | | | | |
| | | | | | | |
| | | Chief Operating Officer | | | | |
| | | To Be Hired | | | | |
| | | | | | | |
| | | | | | | |
David Roberston | | | | | | | |
Executive Vice President | | Jeffrey Adler | | Scott Wesson | | Jim Purvis | |
President and CEO of | | Executive Vice President | | Senior Vice President | | Executive Vice President | |
AIMCO Capital | | Head of Conventional | | Chief Information Officer | | Human Resources | |
Head of Redevelopment and | | Property Operations | | | | | |
Construction Services | | | | | | | |
| | | | | | | | | |
5
CONVENTIONAL PROPERTY OPERATIONS
| | | | Jeff Adler | | | | | |
| | | | Executive Vice President | | | | | |
| | | | Conventional Property Operations | | | | | |
| | | | | |
| | | | | | | | | |
| | California | | | | | | | |
Lou Lavaux | | Peter Kompaniez | | East | | West | | Midwest | |
Senior Vice President | | Acting Division | | David Zweig | | Ronald Monson | | TBD | |
Controller of Operations | | Vice President | | Division Vice President | | Division Vice President | | Division Vice President | |
| | | | | | | | | |
| | | | | | | | | |
Lee Montgomery | | | | | | | | | |
Vice President | | | | | | | | | |
Pricing and Analysis | | | | | | | | | |
| | | | | | | | | |
| | | | | | | | | |
| | | | Boston | | | | Chicago | |
Keith Dodds | | Los Angeles | | Philadelphia | | Denver | | Michigan | |
Vice President | | N. California | | Rockville | | Phoenix | | Ohio | |
Process and Infrastructure | | | | Atlanta | | Dallas | | Indiana | |
| | | | Columbia | | Houston | | Boca Raton | |
| | | | | | | | Tampa | |
| | | | | | | | | |
Leeann Morein | | | | | | | | | |
Senior Vice President | | | | | | | | | |
Procurement & | | | | | | | | | |
Income Development | | | | | | | | | |
| | | | | | | | | |
| | | | | | | | | |
Thorn Landers | | | | | | | | | |
Victoria Blanton | | | | | | | | | |
VPs, Sales & Marketing | | | | | | | | | |
| | | | | | | | | | | | | | | | |
6
2. Operating Strategies –
Pricing:
Challenge
• Relative effective rent levels versus main competitors declined since 1Q01
• While recovery began mid-2003, today Aimco is 2% or $15 /unit below competitive parity. Equals $30 million per year
Response
• Effective market rent on leases initiated in the fourth quarter rose $16 per unit, or 2.2%, from $721 to $737 and 2.5% on 5,816 renewals in January
• Implemented standard pricing process on new leases in February and with April renewals
• Pricing process focuses on effective market rents at the floor plan level, based on rate change in occupancy and projected demand
• Packaging of market rents versus concessions in the hands of regional managers
• Greatest opportunities to increase effective rents comprise 40% of Aimco conventional Free Cash Flow
| | | | % FCF | |
• | | Washington, D.C. area | | 12 | % |
• | | Southern California | | 12 | % |
• | | Philadelphia | | 5 | % |
• | | Florida | | 11 | % |
7
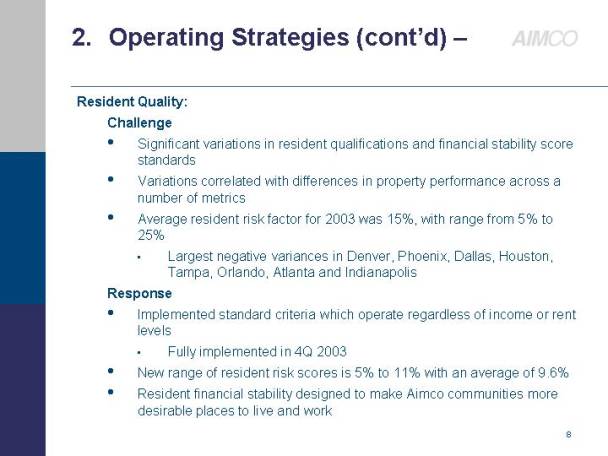
• Resident Quality:
Challenge
• Significant variations in resident qualifications and financial stability score standards
• Variations correlated with differences in property performance across a number of metrics
• Average resident risk factor for 2003 was 15%, with range from 5% to 25%
• Largest negative variances in Denver, Phoenix, Dallas, Houston, Tampa, Orlando, Atlanta and Indianapolis
Response
• Implemented standard criteria which operate regardless of income or rent levels
• Fully implemented in 4Q 2003
• New range of resident risk scores is 5% to 11% with an average of 9.6%
• Resident financial stability designed to make Aimco communities more desirable places to live and work
8
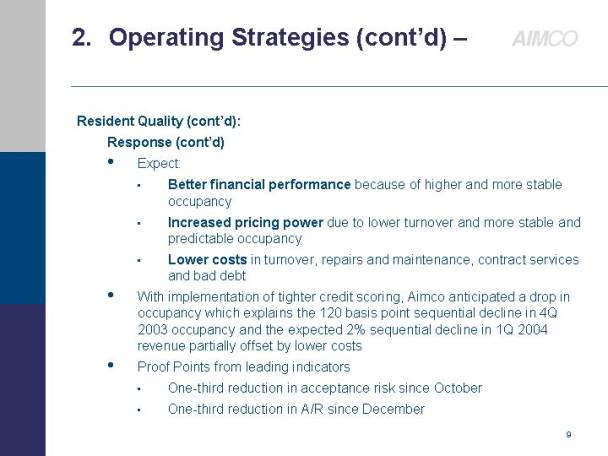
• Expect:
• Better financial performance because of higher and more stable occupancy
• Increased pricing power due to lower turnover and more stable and predictable occupancy
• Lower costs in turnover, repairs and maintenance, contract services and bad debt
• With implementation of tighter credit scoring, Aimco anticipated a drop in occupancy which explains the 120 basis point sequential decline in 4Q 2003 occupancy and the expected 2% sequential decline in 1Q 2004 revenue partially offset by lower costs
• Proof Points from leading indicators
• One-third reduction in acceptance risk since October
• One-third reduction in A/R since December
9
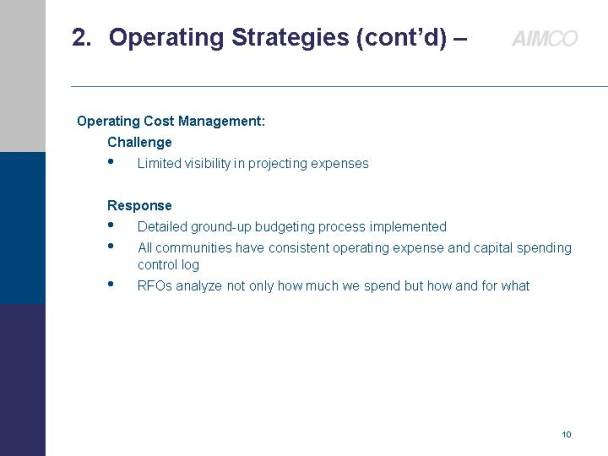
Operating Cost Management:
Challenge
• Limited visibility in projecting expenses
Response
• Detailed ground-up budgeting process implemented
• All communities have consistent operating expense and capital spending control log
• RFOs analyze not only how much we spend but how and for what
10
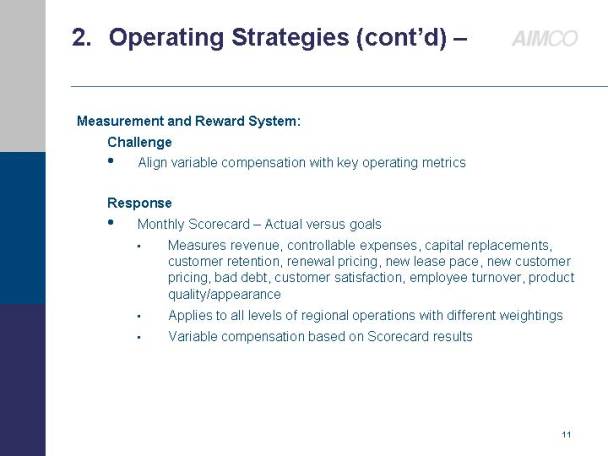
Measurement and Reward System:
Challenge
• Align variable compensation with key operating metrics
Response
• Monthly Scorecard – Actual versus goals
• Measures revenue, controllable expenses, capital replacements, customer retention, renewal pricing, new lease pace, new customer pricing, bad debt, customer satisfaction, employee turnover, product quality/appearance
• Applies to all levels of regional operations with different weightings
• Variable compensation based on Scorecard results
11
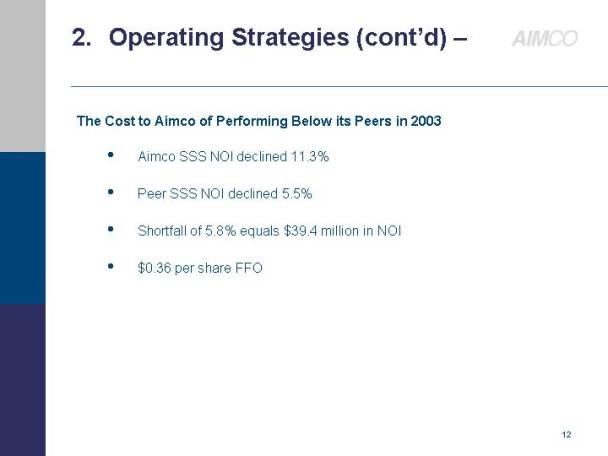
The Cost to Aimco of Performing Below its Peers in 2003
• Aimco SSS NOI declined 11.3%
• Peer SSS NOI declined 5.5%
• Shortfall of 5.8% equals $39.4 million in NOI
• $0.36 per share FFO
12
3. Portfolio Activities –
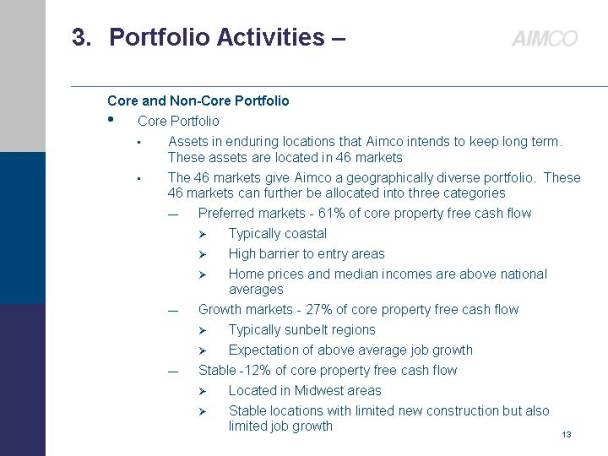
Core and Non-Core Portfolio
• Core Portfolio
• Assets in enduring locations that Aimco intends to keep long term. These assets are located in 46 markets
• The 46 markets give Aimco a geographically diverse portfolio. These 46 markets can further be allocated into three categories
• Preferred markets - 61% of core property free cash flow
• Typically coastal
• High barrier to entry areas
• Home prices and median incomes are above national averages
• Growth markets - 27% of core property free cash flow
• Typically sunbelt regions
• Expectation of above average job growth
• Stable -12% of core property free cash flow
• Located in Midwest areas
• Stable locations with limited new construction but also limited job growth
13
• Case Study - Aimco Core Portfolio vs a Geographically Concentrated portfolio in preferred markets
• Aimco’s portfolio is geographically diverse containing 46 markets
• The Concentrated portfolio is geographically concentrated in 8 markets
• Geographic diversity provides reasonably comparable growth, but also substantially less risk
• Weighted average annual rental growth(1) in Aimco’s core portfolio markets over the last 10 years - 4.24%
• Average annual rental growth(2) in Concentrated portfolio markets over the last 10 years - 4.74%
• REIS 5 year forecast rent growth in Aimco’s core portfolio markets - 2.60%
• REIS 5 year forecast rent growth in Concentrated portfolio markets - 2.57%
(1) Source: REIS data; Rent growth is average market growth by market as weighted based on Aimco’s core portfolio free cash flow
(2) Concentrated portfolio is weighted equally in 8 markets: Washington DC, Southern California, San Francisco Bay Area, Chicago, Boston, Southeast Florida, Seattle, New York.
14
• Non-Core Portfolio
• Assets in non enduring locations that Aimco will dispose of over the next several years
• Non-core markets - 36 remaining markets that Aimco will exit. Nine markets were exited in 2003
• Non-core properties in core markets - The non-core assets represent the least desirable locations within the core markets
• Reinvestment of sale proceeds
• The sale of non-core assets will fund the acquisition of core properties
• 22 non-core properties sold in Q4. Average rents of $580 per month
• These sales funded acquisition of Oakwood Miami, Palazzo at Park la Brea and a portfolio of Manhattan properties. Average rents of $2,380 per month in Aimco Preferred Markets
PORTFOLIO SUMMARY
ALL CONVENTIONAL PROPERTIES
| | CORE PROPERTIES | |
| | Total
Properties | | Total
Units | | Effective
Units | | % Conventional
Real Estate FCF | |
| | | | | | | | | |
Selected Markets | | 367 | | 115,158 | | 96,400 | | 75.6 | % |
Other Markets | | — | | — | | — | | 0.0 | % |
Total | | 367 | | 115,158 | | 96,400 | | 75.6 | % |
| | NON-CORE PROPERTIES | |
| | Total
Properties | | Total
Units | | Effective
Units | | % Conventional
Real Estate FCF | |
| | | | | | | | | |
Selected Markets | | 184 | | 45,312 | | 37,532 | | 19.3 | % |
Other Markets | | 77 | | 16,848 | | 9,791 | | 5.1 | % |
Total | | 261 | | 62,160 | | 47,323 | | 24.4 | % |
| | TOTAL CONVENTIONAL | |
| | Total
Properties | | Total
Units | | Effective
Units | | % Conventional
Real Estate FCF | |
| | | | | | | | | |
Selected Markets | | 551 | | 160,470 | | 133,932 | | 94.9 | % |
Other Markets | | 77 | | 16,848 | | 9,791 | | 5.1 | % |
Total | | 628 | | 177,318 | | 143,723 | | 100.0 | % |
15
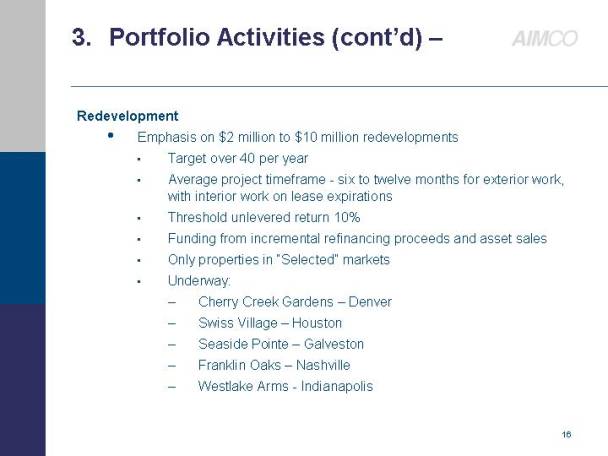
Redevelopment
• Emphasis on $2 million to $10 million redevelopments
• Target over 40 per year
• Average project timeframe - six to twelve months for exterior work, with interior work on lease expirations
• Threshold unlevered return 10%
• Funding from incremental refinancing proceeds and asset sales
• Only properties in “Selected” markets
• Underway:
• Cherry Creek Gardens – Denver
• Swiss Village – Houston
• Seaside Pointe – Galveston
• Franklin Oaks –Nashville
• Westlake Arms - Indianapolis
16
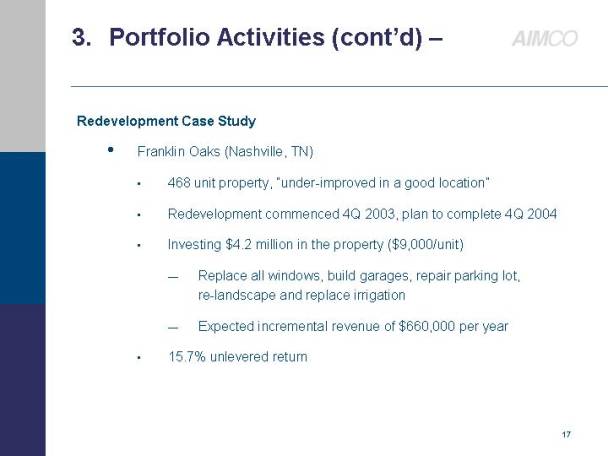
Redevelopment Case Study
• Franklin Oaks (Nashville, TN)
• 468 unit property, “under-improved in a good location”
• Redevelopment commenced 4Q 2003, plan to complete 4Q 2004
• Investing $4.2 million in the property ($9,000/unit)
• Replace all windows, build garages, repair parking lot, re-landscape and replace irrigation
• Expected incremental revenue of $660,000 per year
• 15.7% unlevered return
17
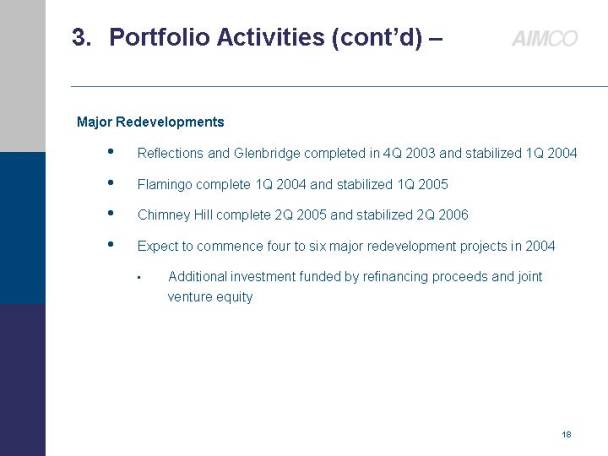
Major Redevelopments
• Reflections and Glenbridge completed in 4Q 2003 and stabilized 1Q 2004
• Flamingo complete 1Q 2004 and stabilized 1Q 2005
• Chimney Hill complete 2Q 2005 and stabilized 2Q 2006
• Expect to commence four to six major redevelopment projects in 2004
• Additional investment funded by refinancing proceeds and joint venture equity
18
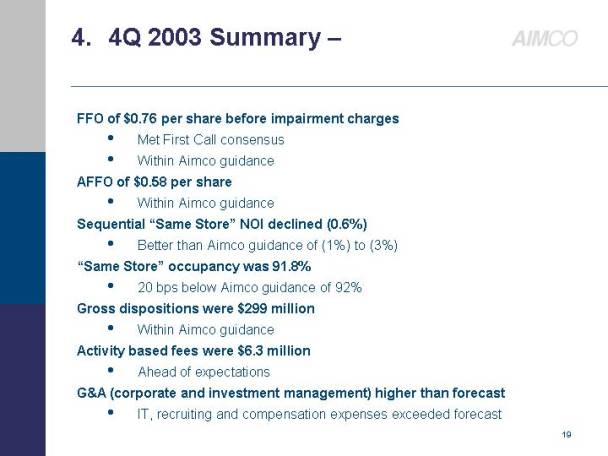
4. 4Q 2003 Summary –
FFO of $0.76 per share before impairment charges
• Met First Call consensus
• Within Aimco guidance
AFFO of $0.58 per share
• Within Aimco guidance
Sequential “Same Store” NOI declined (0.6%)
• Better than Aimco guidance of (1%) to (3%)
“Same Store” occupancy was 91.8%
• 20 bps below Aimco guidance of 92%
Gross dispositions were $299 million
• Within Aimco guidance
Activity based fees were $6.3 million
• Ahead of expectations
G&A (corporate and investment management) higher than forecast
• IT, recruiting and compensation expenses exceeded forecast
19
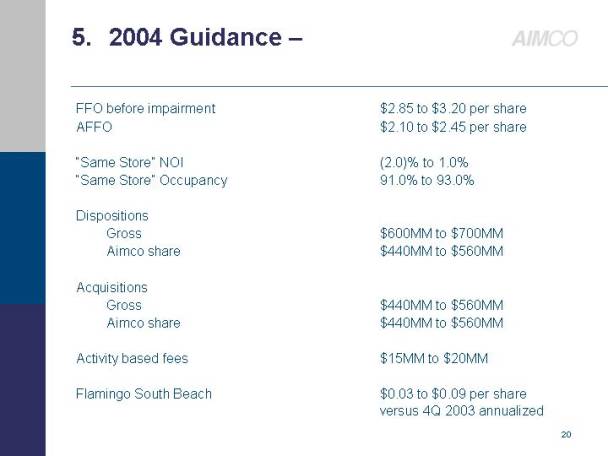
5. 2004 Guidance –
FFO before impairment | | $2.85 to $3.20 per share |
AFFO | | $2.10 to $2.45 per share |
| | |
“Same Store” NOI | | (2.0)% to 1.0% |
“Same Store” Occupancy | | 91.0% to 93.0% |
| | |
Dispositions | | |
Gross | | $600MM to $700MM |
Aimco share | | $440MM to $560MM |
| | |
Acquisitions | | |
Gross | | $440MM to $560MM |
Aimco share | | $440MM to $560MM |
| | |
Activity based fees | | $15MM to $20MM |
| | |
Flamingo South Beach | | $0.03 to $0.09 per share versus 4Q 2003 annualized |
20
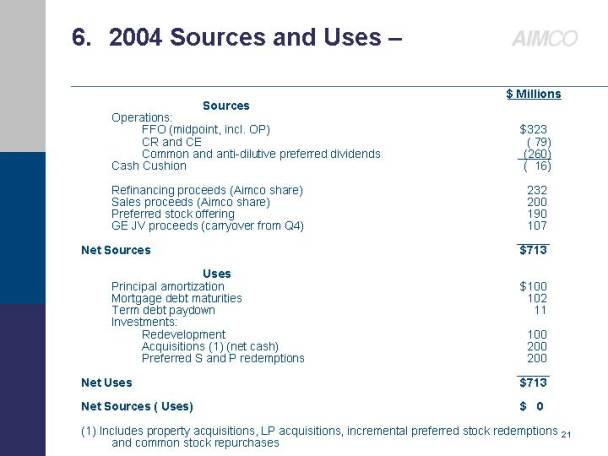
6. 2004 Sources and Uses –
| | $ Millions | |
Sources | | | |
Operations: | | | |
FFO (midpoint, incl. OP) | | $ | 323 | |
CR and CE | | (79 | ) |
Common and anti-dilutive preferred dividends | | (260 | ) |
Cash Cushion | | (16 | ) |
| | | |
Refinancing proceeds (Aimco share) | | 232 | |
Sales proceeds (Aimco share) | | 200 | |
Preferred stock offering | | 190 | |
GE JV proceeds (carryover from Q4) | | 107 | |
Net Sources | | $ | 713 | |
| | | |
Uses | | | |
Principal amortization | | $ | 100 | |
Mortgage debt maturities | | 102 | |
Term debt paydown | | 11 | |
Investments: | | | |
Redevelopment | | 100 | |
Acquisitions (1) (net cash) | | 200 | |
Preferred S and P redemptions | | 200 | |
Net Uses | | $ | 713 | |
| | | |
Net Sources (Uses) | | $ | 0 | |
(1) Includes property acquisitions, LP acquisitions, incremental preferred stock redemptions and common stock repurchases
21