Exhibit 99.1
AIMCO
Apartment Investment and Management Company
NAREIT - JUNE 2004
|

Link to searchable text of slide shown above
Link to searchable text of slide shown above
Link to searchable text of slide shown above
Link to searchable text of slide shown above
Link to searchable text of slide shown above
Link to searchable text of slide shown above
Link to searchable text of slide shown above
Link to searchable text of slide shown above
Link to searchable text of slide shown above
Searchable text section of graphics shown above
[LOGO]
1
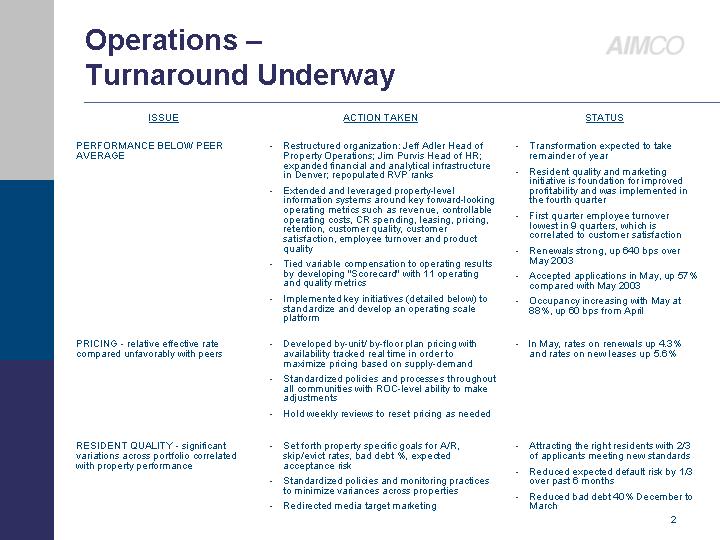
Operations —
Turnaround Underway
ISSUE | | ACTION TAKEN | | STATUS |
| | | | |
PERFORMANCE BELOW PEER AVERAGE | | • Restructured organization: Jeff Adler Head of Property Operations; Jim Purvis Head of HR; expanded financial and analytical infrastructure in Denver; repopulated RVP ranks • Extended and leveraged property-level information systems around key forward-looking operating metrics such as revenue, controllable operating costs, CR spending, leasing, pricing, retention, customer quality, customer satisfaction, employee turnover and product quality • Tied variable compensation to operating results by developing “Scorecard” with 11 operating and quality metrics • Implemented key initiatives (detailed below) to standardize and develop an operating scale platform | | • Transformation expected to take remainder of year • Resident quality and marketing initiative is foundation for improved profitability and was implemented in the fourth quarter • First quarter employee turnover lowest in 9 quarters, which is correlated to customer satisfaction • Renewals strong, up 640 bps over May 2003 • Accepted applications in May, up 57% compared with May 2003 • Occupancy increasing with May at 88%, up 60 bps from April |
| | | | |
PRICING - relative effective rate compared unfavorably with peers | | • Developed by-unit/ by-floor plan pricing with availability tracked real time in order to maximize pricing based on supply-demand • Standardized policies and processes throughout all communities with ROC-level ability to make adjustments • Hold weekly reviews to reset pricing as needed | | • In May, rates on renewals up 4.3% and rates on new leases up 5.6% |
| | | | |
RESIDENT QUALITY - significant variations across portfolio correlated with property performance | | • Set forth property specific goals for A/R, skip/evict rates, bad debt %, expected acceptance risk • Standardized policies and monitoring practices to minimize variances across properties • Redirected media target marketing | | • Attracting the right residents with 2/3 of applicants meeting new standards • Reduced expected default risk by 1/3 over past 6 months • Reduced bad debt 40% December to March |
2
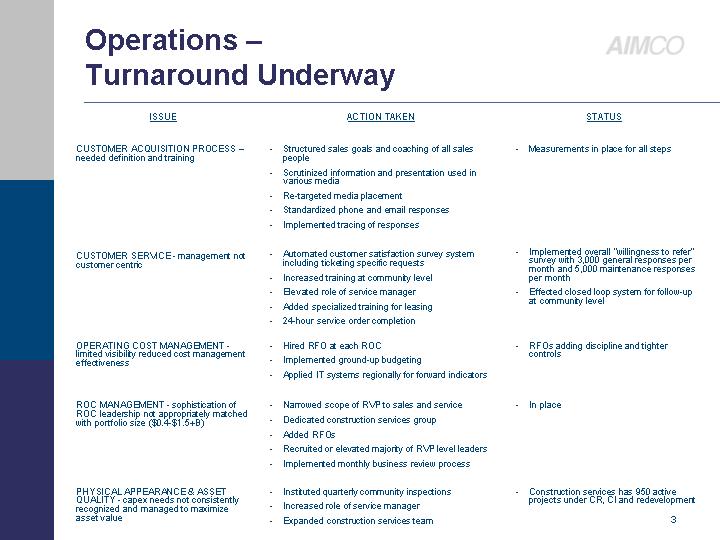
ISSUE | | ACTION TAKEN | | STATUS |
| | | | |
CUSTOMER ACQUISITION PROCESS – needed definition and training | | • Structured sales goals and coaching of all sales people • Scrutinized information and presentation used in various media • Re-targeted media placement • Standardized phone and email responses • Implemented tracing of responses | | • Measurements in place for all steps |
| | | | |
CUSTOMER SERVICE - management not customer centric | | • Automated customer satisfaction survey system including ticketing specific requests • Increased training at community level • Elevated role of service manager • Added specialized training for leasing • 24-hour service order completion | | • Implemented overall “willingness to refer” survey with 3,000 general responses per month and 5,000 maintenance responses per month • Effected closed loop system for follow-up at community level |
| | | | |
OPERATING COST MANAGEMENT - limited visibility reduced cost management effectiveness | | • Hired RFO at each ROC • Implemented ground-up budgeting • Applied IT systems regionally for forward indicators | | • RFOs adding discipline and tighter controls |
| | | | |
ROC MANAGEMENT - sophistication of ROC leadership not appropriately matched with portfolio size ($0.4-$1.5+B) | | • Narrowed scope of RVP to sales and service • Dedicated construction services group • Added RFOs • Recruited or elevated majority of RVP level leaders • Implemented monthly business review process | | • In place |
| | | | |
PHYSICAL APPEARANCE & ASSET QUALITY - capex needs not consistently recognized and managed to maximize asset value | | • Instituted quarterly community inspections • Increased role of service manager • Expanded construction services team | | • Construction services has 950 active projects under CR, CI and redevelopment |
3
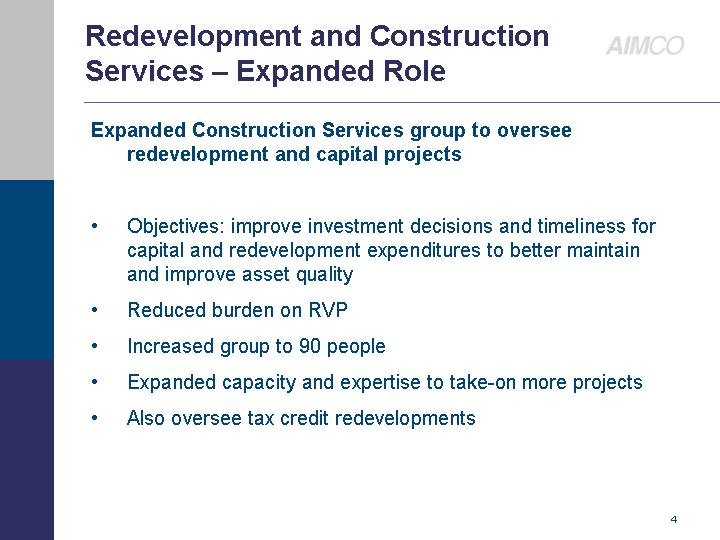
Redevelopment and Construction
Services — Expanded Role
Expanded Construction Services group to oversee redevelopment and capital projects
• Objectives: improve investment decisions and timeliness for capital and redevelopment expenditures to better maintain and improve asset quality
• Reduced burden on RVP
• Increased group to 90 people
• Expanded capacity and expertise to take-on more projects
• Also oversee tax credit redevelopments
4
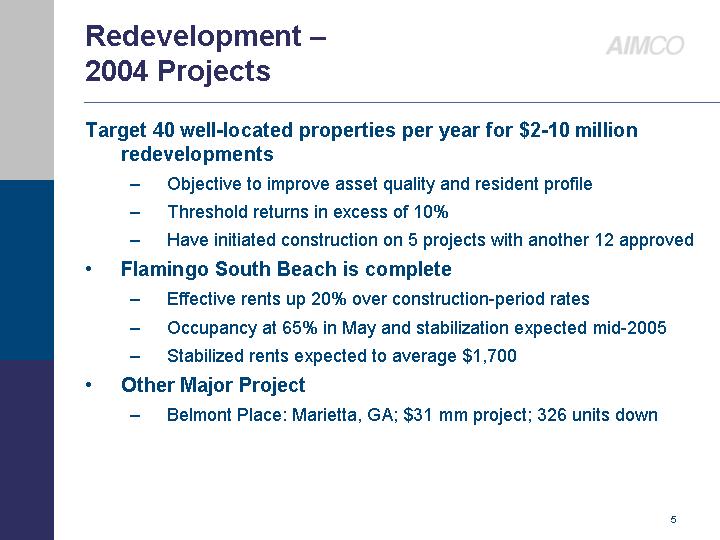
Redevelopment —
2004 Projects
Target 40 well-located properties per year for $2-10 million redevelopments
• Objective to improve asset quality and resident profile
• Threshold returns in excess of 10%
• Have initiated construction on 5 projects with another 12 approved
• Flamingo South Beach is complete
• Effective rents up 20% over construction-period rates
• Occupancy at 65% in May and stabilization expected mid-2005
• Stabilized rents expected to average $1,700
• Other Major Project
• Belmont Place: Marietta, GA; $31 mm project; 326 units down
5
Redevelopment —
Upside Opportunity
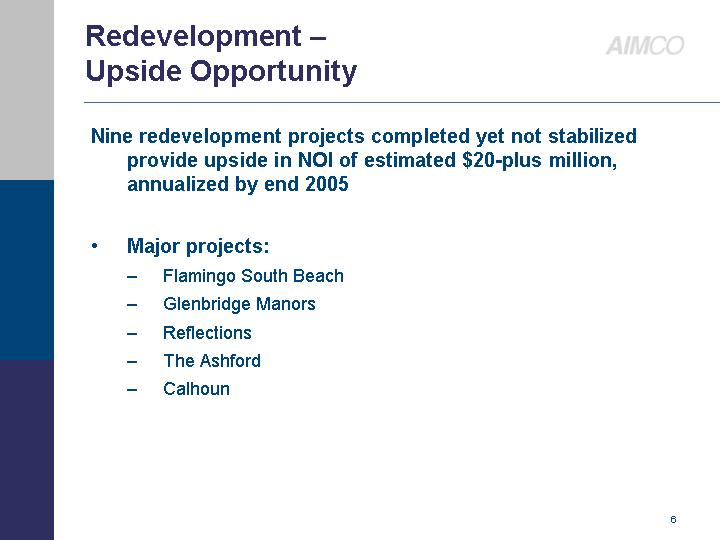
Nine redevelopment projects completed yet not stabilized provide upside in NOI of estimated $20-plus million, annualized by end 2005
• Major projects:
• Flamingo South Beach
• Glenbridge Manors
• Reflections
• The Ashford
• Calhoun
6
Aimco Capital —
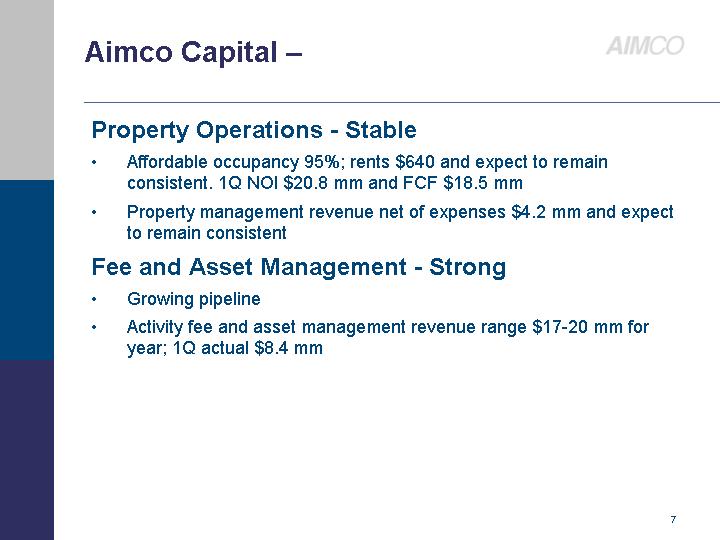
Property Operations - Stable
• Affordable occupancy 95%; rents $640 and expect to remain consistent. 1Q NOI $20.8 mm and FCF $18.5 mm
• Property management revenue net of expenses $4.2 mm and expect to remain consistent
Fee and Asset Management - Strong
• Growing pipeline
• Activity fee and asset management revenue range $17-20 mm for year; 1Q actual $8.4 mm
7
Opportunity —
Improved Operations
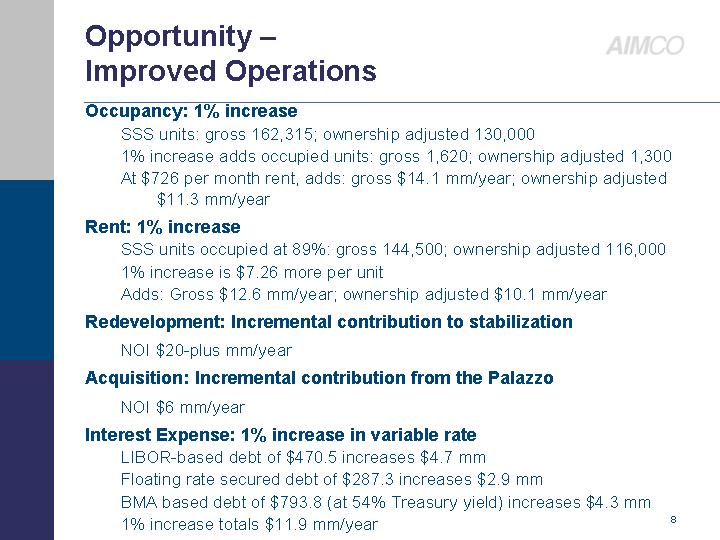
Occupancy: 1% increase
SSS units: gross 162,315; ownership adjusted 130,000
1% increase adds occupied units: gross 1,620; ownership adjusted 1,300
At $726 per month rent, adds: gross $14.1 mm/year; ownership adjusted $11.3 mm/year
Rent: 1% increase
SSS units occupied at 89%: gross 144,500; ownership adjusted 116,000
1% increase is $7.26 more per unit
Adds: Gross $12.6 mm/year; ownership adjusted $10.1 mm/year
Redevelopment: Incremental contribution to stabilization
NOI $20-plus mm/year
Acquisition: Incremental contribution from the Palazzo
NOI $6 mm/year
Interest Expense: 1% increase in variable rate
LIBOR-based debt of $470.5 increases $4.7 mm
Floating rate secured debt of $287.3 increases $2.9 mm
BMA based debt of $793.8 (at 54% Treasury yield) increases $4.3 mm
1% increase totals $11.9 mm/year
8
This Presentation Contains
Forward-looking Statements
This presentation contains forward-looking statements, including statements regarding future results. These statements are subject to certain risks and uncertainties, including but not limited to Aimco’s ability to maintain and improve occupancy, maintain and increase rental rates, lease-up redevelopment and acquisition properties and generate fee income as projected. Actual results may differ materially from projections and could be affected by a variety of factors, including factors beyond Aimco’s control. These factors are described in Aimco’s filings with the Securities and Exchange Commission, including Aimco’s Annual Report on Form 10-K . These forward-looking statements reflect management’s judgment as of this date, and Aimco assumes no obligation to revise or update them to reflect future events or circumstances.
9