Exhibit 99.1

Aimco First Quarter 2020 Results:Same Store NOI up 5.0%;
FFO up 10%;
AFFO up 9%
Denver, Colorado, May 7, 2020 – Apartment Investment and Management Company (“Aimco”) (NYSE: AIV) provided today a COVID-19 update and announced first quarter results for 2020.
Chairman and Chief Executive Officer Terry Considine comments: “The Aimco business began the year with record effectiveness and record profitability. In mid-March, as you all know, the world changed. A famous observation goes: ‘There are decades when nothing happens; and there are weeks when decades happen.’ The last few weeks of March were a time when it seemed that ‘decades’ were happening!”
“The combination of the public health crisis and the severe economic contraction made the business environment quite challenging. While there were plenty of reasons for concern, it helped that we had designed Aimco with hard times in mind. That is why we give such importance to customer selection and customer satisfaction, and work so hard to control property expenses; why we prefer short-cycle redevelopment to less flexible ground-up development; why our portfolio is so diversified by geography and price point; why our leverage is primarily long-dated, non-recourse property debt; and why our intentional culture emphasizes flexibility and initiative, collaboration and personal responsibility.”
Aimco’s Response to the COVID-19 Pandemic - Here’s how Aimco responded to the COVID-19 pandemic:
As the crisis approached, Aimco made the health and safety of teammates its priority. Aimco:
| • | formed a cross-functional committee of approximately a dozen, from across the company, that met daily to re-design how work was done on site, to keep the Aimco team safe while continuing to lease apartments and fulfil service requests; |
| • | made it clear, and consistent with company policies providing flexibility, that any teammate who felt unsafe at work because of the virus was free to stay home, with pay and without penalty; |
| • | undertook to pay all costs related to COVID-19 testing and treatment; |
| • | committed to keep the Aimco team intact, without layoffs or pay cuts; and |
| • | continued, and increased, regular communications and transparency, providing a steady flow of written, oral, and video reports to the entire team. |
Customer focus led Aimco to make its properties safer by increasing cleaning, reducing opportunities for infection, and limiting in-person interactions with neighbors and site teams. Aimco:
| • | searched out ways to support those sheltering at home and to meet the needs of the relatively few who reported positive for infection by COVID-19; |
| • | redeployed construction supervisors whose work had been paused to support property service teams, and redeployed dozens of Aimco office workers to join our shared service center team to hold thousands of structured conversations with residents, helping each plan his or her personal adjustment to the crisis, including offering financial advice, tips on job searches, help with errands, ideas about how to find a roommate, establishing payment plans where appropriate, and even, in a few difficult cases, providing money for groceries; |
| • | utilized its previous investment in technology and artificial intelligence to adapt to the new conditions of social distancing and sheltering at home; and |
2
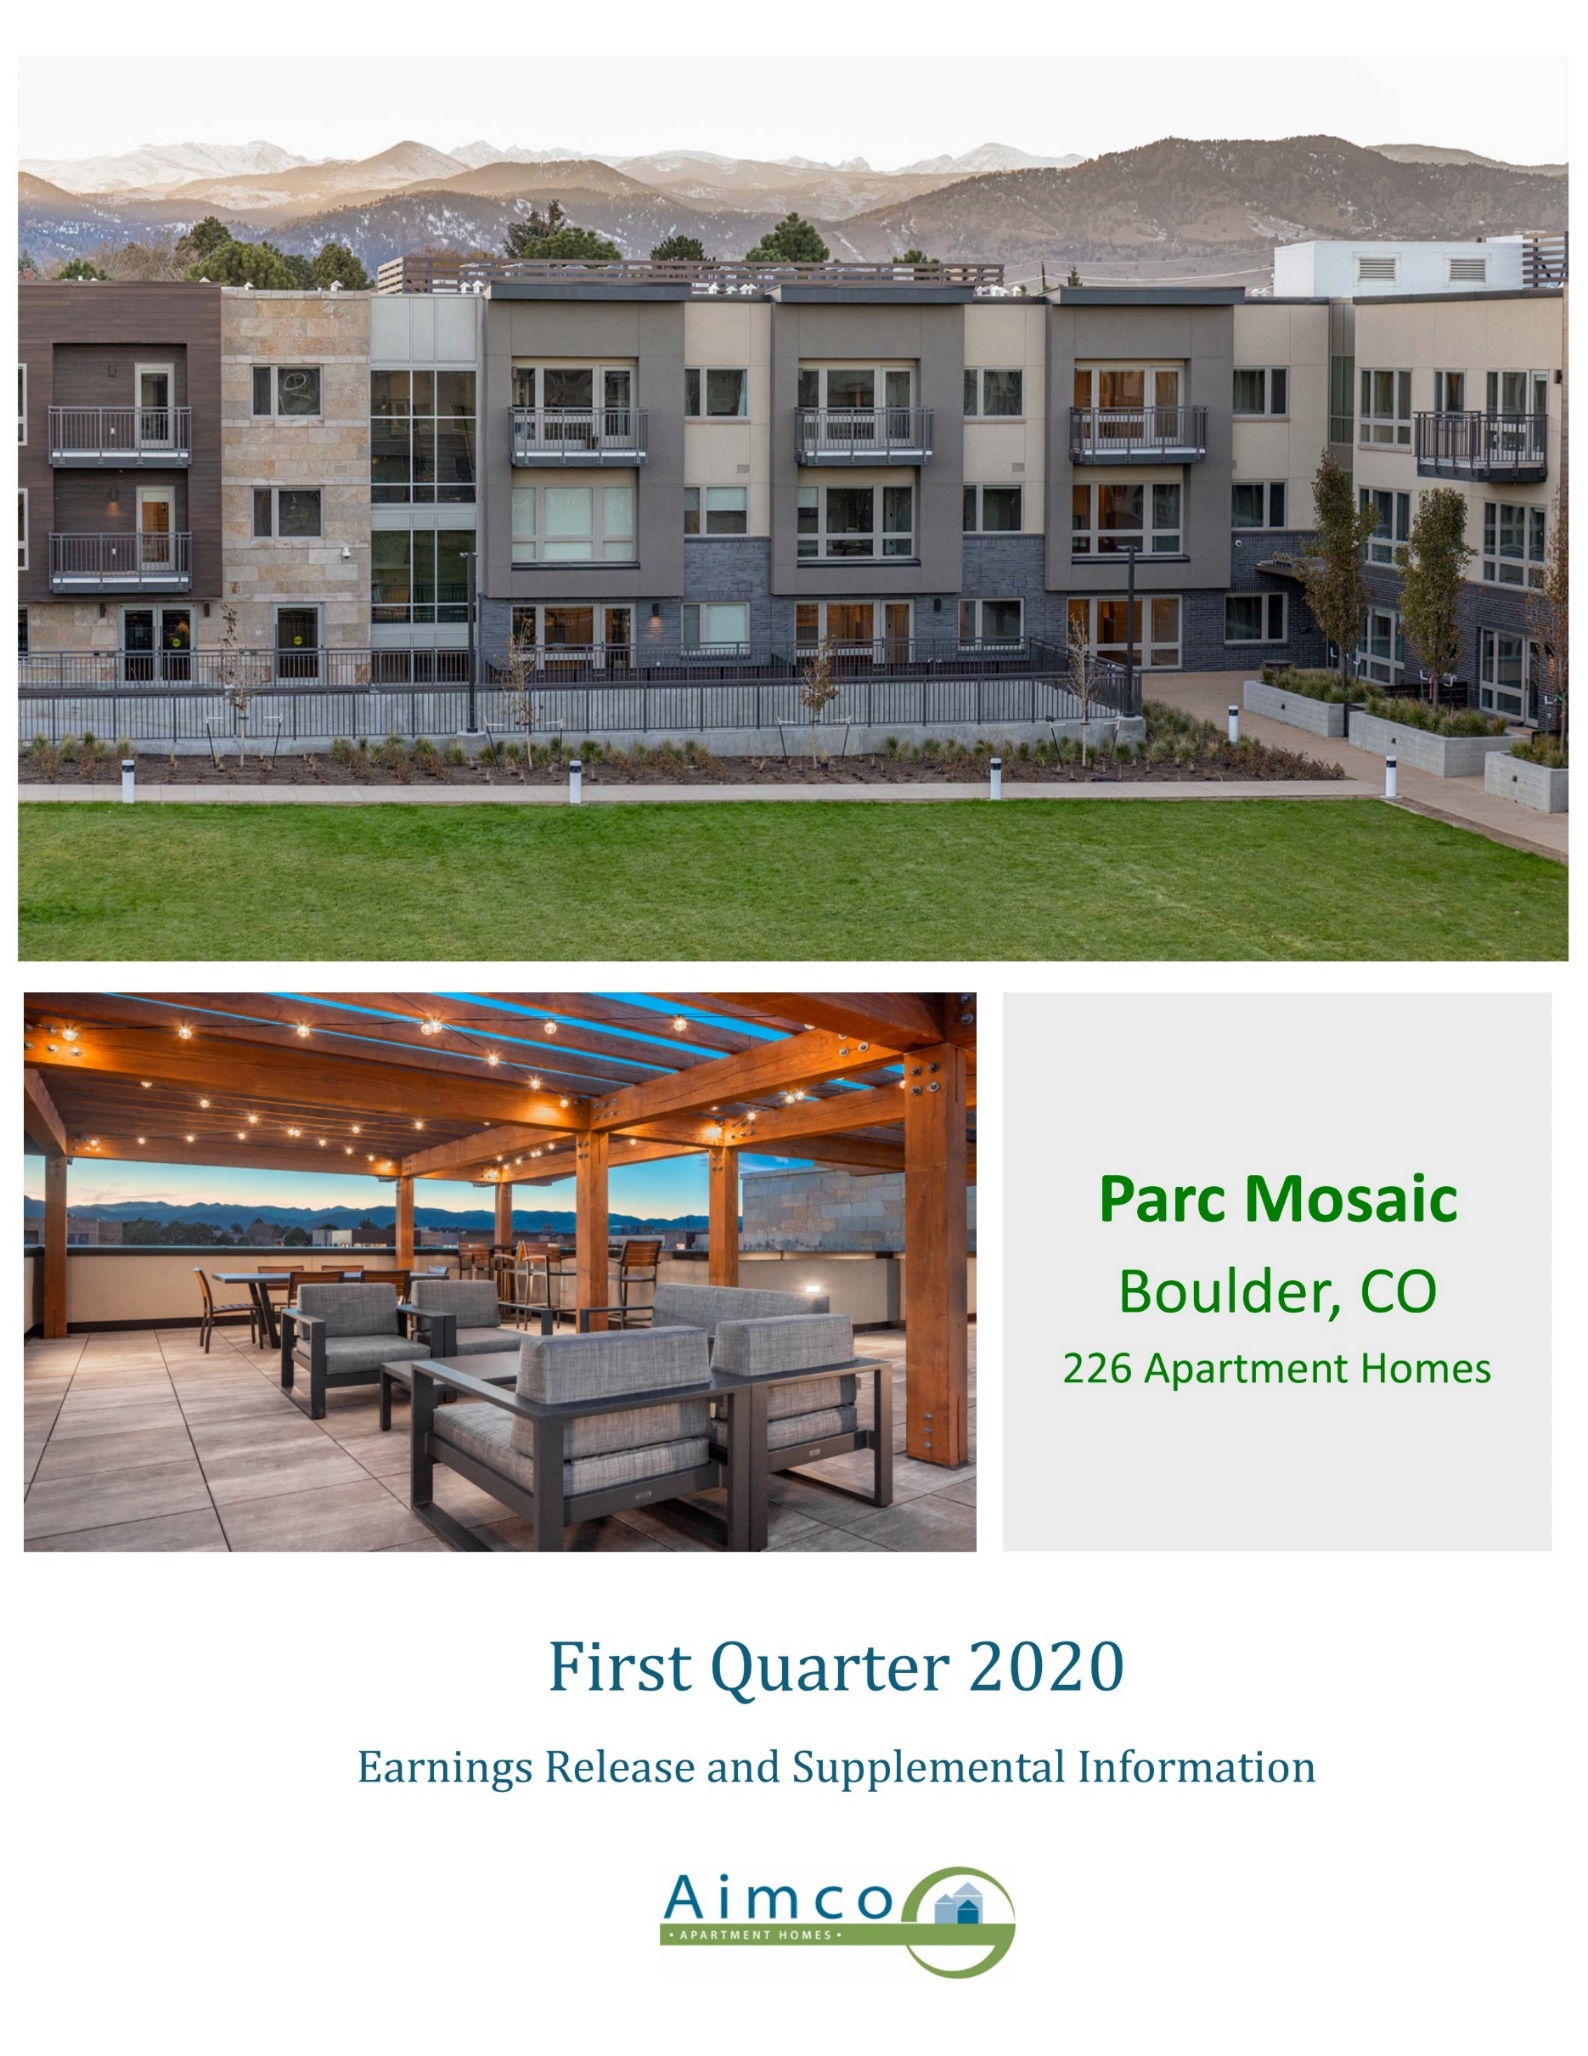
| • | mindful of the sacrifice of healthcare providers who worked long hours and felt unable to go home without risking infection of their families, and as part of the Aimco Cares Good Neighbor program, provided free use of furnished apartments at 21 Fitzsimons on the Anschutz Medical Campus, Parc Mosaic near Boulder Community Health, and River Club near Newark University Hospital. |
Aimco’s Board of Directors was fully informed and fully engaged … including two candidates for the board who were not formally elected until the end of April. During March and April, Aimco delivered five management reports, made numerous calls, asked individual directors for specific assistance, and held four virtual board meetings.
Knowing the importance of financial liquidity and building on $650 million of cash and committed credit at the start of 2020, Aimco drew down $300 million on its bank lines, reduced expected 2020 capital spending by $150 million, or almost one-half, and undertook to increase available credit by another $720 million: a $350 million bank term loan and approximately $370 million in proceeds from property loans, of which half are closed or rate-locked and half closing over the next 30 days.
Preliminary 2nd Quarter Information
| • | In April, Aimco resident turnover reached an all-time low of 41.1%, down 270 basis points year-over-year. |
| • | Leasing pace, which initially dropped by half in mid-March, is recovering. In April, the Aimco leasing team provided more than 3,300 live, virtual tours to prospects generating more than 1,000 leases. |
| • | April average daily occupancy of 96.6% was down 40 basis points year-over-year, yet higher by 20 basis points from April 2018. |
| • | Pricing has remained solid with April blended lease rate increases of 4.2%, up 50 basis points year-over-year. |
Effective in April, Aimco revised its estimation of residential bad debt to consider creditworthy residents and their guarantors who choose to withhold rent payments.
Aimco’s new methodology accelerated the estimate of collectability to month-end based on its assessment of the creditworthiness of the tenants and third-party guarantors, based on their FICO scores. Previously, Aimco evaluated collectability of balances only after such balances were more than 30 days past due. Using the new methodology, April residential bad debt expense was approximately 1% of revenues, or $670k; an increase of $270k from what would have been the result using Aimco’s former methodology.
Aimco also reviewed the viability of its commercial tenants and the related accounting assets for straight-line rents and deferred broker commissions.
Approximately $2.5 million, or 3.5%, of Aimco’s monthly revenue is derived from commercial tenants, about one-half office uses and one-half other commercial uses. In April, Aimco collected 90% of amounts due from office tenants and 30% of rents from the other commercial users.
US GAAP requires revenue subject to long-term leases to be recognized in a ratable, or straight-line, manner over the life of the lease. In practice, this results in GAAP income in excess of cash receipts in the early years of a lease. Additionally, GAAP requires broker commissions paid for origination of the lease to be deferred and recognized over the life of the lease. Entering 2020, Aimco had recognized $6.7 million of GAAP rental revenue in-excess of cash rent and had deferred $3.8 million of broker commissions. Based on the expected economic impact of COVID-19 and the recession at hand, Aimco wrote off, in the first quarter, $2.9 million of its straight-line rent receivable and $2.2 million of deferred broker commissions related to leases to commercial tenants with retail, restaurant, and fitness uses. Monthly rent for these tenants is approximately $0.6 million and future rental revenue will be recognized on a cash basis.
3
Redevelopment and Development
When the current crisis became apparent, Aimco paused all of its short-cycle redevelopment and property upgrade activities. Together with other projects that had been slated to start later this year, Aimco reduced expected 2020 capital spending by 45%, or $150 million.
Aimco is continuing construction of five long-cycle redevelopments and developments currently underway. These five apartment communities have an estimated remaining cost to complete of approximately $212 million; approximately $140 million of which is expected to be spent in 2020. Three are expected to be completed in 2020 and two are expected to be completed in 2021. When stabilized, these communities are expected to contribute approximately $30 million of additional net operating income.
Liquidity and Leverage
Today, Aimco has $1 billion of liquidity: summing cash on hand; availability under our revolving credit facility; and excess proceeds on rate-locked debt closing in the next few weeks. This liquidity will increase by an additional $200 million, as in-process property loans close over the next 30 days.
In total, Aimco is placing $688 million of new property debt, generating incremental proceeds of $367 million. Aimco has closed or rate-locked $326 million of the new property loans. These loans have a weighted-average term to maturity of 8.3 years and a weighted-average interest rate of 2.9%, lowering Aimco’s overall borrowing costs by five basis points. When these financings, and the property loans currently in process, are completed, Aimco will have no loan maturities in 2020 and will have reduced 2021 to 2024 maturities by $229 million; resulting in average annual maturities of $265 million for the four years 2021 to 2024.
Aimco’s balance sheet is safe and provides flexibility and abundant liquidity. Leverage, as measured by leverage-to-EBITDA, remains above targeted levels. Aimco expects to reduce leverage to targeted levels through increased EBITDA from the lease up of the five properties under construction and from property sales.
In early May, Aimco sold an apartment community located in Annandale, Virginia at a price of $58.9 million, equal to its estimated gross asset value at December 31, 2019.
Financial Results: First Quarter FFO Per Share Up 10%; AFFO Per Share Up 9%
| | FIRST QUARTER | |
(all items per common share - diluted) | | 2020 | | | 2019 | | | Variance | |
Net income | | $ | 0.04 | | | $ | 1.88 | | | | (98 | %) |
Nareit Funds From Operations (FFO) and Pro forma FFO | | $ | 0.67 | | | $ | 0.61 | | | | 10 | % |
Deduct Capital Replacements | | $ | (0.07 | ) | | $ | (0.06 | ) | | | 17 | % |
Adjusted Funds From Operations (AFFO) | | $ | 0.60 | | | $ | 0.55 | | | | 9 | % |
Chief Financial Officer Paul Beldin comments: “Aimco’s first quarter was solid with AFFO of $0.60 per share, equal to the midpoint of the guidance provided at the beginning of the year, and up 9% year-over-year. Better-than-expected Same Store operating results, lower G&A expenses, and the prepayment of a seller financed note combined to outperform our expectations by $0.03. This outperformance was offset by $0.4 million of COVID-19 related costs; and $5.1 million of charges related to the previously discussed straight-line rent and deferred broker commission adjustments. FFO of $0.67 per share was a penny ahead of the midpoint of guidance, and up 10% year-over-year.”
4
Net Income (per diluted common share) – Year-over-year, first quarter net income decreased due primarily to lower gains from dispositions.
Adjusted Funds from Operations (per pro forma diluted common share) – Aimco’s first quarter AFFO per share increased $0.05 year-over-year due primarily to a $0.05 increase in Same Store Property Net Operating Income.
Operating Results: First Quarter Same Store NOI Up 5.0%
| FIRST QUARTER |
| Year-over-Year | Sequential |
| 2020 | 2019 | Variance | 4th Qtr. | Variance |
Average Rent per Apartment Home | $2,157 | $2,098 | 2.8% | $2,152 | 0.2% |
Other Income per Apartment Home | $132 | 129 | 2.3% | 132 | —% |
Average Revenue per Apartment Home | $2,289 | $2,227 | 2.8% | $2,284 | 0.2% |
Average Daily Occupancy | 97.6% | 97.0% | 0.6% | 97.4% | 0.2% |
| | | | | |
$ in Millions | | | | | |
Revenue, before utility reimbursements | $188.0 | $181.6 | 3.5% | $187.1 | 0.4% |
Expenses, net of utility reimbursements | 48.8 | 49.0 | (0.4%) | 47.2 | 3.3% |
NOI | $139.2 | $132.6 | 5.0% | $139.9 | (0.5%) |
Same Store Rental Rates – Aimco measures changes in rental rates by comparing, on a lease-by-lease basis, the rate on a newly executed lease to the rate on the expiring lease for that same apartment. Newly executed leases are classified as either a new lease, where a vacant apartment is leased to a new customer, or as a renewal. The table below details changes in new and renewal lease rates, as well as the weighted-average (blended) lease rates.
| 1st Qtr. | | | | | | | 2020 | |
| 2020 | | 2019 | | Variance | | | | Jan | | Feb | | Mar | | | | Apr | |
Renewal rent increases | | 5.8 | % | | 5.3 | % | | 0.5 | % | | | | 5.5 | % | | 5.2 | % | | 6.2 | % | | | | 6.0 | % |
New lease rent increases | | 1.7 | % | | 1.1 | % | | 0.6 | % | | | | 1.0 | % | | 2.1 | % | | 2.0 | % | | | | 0.9 | % |
Weighted-average rent increases | | 3.6 | % | | 3.1 | % | | 0.5 | % | | | | 2.6 | % | | 3.3 | % | | 4.3 | % | | | | 4.2 | % |
Average Daily Occupancy | | 97.6 | % | | 97.0 | % | | 0.6 | % | | | | 97.9 | % | | 97.5 | % | | 97.4 | % | | | | 96.6 | % |
In April, weighted-average rent increases were 50 basis points higher than increases in April 2019 and Average Daily Occupancy was 40 basis points lower year-over-year.
Redevelopment and Development
Redevelopment is Aimco’s second line of business where Aimco creates value by repositioning communities within the Aimco portfolio. Aimco also undertakes ground-up development when warranted by risk-adjusted investment returns, either directly or in connection with redevelopment of an existing apartment community. Aimco invests to earn risk-adjusted returns in excess of those expected from the apartment communities sold in “paired trades” to fund the redevelopment and development. Of these two activities, Aimco generally favors redevelopment because it permits adjustment of the scope and timing of spending to align with changing market conditions and customer preferences.
During the first quarter, Aimco invested $67 million in redevelopment and development. In March, as mentioned above, Aimco paused investment in its short-cycle redevelopment projects and delayed the start of new projects. Aimco intends to continue five long-cycle redevelopment and development projects already under construction, including the full redevelopment of the North Tower at Flamingo Point in Miami Beach,
5
Florida, and 707 Leahy in Redwood City, California; ground-up construction at The Fremont on the Anschutz Medical Campus in Aurora, Colorado; Eldridge Townhomes adjacent to its Elm Creek apartment community in Elmhurst, Illinois; and Prism in Cambridge, Massachusetts. Aimco’s estimated cost to complete these projects is $212 million, an amount equal to 1.5% of Aimco’s estimated gross asset value and readily funded from Aimco’s liquidity.
In the first quarter, Aimco substantially completed construction at Parc Mosaic in Boulder, Colorado. As of March 31st, Aimco had leased 69% of the apartment homes at rents exceeding underwriting.
In March, complying with local COVID-19 related restrictions, construction activities were halted temporarily at 707 Leahy in Redwood City, California. On May 4th, restrictions were eased and construction activities resumed. Completion of construction, previously expected in the second quarter, is now expected in the third quarter.
In July 2019, Aimco announced the acquisition of an under-development apartment community located in Cambridge, Massachusetts, now called Prism. The City has halted all construction. Assuming the current ban is lifted by early summer, completion of this 136-unit property is expected in the first quarter of 2021.
During the first quarter, Aimco leased 73 redeveloped or newly developed apartment homes. At March 31, 2020, Aimco’s exposure to lease-up at long-cycle redevelopment and development communities was 892 apartment homes; 70 homes where construction is complete, 347 homes expected to be delivered during the remainder of 2020, and 475 homes expected to be delivered in 2021.
Portfolio Management
Aimco’s portfolio of apartment communities is diversified across “A,” “B,” and “C+” price points, averaging “B/B+” in quality and is also diversified across several of the largest markets in the United States.
Portfolio Strategy – Aimco follows a disciplined paired trade policy in making investments. As part of its portfolio strategy, Aimco seeks to sell up to 10% of its portfolio annually and to reinvest the proceeds from such sales in accretive uses such as capital enhancements, redevelopments, some developments, and selective acquisitions with projected Free Cash Flow internal rates of return higher than expected from the communities being sold. Aimco prefers well-located real estate where land is a significant percentage of total value and provides potential upside from development or redevelopment. Through this disciplined approach to capital recycling, Aimco increases the quality and expected growth rate of its portfolio.
| FIRST QUARTER |
| 2020 | 2019 | Variance |
Apartment Communities | 124 | 128 | (4) |
Apartment Homes | 32,846 | 34,349 | (1,503) |
Average Revenue per Apartment Home | $2,280 | $2,181 | 5% |
Portfolio Average Rents as a Percentage of Local Market Average Rents | 112% | 113% | (1%) |
Percentage A (1Q 2020 Average Revenue per Apartment Home $2,988) | 53% | 52% | 1% |
Percentage B (1Q 2020 Average Revenue per Apartment Home $2,010) | 30% | 32% | (2%) |
Percentage C+ (1Q 2020 Average Revenue per Apartment Home $1,769) | 17% | 16% | 1% |
NOI Margin | 73% | 72% | 1% |
Free Cash Flow Margin | 68% | 67% | 1% |
First Quarter Portfolio – For its entire portfolio, Aimco’s average monthly revenue per apartment home was $2,280 for first quarter 2020, a 5% increase compared to first quarter 2019. This increase is due primarily to year-over-year growth in Same Store revenue, lease-up of redeveloped apartment homes, and sales of communities with average monthly revenues per apartment home lower than those of the retained portfolio.
6
In the first quarter, Aimco made no acquisitions or dispositions.
Mezzanine Loan Investment – As previously announced, in December 2019, Aimco made a five-year, $275 million mezzanine loan to a partnership owning Parkmerced Apartments, located in southwest San Francisco. The loan bears interest at a 10% annual rate payable from property cash flow. During the first quarter, property operations were 98% of underwriting and Aimco received cash payments of $0.6 million and accrued the remaining amount due. The partnership has made all required loan payments through April. Aimco expects that it will collect all amounts due under the loan and believes that it is well secured by the remedies proved by the loan agreements.
Balance Sheet
Aimco Leverage
Aimco seeks to increase financial returns by using leverage with appropriate caution. Aimco limits risk through its balance sheet structure, employing low leverage, primarily non-recourse and long-dated property debt; and Aimco builds financial flexibility by maintaining ample unused and available credit; holding properties with substantial value unencumbered by property debt; maintaining an investment grade rating; and using partners’ equity capital when it enhances financial returns or reduces investment risk.
Aimco leverage includes the Aimco share of long-term, non-recourse, property debt encumbering apartment communities, outstanding borrowings under the Aimco revolving credit facility, and other leverage.
| | AS OF MARCH 31, 2020 | |
$ in Millions | | Amount | | | % of Total | | | Weighted Avg. Maturity (Yrs.)* | |
Aimco share of long-term, non-recourse property debt | | $ | 4,221 | | | | 86 | % | | | 7.3 | |
Outstanding borrowings on revolving credit facility | | | 594 | | | | 12 | % | | | 1.8 | |
Other leverage | | | 101 | | | | 2 | % | | | 9.7 | |
Total Leverage | | $ | 4,916 | | | | 100 | % | | | 6.7 | |
Cash, restricted cash, and investments in securitization trust assets | | | (455 | ) | | | | | | | | |
Net Leverage | | $ | 4,461 | | | | | | | | | |
* | Other leverage includes mezzanine equity instruments, including Aimco Preferred OP Units, redeemable at the holder’s option. Aimco has computed the weighted-average maturity of its total leverage assuming a 10-year maturity for its Preferred OP Units. |
Leverage Ratios
Aimco target leverage ratios are Net Leverage to Adjusted EBITDAre below 7.0x and Adjusted EBITDAre to Interest Expense and Preferred Distributions greater than 2.5x. Aimco calculates Adjusted EBITDAre and Adjusted Interest Expense used in its leverage ratios based on current quarter amounts, annualized.
Proportionate Debt to Adjusted EBITDAre | | 7.5x |
Net Leverage to Adjusted EBITDAre | | 7.7x |
Adjusted EBITDAre to Adjusted Interest Expense | | 3.7x |
Adjusted EBITDAre to Adjusted Interest Expense and Preferred Distributions | | 3.6x |
Aimco leverage is expected to be reduced to target levels through the lease up of the five properties under construction and through property sales.
Under its revolving credit facility, Aimco has agreed to maintain a fixed charge coverage ratio of 1.40x, as well as other covenants customary for similar revolving credit arrangements. For the period ended March 31, 2020, Aimco’s fixed charge coverage ratio was 2.08x. Aimco expects to remain in compliance with its covenants.
7
Liquidity
Aimco uses its credit facility primarily for working capital and other short-term purposes and to secure letters of credit. At March 31, 2020, Aimco held cash and restricted cash of $359 million and had the capacity to borrow up to $199 million under its revolving credit facility, bringing total liquidity to $558 million. After consideration of the financing activities discussed previously, Aimco’s total liquidity is expected to be approximately $1.2 billion.
Aimco also manages its financial flexibility by maintaining an investment grade rating and holding apartment communities that are unencumbered by property debt.
Equity Capital Activities
During the first quarter, Aimco repurchased 0.2 million shares of its common stock for $10 million, at a weighted-average price of $42.79 per share, approximately a 27% discount to Aimco’s estimated Net Asset Value per share.
On April 28, 2020, the Aimco Board of Directors declared quarterly cash dividends of $0.41 per share of Class A Common Stock, an increase of 5% compared to the regular quarterly dividends paid in 2019. This amount is payable on May 29, 2020, to stockholders of record on May 15, 2020.
8
Earnings Conference Call Information
Live Conference Call: | Conference Call Replay: |
Friday, May 8, 2020 at 1:00 p.m. ET | Replay available until August 8, 2020 |
Domestic Dial-In Number: 1-888-317-6003 | Domestic Dial-In Number: 1-877-344-7529 |
International Dial-In Number: 1-412-317-6061 | International Dial-In Number: 1-412-317-0088 |
Passcode: 1484518 | Passcode: 10141988 |
Live webcast and replay: investors.aimco.com | |
|
Supplemental Information
The full text of this Earnings Release and the Supplemental Information referenced in this release are available on Aimco’s website at investors.aimco.com.
Glossary & Reconciliations of Non-GAAP Financial and Operating Measures
Financial and operating measures found in this Earnings Release and the Supplemental Information include certain financial measures used by Aimco management that are measures not defined under accounting principles generally accepted in the United States, or GAAP. Certain Aimco terms and Non-GAAP measures are defined in the Glossary in the Supplemental Information and Non-GAAP measures reconciled to the most comparable GAAP measures.
About Aimco
Aimco is a real estate investment trust focused on the ownership and management of quality apartment communities located in select markets in the United States. Aimco is one of the country’s largest owners and operators of apartments, with ownership interests in 124 apartment communities in 17 states and the District of Columbia. Aimco common shares are traded on the New York Stock Exchange under the ticker symbol AIV and are included in the S&P 500. For more information about Aimco, please visit our website at www.aimco.com.
Contact
Matt Foster, Director, Investor Relations
Investor Relations 303-793-4661, investor@aimco.com
9
Forward-looking Statements
This Earnings Release and Supplemental Information contain forward-looking statements within the meaning of the federal securities laws, including, without limitation, statements regarding projected results and specifically forecasts of second quarter and full year 2020 results, including but not limited to: Nareit FFO, Pro forma FFO and selected components thereof; AFFO; Aimco redevelopment and development investments and projected yield on such investments, timelines, and Net Operating Income contribution; expectations regarding sales of Aimco apartment communities and the use of proceeds thereof; and Aimco liquidity and leverage metrics.
These forward-looking statements are based on management’s judgment as of this date, which is subject to risks and uncertainties. Risks and uncertainties include, but are not limited to: the impact of the COVID-19 pandemic, including on Aimco’s ability to maintain current or meet projected occupancy, rental rate and property operating results; the effect of acquisitions, dispositions, redevelopments and developments; Aimco’s ability to meet budgeted costs and timelines, and achieve budgeted rental rates related to Aimco redevelopment and development investments; expectations regarding Aimco sales of apartment communities and the use of proceeds thereof; the availability and cost of property-level and corporate debt; and Aimco’s ability to comply with debt covenants, including financial coverage ratios.
Actual results may differ materially from those described in these forward-looking statements and, in addition, will be affected by a variety of risks and factors, some of which are beyond Aimco’s control, including, without limitation:
• | Real estate and operating risks, including fluctuations in real estate values and the general economic climate in the markets in which Aimco operates and competition for residents in such markets; national and local economic conditions, including the pace of job growth and the level of unemployment; the amount, location and quality of competitive new housing supply; the timing of acquisitions, dispositions, redevelopments and developments; and changes in operating costs, including energy costs; |
• | Impact of the COVID-19 pandemic on Aimco's residents, commercial tenants, and operations, including as a result of government restrictions and the overall impact on the real estate industry and economy generally, and the ongoing, dynamic and uncertain nature and duration of the pandemic, all of which heightens the impact of the other risks and factors described below; |
• | Financing risks, including the availability and cost of capital markets’ financing; the risk that cash flows from operations may be insufficient to meet required payments of principal and interest; and the risk that earnings may not be sufficient to maintain compliance with debt covenants; |
• | Insurance risks, including the cost of insurance, and natural disasters and severe weather such as hurricanes; and |
• | Legal and regulatory risks, including costs associated with prosecuting or defending claims and any adverse outcomes; the terms of governmental regulations that affect Aimco and interpretations of those regulations; and possible environmental liabilities, including costs, fines or penalties that may be incurred due to necessary remediation of contamination of apartment communities presently or previously owned by Aimco. |
In addition, Aimco’s current and continuing qualification as a real estate investment trust involves the application of highly technical and complex provisions of the Internal Revenue Code and depends on Aimco’s ability to meet the various requirements imposed by the Internal Revenue Code, through actual operating results, distribution levels and diversity of stock ownership.
Readers should carefully review Aimco’s financial statements and the notes thereto, as well as the section entitled “Risk Factors” in Item 1A of Aimco’s Annual Report on Form 10-K for the year ended December 31, 2019, and the other documents Aimco files from time to time with the Securities and Exchange Commission.
These forward-looking statements reflect management’s judgment as of this date, and Aimco assumes no obligation to revise or update them to reflect future events or circumstances. This press release does not constitute an offer of securities for sale.
10
Consolidated Statements of Operations
(in thousands, except per share data) (unaudited)
| | Three Months Ended March 31, | |
| | 2020 | | | 2019 | |
REVENUES | | | | | | | | |
Rental and other property revenues | | $ | 224,552 | | | $ | 230,235 | |
| | | | | | | | |
OPERATING EXPENSES | | | | | | | | |
Property operating expenses | | | 75,480 | | | | 78,959 | |
Depreciation and amortization | | | 100,476 | | | | 93,565 | |
General and administrative expenses | | | 10,108 | | | | 9,829 | |
Investment management expenses | | | 1,184 | | | | 1,332 | |
Other expenses, net | | | 1,642 | | | | 5,136 | |
Total operating expenses | | | 188,890 | | | | 188,821 | |
Interest income | | | 4,523 | | | | 2,726 | |
Interest expense | | | (41,336 | ) | | | (41,409 | ) |
(Loss) gain on dispositions of real estate | | | (34 | ) | | | 291,473 | |
Mezzanine investment income, net | | | 6,747 | | | | — | |
Income from unconsolidated real estate partnerships | | | 182 | | | | 72 | |
Income before income tax benefit (expense) | | | 5,744 | | | | 294,276 | |
Income tax benefit (expense) | | | 3,233 | | | | (2,981 | ) |
Net income | | | 8,977 | | | | 291,295 | |
Noncontrolling interests: | | | | | | | | |
Net income attributable to noncontrolling interests in consolidated real estate partnerships | | | (18 | ) | | | (91 | ) |
Net income attributable to preferred noncontrolling interests in Aimco OP | | | (1,869 | ) | | | (1,934 | ) |
Net income attributable to common noncontrolling interests in Aimco OP | | | (368 | ) | | | (15,137 | ) |
Net income attributable to noncontrolling interests | | | (2,255 | ) | | | (17,162 | ) |
Net income attributable to Aimco | | | 6,722 | | | | 274,133 | |
Net income attributable to Aimco preferred stockholders | | | — | | | | (2,148 | ) |
Net income attributable to participating securities | | | (43 | ) | | | (417 | ) |
Net income attributable to Aimco common stockholders | | $ | 6,679 | | | $ | 271,568 | |
Net income attributable to Aimco per common share – basic and diluted | | $ | 0.04 | | | $ | 1.88 | |
| | | | | | | | |
Weighted-average common shares outstanding – basic | | | 148,518 | | | | 144,232 | |
Weighted-average common shares outstanding – diluted | | | 148,786 | | | | 144,445 | |
11
Consolidated Balance Sheets
(in thousands) (unaudited)
| | March 31, | | | December 31, | |
| | 2020 | | | 2019 | |
Assets | | | | | | | | |
Real estate | | $ | 8,836,608 | | | $ | 8,737,591 | |
Accumulated depreciation | | | (2,810,949 | ) | | | (2,718,284 | ) |
Net real estate | | | 6,025,659 | | | | 6,019,307 | |
Cash and cash equivalents | | | 340,883 | | | | 142,902 | |
Restricted cash | | | 33,933 | | | | 34,800 | |
Mezzanine investment | | | 286,472 | | | | 280,258 | |
Goodwill | | | 37,808 | | | | 37,808 | |
Other assets | | | 323,490 | | | | 313,664 | |
Total Assets | | $ | 7,048,245 | | | $ | 6,828,739 | |
| | | | | | | | |
Liabilities and Equity | | | | | | | | |
Non-recourse property debt | | $ | 4,228,440 | | | $ | 4,251,339 | |
Debt issue costs | | | (19,753 | ) | | | (20,749 | ) |
Non-recourse property debt, net | | | 4,208,687 | | | | 4,230,590 | |
Revolving credit facility borrowings | | | 593,845 | | | | 275,000 | |
Accrued liabilities and other | | | 349,099 | | | | 360,574 | |
Total Liabilities | | | 5,151,631 | | | | 4,866,164 | |
| | | | | | | | |
Preferred noncontrolling interests in Aimco OP | | | 96,449 | | | | 97,064 | |
Redeemable noncontrolling interests in consolidated real estate partnership | | | 4,617 | | | | 4,716 | |
| | | | | | | | |
Equity: | | | | | | | | |
Class A Common Stock | | | 1,487 | | | | 1,489 | |
Additional paid-in capital | | | 3,488,611 | | | | 3,497,367 | |
Accumulated other comprehensive income | | | 4,139 | | | | 4,195 | |
Distributions in excess of earnings | | | (1,776,782 | ) | | | (1,722,402 | ) |
Total Aimco equity | | | 1,717,455 | | | | 1,780,649 | |
Noncontrolling interests in consolidated real estate partnerships | | | (3,409 | ) | | | (3,296 | ) |
Common noncontrolling interests in Aimco OP | | | 81,502 | | | | 83,442 | |
Total Equity | | | 1,795,548 | | | | 1,860,795 | |
Total Liabilities and Equity | | $ | 7,048,245 | | | $ | 6,828,739 | |
12
Supplemental Schedule 1
Funds From Operations and Adjusted Funds From Operations Reconciliation | |
Three Months Ended March 31, 2020 Compared to Three Months Ended March 31, 2019
(in thousands, except per share data) (unaudited)
Aimco believes that Economic Income (defined as Net Asset Value, or NAV, growth plus dividends) is an important measure of long-term financial performance. NAV is a non-GAAP measure and represents the estimated fair value of assets net of liabilities attributable to Aimco common stockholders. NAV is used by many investors because the value of company assets can be readily estimated, even for non-earning assets such as land or properties under development. NAV has the advantage of incorporating the investment decisions of thousands of real estate investors, enhancing comparability among companies that have differences in their accounting, and avoiding disparity that can result from application of GAAP to investment properties and various ownership structures. NAV also provides real estate investors a basis for the perceived quality and predictability of future cash flows as well as their expected growth. Some investors focus on multiples of AFFO and FFO. Aimco’s disclosure of AFFO and FFO complements its focus on Economic Income.
| | Three Months Ended March 31, | |
| | 2020 | | | 2019 | |
Net income attributable to Aimco common stockholders | | $ | 6,679 | | | $ | 271,568 | |
Adjustments: | | | | | | | | |
Real estate depreciation and amortization, net of noncontrolling partners’ interest | | | 97,792 | | | | 91,374 | |
Loss (gain) on dispositions and other, net of noncontrolling partners’ interest | | | 34 | | | | (291,473 | ) |
Income tax adjustments related to gain on dispositions and other tax-related items | | | 226 | | | | 6,526 | |
Common noncontrolling interests in Aimco OP’s share of above adjustments | | | (5,096 | ) | | | 10,249 | |
Amounts allocable to participating securities | | | (39 | ) | | | 316 | |
Nareit FFO attributable to Aimco common stockholders | | $ | 99,596 | | | $ | 88,560 | |
Adjustments, all net of common noncontrolling interests in Aimco OP and participating securities: | | | | | | | | |
Straight-line rent [1] | | | 635 | | | | 2,307 | |
Litigation, net [2] | | | — | | | | 25 | |
Pro forma FFO attributable to Aimco common stockholders | | $ | 100,231 | | | $ | 90,892 | |
Capital Replacements, net of common noncontrolling interests in Aimco OP and participating securities | | | (11,605 | ) | | | (9,711 | ) |
AFFO attributable to Aimco common stockholders | | $ | 88,626 | | | $ | 81,181 | |
| | | | | | | | |
Weighted average common shares outstanding – basic | | | 148,518 | | | | 144,232 | |
Dilutive common share equivalents | | | 268 | | | | 213 | |
Total shares and dilutive share equivalents used to calculate Net income and Nareit FFO per share | | | 148,786 | | | | 144,445 | |
Adjustment to weight reverse stock split [3] | | | — | | | | 3,888 | |
Pro forma shares and dilutive share equivalents used to calculate Pro forma FFO and AFFO per share | | | 148,786 | | | | 148,333 | |
| | | | | | | | |
Net income attributable to Aimco per common share – diluted | | $ | 0.04 | | | $ | 1.88 | |
Nareit FFO per share – diluted | | $ | 0.67 | | | $ | 0.61 | |
Pro forma FFO per share – diluted | | $ | 0.67 | | | $ | 0.61 | |
AFFO per share – diluted | | $ | 0.60 | | | $ | 0.55 | |
[1] | In 2018, Aimco assumed a 99-year ground lease with scheduled rent increases. Due to the terms of the lease, GAAP rent expense will exceed cash rent payments until 2076. Aimco includes the cash rent payments for this ground lease in Pro forma FFO but excludes the incremental straight-line non-cash rent expense. The rent expense for this lease is included in other expenses, net, on Aimco’s Consolidated Statements of Operations. |
[2] | During 2018, Aimco was engaged in litigation with Airbnb, which was resolved in December 2018. Due to the unpredictable nature of these proceedings, related amounts recognized are excluded from Pro forma FFO. These amounts are included in other expenses, net, on Aimco’s Consolidated Statements of Operations |
[3] | During the first quarter 2019, Aimco completed a reverse stock split and a special dividend paid primarily in stock. For stock splits, GAAP requires the restatement of weighted average shares as if the reverse stock split occurred at the beginning of the period presented; while shares issued in the special dividend are included in weighted average shares outstanding from the date issued. To minimize confusion and facilitate comparison of period-over-period Pro forma FFO and AFFO, Aimco calculated pro forma weighted average shares for 2019 based on the effective date of the reverse stock split and ex-dividend date for the shares issued in the special dividend, thereby eliminating the per share impact of the GAAP treatment to Aimco’s reported Pro forma FFO and AFFO. |
13
Supplemental Schedule 2(a)
Funds From Operations and Adjusted Funds From Operations Information | (Page 1 of 2) |
Three Months Ended March 31, 2020 Compared to Three Months Ended March 31, 2019
(consolidated amounts, in thousands) (unaudited)
| | Three Months Ended March 31, | |
| | 2020 | | | 2019 | |
Real estate operations [1] | | | | | | | | |
Revenues, before utility reimbursements | | | | | | | | |
Same Store | | $ | 188,279 | | | $ | 181,871 | |
Redevelopment/Development | | | 11,913 | | | | 14,077 | |
Acquisition | | | 884 | | | | — | |
Other Real Estate [2] | | | 18,459 | | | | 14,492 | |
Total revenues, before utility reimbursements | | | 219,535 | | | | 210,440 | |
Expenses, net of utility reimbursements | | | | | | | | |
Same Store | | | 48,853 | | | | 49,072 | |
Redevelopment/Development | | | 4,687 | | | | 5,278 | |
Acquisition | | | 401 | | | | 127 | |
Other Real Estate [2] | | | 6,373 | | | | 5,119 | |
Total expenses, net of utility reimbursements | | | 60,314 | | | | 59,596 | |
Property net operating income | | | 159,221 | | | | 150,844 | |
Property management expenses | | | (5,082 | ) | | | (5,145 | ) |
Casualties | | | (2,154 | ) | | | (2,136 | ) |
Other expenses, net [3] | | | (7,555 | ) | | | (3,699 | ) |
Interest expense on non-recourse property debt [4] | | | (38,583 | ) | | | (39,748 | ) |
Interest income | | | 2,171 | | | | 2,002 | |
NOI related to sold and held for sale communities [5] | | | (23 | ) | | | 7,713 | |
Total contribution from real estate operations | | | 107,995 | | | | 109,831 | |
| | | | | | | | |
General and administrative expenses | | | (10,108 | ) | | | (9,829 | ) |
Investment management expenses | | | (1,184 | ) | | | (1,332 | ) |
Depreciation and amortization related to non-real estate assets | | | (2,344 | ) | | | (2,081 | ) |
Mezzanine investment income, net | | | 6,747 | | | | — | |
Other income (expenses), net | | | 5,374 | | | | (897 | ) |
Interest expense on corporate borrowings | | | (2,753 | ) | | | (1,661 | ) |
Tax benefit, net | | | 3,459 | | | | 3,545 | |
Preferred dividends and distributions and related redemption costs | | | (1,869 | ) | | | (4,082 | ) |
Common noncontrolling interests in Aimco OP | | | (5,464 | ) | | | (4,888 | ) |
Proportionate adjustments | | | (257 | ) | | | (46 | ) |
Nareit FFO attributable to Aimco common stockholders | | $ | 99,596 | | | $ | 88,560 | |
Total pro forma adjustments, net of common noncontrolling interests in Aimco OP and participating securities [6] | | | 635 | | | | 2,332 | |
Pro forma FFO attributable to Aimco common stockholders | | $ | 100,231 | | | $ | 90,892 | |
Capital Replacements, net of common noncontrolling interests in Aimco OP and participating securities [7] | | | (11,605 | ) | | | (9,711 | ) |
AFFO attributable to Aimco common stockholders | | $ | 88,626 | | | $ | 81,181 | |
Please see the following page for footnote descriptions
14
Supplemental Schedule 2(a) (continued)
Funds From Operations and Adjusted Funds From Operations Information | (Page 2 of 2) |
[1] | Contribution from real estate operations consists of property net operating income and other items of income or expense that relate to Aimco’s portfolio, including property management expenses, casualty losses, interest expense related to non-recourse property debt encumbering the communities in this portfolio, and interest income Aimco earns on its investment in a securitization trust that holds certain Aimco property debt. |
[2] | Other Real Estate consists of communities subject to limitations on rent increases, communities that Aimco expects to sell within 12 months that do not meet the criteria to be classified as held for sale, unstabilized communities, and certain commercial spaces. For the three months ended March 31, 2020, Other Real Estate revenues and expenses are also inclusive of the operating results of 1001 Brickell Bay Drive, acquired July 2019. |
[3] | Other expenses, net, in contribution from real estate operations includes the write-off of $2.9 million of Aimco’s straight-line rent receivables for certain commercial tenants for which collectability of future rental revenue is uncertain. In accordance with GAAP, this write-off is included in rental and other property revenues in the consolidated statements of operations. |
[4] | There was no interest expense related to sold properties for the three months ended March 31, 2020. Interest expense for the three months ended March 31, 2019, contained $0.6 million of interest expense related to sold properties. |
[5] | No apartment communities were sold or held for sale during the three months ended March 31, 2020. |
[6] | Pro forma adjustments are comprised of the detailed adjustments presented in Supplemental Schedule 1. |
[7] | Please refer to the Glossary for a reconciliation of the Capital Replacement spending used to compute AFFO to Capital Replacement spending per Supplemental Schedule 9. |
15
Supplemental Schedule 2(b)
Partially Owned Entities
Three Months Ended March 31, 2020 Compared to Three Months Ended March 31, 2019
(Proportionate amounts, in thousands) (unaudited)
| | Noncontrolling Interests [1] | | | Unconsolidated [2] | |
| | Three Months Ended March 31, | | | Three Months Ended March 31, | |
| | 2020 | | | 2019 | | | 2020 | | | 2019 | |
Revenues, before utility reimbursements | | $ | 907 | | | $ | 792 | | | $ | 589 | | | $ | 595 | |
| | | | | | | | | | | | | | | | |
Expenses, net of utility reimbursements | | | 269 | | | | 233 | | | | 178 | | | | 112 | |
| | | | | | | | | | | | | | | | |
Net operating income | | | 638 | | | | 559 | | | | 411 | | | | 483 | |
| | | | | | | | | | | | | | | | |
Property management expenses, net | | | (33 | ) | | | (34 | ) | | | (18 | ) | | | (18 | ) |
| | | | | | | | | | | | | | | | |
Casualties | | | (2 | ) | | | 3 | | | | — | | | | — | |
| | | | | | | | | | | | | | | | |
Other expense, net | | | (12 | ) | | | (3 | ) | | | — | | | | — | |
| | | | | | | | | | | | | | | | |
Interest expense on non-recourse property debt | | | (142 | ) | | | (171 | ) | | | (74 | ) | | | (78 | ) |
| | | | | | | | | | | | | | | | |
Contribution from real estate operations | | | 449 | | | | 354 | | | | 319 | | | | 387 | |
| | | | | | | | | | | | | | | | |
Other non-property income (expenses), net | | | 46 | | | | (22 | ) | | | — | | | | — | |
| | | | | | | | | | | | | | | | |
FFO from real estate operations | | $ | 495 | | | $ | 332 | | | $ | 319 | | | $ | 387 | |
| | | | | | | | | | | | | | | | |
| | | | | | | | | | | | | | | | |
At March 31, 2020: | | | | | | | | | | | | | | | | |
Total apartment communities | | 6 | | | 4 | |
Total apartment homes | | 2,056 | | | 142 | |
Noncontrolling interests’ share of consolidated apartment homes/Aimco share of unconsolidated apartment homes | | 171 | | | 72 | |
[1] | Amounts represent the noncontrolling interests’ proportionate share of consolidated amounts. FFO from real estate operations includes the noncontrolling interests’ share of operating results at 1001 Brickell Bay Drive, which is excluded from apartment community and home counts. |
[2] | Amounts represent Aimco’s proportionate share of the unconsolidated real estate partnerships’ operations. |

| 16 |
Supplemental Schedule 3
Property Net Operating Income
Trailing Five Quarters
(consolidated amounts, in thousands) (unaudited)
| | Three Months Ended | |
| | March 31, 2020 | | | December 31, 2019 | | | September 30, 2019 | | | June 30, 2019 | | | March 31, 2019 | |
Revenues, before utility reimbursements | | | | | | | | | | | | | | | | | | | | |
| | | | | | | | | | | | | | | | | | | | |
Same Store | | $ | 188,279 | | | $ | 187,467 | | | $ | 187,153 | | | $ | 184,318 | | | $ | 181,871 | |
| | | | | | | | | | | | | | | | | | | | |
Redevelopment/Development | | | 11,913 | | | | 11,367 | | | | 11,131 | | | | 12,750 | | | | 14,077 | |
| | | | | | | | | | | | | | | | | | | | |
Acquisition | | | 884 | | | | 730 | | | | 436 | | | | 99 | | | | — | |
| | | | | | | | | | | | | | | | | | | | |
Other Real Estate [1] | | | 18,459 | | | | 18,329 | | | | 18,806 | | | | 14,386 | | | | 14,492 | |
| | | | | | | | | | | | | | | | | | | | |
Total revenues, before utility reimbursements | | | 219,535 | | | | 217,893 | | | | 217,526 | | | | 211,553 | | | | 210,440 | |
| | | | | | | | | | | | | | | | | | | | |
Expenses, net of utility reimbursements | | | | | | | | | | | | | | | | | | | | |
| | | | | | | | | | | | | | | | | | | | |
Same Store | | | 48,853 | | | | 47,291 | | | | 51,341 | | | | 49,310 | | | | 49,072 | |
| | | | | | | | | | | | | | | | | | | | |
Redevelopment/Development | | | 4,687 | | | | 4,248 | | | | 4,476 | | | | 5,010 | | | | 5,278 | |
| | | | | | | | | | | | | | | | | | | | |
Acquisition | | | 401 | | | | 43 | | | | 453 | | | | 383 | | | | 127 | |
| | | | | | | | | | | | | | | | | | | | |
Other Real Estate [1] | | | 6,373 | | | | 6,214 | | | | 6,636 | | | | 5,210 | | | | 5,119 | |
| | | | | | | | | | | | | | | | | | | | |
Total expenses, net of utility reimbursements | | | 60,314 | | | | 57,796 | | | | 62,906 | | | | 59,913 | | | | 59,596 | |
| | | | | | | | | | | | | | | | | | | | |
Property Net Operating Income | | | | | | | | | | | | | | | | | | | | |
| | | | | | | | | | | | | | | | | | | | |
Same Store | | | 139,426 | | | | 140,176 | | | | 135,812 | | | | 135,008 | | | | 132,799 | |
| | | | | | | | | | | | | | | | | | | | |
Redevelopment/Development | | | 7,226 | | | | 7,119 | | | | 6,655 | | | | 7,740 | | | | 8,799 | |
| | | | | | | | | | | | | | | | | | | | |
Acquisition | | | 483 | | | | 687 | | | | (17 | ) | | | (284 | ) | | | (127 | ) |
| | | | | | | | | | | | | | | | | | | | |
Other Real Estate [1] | | | 12,086 | | | | 12,115 | | | | 12,170 | | | | 9,176 | | | | 9,373 | |
| | | | | | | | | | | | | | | | | | | | |
Total Property Net Operating Income | | $ | 159,221 | | | $ | 160,097 | | | $ | 154,620 | | | $ | 151,640 | | | $ | 150,844 | |
| | | | | | | | | | | | | | | | | | | | |
Sold Property Net Operating Income [2] | | $ | (23 | ) | | $ | 2,561 | | | $ | 2,933 | | | $ | 3,376 | | | $ | 7,713 | |
[1] | Other Real Estate consists of communities subject to limitations on rent increases, communities that Aimco expects to sell within 12 months that do not meet the criteria to be classified as held for sale, unstabilized communities, and certain commercial spaces. Other Real Estate revenues and expenses are also inclusive of the operating results of 1001 Brickell Bay Drive since its acquisition in July 2019. |
[2] | No apartment communities were sold or held for sale during the three months ended March 31, 2020. |
| 17 |
Supplemental Schedule 4
Apartment Home Summary
As of March 31, 2020
(unaudited)
| | Number of Apartment Communities | | | Number of Apartment Homes | | | Aimco Share of Apartment Homes | |
Consolidated | | | | | | | | | | | | |
Same Store [1] | | | 95 | | | | 28,095 | | | | 28,033 | |
Redevelopment/Development | | | 6 | | | | 2,210 | | | | 2,210 | |
Acquisition | | | 1 | | | | 110 | | | | 110 | |
Other Real Estate | | | 18 | | | | 2,289 | | | | 2,180 | |
Total Consolidated | | | 120 | | | | 32,704 | | | | 32,533 | |
Unconsolidated | | | 4 | | | | 142 | | | | 72 | |
Total Portfolio | | | 124 | | | | 32,846 | | | | 32,605 | |
[1] | From December 31, 2020, to March 31, 2020, on a net basis, Aimco’s Same Store portfolio increased by four apartment communities and 1,446 apartment homes. These changes consisted of: |
| • | the addition of one redeveloped apartment community with 940 apartment homes that was classified as Same Store upon maintaining stabilized operations for the entirety of the periods presented; |
| • | the addition of six acquired apartment communities with 1,480 apartment homes that were classified as Same Store because Aimco has now owned them for the entirety of the periods presented; and |
| • | the reduction of three apartment communities with 974 apartment homes that Aimco has classified in Other Real Estate, as it is planning to redevelop these communities. |
| 18 |
Supplemental Schedule 5(a)
Capitalization and Financial Metrics
As of March 31, 2020
(dollars in thousands) (unaudited)
Leverage Balances and Characteristics
Debt | | Consolidated | | | Aimco Share of Unconsolidated Partnerships | | | Noncontrolling Interests | | | Total Aimco Share | | | Weighted Average Maturity (Years) | | | Weighted Average Stated Interest Rate | |
Fixed rate loans payable | | $ | 4,058,323 | | | $ | 6,219 | | | $ | (13,950 | ) | | $ | 4,050,592 | | | | 7.4 | | | | 3.93 | % |
Floating rate loans payable | | | 155,612 | | | | — | | | | — | | | | 155,612 | | | | 3.7 | | | | 2.80 | % |
Floating rate tax-exempt bonds | | | 14,505 | | | | — | | | | (1 | ) | | | 14,504 | | | | 13.3 | | | | 2.71 | % |
Total non-recourse property debt | | $ | 4,228,440 | | | $ | 6,219 | | | $ | (13,951 | ) | | $ | 4,220,708 | | | | 7.3 | | | | 3.88 | % |
| | | | | | | | | | | | | | | | | | | | | | | | |
Revolving credit facility borrowings | | | 593,845 | | | | — | | | | — | | | | 593,845 | | | | 1.8 | | | | 2.27 | % |
Preferred OP Units | | | 96,449 | | | | — | | | | — | | | | 96,449 | | | | 10.0 | | [1] | | 7.71 | % |
Redeemable noncontrolling interests in real estate partnership | | | 4,617 | | | | — | | | | — | | | | 4,617 | | | | 2.5 | | [2] | | — | % |
Total Leverage | | $ | 4,923,351 | | | $ | 6,219 | | | $ | (13,951 | ) | | $ | 4,915,619 | | | | 6.7 | | | | 3.76 | % |
| | | | | | | | | | | | | | | | | | | | | | | | |
Cash and restricted cash [3] | | | (360,384 | ) | | | — | | | | 1,071 | | | | (359,313 | ) | | | | | | | | |
Securitization trust assets [4] | | | (95,906 | ) | | | — | | | | — | | | | (95,906 | ) | | | | | | | | |
Net Leverage | | $ | 4,467,061 | | | $ | 6,219 | | | $ | (12,880 | ) | | $ | 4,460,400 | | | | | | | | | |
Leverage Ratios First Quarter 2020 [5]
Proportionate Debt to Adjusted EBITDAre | | 7.5x |
Net Leverage to Adjusted EBITDAre | | 7.7x |
Adjusted EBITDAre to Adjusted Interest Expense | | 3.7x |
Adjusted EBITDAre to Adjusted Interest Expense and Preferred Distributions | | 3.6x |
| | Amount | | Covenant |
Fixed Charge Coverage Ratio | | 2.08x | | 1.40x |
Credit Ratings
Standard and Poor’s | | Corporate Credit Rating | | BBB- (stable) |
Fitch Ratings | | Issuer Default Rating | | BBB- (stable) |
[1] | Aimco’s Preferred OP Units are redeemable at the holder’s option. Aimco has computed the weighted-average maturity of its total leverage assuming a 10-year maturity for its Preferred OP Units. |
[2] | Redeemable noncontrolling interests in a real estate partnership relate to the 5% ownership in 1001 Brickell Bay Drive held by an outside partner with a put option that allows the holder, at his option, to redeem his interest for cash after a three-year period. The term to maturity reflects the time remaining until the put option expires. |
[3] | Restricted cash on the balance sheet includes tenant security deposits which are excluded for purposes of calculating Aimco’s net leverage. |
[4] | In 2011, $673.8 million of Aimco’s loans payable were securitized in a trust holding only these loans. Aimco purchased the subordinate positions in the trust that holds these loans for $51.5 million. These investments have a face value of $100.9 million and a carrying amount of $95.9 million and are included in other assets on Aimco’s Consolidated Balance Sheet at March 31, 2020. The amount of these investments effectively reduces Aimco’s leverage. |
[5] | Aimco calculates Adjusted EBITDAre and Adjusted Interest Expense used in its leverage ratios based on current quarter amounts, annualized. |
| 19 |
Supplemental Schedule 5(b)
Capitalization and Financial Metrics
As of March 31, 2020
(share, unit and dollar amounts in thousands) (unaudited)
Aimco Share Non-Recourse Property Debt
| | Amortization | | | Maturities | | | Total | | | Maturities as a Percent of Total | | | Average Rate on Maturing Debt | |
2020 2Q | | $ | 22,820 | | | $ | — | | | $ | 22,820 | | | | — | % | | | — | % |
2020 3Q | | | 23,207 | | | | — | | | | 23,207 | | | | — | % | | | — | % |
2020 4Q | | | 23,402 | | | | 78,930 | | | | 102,332 | | | | 1.92 | % | | | 3.88 | % |
Total 2020 | | | 69,429 | | | | 78,930 | | | | 148,359 | | | | 1.92 | % | | | 3.88 | % |
| | | | | | | | | | | | | | | | | | | | |
2021 Q1 | | | 22,105 | | | | 212,756 | | | | 234,861 | | | | 5.16 | % | | | 5.41 | % |
2021 Q2 | | | 21,299 | | | | 232,184 | | | | 253,483 | | | | 5.64 | % | | | 5.20 | % |
2021 Q3 | | | 20,053 | | | | 23,875 | | | | 43,928 | | | | 0.58 | % | | | 4.93 | % |
2021 Q4 | | | 20,067 | | | | 23,908 | | | | 43,975 | | | | 0.58 | % | | | 4.47 | % |
Total 2021 | | | 83,524 | | | | 492,723 | | [1] | | 576,247 | | | | 11.96 | % | | | 5.24 | % |
| | | | | | | | | | | | | | | | | | | | |
2022 | | | 79,075 | | | | 260,671 | | | | 339,746 | | | | 6.33 | % | | | 4.65 | % |
2023 | | | 71,516 | | | | 249,251 | | | | 320,767 | | | | 6.05 | % | | | 4.05 | % |
2024 | | | 67,758 | | | | 285,517 | | | | 353,275 | | | | 6.93 | % | | | 3.16 | % |
2025 | | | 62,586 | | | | 241,963 | | | | 304,549 | | | | 5.87 | % | | | 3.67 | % |
2026 | | | 54,020 | | | | 294,253 | | | | 348,273 | | | | 7.14 | % | | | 3.52 | % |
2027 | | | 44,163 | | | | 292,036 | | | | 336,199 | �� | | | 7.09 | % | | | 3.53 | % |
2028 | | | 36,275 | | | | 305,576 | | | | 341,851 | | | | 7.42 | % | | | 3.73 | % |
2029 | | | 25,044 | | | | 297,153 | | | | 322,197 | | | | 7.21 | % | | | 4.25 | % |
Thereafter | | | 173,220 | | | | 555,173 | | | | 728,393 | | | | 13.48 | % | | | 3.30 | % |
Total | | $ | 766,610 | | | $ | 3,353,246 | | | $ | 4,119,856 | | | | | | | | | |
Securitization Trust Assets | | | | | | | | 100,852 | | [1] | | | | | | | |
Aimco share non-recourse property debt | | | $ | 4,220,708 | | | | | | | | | |
Preferred OP Units
| | Units Outstanding as of March 31, 2020 | | | Coupon | | | Amount | |
Preferred OP Units | | | 3,619 | | | | 7.71 | % | | $ | 96,449 | |
Common Stock, Partnership Units and Equivalents
| | March 31, 2020 | |
Class A Common Stock outstanding | | | 148,373 | |
Participating unvested restricted stock | | | 105 | |
Dilutive options, share equivalents and non-participating unvested restricted stock | | | 64 | |
Total shares and dilutive share equivalents | | | 148,542 | |
Common Partnership Units and equivalents outstanding | | | 8,136 | |
Total shares, units and dilutive share equivalents | | | 156,678 | |
[1] | The securitized property loans mature in 2021 and will repay Aimco’s subordinate positions in the securitization trust, which reduces Aimco’s 2021 refunding requirements from $593.6 million to $492.7 million. |
| 20 |

Supplemental Schedule 6(a)
Same Store Operating Results
Three Months Ended March 31, 2020 Compared to Three Months Ended March 31, 2019
(proportionate amounts, in thousands, except community, home, and per home data) (unaudited)
| | | | | | | | | | | Revenues, Before Utility Reimbursements [1] | | | Expenses, Net of Utility Reimbursements | | | Net Operating Income | | | | Net Operating Income Margin | | | Average Daily Occupancy During Period | | | Average Revenue per Aimco Apartment Home | |
| Apartment Communities | | Apartment Homes | | Aimco Share of Apartment Homes | | | 1Q 2020 | | 1Q 2019 | | Growth | | | 1Q 2020 | | 1Q 2019 | | Growth | | | 1Q 2020 | | 1Q 2019 | | Growth | | | | 1Q 2020 | | | 1Q 2020 | | 1Q 2019 | | | 1Q 2020 | | 1Q 2019 | |
| | | | | | | | | | | | | | | | | | | | | | | | | | | | | | | | | | | | | | | | | | | | | | | | | | | | | | | | | | |
Atlanta | | 2 | | | 333 | | | 333 | | | $ | 1,469 | | $ | 1,387 | | | 5.9 | % | | $ | 537 | | $ | 485 | | | 10.7 | % | | $ | 932 | | $ | 902 | | | 3.3 | % | | | 63.4% | | | 96.4% | | 96.6% | | | $ | 1,526 | | $ | 1,437 | |
| | | | | | | | | | | | | | | | | | | | | | | | | | | | | | | | | | | | | | | | | | | | | | | | | | | | | | | | | | |
Bay Area | | 10 | | | 2,355 | | | 2,355 | | | | 22,309 | | | 21,640 | | | 3.1 | % | | | 5,052 | | | 4,970 | | | 1.6 | % | | | 17,257 | | | 16,670 | | | 3.5 | % | | | 77.4% | | | 97.2% | | 97.5% | | | | 3,249 | | | 3,140 | |
| | | | | | | | | | | | | | | | | | | | | | | | | | | | | | | | | | | | | | | | | | | | | | | | | | | | | | | | | | |
Boston | | 15 | | | 4,689 | | | 4,689 | | | | 28,654 | | | 27,123 | | | 5.6 | % | | | 8,539 | | | 8,783 | | | (2.8 | %) | | | 20,115 | | | 18,340 | | | 9.7 | % | | | 70.2% | | | 98.5% | | 96.8% | | | | 2,069 | | | 1,992 | |
| | | | | | | | | | | | | | | | | | | | | | | | | | | | | | | | | | | | | | | | | | | | | | | | | | | | | | | | | | |
Chicago | | 7 | | | 1,671 | | | 1,671 | | | | 9,205 | | | 9,165 | | | 0.4 | % | | | 2,937 | | | 2,697 | | | 8.9 | % | | | 6,268 | | | 6,468 | | | (3.1 | %) | | | 68.1% | | | 97.2% | | 96.7% | | | | 1,889 | | | 1,892 | |
| | | | | | | | | | | | | | | | | | | | | | | | | | | | | | | | | | | | | | | | | | | | | | | | | | | | | | | | | | |
Denver | | 7 | | | 1,925 | | | 1,886 | | | | 9,364 | | | 8,911 | | | 5.1 | % | | | 2,284 | | | 2,590 | | | (11.8 | %) | | | 7,080 | | | 6,321 | | | 12.0 | % | | | 75.6% | | | 96.9% | | 96.6% | | | | 1,707 | | | 1,630 | |
| | | | | | | | | | | | | | | | | | | | | | | | | | | | | | | | | | | | | | | | | | | | | | | | | | | | | | | | | | |
Greater New York | | 8 | | | 453 | | | 453 | | | | 4,192 | | | 4,072 | | | 2.9 | % | | | 1,395 | | | 1,400 | | | (0.4 | %) | | | 2,797 | | | 2,672 | | | 4.7 | % | | | 66.7% | | | 98.4% | | 96.9% | | | | 3,135 | | | 3,093 | |
| | | | | | | | | | | | | | | | | | | | | | | | | | | | | | | | | | | | | | | | | | | | | | | | | | | | | | | | | | |
Greater Washington, DC | | 11 | | | 5,298 | | | 5,276 | | | | 25,763 | | | 24,974 | | | 3.2 | % | | | 6,798 | | | 6,692 | | | 1.6 | % | | | 18,965 | | | 18,282 | | | 3.7 | % | | | 73.6% | | | 98.2% | | 97.6% | | | | 1,658 | | | 1,618 | |
| | | | | | | | | | | | | | | | | | | | | | | | | | | | | | | | | | | | | | | | | | | | | | | | | | | | | | | | | | |
Los Angeles | | 12 | | | 4,097 | | | 4,096 | | | | 36,874 | | | 36,118 | | | 2.1 | % | | | 7,804 | | | 7,905 | | | (1.3 | %) | | | 29,070 | | | 28,213 | | | 3.0 | % | | | 78.8% | | | 97.0% | | 97.1% | | | | 3,094 | | | 3,027 | |
| | | | | | | | | | | | | | | | | | | | | | | | | | | | | | | | | | | | | | | | | | | | | | | | | | | | | | | | | | |
Miami | | 3 | | | 873 | | | 873 | | | | 5,863 | | | 5,706 | | | 2.8 | % | | | 1,588 | | | 1,421 | | | 11.8 | % | | | 4,275 | | | 4,285 | | | (0.2 | %) | | | 72.9% | | | 97.3% | | 97.3% | | | | 2,300 | | | 2,239 | |
| | | | | | | | | | | | | | | | | | | | | | | | | | | | | | | | | | | | | | | | | | | | | | | | | | | | | | | | | | |
Philadelphia | | 7 | | | 2,323 | | | 2,323 | | | | 19,070 | | | 18,079 | | | 5.5 | % | | | 4,829 | | | 5,188 | | | (6.9 | %) | | | 14,241 | | | 12,891 | | | 10.5 | % | | | 74.7% | | | 98.1% | | 96.5% | | | | 2,790 | | | 2,689 | |
| | | | | | | | | | | | | | | | | | | | | | | | | | | | | | | | | | | | | | | | | | | | | | | | | | | | | | | | | | |
San Diego | | 6 | | | 1,585 | | | 1,585 | | | | 9,515 | | | 9,207 | | | 3.3 | % | | | 1,897 | | | 1,935 | | | (2.0 | %) | | | 7,618 | | | 7,272 | | | 4.8 | % | | | 80.1% | | | 97.0% | | 96.5% | | | | 2,062 | | | 2,007 | |
| | | | | | | | | | | | | | | | | | | | | | | | | | | | | | | | | | | | | | | | | | | | | | | | | | | | | | | | | | |
Seattle | | 2 | | | 239 | | | 239 | | | | 1,694 | | | 1,597 | | | 6.1 | % | | | 545 | | | 459 | | | 18.7 | % | | | 1,149 | | | 1,138 | | | 1.0 | % | | | 67.8% | | | 97.5% | | 96.2% | | | | 2,424 | | | 2,316 | |
| | | | | | | | | | | | | | | | | | | | | | | | | | | | | | | | | | | | | | | | | | | | | | | | | | | | | | | | | | |
Other Markets | | 5 | | | 2,254 | | | 2,254 | | | | 13,984 | | | 13,583 | | | 3.0 | % | | | 4,578 | | | 4,473 | | | 2.3 | % | | | 9,406 | | | 9,110 | | | 3.2 | % | | | 67.3% | | | 97.1% | | 96.5% | | | | 2,129 | | | 2,082 | |
| | | | | | | | | | | | | | | | | | | | | | | | | | | | | | | | | | | | | | | | | | | | | | | | | | | | | | | | | | |
Total | | 95 | | | 28,095 | | | 28,033 | | | $ | 187,956 | | $ | 181,562 | | | 3.5 | % | | $ | 48,783 | | $ | 48,998 | | | (0.4 | %) | | $ | 139,173 | | $ | 132,564 | | | 5.0 | % | | | 74.0% | | | 97.6% | | 97.0% | | | $ | 2,289 | | $ | 2,227 | |
[1] | Revenue, before utility reimbursements, is comprised 98% of residential rents and 2% from commercial tenants. |
| 21 |
Supplemental Schedule 6(b)
Same Store Operating Results
Three Months Ended March 31, 2020 Compared to Three Months Ended December 31, 2019
(proportionate amounts, in thousands, except community, home, and per home data) (unaudited)
| | | | | | | | | | | Revenues, Before Utility Reimbursements [1] | | | Expenses, Net of Utility Reimbursements | | | Net Operating Income | | | | Net Operating Income Margin | | | Average Daily Occupancy During Period | | | Average Revenue per Aimco Apartment Home | |
| Apartment Communities | | Apartment Homes | | Aimco Share of Apartment Homes | | | 1Q 2020 | | 4Q 2019 | | Growth | | | 1Q 2020 | | 4Q 2019 | | Growth | | | 1Q 2020 | | 4Q 2019 | | Growth | | | | 1Q 2020 | | | 1Q 2020 | | 4Q 2019 | | | 1Q 2020 | | 4Q 2019 | |
| | | | | | | | | | | | | | | | | | | | | | | | | | | | | | | | | | | | | | | | | | | | | | | | | | | | | | | | | | |
Atlanta | | 2 | | | 333 | | | 333 | | | $ | 1,469 | | $ | 1,420 | | | 3.5 | % | | $ | 537 | | $ | 529 | | | 1.5 | % | | $ | 932 | | $ | 891 | | | 4.6 | % | | | 63.4% | | | 96.4% | | 94.9% | | | $ | 1,526 | | $ | 1,498 | |
| | | | | | | | | | | | | | | | | | | | | | | | | | | | | | | | | | | | | | | | | | | | | | | | | | | | | | | | | | |
Bay Area | | 10 | | | 2,355 | | | 2,355 | | | | 22,309 | | | 22,035 | | | 1.2 | % | | | 5,052 | | | 5,110 | | | (1.1 | %) | | | 17,257 | | | 16,925 | | | 2.0 | % | | | 77.4% | | | 97.2% | | 96.5% | | | | 3,249 | | | 3,234 | |
| | | | | | | | | | | | | | | | | | | | | | | | | | | | | | | | | | | | | | | | | | | | | | | | | | | | | | | | | | |
Boston | | 15 | | | 4,689 | | | 4,689 | | | | 28,654 | | | 28,465 | | | 0.7 | % | | | 8,539 | | | 8,053 | | | 6.0 | % | | | 20,115 | | | 20,412 | | | (1.5 | %) | | | 70.2% | | | 98.5% | | 97.9% | | | | 2,069 | | | 2,067 | |
| | | | | | | | | | | | | | | | | | | | | | | | | | | | | | | | | | | | | | | | | | | | | | | | | | | | | | | | | | |
Chicago | | 7 | | | 1,671 | | | 1,671 | | | | 9,205 | | | 9,184 | | | 0.2 | % | | | 2,937 | | | 2,898 | | | 1.3 | % | | | 6,268 | | | 6,286 | | | (0.3 | %) | | | 68.1% | | | 97.2% | | 97.1% | | | | 1,889 | | | 1,887 | |
| | | | | | | | | | | | | | | | | | | | | | | | | | | | | | | | | | | | | | | | | | | | | | | | | | | | | | | | | | |
Denver | | 7 | | | 1,925 | | | 1,886 | | | | 9,364 | | | 9,399 | | | (0.4 | %) | | | 2,284 | | | 2,284 | | | — | % | | | 7,080 | | | 7,115 | | | (0.5 | %) | | | 75.6% | | | 96.9% | | 97.5% | | | | 1,707 | | | 1,704 | |
| | | | | | | | | | | | | | | | | | | | | | | | | | | | | | | | | | | | | | | | | | | | | | | | | | | | | | | | | | |
Greater New York | | 8 | | | 453 | | | 453 | | | | 4,192 | | | 4,128 | | | 1.6 | % | | | 1,395 | | | 1,370 | | | 1.8 | % | | | 2,797 | | | 2,758 | | | 1.4 | % | | | 66.7% | | | 98.4% | | 97.7% | | | | 3,135 | | | 3,108 | |
| | | | | | | | | | | | | | | | | | | | | | | | | | | | | | | | | | | | | | | | | | | | | | | | | | | | | | | | | | |
Greater Washington, DC | | 11 | | | 5,298 | | | 5,276 | | | | 25,763 | | | 25,722 | | | 0.2 | % | | | 6,798 | | | 6,384 | | | 6.5 | % | | | 18,965 | | | 19,338 | | | (1.9 | %) | | | 73.6% | | | 98.2% | | 97.8% | | | | 1,658 | | | 1,661 | |
| | | | | | | | | | | | | | | | | | | | | | | | | | | | | | | | | | | | | | | | | | | | | | | | | | | | | | | | | | |
Los Angeles | | 12 | | | 4,097 | | | 4,096 | | | | 36,874 | | | 36,798 | | | 0.2 | % | | | 7,804 | | | 7,506 | | | 4.0 | % | | | 29,070 | | | 29,292 | | | (0.8 | %) | | | 78.8% | | | 97.0% | | 96.9% | | | | 3,094 | | | 3,090 | |
| | | | | | | | | | | | | | | | | | | | | | | | | | | | | | | | | | | | | | | | | | | | | | | | | | | | | | | | | | |
Miami | | 3 | | | 873 | | | 873 | | | | 5,863 | | | 5,796 | | | 1.2 | % | | | 1,588 | | | 1,429 | | | 11.1 | % | | | 4,275 | | | 4,367 | | | (2.1 | %) | | | 72.9% | | | 97.3% | | 97.1% | | | | 2,300 | | | 2,279 | |
| | | | | | | | | | | | | | | | | | | | | | | | | | | | | | | | | | | | | | | | | | | | | | | | | | | | | | | | | | |
Philadelphia | | 7 | | | 2,323 | | | 2,323 | | | | 19,070 | | | 19,030 | | | 0.2 | % | | | 4,829 | | | 4,841 | | | (0.2 | %) | | | 14,241 | | | 14,189 | | | 0.4 | % | | | 74.7% | | | 98.1% | | 97.6% | | | | 2,790 | | | 2,797 | |
| | | | | | | | | | | | | | | | | | | | | | | | | | | | | | | | | | | | | | | | | | | | | | | | | | | | | | | | | | |
San Diego | | 6 | | | 1,585 | | | 1,585 | | | | 9,515 | | | 9,500 | | | 0.2 | % | | | 1,897 | | | 1,967 | | | (3.6 | %) | | | 7,618 | | | 7,533 | | | 1.1 | % | | | 80.1% | | | 97.0% | | 97.9% | | | | 2,062 | | | 2,041 | |
| | | | | | | | | | | | | | | | | | | | | | | | | | | | | | | | | | | | | | | | | | | | | | | | | | | | | | | | | | |
Seattle | | 2 | | | 239 | | | 239 | | | | 1,694 | | | 1,607 | | | 5.4 | % | | | 545 | | | 433 | | | 25.9 | % | | | 1,149 | | | 1,174 | | | (2.1 | %) | | | 67.8% | | | 97.5% | | 96.3% | | | | 2,424 | | | 2,328 | |
| | | | | | | | | | | | | | | | | | | | | | | | | | | | | | | | | | | | | | | | | | | | | | | | | | | | | | | | | | |
Other Markets | | 5 | | | 2,254 | | | 2,254 | | | | 13,984 | | | 14,062 | | | (0.6 | %) | | | 4,578 | | | 4,416 | | | 3.7 | % | | | 9,406 | | | 9,646 | | | (2.5 | %) | | | 67.3% | | | 97.1% | | 97.6% | | | | 2,129 | | | 2,132 | |
| | | | | | | | | | | | | | | | | | | | | | | | | | | | | | | | | | | | | | | | | | | | | | | | | | | | | | | | | | |
Total | | 95 | | | 28,095 | | | 28,033 | | | $ | 187,956 | | $ | 187,146 | | | 0.4 | % | | $ | 48,783 | | $ | 47,220 | | | 3.3 | % | | $ | 139,173 | | $ | 139,926 | | | (0.5 | %) | | | 74.0% | | | 97.6% | | 97.4% | | | $ | 2,289 | | $ | 2,284 | |
[1] | Revenue, before utility reimbursements, is comprised 98% of residential rents and 2% from commercial tenants. |
| 22 |
Supplemental Schedule 6(c)
Same Store Operating Expense Detail
(proportionate amounts, in thousands) (unaudited)
Quarterly Comparison
| | 1Q 2020 | | | % of Total | | | 1Q 2019 | | | $ Change | | | % Change | |
Operating expenses [1] | | $ | 22,369 | | | | 45.9 | % | | $ | 23,173 | | | $ | (804 | ) | | | (3.5 | %) |
Utility expense, net of reimbursement | | | 3,355 | | | | 6.9 | % | | | 3,682 | | | | (327 | ) | | | (8.9 | %) |
Real estate taxes | | | 20,405 | | | | 41.8 | % | | | 20,021 | | | | 384 | | | | 1.9 | % |
Insurance | | | 2,654 | | | | 5.4 | % | | | 2,122 | | | | 532 | | | | 25.1 | % |
Total | | $ | 48,783 | | | | 100.0 | % | | $ | 48,998 | | | $ | (215 | ) | | | (0.4 | %) |
Sequential Comparison
| | 1Q 2020 | | | % of Total | | | 4Q 2019 | | | $ Change | | | % Change | |
Operating expenses [1] | | $ | 22,369 | | | | 45.9 | % | | $ | 22,015 | | | $ | 354 | | | | 1.6 | % |
Utility expense, net of reimbursement | | | 3,355 | | | | 6.9 | % | | | 2,849 | | | | 506 | | | | 17.8 | % |
Real estate taxes | | | 20,405 | | | | 41.8 | % | | | 19,938 | | | | 467 | | | | 2.3 | % |
Insurance | | | 2,654 | | | | 5.4 | % | | | 2,418 | | | | 236 | | | | 9.8 | % |
Total | | $ | 48,783 | | | | 100.0 | % | | $ | 47,220 | | | $ | 1,563 | | | | 3.3 | % |
[1] | Includes onsite payroll, repairs and maintenance, software and technology expenses, marketing, expensed turnover costs, and other property related operating expenses. |
| 23 |
Supplemental Schedule 7(a)
Portfolio Data by Market
First Quarter 2020 Compared to First Quarter 2019
(unaudited)
| | Quarter Ended March 31, 2020 | | | Quarter Ended March 31, 2019 | |
| | Apartment Communities | | | Apartment Homes | | | Aimco Share of Apartment Homes | | | % Aimco NOI [1] | | | Average Revenue per Aimco Apartment Home | | | Apartment Communities | | | Apartment Homes | | | Aimco Share of Apartment Homes | | | % Aimco NOI [1] | | | Average Revenue per Aimco Apartment Home | |
| | | | | | | | | | | | | | | | | | | | | | | | | | | | | | | | | | | | | | | | |
Atlanta | | | 4 | | | | 505 | | | | 505 | | | | 1.0 | % | | $ | 1,854 | | | | 5 | | | | 817 | | | | 817 | | | | 1.5 | % | | $ | 1,648 | |
| | | | | | | | | | | | | | | | | | | | | | | | | | | | | | | | | | | | | | | | |
Bay Area | | | 12 | | | | 2,632 | | | | 2,632 | | | | 11.4 | % | | | 3,162 | | | | 12 | | | | 2,632 | | | | 2,632 | | | | 11.7 | % | | | 3,053 | |
| | | | | | | | | | | | | | | | | | | | | | | | | | | | | | | | | | | | | | | | |
Boston | | | 15 | | | | 4,689 | | | | 4,689 | | | | 12.9 | % | | | 2,068 | | | | 15 | | | | 4,689 | | | | 4,689 | | | | 11.9 | % | | | 1,992 | |
| | | | | | | | | | | | | | | | | | | | | | | | | | | | | | | | | | | | | | | | |
Chicago | | | 7 | | | | 1,671 | | | | 1,671 | | | | 4.0 | % | | | 1,889 | | | | 8 | | | | 2,070 | | | | 2,070 | | | | 5.0 | % | | | 1,794 | |
| | | | | | | | | | | | | | | | | | | | | | | | | | | | | | | | | | | | | | | | |
Denver | | | 8 | | | | 2,151 | | | | 2,112 | | | | 4.8 | % | | | 1,753 | | | | 8 | | | | 2,151 | | | | 2,112 | | | | 4.1 | % | | | 1,630 | |
| | | | | | | | | | | | | | | | | | | | | | | | | | | | | | | | | | | | | | | | |
Greater New York | | | 18 | | | | 1,039 | | | | 1,039 | | | | 3.9 | % | | | 3,406 | | | | 18 | | | | 1,040 | | | | 1,040 | | | | 3.9 | % | | | 3,389 | |
| | | | | | | | | | | | | | | | | | | | | | | | | | | | | | | | | | | | | | | | |
Greater Washington, DC | | | 12 | | | | 5,457 | | | | 5,434 | | | | 12.6 | % | | | 1,663 | | | | 13 | | | | 5,760 | | | | 5,732 | | | | 12.9 | % | | | 1,615 | |
| | | | | | | | | | | | | | | | | | | | | | | | | | | | | | | | | | | | | | | | |
Los Angeles | | | 13 | | | | 4,347 | | | | 4,346 | | | | 19.8 | % | | | 3,104 | | | | 13 | | | | 4,347 | | | | 4,346 | | | | 19.4 | % | | | 3,032 | |
| | | | | | | | | | | | | | | | | | | | | | | | | | | | | | | | | | | | | | | | |
Miami | | | 5 | | | | 2,455 | | | | 2,455 | | | | 6.1 | % | | | 2,324 | | | | 5 | | | | 2,677 | | | | 2,666 | | | | 6.9 | % | | | 2,189 | |
| | | | | | | | | | | | | | | | | | | | | | | | | | | | | | | | | | | | | | | | |
Philadelphia | | | 9 | | | | 2,748 | | | | 2,669 | | | | 9.2 | % | | | 2,508 | | | | 8 | | | | 2,638 | | | | 2,559 | | | | 8.1 | % | | | 2,397 | |
| | | | | | | | | | | | | | | | | | | | | | | | | | | | | | | | | | | | | | | | |
San Diego | | | 12 | | | | 2,423 | | | | 2,353 | | | | 7.0 | % | | | 1,987 | | | | 12 | | | | 2,423 | | | | 2,353 | | | | 6.8 | % | | | 1,927 | |
| | | | | | | | | | | | | | | | | | | | | | | | | | | | | | | | | | | | | | | | |
Seattle | | | 2 | | | | 239 | | | | 239 | | | | 0.7 | % | | | 2,424 | | | | 2 | | | | 239 | | | | 239 | | | | 0.7 | % | | | 2,316 | |
| | | | | | | | | | | | | | | | | | | | | | | | | | | | | | | | | | | | | | | | |
Other Markets | | | 7 | | | | 2,490 | | | | 2,461 | | | | 6.6 | % | | | 1,989 | | | | 9 | | | | 2,866 | | | | 2,837 | | | | 7.1 | % | | | 1,869 | |
| | | | | | | | | | | | | | | | | | | | | | | | | | | | | | | | | | | | | | | | |
Total [2] | | | 124 | | | | 32,846 | | | | 32,605 | | | | 100.0 | % | | $ | 2,280 | | | | 128 | | | | 34,349 | | | | 34,092 | | | | 100.0 | % | | $ | 2,181 | |
[1] | NOI represents the operating results of apartment communities including ancillary commercial rents. NOI does not include any office related rents or other material commercial rents. |
[2] | The information presented above includes those apartment communities in which Aimco held an equity interest as of the end of each period presented. |
| 24 |
Supplemental Schedule 7(b)
Portfolio Data by Market
Fourth Quarter 2019 Market Information
(unaudited)
Aimco portfolio strategy seeks predictable rent growth from a portfolio of apartment communities that is diversified across “A,” “B,” and “C+” price points, averaging “B/B+” in quality, and is also diversified across several of the largest markets in the United States. The schedule below illustrates Aimco’s portfolio quality based on fourth quarter 2019 data, the most recent period for which third-party data is available. Aimco adjusts the portfolio data to remove any apartment communities sold subsequent to the reported period.
The average age of Aimco’s portfolio, adjusted for its sizable investment in redevelopment, is approximately 25 years.
| Quarter Ended December 31, 2019 | |
| Apartment Communities [1] | | | Apartment Homes | | | Aimco Share of Apartment Homes | | | % Aimco NOI [2] | | | Average Rent per Aimco Apartment Home [3] | | | Market Rent [4] | | | Percentage of Market Rent Average | | | Average Age of Apartment Communities | |
| | | | | | | | | | | | | | | | | | | | | | | | | | | | | | | |
Atlanta | | 4 | | | | 505 | | | | 505 | | | | 0.9 | % | | $ | 1,732 | | | $ | 1,201 | | | | 144.2 | % | | | 26 | |
| | | | | | | | | | | | | | | | | | | | | | | | | | | | | | | |
Bay Area | | 12 | | | | 2,632 | | | | 2,632 | | | | 11.2 | % | | | 2,986 | | | | 2,895 | | | | 103.1 | % | | | 21 | |
| | | | | | | | | | | | | | | | | | | | | | | | | | | | | | | |
Boston | | 15 | | | | 4,689 | | | | 4,689 | | | | 13.1 | % | | | 1,956 | | | | 2,344 | | | | 83.4 | % | | | 33 | |
| | | | | | | | | | | | | | | | | | | | | | | | | | | | | | | |
Chicago | | 7 | | | | 1,671 | | | | 1,671 | | | | 4.0 | % | | | 1,751 | | | | 1,438 | | | | 121.8 | % | | | 26 | |
| | | | | | | | | | | | | | | | | | | | | | | | | | | | | | | |
Denver | | 8 | | | | 2,151 | | | | 2,112 | | | | 4.7 | % | | | 1,602 | | | | 1,395 | | | | 114.8 | % | | | 19 | |
| | | | | | | | | | | | | | | | | | | | | | | | | | | | | | | |
Greater New York | | 18 | | | | 1,039 | | | | 1,039 | | | | 3.9 | % | | | 3,293 | | | | 3,171 | | | | 103.8 | % | | | 24 | |
| | | | | | | | | | | | | | | | | | | | | | | | | | | | | | | |
Greater Washington, DC | | 12 | | | | 5,457 | | | | 5,434 | | | | 12.7 | % | | | 1,587 | | | | 1,807 | | | | 87.8 | % | | | 49 | |
| | | | | | | | | | | | | | | | | | | | | | | | | | | | | | | |
Los Angeles | | 13 | | | | 4,347 | | | | 4,346 | | | | 19.9 | % | | | 2,961 | | | | 1,974 | | | | 150.0 | % | | | 15 | |
| | | | | | | | | | | | | | | | | | | | | | | | | | | | | | | |
Miami | | 5 | | | | 2,448 | | | | 2,448 | | | | 6.0 | % | | | 2,171 | | | | 1,578 | | | | 137.6 | % | | | 26 | |
| | | | | | | | | | | | | | | | | | | | | | | | | | | | | | | |
Philadelphia | | 9 | | | | 2,748 | | | | 2,669 | | | | 9.2 | % | | | 2,338 | | | | 1,378 | | | | 169.7 | % | | | 20 | |
| | | | | | | | | | | | | | | | | | | | | | | | | | | | | | | |
San Diego | | 12 | | | | 2,423 | | | | 2,353 | | | | 6.9 | % | | | 1,867 | | | | 1,811 | | | | 103.1 | % | | | 30 | |
| | | | | | | | | | | | | | | | | | | | | | | | | | | | | | | |
Seattle | | 2 | | | | 239 | | | | 239 | | | | 0.8 | % | | | 2,134 | | | | 1,786 | | | | 119.5 | % | | | 6 | |
| | | | | | | | | | | | | | | | | | | | | | | | | | | | | | | |
Other Markets | | 7 | | | | 2,490 | | | | 2,461 | | | | 6.7 | % | | | 1,872 | | | | 1,588 | | | | 117.9 | % | | | 28 | |
| | | | | | | | | | | | | | | | | | | | | | | | | | | | | | | |
Total | | 124 | | | | 32,839 | | | | 32,598 | | | | 100.0 | % | | $ | 2,151 | | | $ | 1,915 | | | | 112.3 | % | | | 25 | |
[1] | The portfolio information presented above includes all apartment communities in which Aimco held an equity interest as of December 31, 2019. |
[2] | NOI represents the operating results of apartment communities including ancillary commercial rents. NOI does not include any office related rents or other material commercial rents. |
[3] | Represents rents, after concessions and vacancy loss, divided by Aimco Share of Apartment Homes. Does not include other rental income. |
| 25 |
Supplemental Schedule 8
Apartment Community Disposition and Acquisition Activity
(dollars in millions, except average revenue per home) (unaudited)
Disposition and Acquisition Activity | | | | | | | | | | | | | |
| | | | | | | | | | | | | | | | | |
First Quarter 2020 Dispositions and Acquisitions | | | | | | | | | | | | | |
| | | | | | | | | | | | | | | | | |
Aimco did not acquire or dispose of any apartment communities during the first quarter of 2020. |
| 26 |
Supplemental Schedule 9
Apartment Community Capital Additions Information
Three Months Ended March 31, 2020
(consolidated amounts in thousands, except per apartment home data) (unaudited)
Aimco classifies capital additions as Capital Replacements (“CR”), Capital Improvements (“CI”), Capital Enhancements (“CE”), Redevelopment, Development, Initial Capital Expenditures (“ICE”), or Casualty. Recurring capital additions are apportioned between CR and CI based on the useful life of the item under consideration and the period over which Aimco has owned the item. Under this method of classification, CR represents the portion of the item consumed during Aimco’s ownership of the item, while CI represents the portion of the item consumed prior to Aimco’s period of ownership.
| | Three Months Ended March 31, 2020 | |
Capital Additions [1] | | | | |
Capital Replacements | | | | |
Buildings and grounds | | $ | 6,671 | |
Turnover capital additions | | | 757 | |
Capitalized site payroll and indirect costs | | | 919 | |
Capital Replacements | | | 8,347 | |
Capital Improvements | | | 1,755 | |
Capital Enhancements | | | 10,363 | |
Redevelopment | | | 34,458 | |
Development | | | 32,917 | |
Initial Capital Expenditures | | | 2,002 | |
Casualty | | | 2,524 | |
Total | | $ | 92,366 | |
| | | | |
Total apartment homes | | | 32,704 | |
| | | | |
Capital Replacements per apartment home | | $ | 255 | |
[1] | For the three months ended March 31, 2020, capital additions for Aimco’s apartment communities included $3.4 million of capitalized interest costs. |
| 27 |
Supplemental Schedule 10
Redevelopment and Development Portfolio | (Page 1 of 2) |
As of March 31, 2020
(dollars in millions, except per home information) (unaudited)
Aimco executes redevelopments using a range of approaches. Aimco prefers to limit risk by executing redevelopments using a short-cycle approach, in which it renovates an apartment community in stages. These short-cycle redevelopments can be completed one apartment home at a time, when that home is vacated and available for renovation, or one floor at a time, thereby limiting the number of down homes and lease-up risk. As a result, short-cycle redevelopments provide Aimco the flexibility to maintain current earnings while aligning the timing of the completed apartment homes with market demand. The following table summarizes value-creating investments related to short-cycle redevelopments.
| | | | | | | | Number of Apartment Homes | | | | | | | | | | | | | | | | | | | | | | | | | | | | | | | |
| | Location | | Total Apartment Homes | | | Approved for Redevelopment / To Be Constructed | | | Completed | | | Leased | | | Total Planned Investment [1] | | | Investment to Date | | | Remaining Investment | | | Current Project Scope | |
Bay Parc | | Miami, FL | | | 474 | | | | 75 | | | | 75 | | | | 70 | | | $ | 26.3 | | | $ | 26.3 | | | $ | — | | | Amenities and renovation of five floors of apartment homes | |
Total | | | | | 474 | | | | 75 | | | | 75 | | | | 70 | | | $ | 26.3 | | | $ | 26.3 | | | $ | — | | | | | | | | | | | | | | | | | | | |
| | | | | | | | | | | | | | | | | | | | | | | | | | | | | | | | | | | | | | | | | | | | | | | | |
When short-cycle redevelopments are not possible, Aimco may engage in redevelopment activities where an entire building or community is vacated. Aimco refers to these as long-cycle redevelopments. Aimco undertakes some ground-up development when warranted by risk-adjusted investment returns. | |
| |
| | | | | | | | | | | | | | | | | | | | | | | | | | | | | | | | | | | | | | | | | | | | | | | | |
The following table summarizes value-creating investments related to long-cycle developments and redevelopments. | |
| | | | | | | | | | | | | | | | | | | | | | | | | | | | | | | | | | | | | | | | | | | | | | | | |
| | | | | | | | Number of Apartment Homes | | | | | | | | | | | | | | | | | | | | | Average Revenue per Apartment Home Redeveloped or Constructed | | | | | | |
| | Location | | | Approved for Redevelopment / To Be Constructed | | | Completed | | | Leased | | | Total Planned Investment [1] | | | Investment to Date | | | Remaining Investment | | | Expected Initial Occupancy [2] | | Expected Stabilized Occupancy [2] | | Expected NOI Stabilization [2] | | Prior to Investment | | | Range of Stabilized Rents [3] | | | | Expected Incremental Commercial Revenue | |
| | | | | | | | | | | | | | | | | | | | | | | | | | | | | | | | | | | | | | | | | | | | | | | | |
707 Leahy | | Redwood City, CA | | | | 110 | | | | 12 | | | | 19 | | | $ | 25.0 | | | $ | 16.1 | | | $ | 8.9 | | | 1Q 2020 | | 1Q 2021 | | 2Q 2022 | | $ | 2,800 | | | $3,500 - $3,900 | | | | n/a | |
| | | | | | | | | | | | | | | | | | | | | | | | | | | | | | | | | | | | | | | | | | | | | | | | |
Eldridge Townhomes | | Elmhurst, IL | | | | 58 | | | | — | | | | 12 | | | | 35.1 | | | | 24.1 | | | | 11.0 | | | 2Q 2020 | | 3Q 2021 | | 4Q 2022 | | n/a | | | $4,300 - $4,700 | | | | n/a | |
| | | | | | | | | | | | | | | | | | | | | | | | | | | | | | | | | | | | | | | | | | | | | | | | |
Flamingo Point | | Miami Beach, FL | | | | 385 | | | | 18 | | | | 12 | | | | 224.9 | | | | 90.2 | | | | 134.7 | | | 4Q 2021 | | 1Q 2023 | | 2Q 2024 | | $ | 2,308 | | | $2,750 - $3,350 | | [4] | | $ | 0.6 | |
| | | | | | | | | | | | | | | | | | | | | | | | | | | | | | | | | | | | | | | | | | | | | | | | |
The Fremont | | Denver, CO (MSA) | | | | 253 | | | | — | | | | 16 | | | | 87.0 | | | | 69.8 | | | | 17.2 | | | 3Q 2020 | | 4Q 2021 | | 1Q 2023 | | n/a | | | $2,200 - $2,500 | | | | $ | 0.1 | |
| | | | | | | | | | | | | | | | | | | | | | | | | | | | | | | | | | | | | | | | | | | | | | | | |
Parc Mosaic | | Boulder, CO | | | | 226 | | | | 226 | | | | 157 | | | | 124.6 | | | | 123.4 | | | | 1.2 | | | 3Q 2019 | | 4Q 2020 | | 1Q 2022 | | n/a | | | $3,200 - $3,400 | | | | n/a | |
| | | | | | | | | | | | | | | | | | | | | | | | | | | | | | | | | | | | | | | | | | | | | | | | |
Prism [5] | | Cambridge, MA | | | | 136 | | | | — | | | | 2 | | | | 73.2 | | | | 32.8 | | | | 40.4 | | | 1Q 2021 | | 2Q 2022 | | 3Q 2023 | | n/a | | | $2,950 - $3,250 | | | | n/a | |
| | | | | | | | | | | | | | | | | | | | | | | | | | | | | | | | | | | | | | | | | | | | | | | | |
Subtotal | | | | | | | | | 1,168 | | | | 256 | | | | 218 | | | $ | 569.8 | | | $ | 356.4 | | | $ | 213.4 | | | | | | | | | | | | | | | | | | | |
| | | | | | | | | | | | | | | | | | | | | | | | | | | | | | | | | | | | | | | | | | | | | | | | |
Total | | | | | | | | | 1,243 | | | | 331 | | | | 288 | | | $ | 596.1 | | | $ | 382.7 | | | $ | 213.4 | | | | | | | | | | | | | | | | | | | |
[1] | Planned investment relates to the current phase of the redevelopment or development. |
[2] | Delivery timing and stabilization is subject to change and are based on the best estimate at this time. Temporary local restrictions halting construction activity and extended ‘shelter-in-place’ orders, related to COVID-19 or otherwise, may delay project completion and impact the timing of stabilization. Any additional delays may also result in increased costs. |
[3] | Aimco previously provided the expected rent achievement at these communities based on the project’s underwriting. Due to the increased uncertainty resulting from COVID-19, Aimco is now presenting a range of stabilized rate achievement based on its best judgement at this time. As future rent achievement becomes more certain, these amounts will be updated. |
[4] | At the midpoint, the $325 decline in stabilized rents from what was presented in the fourth quarter 2019 earnings release is due to Aimco’s decision to pause the renovation of the Center Tower apartment homes. |
[5] | Aimco’s directs costs are fixed based on its contract with the developer. |
See the following pages for Terms and Definitions.
| 28 |
Supplemental Schedule 10 (Continued)
Redevelopment and Development Portfolio
(Page 2 of 2)
Terms and Definitions
Total Planned Investment - represents total estimated investment, net of tax and other credits earned by Aimco as a direct result of its redevelopment or development of the community. Total estimated investment includes all capitalized costs projected to be incurred to redevelop or develop the respective community, as determined in accordance with GAAP.
Expected Stabilized Occupancy - period in which Aimco expects to achieve stabilized occupancy (greater than 90%).
Expected NOI Stabilization - period in which Aimco expects to achieve stabilized rents and operating costs, generally five quarters after Stabilized Occupancy.
Average Revenue per Apartment Home Redeveloped or Constructed - represents the actual revenues per apartment home, which includes rents and other rental income, prior to redevelopment, and the projected revenues per apartment home following redevelopment or construction, excluding rent and other rental income from commercial leases (which are presented separately on this schedule) and resident utility reimbursements. Projections of stabilized revenues per apartment home are based on management’s judgment. These projections consider factors including but not limited to: current rent; other rental income expectations; and revenue achievement to date as compared to current market rents.
| 29 |
GLOSSARY AND RECONCILIATIONS OF NON-GAAP FINANCIAL AND OPERATING MEASURES
This Earnings Release and Supplemental Information include certain financial and operating measures used by Aimco management that are not calculated in accordance with accounting principles generally accepted in the United States, or GAAP. Aimco’s definitions and calculations of these non-GAAP financial and operating measures and other terms may differ from the definitions and methodologies used by other REITs and, accordingly, may not be comparable. These non-GAAP financial and operating measures should not be considered an alternative to GAAP net income or any other GAAP measurement of performance and should not be considered an alternative measure of liquidity.
AIMCO OP: AIMCO Properties, L.P., a Delaware limited partnership, is the operating partnership in Aimco’s UPREIT structure. Aimco owns approximately 93.4% of the legal interest in the common partnership units of the Aimco OP and 94.8% of the economic interest in the common partnership units of the Aimco OP.
AIMCO PROPORTIONATE FINANCIAL INFORMATION: Within this Earnings Release and Supplemental Information, Aimco provides certain financial information necessary to calculate Aimco’s share of financial information. This information is not, nor is it intended to be, a presentation in accordance with GAAP. Aimco’s proportionate share of financial information includes Aimco’s share of unconsolidated real estate partnerships and excludes the noncontrolling interest partners’ share of consolidated real estate partnerships.
Aimco does not control the unconsolidated real estate partnerships and the calculation of Aimco’s share of the assets and liabilities and revenues and expenses does not represent a legal claim to a proportionate share of such items. The amount of cash distributions partners in such partnerships may receive is based upon specific provisions in the partnership agreements and may vary based on whether such distributions are generated from operations, capital events or liquidation.
Proportionate information benefits the users of Aimco’s financial information by providing the amount of revenues, expenses, assets, liabilities, and other items attributable to Aimco stockholders. Other companies may calculate their proportionate information differently than Aimco does, limiting the usefulness as a comparative measure. Because of these limitations, the non-GAAP Aimco proportionate financial information should not be considered in isolation or as a substitute for information included in Aimco’s financial statements as reported under GAAP.
AVERAGE AGE OF APARTMENT COMMUNITIES: Calculated by Aimco on a property-by-property basis based on the year the community was originally built, adjusted for redevelopment and/or other major capital improvements that effectively reduce the age of the community. Such investments include construction of new buildings and/or amenities, replacement or modernization of mechanical, plumbing, and electrical systems and other investments that are consequential in nature. The average age of apartment communities is weighted by the estimated fair value of the properties, and is updated annually during the first quarter, as well as upon completion of a long-cycle redevelopment.
AVERAGE REVENUE PER APARTMENT HOME: Represents Aimco proportionate average monthly rental and other property revenues, excluding utility cost reimbursements, divided by the number of occupied apartment homes as of the end of the period.
| 30 |
CAPITAL ADDITIONS DEFINITIONS
CAPITAL IMPROVEMENTS (CI): CI represent capital additions made to replace the portion of acquired apartment communities consumed prior to Aimco’s period of ownership and not contemplated in Aimco’s underwriting of an acquisition.
CAPITAL REPLACEMENTS (CR): Unlike CI, CR does not increase the useful life of an asset from its original purchase condition. CR represent capital additions made to replace the portion of acquired capital assets consumed during Aimco’s period of ownership. CR is deducted in the calculation of AFFO. See below for a reconciliation between CR amounts on Schedule 2 and Schedule 9 (in thousands, unaudited).
| | Three Months Ended March 31, 2020 | |
Capital Replacements (Schedule 9) | | $ | 8,347 | |
Adjustments | | | | |
Proportionate share of Capital Replacements spending | | | (691 | ) |
Amortization of incremental costs to obtain leases | | | 3,949 | |
Capital Replacements (Schedule 2) | | $ | 11,605 | |
CASUALTY CAPITAL ADDITIONS: Casualty capital additions represent capitalized costs incurred in connection with the restoration of an apartment community after a casualty event.
CAPITAL ENHANCEMENTS (CE): CE may include kitchen and bath remodeling; energy conservation projects; and investments in longer-lived materials designed to reduce costs. CE differs from Redevelopment Additions in that they are generally lesser in scope and do not significantly disrupt property operations.
INITIAL CAPITAL EXPENDITURES (ICE): ICE represent capital additions contemplated in the underwriting at Aimco’s recently acquired communities.
REDEVELOPMENT ADDITIONS: Redevelopment additions represent capital additions intended to enhance the value of the apartment community through the ability to generate higher average rental rates, and may include costs related to entitlement, which enhance the value of a community through increased density, and costs related to renovation of exteriors, common areas, or apartment homes.
DEVELOPMENT ADDITIONS: Development additions represent construction and related capitalized costs associated with the ground-up development of apartment communities.
ECONOMIC INCOME: As discussed in Supplemental Schedule 1, Economic Income represents stockholder value creation as measured by the change in estimated net asset value, or NAV, per share, plus cash dividends per share. Aimco believes Economic Income is important to investors as it represents a measure of total return we have earned for our stockholders. NAV, as used in our calculation of Economic Income, is a non-GAAP measure and represents the estimated fair value of assets net of liabilities attributable to Aimco’s common stockholders and the Aimco Operating Partnership’s common unitholders on a diluted basis. Aimco reports and reconciles Economic Income to GAAP equity annually. Please refer to the section entitled Management’s Discussion and Analysis of Financial Condition and Results of Operations described in Item 7 of our Annual Report on Form 10-K for the year ended December 31, 2019 for more information about Economic Income.
FREE CASH FLOW: Free Cash Flow, as calculated for Aimco’s retained portfolio, represents an apartment community’s property net operating income, less spending for Capital Replacements. Capital Replacement spending is a measure of the cost of capital asset used during the period. Aimco believes that Free Cash Flow is useful to investors as a supplemental measure of apartment community performance because it
| 31 |
takes into consideration costs incurred during the period to replace capital assets that have been consumed during Aimco’s ownership.
FREE CASH FLOW CAP RATE: Free Cash Flow Cap Rate represents the NOI Cap Rate, adjusted for assumed Capital Replacements spending of $1,200 per apartment home.
FREE CASH FLOW MARGIN: Free Cash Flow Margin represents an apartment community’s property net operating income less $1,200 per apartment home of assumed annual Capital Replacement spending, as a percentage of the apartment community’s rental and other property revenues.
LEVERAGE RATIO DEFINITIONS
Aimco’s leverage strategy targets the ratio of Net Leverage to Adjusted EBITDAre to be below 7.0x and the ratio of Adjusted EBITDAre to Adjusted Interest and Preferred Distributions to be greater than 2.5x. Aimco also focuses on the ratios of Proportionate Debt to Adjusted EBITDAre and Adjusted EBITDAre Coverage of Adjusted Interest. Aimco believes these ratios, which are based in part on non-GAAP financial information, are commonly used by investors and analysts to assess the relative financial risk associated with balance sheets of companies within the same industry, and they are believed to be similar to measures used by rating agencies to assess entity credit quality. EBITDAre and Adjusted EBITDAre should not be considered alternatives to net income (loss) as determined in accordance with GAAP as indicators of performance. There can be no assurance that Aimco’s method of calculating EBITDAre and Adjusted EBITDAre is comparable with that of other real estate investment trusts.
Aimco’s net leverage includes Aimco’s share of long-term, non-recourse property debt, outstanding borrowings on its revolving credit facility, and outstanding preferred OP Units, reduced by cash and restricted cash on-hand, excluding tenant security deposits, and its investment in a securitization trust that holds certain of its property debt. Aimco reconciles consolidated balances to its net leverage on Supplemental Schedule 5(a).
Aimco calculates Adjusted EBITDAre and Adjusted Interest Expense used in its leverage ratios based on current quarter amounts, annualized.
EBITDAre AND ADJUSTED EBITDAre
EARNINGS BEFORE INTEREST, TAXES, DEPRECIATION, AND AMORTIZATION FOR REAL ESTATE (“EBITDAre”): Nareit defines EBITDAre as net income computed in accordance with GAAP, before interest expense, income taxes, depreciation and amortization expense, further adjusted for:
| • | gains and losses on the dispositions of depreciated property; |
| • | impairment write-downs of depreciated property; |
| • | impairment write-downs of investments in unconsolidated partnerships caused by a decrease in the value of the depreciated property in such partnerships; and |
| • | adjustments to reflect the Aimco’s share of EBITDAre of investments in unconsolidated entities. |
Aimco believes that EBITDAre is useful to investors, creditors and rating agencies as a supplemental measure of Aimco’s ability to incur and service debt because it is a recognized measure of performance by the real estate industry and facilitates comparison of credit strength between Aimco and other companies.
| 32 |
ADJUSTED EBITDAre: Adjusted EBITDAre is defined by Aimco as EBITDAre adjusted to exclude the effect of the following items for the reasons set forth below:
| • | net income attributable to noncontrolling interests in consolidated real estate partnerships and EBITDAre adjustments attributable to noncontrolling interests, to allow investors to compare a measure of Aimco’s earnings before the effects of Aimco’s capital structure and indebtedness with that of other companies in the real estate industry; |
| • | the amount of interest income recognized by Aimco related to its investment in the subordinated tranches in a securitization trust holding primarily Aimco property debt, as Aimco views its interest cost on this debt to be net of any interest income received; and |
| • | the amount by which GAAP rent expense exceeds cash rents for a long-term ground lease for which expense exceeds cash payments until 2076. The excess of the GAAP rent expense over the cash payments for this lease does not reflect a current obligation that affects Aimco’s ability to service debt. |
A reconciliation of net income to EBITDAre and Adjusted EBITDAre for Aimco’s portfolio for the quarter ended March 31, 2020, is as follows (in thousands):
Net income | | $ | 8,977 | |
Adjustments: | | | | |
Interest expense | | | 41,336 | |
Income tax benefit | | | (3,233 | ) |
Depreciation and amortization | | | 100,476 | |
Loss on dispositions of real estate | | | 34 | |
Adjustment related to EBITDAre of unconsolidated partnerships | | | 211 | |
EBITDAre | | | 147,801 | |
Net income attributable to noncontrolling interests in consolidated real estate partnerships | | | (18 | ) |
EBITDAre adjustments attributable to noncontrolling interests | | | (620 | ) |
Interest income received on securitization investment | | | (2,171 | ) |
Straight-line rent | | | 635 | |
Adjusted EBITDAre | | $ | 145,627 | |
Annualized Adjusted EBITDAre | | $ | 582,508 | |
ADJUSTED INTEREST EXPENSE: Adjusted Interest Expense represents Aimco’s proportionate share of interest expense on non-recourse property debt and interest on the credit facility borrowings less (i) prepayment penalties, if any, and (ii) the amount of interest income recognized by Aimco related to its investment in the subordinated tranches in a securitization trust holding primarily Aimco property debt.
Adjusted Interest Expense and Preferred Distributions for the quarter ended March 31, 2020, as used in the leverage ratios on Supplemental Schedule 5(a), are calculated as follows (in thousands):
Interest expense per consolidated statement of operations | | $ | 41,336 | |
Adjustments: | | | | |
Adjustments related to interest of consolidated and unconsolidated partnerships | | | (68 | ) |
Interest income received on securitization investment | | | (2,171 | ) |
Adjusted Interest Expense | | $ | 39,097 | |
Preferred distributions | | | 1,869 | |
Adjusted Interest Expense and Preferred Distributions | | $ | 40,966 | |
Annualized Adjusted Interest Expense | | $ | 156,388 | |
Annualized Adjusted Interest Expense and Preferred Distributions | | $ | 163,864 | |
| 33 |
FIXED CHARGE COVERAGE RATIO: As defined by Aimco’s credit agreement, the ratio of (a) EBITDA to (b) fixed charges, which represent the sum of (i) Aimco’s proportionate share of interest expense (excluding prepayment penalties and amortization of debt issuance costs), (ii) debt amortization, and (iii) Preferred Distributions, for the four fiscal quarters preceding the date of calculation. The calculation of certain of these measures as defined by Aimco’s Credit Agreement may differ from those used by Aimco in the calculations of its Leverage Ratios.
PREFERRED DISTRIBUTIONS: Preferred Distributions includes the distributions paid with respect to the Aimco OP’s Preferred Partnership Units.
OTHER LEVERAGE: Other Leverage includes Preferred OP Units and redeemable noncontrolling interests.
PREFERRED OP UNITS: Preferred OP Units represent the redemption amounts for the Aimco OP’s Preferred Partnership Units and may be found in Aimco’s consolidated balance sheets and on Supplemental Schedule 5(b).
PROPORTIONATE DEBT TO ADJUSTED EBITDAre RATIO: The ratio of (a) Aimco’s share of net leverage as calculated on Supplemental Schedule 5(a), excluding Preferred OP Units and redeemable noncontrolling interests, to (b) Adjusted EBITDAre.
NET LEVERAGE TO ADJUSTED EBITDAre RATIO: The ratio of (a) Aimco’s share of net leverage as calculated on Supplemental Schedule 5(a), to (b) Adjusted EBITDAre.
NAREIT FUNDS FROM OPERATIONS (Nareit FFO): Nareit FFO is a commonly used measure of REIT performance, which the National Association of Real Estate Investment Trusts (Nareit) defines as net income computed in accordance with GAAP, excluding: depreciation and amortization related to real estate; gains and losses from sales or impairment of depreciable assets and land used in the primary business of the REIT; and income taxes directly associated with a gain or loss on sale of real estate; and including Aimco’s share of Nareit FFO of unconsolidated partnerships and joint ventures. Aimco computes Nareit FFO for all periods presented in accordance with the guidance set forth by Nareit.
In addition to Nareit FFO, Aimco uses PRO FORMA FUNDS FROM OPERATIONS (Pro forma FFO) and ADJUSTED FUNDS FROM OPERATIONS (AFFO) to measure short-term performance. Pro forma FFO represents Nareit FFO as defined above, excluding certain amounts that are unique or occur infrequently. Aimco’s pro forma adjustments are defined in further detail in the footnotes to Supplemental Schedule 1.
AFFO represents Pro forma FFO reduced by Capital Replacements and is Aimco’s primary measure of current period performance.
Nareit FFO, Pro forma FFO, and AFFO are non-GAAP measures that Aimco believes are helpful to investors in understanding Aimco’s short-term performance because they capture features particular to real estate performance by recognizing that real estate generally appreciates over time or maintains residual value to a much greater extent than other capital assets such as machinery, computers or other personal property. Nareit FFO, Pro forma FFO, and AFFO should not be considered alternatives to net income (loss) as determined in accordance with GAAP, as indicators of performance. There can be no assurance that Aimco’s method of computing Nareit FFO, Pro forma FFO or AFFO is comparable with that of other real estate investment trusts.
NET OPERATING INCOME (NOI) CAP RATE: NOI Cap Rate is calculated based on Aimco’s share of the proportionate property NOI for the trailing twelve months prior to sale, less a 3% management fee, divided by Aimco gross proceeds.
| 34 |
NET OPERATING INCOME (NOI) MARGIN: Represents an apartment community’s net operating income as a percentage of the apartment community’s rental and other property revenues.
OTHER EXPENSES, NET: Other expenses, net, allocated to contribution from real estate operations on Supplemental Schedule 2 generally includes ground lease rent expense, franchise taxes, expenses specifically related to Aimco’s administration of its real estate partnerships (for example, services such as audit, tax, and legal), and other amounts not included in property NOI for purposes of evaluating segment performance. Other expenses, net, not allocated to contribution from real estate operations generally consists of risk management activities related to Aimco’s unconsolidated partnerships and certain other corporate expenses.
PROPERTY NET OPERATING INCOME (NOI) and PROPORTIONATE PROPERTY NOI: NOI is defined by Aimco as total property rental and other property revenues less direct property operating expenses, including real estate taxes. NOI does not include: property management revenues, primarily from affiliates; casualties; property management expenses; depreciation; or interest expense. NOI is helpful because it helps both investors and management to understand the operating performance of real estate excluding costs associated with decisions about acquisition pricing, overhead allocations, and financing arrangements. NOI is also considered by many in the real estate industry to be a useful measure for determining the value of real estate. Reconciliations of NOI as presented in this Earnings Release and Supplemental Information to Aimco’s consolidated GAAP amounts are provided below.
Due to the diversity of its economic ownership interests in its apartment communities in the periods presented, Aimco evaluates the performance of the apartment communities in its segments using Proportionate Property NOI, which represents Aimco’s share of the NOI for the apartment communities that Aimco consolidates and manages, but excludes apartment communities that it does not consolidate. Proportionate Property NOI is defined as Aimco share of rental and other property revenue less Aimco share of property operating expenses. In its evaluation of community results, Aimco excludes utility cost reimbursement from rental and other property revenues and reflects such amount as a reduction of the related utility expense within property operating expenses. The following table presents the reconciliation of GAAP rental and other property revenue to the proportionate revenues before utility reimbursements and GAAP property operating expenses to proportionate expenses, net of utility reimbursements. The table also presents the reconciliation of consolidated Same Store revenue before utility reimbursements and expenses, net of utility reimbursements as presented on Supplemental Schedule 2(a) to the proportionate amounts presented on Supplemental Schedule 6.
Segment NOI Reconciliation | |
(in thousands) (unaudited) | | Three Months Ended | |
| | March 31, 2020 | | | March 31, 2019 | |
| | Revenues, Before Utility Reimbursements | | | Expenses, Net of Utility Reimbursements | | | Revenues, Before Utility Reimbursements | | | Expenses, Net of Utility Reimbursements | |
Total (per consolidated statements of operations) | | $ | 224,552 | | | $ | 75,480 | | | $ | 230,235 | | | $ | 78,959 | |
Adjustment: Utilities reimbursement [1] | | | (7,905 | ) | | | (7,905 | ) | | | (7,500 | ) | | | (7,500 | ) |
Adjustment: Sold properties and other amounts not allocated [2] | | | 2,888 | | | | (7,261 | ) | | | (12,295 | ) | | | (11,863 | ) |
Total (per Supplemental Schedule 2) | | | 219,535 | | | | 60,314 | | | | 210,440 | | | | 59,596 | |
Proportionate adjustment [3] | | | (907 | ) | | | (270 | ) | | | (792 | ) | | | (233 | ) |
Proportionate property net operating income | | $ | 218,628 | | | $ | 60,044 | | | $ | 209,648 | | | $ | 59,363 | |
Same Store amounts (per Supplemental Schedule 2) | | $ | 188,279 | | | $ | 48,853 | | | $ | 181,871 | | | $ | 49,072 | |
Proportionate adjustment [3] | | | (323 | ) | | | (70 | ) | | | (309 | ) | | | (74 | ) |
Same Store amounts, adjusted (per Supplemental Schedule 6) | | $ | 187,956 | | | $ | 48,783 | | | $ | 181,562 | | | $ | 48,998 | |
| 35 |
[1] | Approximately two-thirds of Aimco’s utility costs are reimbursed by residents. These reimbursements are included in rental and other property revenues on Aimco’s consolidated statements of operations prepared in accordance with GAAP. This adjustment represents the reclassification of utility reimbursements from revenues to property operating expenses for the purpose of evaluating segment results and as presented on Supplemental Schedule 2, Supplemental Schedule 3, and Supplemental Schedule 6. Aimco also excludes the reimbursement amounts from the calculation of Average Revenue per Apartment Home throughout this Earnings Release and Supplemental Schedules. | |
[2] | Sold properties and other amounts not allocated includes operating results of apartment communities sold during the periods shown or held for sale at the end of the period, as well as property management and casualty expense, which are not included in property operating expenses, net of utility reimbursements in the Supplemental Schedule 2 presentation. Write-off of straight-line rent receivables, which was recognized due to the impact of COVID-19 on Aimco’s commercial tenants, is included in consolidated rental and other property revenues. The write-off of straight-line rent is not included in Aimco’s measurement of segment performance. | |
[3] | Proportionate adjustments represent the noncontrolling interests’ share of the rental and other property revenues before utility reimbursements and property operating expenses, net of utility reimbursements. Such adjustment is necessary to reconcile consolidated amounts presented on Supplemental Schedule 2 to the amounts allocated to Aimco’s operating segments, as well as to reconcile Same Store amounts presented on Supplemental Schedule 2 to proportionate same store amounts presented on Supplemental Schedules 6. | |
PORTFOLIO QUALITY RATINGS: Aimco measures the quality of apartment communities in its portfolio based on average rents of its apartment homes compared to local market average rents as reported by a third-party provider of commercial real estate performance and analysis. Under this rating system, Aimco classifies as “A” quality apartment communities those earning rents greater than 125% of local market average; as “B” quality apartment communities those earning rents between 90% and 125% of local market average; “C+” quality apartment communities those earning rents greater than $1,100 per month, but lower than 90% of local market average; and “C” quality apartment communities those earning rents less than $1,100 per month and lower than 90% of local market average.
REAL ESTATE CLASSIFICATIONS: Aimco’s portfolio of apartment communities is diversified by both price point and geography. Aimco’s portfolio is classified into four segments, as follows:
SAME STORE: Same Store apartment communities are apartment communities that (a) are owned and managed by Aimco, (b) had reached a stabilized level of operations as of January 1, 2019, and maintained it throughout the current and the comparable prior periods, and (c) are not expected to be sold within 12 months.
ACQUISITION: Includes apartment communities acquired since January 1, 2019. The communities are One Ardmore and Prism. Prism and its planned 136 apartment homes are under construction and are currently excluded from the apartment community and home counts.
REDEVELOPMENT/DEVELOPMENT: Includes apartment communities currently under construction that have not achieved a stabilized level of operations and those that have been completed in recent years that had not achieved and maintained stabilized operations for both the current and the comparable prior periods.
OTHER REAL ESTATE: Includes apartment communities subject to limitations on rent increases, communities that Aimco expects to sell within 12 months that do not meet the criteria to be classified as held for sale, stabilized communities that we expect to redevelop, and certain commercial spaces.
SOLD AND HELD FOR SALE APARTMENT COMMUNITIES: Apartment communities either sold since January 1, 2019 or classified as held for sale at the end of the period. For purposes of highlighting results of operations related to Aimco’s retained portfolio, results for Sold and Held For Sale Apartment Communities are excluded from property net operating income and presented separately on a net basis on Supplemental Schedule 2.
TURNOVER and RETENTION: Turnover represents the percentage of residents who have moved out in the trailing twelve months. It is calculated by dividing the number of move outs in the trailing twelve months, exclusive of intra-community transfers, by the daily average number of occupied apartment homes during the trailing twelve months. For the twelve months ended March 31, 2020, Turnover was 42.0%, 160 basis
| 36 |
points lower than the twelve months ended March 31, 2019. Inclusive of intra-community transfers, Turnover was 46.2% for the trailing twelve months ended March 31, 2020.
Retention represents the inverse of Turnover, as defined above.
| 37 |