Exhibit 99.1

Aimco Reports Third Quarter 2020 Results
Denver, Colorado, October 29, 2020 – Apartment Investment and Management Company (“Aimco”) (NYSE: AIV) announced today third quarter results for 2020.
Chairman and Chief Executive Officer Terry Considine comments: “The third quarter 2020 was filled with challenges and successes. The challenge of the pandemic to property operations was compounded by after-effects including economic volatility and a new era of work from home, government regulation of rent setting and rent collection, rioting and a general unsettling of public order. Aimco provided its residents safety, a refuge from the virus, good neighbors, respectful treatment for all, and a helping hand to those in need. While the experience of this year makes me cautious, it seems that the worst is behind us. We have seen steady improvement during the third quarter. We expect that trend to continue through the fourth quarter and into the new year.”
“During the third quarter, Aimco sold a 39% interest in a $2.4 billion portfolio of California properties. This enabled a $1B reduction in financial leverage.”
“Also during the third quarter, Aimco announced a Board-led plan, informed by active and regular engagement with shareholders, to reduce financial risk and execution risk, and to increase FFO per share by division of the Aimco business between two public entities. The first with 90% of Aimco capital will be known as Apartment Income REIT or “AIR”. It will own only stabilized apartment communities, eliminating vacancy loss during redevelopment and allowing substantial reduction in execution risk and offsite costs. Leverage will be reduced by $2B by selling assets. The California joint venture discussed above resulted in the first $1B reduction in financial leverage. The second $1B will be achieved by the separation transaction scheduled to close before year-end. The second entity with 10% of Aimco capital will be known as Aimco, or sometimes for clarity, as “new” Aimco. It will hold the non-traditional assets, such as the Parkmerced loan and the Brickell land assembly. New Aimco will continue and seek to grow the development and redevelopment business and it will complete the redevelopment projects now underway or about to be started. After a defined transition period, the two businesses will be wholly separate. From the start, each will have separate boards of directors and separate management teams. The separation has been structured to refresh the tax basis of the properties to be held by AIR, eliminating or reducing the need for future stock dividends. Shareholders will own the same assets before and after the separation transaction but will gain the opportunity to make individual allocations between the two businesses.
“Looking forward, I am excited about the prospects for both AIR and New Aimco. We will publish more information soon in the Forms-10 now being reviewed by the SEC. I believe that the separation will unlock significant shareholder value.”
Chief Financial Officer Paul Beldin adds: “For the current, combined Aimco, third quarter pro forma FFO of $0.61 per share was down 5% year-over-year. $0.07 per share in higher income from the Parkmerced mezzanine loan and from lower offsite costs was more than offset by $0.09 per share of lower occupancy and other COVID-related impacts detailed on page three and a $0.01 net impact of property sales. Same Store Residential Net Rental Income was down in the third quarter by 2.5%. In our stable, mostly suburban markets, which include approximately 70% of our Same Store apartment homes, this same measure was up 60 basis points. Specific urban submarkets fared worse with Same Store Residential Net Rental Income down by 7.1%.”
2
Financial Results: Third Quarter AFFO Per Share Down 5%; Year-to-date Up 4%
| | THIRD QUARTER | | | YEAR-TO-DATE | |
(all items per common share - diluted) | | 2020 | | | 2019 | | | Variance | | | 2020 | | | 2019 | | | Variance | |
Net (loss) income | | $ | (0.17 | ) | | $ | 0.01 | | | nm | | | $ | 0.14 | | | $ | 2.26 | | | | (94 | %) |
NAREIT Funds From Operations (FFO) | | $ | 0.45 | | | $ | 0.61 | | | | (26 | %) | | $ | 1.69 | | | $ | 1.78 | | | | (5 | %) |
Pro forma adjustments, net* | | $ | 0.16 | | | $ | 0.03 | | | | 433 | % | | $ | 0.22 | | | $ | 0.07 | | | | 214 | % |
Pro forma Funds From Operations (Pro forma FFO)** | | $ | 0.61 | | | $ | 0.64 | | | | (5 | %) | | $ | 1.91 | | | $ | 1.85 | | | | 3 | % |
Deduct Capital Replacements | | $ | (0.08 | ) | | $ | (0.08 | ) | | | — | % | | $ | (0.23 | ) | | $ | (0.23 | ) | | | — | % |
Adjusted Funds From Operations (AFFO)** | | $ | 0.53 | | | $ | 0.56 | | | | (5 | %) | | $ | 1.68 | | | $ | 1.62 | | | | 4 | % |
* Primarily separation costs and prepayment penalties, see Supplemental Schedule 1 for a detailed list of pro forma adjustments to FFO.
** See COVID-19 Response Update in this earnings release for detail on impacts directly related to Aimco’s response to COVID-19 and the related governmental shut-down of the economy.
Net Income (per diluted common share) – Year-over-year, third quarter net income decreased due primarily to increased prepayment penalties incurred due to third quarter 2020 payoff activity and higher other expenses due to costs incurred on the previously announced planned separation of Aimco’s development activities.
Pro forma FFO (per pro forma diluted common share) – Third quarter Pro forma FFO per share decreased 5% year-over-year. Increased income from the Parkmerced mezzanine loan and lower offsite costs was more than offset by lower occupancy and COVID-19 related impacts, detailed below. Year-to-date, pro forma FFO per share was up 3% year-over-year.
COVID-19 Response Update
Aimco’s top priority is the health and safety of its residents and teammates. Accordingly, Aimco has implemented enhanced cleaning procedures as well as physical distancing and remote working guidelines at its communities and corporate offices. Additionally, seeing residents as individuals, each impacted differently by the pandemic and lockdown, Aimco teammates have undertaken to speak to every resident in need, to listen, and to help each to solve his or her problems. Aimco also seeks to assist the communities where its residents and employees live and work.
Aimco estimates that, in addition to decreased occupancy and lower rental rates, it incurred $9.5 million in the third quarter, $22.6 million year-to-date, of incremental costs. The table below provides additional detail.
| QTD 3Q 2020 | | YTD 3Q 2020 | |
FFO and AFFO Impacts ($ in millions) | $ | | $/sh | | $ | | $/sh | |
Incremental Bad Debt Expense | $ | 3.7 | | $ | 0.02 | | $ | 6.2 | | $ | 0.04 | |
Lower Commercial Revenue | | 2.2 | | | 0.01 | | | 3.7 | | | 0.02 | |
Lower Other Income, due to local restriction on charging late fees | | 0.4 | | | — | | | 1.0 | | | 0.01 | |
Other COVID-related amounts | | 0.2 | | | — | | | 1.0 | | | 0.01 | |
Property Level Impact | $ | 6.5 | | $ | 0.03 | | $ | 11.9 | | $ | 0.08 | |
Net Incremental Interest Expense | | 2.8 | | | 0.02 | | | 5.4 | | | 0.04 | |
Write-off of Commercial Straight-line Rent Receivables | | — | | | — | | | 2.9 | | | 0.02 | |
FFO Impact | $ | 9.3 | | $ | 0.05 | | $ | 20.2 | | $ | 0.14 | |
Write-off of Deferred Broker Commissions | | 0.2 | | | — | | | 2.4 | | | 0.02 | |
Total AFFO Impact | $ | 9.5 | | $ | 0.05 | | $ | 22.6 | | $ | 0.16 | |
3
Rent Collection Update
Residential Rent Collection – Aimco measures residential rent collection as the amount of payments received as a percentage of all residential amounts owed. The table below represents the percentage of second and third quarter 2020 residential billed amounts.
| 2020 | |
| 2nd Qtr. | | 3rd Qtr. | | July | | August | | September | |
Payments received during the period | | 95.3 | % | | 95.6 | % | | 95.8 | % | | 95.3 | % | | 95.7 | % |
Payments received after period close | | 2.4 | % | | 1.1 | % | | 1.5 | % | | 1.2 | % | | 0.7 | % |
Total payments received as of October 23, 2020 | | 97.7 | % | | 96.7 | % | | 97.3 | % | | 96.5 | % | | 96.4 | % |
In the third quarter, Aimco recognized 98.1% of all residential revenue treating the balance of 1.9% as bad debt. Of the 98.1% of residential revenue recognized, Aimco collected in cash all but 140 basis points. The amounts uncollected and not reserved as bad debt include balances collateralized by security deposits, of approximately 60 basis points, and those considered collectable based on Aimco review of individual customers’ credit, of approximately 80 basis points, or $1.6 million.
Of the 190 basis points of bad debt the majority, or approximately 130 basis points, is attributed to residents who have not paid April and subsequent rents. Prior to the enactment of restrictive city ordinances and closed court houses, these residents would have paid rent or faced eviction in ordinary course. The remaining amount, approximately 60 basis points, is attributed to non-payment of rent and other charges as might be expected in a difficult economy. The bad debt associated with this latter category started to slow in August and has declined in each subsequent month. Looking forward, we expect the decline to continue until reaching a more normal level of approximately 30 basis points in 2021. Aimco also expects the emergency ordinances that allow residents to live rent free to unwind providing the opportunity to re-rent these apartments to rent-paying residents.
October rent collections have been consistent with September collections at the same day of the month.
Operating Results: Third Quarter Same Store NOI Down 6.3%; Year-to-Date NOI Down 0.9%
| THIRD QUARTER | YEAR-TO-DATE |
| Year-over-Year | Sequential | Year-over-Year |
($ in millions) | 2020 | 2019 | Variance | 2nd Qtr. | Variance | 2020 | 2019 | Variance |
Revenue, before utility reimbursements | $161.4 | $169.7 | (4.9%) | $165.4 | (2.4%) | $497.6 | $501.6 | (0.8%) |
Expenses, net of utility reimbursements | 46.8 | 47.4 | (1.3%) | 45.2 | 3.5% | 137.0 | 137.8 | (0.6%) |
Net operating income (NOI) | $114.6 | $122.3 | (6.3%) | $120.2 | (4.7%) | $360.6 | $363.8 | (0.9%) |
4
Components of Same Store Revenue Growth – Same Store Revenue growth was impacted by lower average daily occupancy, increased bad debt expense, waived late fees, and reduced commercial rents. The table below summarizes the change in the components of Aimco Same Store revenue growth.
| | THIRD QUARTER | YEAR-TO-DATE |
Same Store Revenue Components | | Year-over-Year | Sequential | Year-over-Year |
Residential Rents | | | 0.3 | % | | | (0.8 | %) | | | 1.8 | % | |
Average Daily Occupancy | | | (2.8 | %) | | | (1.7 | %) | | | (1.1 | %) | |
Residential Net Rental Income | | | (2.5 | %) | | | (2.5 | %) | | | 0.7 | % | |
Bad Debt | | | (1.4 | %) | | | (0.3 | %) | | | (0.9 | %) | |
Late Fees and Other | | | (0.2 | %) | | | 0.8 | % | | | (0.2 | %) | |
Residential Revenue | | | (4.1 | %) | | | (2.0 | %) | | | (0.4 | %) | |
Commercial Revenue | | | (0.8 | %) | | | (0.4 | %) | | | (0.4 | %) | |
Third Quarter 2020 Same Store Revenue | | | (4.9 | %) | | | (2.4 | %) | | | (0.8 | %) | |
Same Store Rental Rates – Aimco measures changes in rental rates by comparing, on a lease-by-lease basis, the effective rate on a newly executed lease to the effective rate on the expiring lease for that same apartment. Newly executed leases are classified as either a new lease, where a vacant apartment is leased to a new customer, or as a renewal. The table below details changes in new and renewal lease rates, as well as the weighted-average (blended) lease rates for leases executed in the respective period.
| 3rd Qtr. | | Year-to-Date September 30, | | 2020 | |
| 2020 | | 2019 | | Variance | | 2020 | | 2019 | | Variance | | July | | August | | September | | October | |
Renewal rent changes | | 2.6 | % | | 4.8 | % | | (2.2 | %) | | 4.1 | % | | 5.1 | % | | (1.0 | %) | | 3.3 | % | | 2.0 | % | | 2.1 | % | | 1.4 | % |
New lease rent changes | | (7.6 | %) | | 2.3 | % | | (9.9 | %) | | (4.5 | %) | | 2.1 | % | | (6.6 | %) | | (5.6 | %) | | (7.7 | %) | | (9.6 | %) | | (10.0 | %) |
Weighted average rent changes | | (3.0 | %) | | 3.6 | % | | (6.6 | %) | | (0.3 | %) | | 3.6 | % | | (3.9 | %) | | (1.1 | %) | | (3.5 | %) | | (4.8 | %) | | (6.7 | %) |
Average Daily Occupancy | | 93.9 | % | | 96.7 | % | | (2.8 | %) | | 95.7 | % | | 96.8 | % | | (1.1 | %) | | 93.9 | % | | 93.7 | % | | 94.0 | % | | 94.2 | % |
*As of October 28, 2020. October results are considered preliminary.
Same Store Markets – Aimco’s portfolio is intentionally diversified by geography and price point, it is also diversified with a mix of urban and suburban communities. Third quarter revenue growth differed significantly based on geography and the density of the area surrounding the community.
Suburban properties include 19,083 units, or approximately 70% of Aimco’s Same Store portfolio. In these communities ADO was 95.7%, turnover was 39.6%, blended rates were near flat, and residential net rental income was up 0.6%.
Urban markets include 8,527 units of Aimco’s Same Store portfolio. In these communities ADO was 89.5%, turnover was 47.0%, blended rates were down 6.7%, and residential net rental income was down 7.1%.
Specifically, in Center City and University City Philadelphia, Aimco communities have faced a sharp decline in demand from local universities announcing virtual learning for the fall semester; fewer workers in downtown office buildings, including both Comcast towers, due to work from home policies; and disruption to leasing activity from social unrest.
In Mid-Wilshire and West Los Angeles, bad debt has been elevated due to local regulations which have the effect of permitting residents to live rent-free. Demand from the recovering entertainment industry is returning and leasing pace was up 44% year-over-year in the third quarter.
On the San Francisco Peninsula in Northern California, work from home policies at major tech companies disrupted demand in San Mateo and Redwood City. The Pacifica neighborhood was impacted but has stabilized and our communities in San Jose, Marin County, and the East Bay have performed well.
5
Redevelopment and Development
Redevelopment is Aimco’s second line of business where Aimco creates value by repositioning communities within the Aimco portfolio. Aimco also undertakes ground-up development when warranted by risk-adjusted investment returns, either directly or in connection with redevelopment of an existing apartment community. Aimco invests to earn risk-adjusted returns in excess of those expected from the apartment communities sold in “paired trades” to fund the redevelopment and development. Of these two activities, Aimco generally favors redevelopment because it permits adjustment of the scope and timing of spending to align with changing market conditions and customer preferences.
During the third quarter, Aimco invested $57 million in redevelopment and development. Aimco continued five long-cycle redevelopment and development projects already under construction, including the full redevelopment of the North Tower at Flamingo Point in Miami Beach, Florida, and 707 Leahy in Redwood City, California; and ground-up construction at The Fremont on the Anschutz Medical Campus in Aurora, Colorado; Eldridge Townhomes in Elmhurst, Illinois; and Prism in Cambridge, Massachusetts. Aimco’s estimated cost to complete these projects is $110 million, an amount readily funded from Aimco’s liquidity.
At Parc Mosaic in Boulder, Colorado, construction is complete and, as of October 28, 2020, Aimco has leased 97% of the apartment homes at rents consistent with underwriting.
At The Fremont, on the Anschutz Medical Campus, as of October 28, 2020, just over 100 apartment homes have been delivered and 82% have been leased. Completion of this 253-apartment home community is expected in the fourth quarter.
At Eldridge Townhomes in Elmhurst, Illinois, construction is now complete and 57 of the 58 have been leased.
At 707 Leahy in Redwood City, California, 60 of the 110 apartment homes have been completed and, as of October 28, 2020, 82% of those have been leased.
At Prism in Cambridge, Massachusetts, completion of this 136-apartment home property is expected in the first quarter of 2021.
During the third quarter, Aimco leased 144 redeveloped or newly developed apartment homes. At September 30, 2020, Aimco’s exposure to lease-up at long-cycle redevelopment and development communities was 684 apartment homes; 36 homes where construction is complete, 171 homes expected to be completed before year-end, and 477 homes expected to be delivered in 2021.
Portfolio Management
Aimco’s portfolio of apartment communities is diversified across “A,” “B,” and “C+” price points, averaging “B/B+” in quality and is also diversified across several of the largest markets in the United States.
Portfolio Strategy – Aimco follows a disciplined paired trade policy in making investments. As part of its portfolio strategy, Aimco seeks to sell up to 10% of its portfolio annually and to reinvest the proceeds from such sales in accretive uses such as capital enhancements, redevelopments, some developments, and selective acquisitions with projected Free Cash Flow internal rates of return higher than expected from the communities being sold. Aimco prefers well-located real estate where land is a significant percentage of total value and provides potential upside from development or redevelopment. Through this disciplined approach to capital recycling, Aimco increases the quality and expected growth rate of its portfolio.
6

| THIRD QUARTER |
| 2020 | 2019 | Variance |
Apartment Communities | 126 | 128 | (2) |
Apartment Homes | 33,209 | 33,824 | (615) |
Average Revenue per Apartment Home | $2,212 | $2,262 | (2%) |
Portfolio Average Rents as a Percentage of Local Market Average Rents | 112% | 113% | (1%) |
Percentage A (3Q 2020 Average Revenue per Apartment Home $2,872) | 53% | 52% | 1% |
Percentage B (3Q 2020 Average Revenue per Apartment Home $1,951) | 29% | 30% | (1%) |
Percentage C+ (3Q 2020 Average Revenue per Apartment Home $1,771) | 18% | 18% | —% |
NOI Margin* | 70% | 71% | (1%) |
Free Cash Flow Margin | 65% | 66% | (1%) |
* NOI margin is lower than Aimco’s Same Store NOI margin of 71% due primarily to the impact of Redevelopment communities that are not yet stabilized. As these communities stabilize, we expect NOI margin to be equal to, or better than, Aimco Same Store NOI margin.
Third Quarter Portfolio – For its entire portfolio, Aimco’s average monthly revenue per apartment home was $2,212 for third quarter 2020, a 2% decrease compared to third quarter 2019.
Acquisitions – Aimco follows a disciplined paired trade policy in making investments. Aimco evaluates potential acquisitions seeking Free Cash Flow internal rates of returns higher than those of the properties being sold. Aimco prefers well-located real estate where land is a significant percentage of total value and provides potential upside from development or redevelopment.
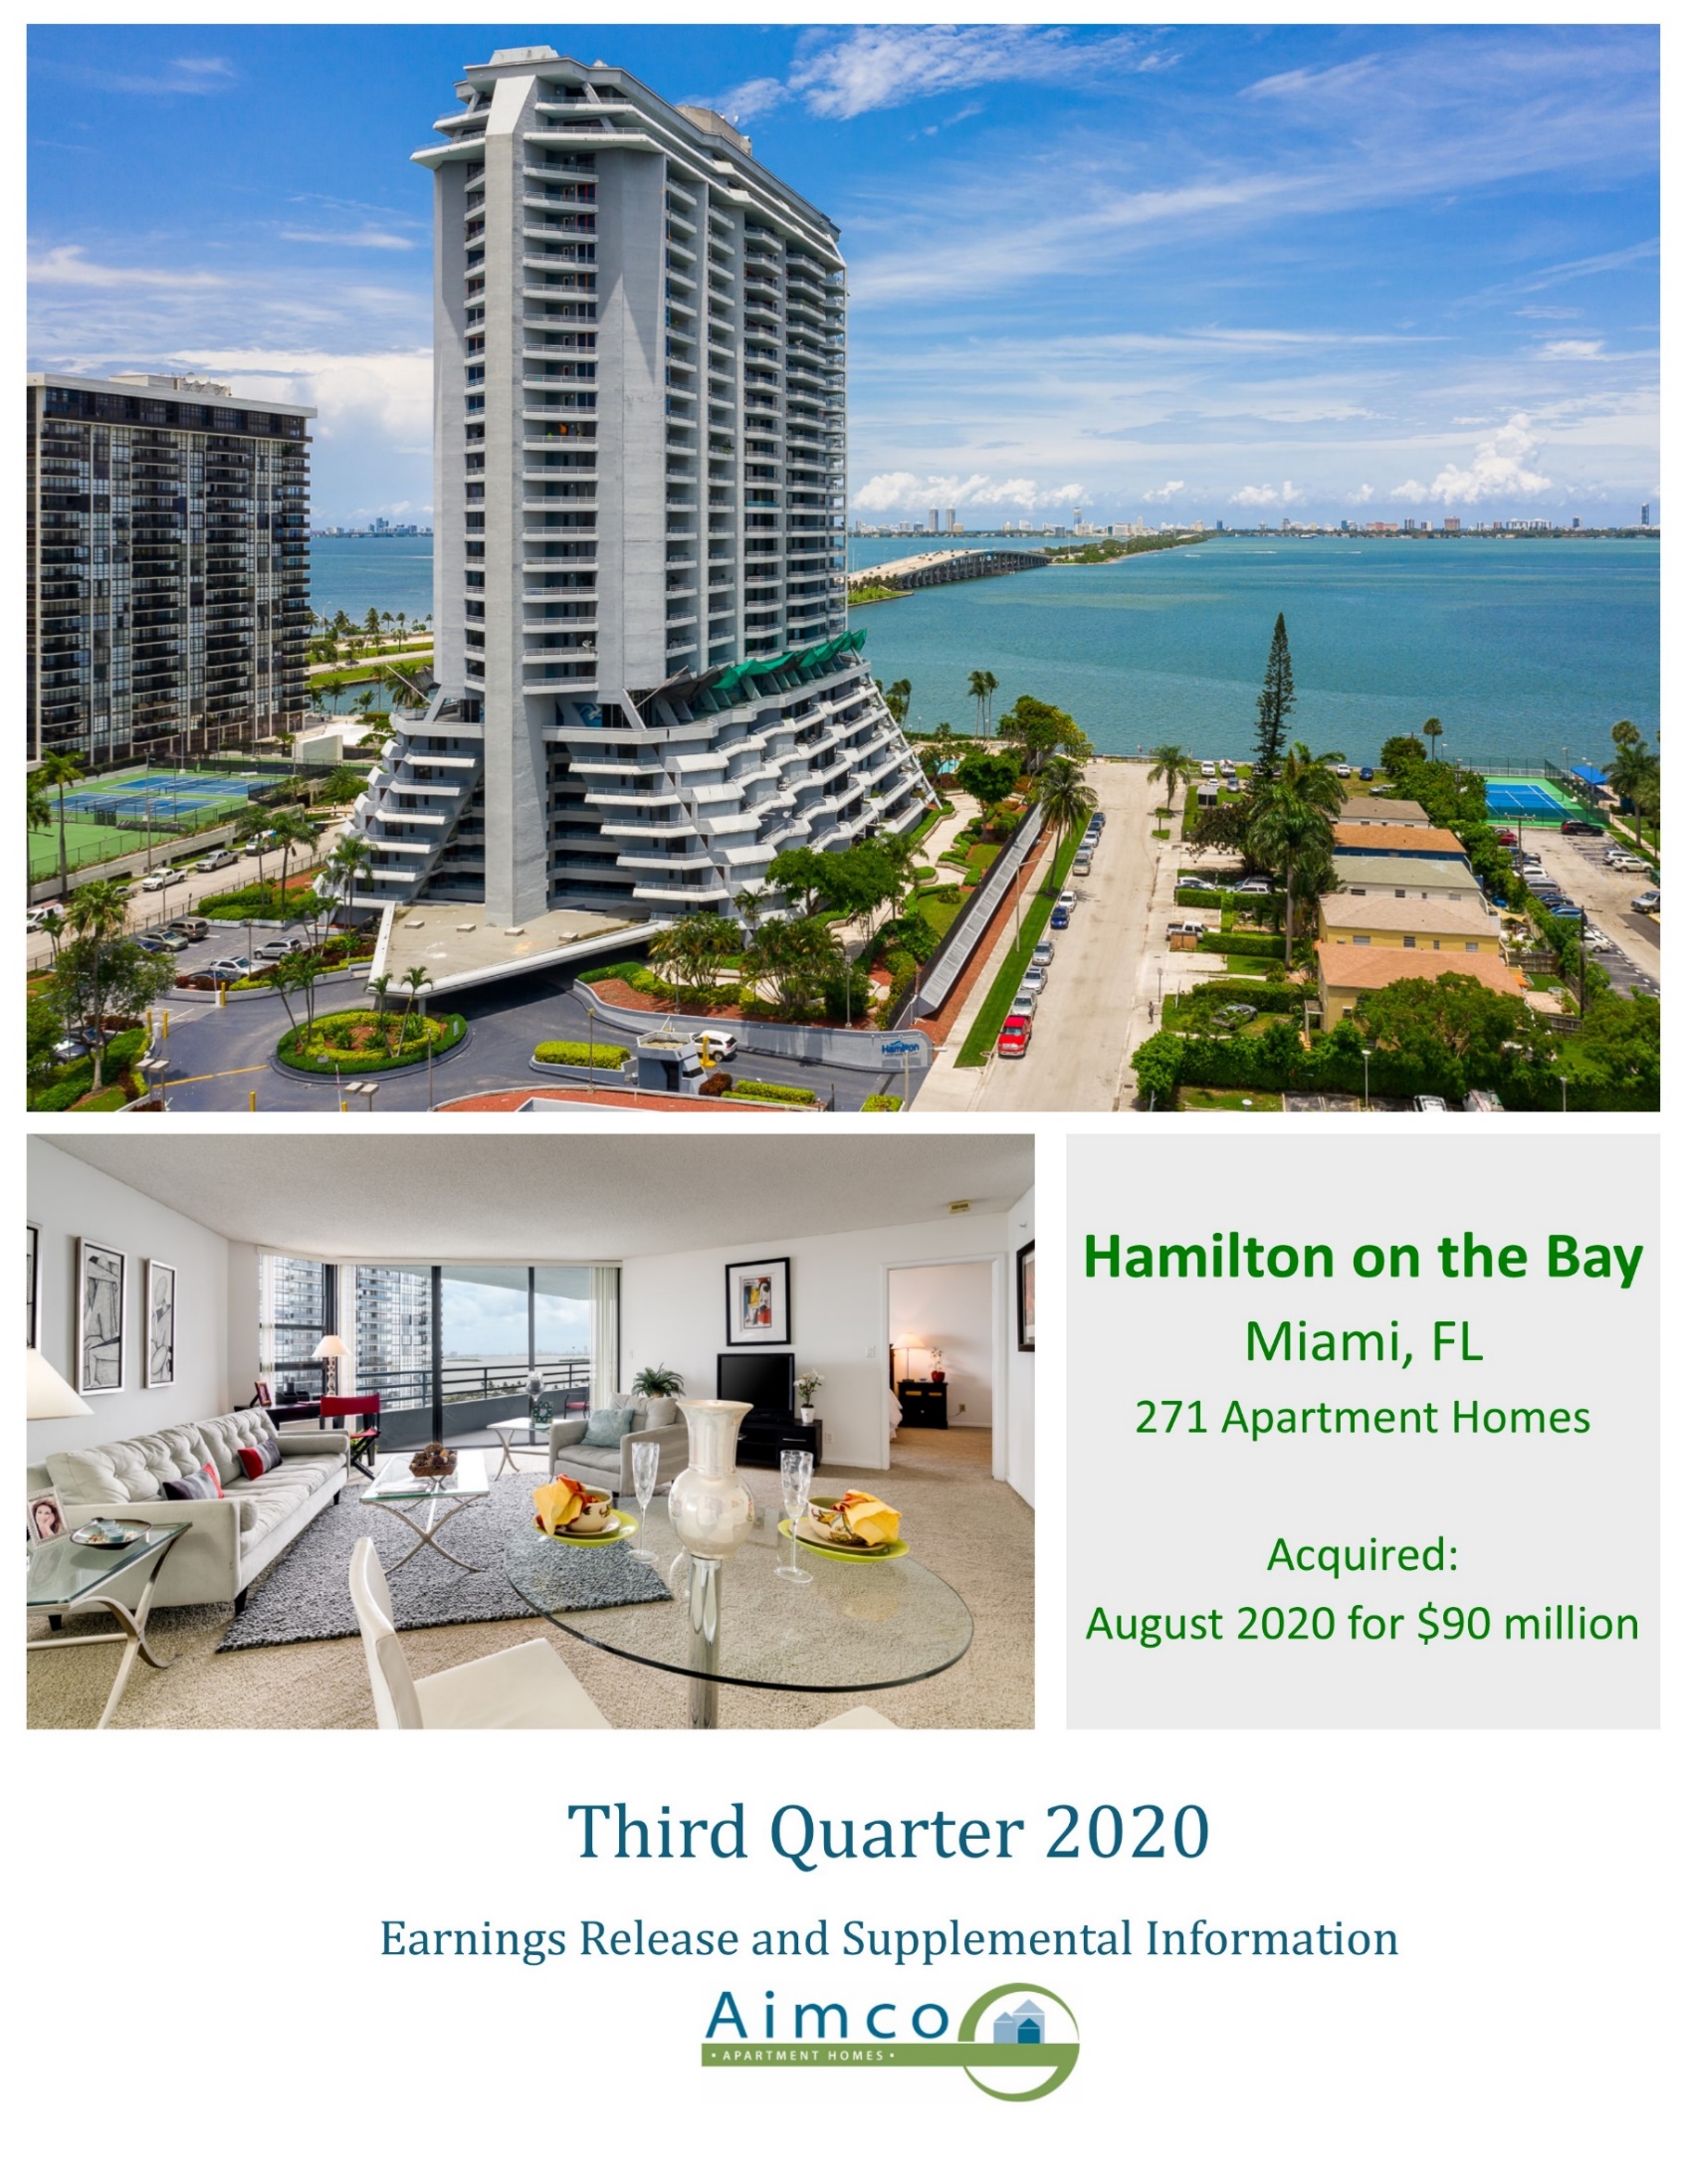
In the third quarter, Aimco acquired for $90 million, Hamilton on the Bay, located in Miami’s Edgewater neighborhood. The acquisition includes a 271-apartment home community located on the waterfront, approximately one mile north of Aimco’s Bay Parc apartments, plus an adjacent development site. Current zoning allows for the construction of more than 380 additional apartment homes on the combined sites. Aimco is now in planning to invest as much as $50 million in a substantial renovation of the existing building.
Aimco continues to search for accretive acquisitions, including development opportunities.
Dispositions – During the third quarter, we received a non-refundable deposit securing a contract to purchase an apartment community expected to be sold later in the fourth quarter at a price of $126 million, 3% better than its estimated gross asset value at December 31, 2019. Proceeds from this transaction are expected to be used to reduce leverage.
Year-to-date, Aimco has sold one apartment community generating net proceeds of $37 million.
Joint Venture Transaction – As previously announced, in September, Aimco formed a joint venture with a passive institutional investor to own a portfolio of 12 multi-family communities with 4,051 apartment homes located in California.
The properties were valued at $2.40 billion, or approximately $592,000 per unit, equivalent to an implied NOI cap rate of approximately 4.2%. The valuation is equal to 97% of Aimco’s pre-COVID-19 valuation of the properties and confirms Aimco’s previously published NAV. The joint venture has existing property debt of $1.22 billion and an implied equity value of $1.18 billion. In exchange for a 39% interest subject to $475 million of property debt, Aimco received $461 million. Aimco retains ownership of 61% of the joint venture and will control and operate the properties in exchange for property and asset management fees.
RBC Capital Markets acted as the Exclusive Financial Advisor to the joint venture.
Life Science Developer Investment – In the third quarter, Aimco made a $50 million commitment to IQHQ, a privately-held life-sciences real estate development company. In addition, Aimco gained the right to collaborate with IQHQ on any multifamily component at its future development sites.
7
Mezzanine Loan Investment – As previously announced, in December 2019, Aimco made a five-year, $275 million mezzanine loan to a partnership owning Parkmerced Apartments, located in southwest San Francisco. The loan bears interest at a 10% annual rate, accruing if not paid from property operations. In the third quarter, Aimco accrued all interest due, as provided by the loan agreement, consistent with GAAP, and considering that the loan is senior to approximately $300 million of borrower equity.
Balance Sheet
Aimco Leverage
Aimco seeks to increase financial returns by using leverage with appropriate caution. Aimco limits risk through its balance sheet structure, employing low leverage, primarily non-recourse and long-dated property debt; and Aimco builds financial flexibility by maintaining ample unused and available credit; holding properties with substantial value unencumbered by property debt; maintaining an investment grade rating; and using partners’ equity capital when it enhances financial returns or reduces investment risk.
Aimco leverage includes the Aimco share of long-term, non-recourse, property debt encumbering apartment communities, outstanding borrowings under the Aimco revolving credit facility, the term loan, and other leverage.
| | AS OF SEPTEMBER 30, 2020 | |
Proportionate, $ in Millions | | Amount | | | % of Total | | | Weighted Avg. Maturity (Yrs.)* | |
Aimco share of long-term, non-recourse property debt | | $ | 3,598 | | | | 89 | % | | | 8.2 | |
Term loan | | | 350 | | | | 9 | % | | | 0.6 | |
Other leverage* | | | 84 | | | | 2 | % | | | 9.6 | |
Total Leverage | | $ | 4,032 | | | | 100 | % | | | 7.6 | |
Cash, restricted cash, and investments in securitization trust assets | | | (348 | ) | | | | | | | | |
Net Leverage** | | $ | 3,684 | | | | | | | | | |
*Other leverage includes mezzanine equity instruments, including Aimco Preferred OP Units, redeemable at the holder’s option. Aimco has computed the weighted-average maturity of its total leverage assuming a 10-year maturity for its Preferred OP Units.
**During the third quarter, Aimco reduced Net Leverage by approximately $1 billion through the California Joint Venture transaction.
Leverage Ratios
Aimco target leverage ratios are Net Leverage to Adjusted EBITDAre below 7.0x and Adjusted EBITDAre to Interest Expense and Preferred Distributions greater than 2.5x.
| | Annualized Current Quarter | | Trailing Twelve Months |
Proportionate Debt to Adjusted EBITDAre | | 7.2x | | 6.8x |
Net Leverage to Adjusted EBITDAre | | 7.4x | | 7.0x |
Adjusted EBITDAre to Adjusted Interest Expense | | 3.1x | | 3.4x |
Adjusted EBITDAre to Adjusted Interest Expense and Preferred Distributions | | 3.0x | | 3.2x |
Under its revolving credit facility and term loan, Aimco has agreed to maintain a fixed charge coverage ratio of 1.40x, as well as other covenants customary for similar revolving credit arrangements. For the period ended September 30, 2020, Aimco’s fixed charge coverage ratio was 1.93x. Aimco expects to remain in compliance with its covenants.
8
Financing Activity
During the third quarter, Aimco prepaid $405 million of property debt using proceeds from the previously announced joint venture, incurring $7.8 million in prepayment penalties that have been excluded from Pro forma FFO. The loans had a weighted-average interest rate of 5.3%, lowering Aimco’s weighted-average cost of leverage by 15 basis points. The prepayment of property debt lowers Aimco’s interest expense such that the costs associated with the prepayment will be recovered in the first quarter of 2021. Aimco has no remaining debt maturities in 2020.
Liquidity
Aimco uses its credit facility primarily for working capital and other short-term purposes and to secure letters of credit. At September 30, 2020, Aimco’s share of cash and restricted cash was $249 million and it had the capacity to borrow up to $793 million under its revolving credit facility, bringing total liquidity to more than $1.0 billion.
Aimco also manages its financial flexibility by maintaining an investment grade rating and holding communities that are unencumbered by property debt. As of September 30, 2020, Aimco held unencumbered communities with an estimated fair market value of approximately $3.6 billion.
Special Dividend
2020 property sales, including the California Joint Venture, generated taxable gains in excess of the company’s regular quarterly dividend. On October 21, 2020 Aimco’s Board of Directors declared a $8.20 special dividend in the form of cash and stock.
The special dividend includes the next two quarterly cash dividends, or $0.82 per share in the aggregate, accelerating the payment of the regular dividend expected in February of 2021. Additionally, shareholders in the aggregate will receive $7.38 per share in stock.
The dividend will be payable to shareholders of record on the close of business on November 4, 2020, with shareholders having the opportunity to elect to receive the special dividend in the form of all stock or prorated cash and stock, and will be paid on November 30, 2020, after trading hours. The number of shares distributed in the special dividend will be determined by the volume weighted average price (“VWAP”) of AIV shares during the 10-trading day period ending on November 24, 2020.
In order to neutralize the dilutive impact of the stock issued in the special dividend, Aimco's Board also authorized a reverse stock split, effective on November 30, 2020, immediately following the special dividend. As a result, total shares outstanding following completion of both the special dividend and the reverse stock split are expected to be unchanged from the total shares outstanding immediately prior to the dividend. Some stockholders may have more Aimco shares and some may have fewer based on their individual elections. The reverse split will ensure comparability of Aimco per share results before and after these transactions.
9
Earnings Conference Call Information
Live Conference Call: | Conference Call Replay: |
Friday, October 30, 2020 at 1:00 p.m. ET | Replay available until January 30, 2021 |
Domestic Dial-In Number: 1-888-317-6003 | Domestic Dial-In Number: 1-877-344-7529 |
International Dial-In Number: 1-412-317-6061 | International Dial-In Number: 1-412-317-0088 |
Passcode: 1880227 | Passcode: 10149062 |
Live webcast and replay: investors.aimco.com | |
|
Supplemental Information
The full text of this Earnings Release and the Supplemental Information referenced in this release are available on Aimco’s website at investors.aimco.com.
Glossary & Reconciliations of Non-GAAP Financial and Operating Measures
Financial and operating measures found in this Earnings Release and the Supplemental Information include certain financial measures used by Aimco management that are measures not defined under accounting principles generally accepted in the United States, or GAAP. Certain Aimco terms and Non-GAAP measures are defined in the Glossary in the Supplemental Information and Non-GAAP measures reconciled to the most comparable GAAP measures.
About Aimco
Aimco is a real estate investment trust focused on the ownership and management of quality apartment communities located in select markets in the United States. Aimco is one of the country’s largest owners and operators of apartments, with ownership interests in 126 apartment communities in 17 states and the District of Columbia. Aimco common shares are traded on the New York Stock Exchange under the ticker symbol AIV and are included in the S&P 500. For more information about Aimco, please visit our website at www.aimco.com.
Contact
Matt Foster, Director, Investor Relations
Investor Relations 303-793-4661, investor@aimco.com
10
Forward-looking Statements
This Earnings Release and Supplemental Information contain forward-looking statements within the meaning of the federal securities laws, including, without limitation, statements regarding projected results and specifically forecasts of 2020 and 2021 results, including but not limited to: Nareit FFO, Pro forma FFO and selected components thereof; AFFO; Aimco redevelopment and development investments and projected yield on such investments, timelines, and Net Operating Income contribution; expectations regarding sales of Aimco apartment communities and the use of proceeds thereof; Aimco liquidity and leverage metrics; statements regarding Aimco’s and AIR’s portfolio composition and their relationship following the separation; the anticipated timing, structure and benefits of the separation; and future dividends. In addition, we may not complete the separation at all. We caution investors not to place undue reliance on any such forward-looking statements.
These forward-looking statements are based on management’s judgment as of this date, which is subject to risks and uncertainties. Risks and uncertainties that could cause actual results to differ materially from our expectations include, but are not limited to: whether or not Aimco completes the separation on anticipated terms or at all; the effects of the coronavirus pandemic on Aimco’s and AIR’s business and on the global and U.S. economies generally, and the ongoing, dynamic and uncertain nature and duration of the pandemic, all of which heightens the impact of the other risks and factors described herein, and the impact on entities in which Aimco holds a partial interest, including its interest in the partnership that owns Parkmerced Apartments, and the impact of the lockdown on Aimco’s residents, commercial tenants, and operations; real estate and operating risks, including fluctuations in real estate values and the general economic climate in the markets in which we operate and competition for residents in such markets; national and local economic conditions, including the pace of job growth and the level of unemployment; the amount, location and quality of competitive new housing supply; the timing and effects of acquisitions, dispositions, redevelopments and developments; changes in operating costs, including energy costs; negative economic conditions in our geographies of operation; loss of key personnel; Aimco’s or AIR’s ability to maintain current or meet projected occupancy, rental rate and property operating results; Aimco’s or AIR’s ability to meet budgeted costs and timelines, and, if applicable, achieve budgeted rental rates related to redevelopment and development investments; expectations regarding sales of apartment communities and the use of proceeds thereof; the ability to successfully operate as two separate companies each with more narrowed focus; insurance risks, including the cost of insurance, and natural disasters and severe weather such as hurricanes; financing risks, including the availability and cost of financing; the risk that cash flows from operations may be insufficient to meet required payments of principal and interest; the risk that earnings may not be sufficient to maintain compliance with debt covenants, including financial coverage ratios; legal and regulatory risks, including costs associated with prosecuting or defending claims and any adverse outcomes; the terms of laws and governmental regulations that affect us and interpretations of those laws and regulations; possible environmental liabilities, including costs, fines or penalties that may be incurred due to necessary remediation of contamination of apartment communities presently or previously owned by Aimco; Aimco’s and AIR’s relationship with each other after the consummation of the business separation; the ability and willingness of Aimco and AIR and their subsidiaries to meet and/or perform their obligations under any contractual arrangements that are entered into among the parties in connection with the business separation and any of their obligations to indemnify, defend and hold the other party harmless from and against various claims, litigation and liabilities; and the ability to achieve some or all the benefits that we expect to achieve from the business separation; and such other risks and uncertainties described from time to time in filings by Aimco or AIR with the Securities and Exchange Commission.
In addition, Aimco’s current and continuing qualification as a real estate investment trust involves the application of highly technical and complex provisions of the Internal Revenue Code and depends on Aimco’s ability to meet the various requirements imposed by the Internal Revenue Code, through actual operating results, distribution levels and diversity of stock ownership.
Readers should carefully review Aimco’s financial statements and the notes thereto, as well as the section entitled “Risk Factors” in Item 1A of Aimco’s Annual Report on Form 10-K for the year ended December 31, 2019 and the section entitled “Risk Factors” in Item 1A of Aimco’s Quarterly Report on Form 10-Q for the quarter ended June 30, 2020, and the other documents Aimco files from time to time with the Securities and Exchange Commission. Readers should also carefully review the “Risk Factors” section of the registration statements relating to the business separation, which are expected to be filed with the Securities and Exchange Commission. These filings identify and address other important risks and uncertainties that could cause actual events and results to differ materially from those contained in the forward-looking statements.
These forward-looking statements reflect management’s judgment as of this date, and Aimco assumes no obligation to revise or update them to reflect future events or circumstances. This press release does not constitute an offer of securities for sale.
11
Consolidated Statements of Operations
(in thousands, except per share data) (unaudited)
| | Three Months Ended September 30, | | | Nine Months Ended September 30, | |
| | 2020 | | | 2019 | | | 2020 | | | 2019 | |
REVENUES | | | | | | | | | | | | | | | | |
Rental and other property revenues | | $ | 215,455 | | | $ | 229,827 | | | $ | 658,815 | | | $ | 684,262 | |
| | | | | | | | | | | | | | | | |
OPERATING EXPENSES | | | | | | | | | | | | | | | | |
Property operating expenses | | | 74,929 | | | | 77,484 | | | | 224,532 | | | | 232,090 | |
Depreciation and amortization | | | 98,249 | | | | 97,538 | | | | 296,414 | | | | 283,027 | |
General and administrative expenses | | | 8,118 | | | | 10,595 | | | | 27,922 | | | | 31,922 | |
Investment management expenses | | | 2,819 | | | | 1,581 | | | | 5,124 | | | | 4,319 | |
Other expenses, net [1] | | | 17,571 | | | �� | 4,002 | | | | 23,452 | | | | 12,759 | |
Total operating expenses | | | 201,686 | | | | 191,200 | | | | 577,444 | | | | 564,117 | |
Interest income | | | 3,041 | | | | 2,824 | | | | 10,407 | | | | 8,615 | |
Interest expense [2] | | | (50,519 | ) | | | (42,011 | ) | | | (140,657 | ) | | | (122,961 | ) |
Gain on dispositions of real estate | | | — | | | | 1,146 | | | | 47,204 | | | | 356,929 | |
Mezzanine investment income, net | | | 6,870 | | | | — | | | | 20,553 | | | | — | |
Income from unconsolidated real estate partnerships | | | 277 | | | | 288 | | | | 629 | | | | 591 | |
(Loss) income before income tax benefit | | | (26,562 | ) | | | 874 | | | | 19,507 | | | | 363,319 | |
Income tax benefit | | | 1,747 | | | | 3,096 | | | | 7,859 | | | | 1,942 | |
Net (loss) income | | | (24,815 | ) | | | 3,970 | | | | 27,366 | | | | 365,261 | |
Noncontrolling interests: | | | | | | | | | | | | | | | | |
Net loss (income) attributable to noncontrolling interests in consolidated real estate partnerships | | | 154 | | | | 58 | | | | 153 | | | | (103 | ) |
Net income attributable to preferred noncontrolling interests in Aimco OP | | | (1,687 | ) | | | (1,933 | ) | | | (5,415 | ) | | | (5,800 | ) |
Net loss (income) attributable to common noncontrolling interests in Aimco OP | | | 1,341 | | | | (116 | ) | | | (1,134 | ) | | | (18,787 | ) |
Net income attributable to noncontrolling interests | | | (192 | ) | | | (1,991 | ) | | | (6,396 | ) | | | (24,690 | ) |
Net (loss) income attributable to Aimco | | | (25,007 | ) | | | 1,979 | | | | 20,970 | | | | 340,571 | |
Net income attributable to Aimco preferred stockholders | | | — | | | | — | | | | — | | | | (7,335 | ) |
Net (income) loss attributable to participating securities | | | (39 | ) | | | 24 | | | | (125 | ) | | | (431 | ) |
Net (loss) income attributable to Aimco common stockholders | | $ | (25,046 | ) | | $ | 2,003 | | | $ | 20,845 | | | $ | 332,805 | |
Net (loss) income attributable to Aimco per common share – basic and diluted | | $ | (0.17 | ) | | $ | 0.01 | | | $ | 0.14 | | | $ | 2.26 | |
| | | | | | | | | | | | | | | | |
Weighted-average common shares outstanding – basic | | | 148,544 | | | | 148,434 | | | | 148,532 | | | | 147,474 | |
Weighted-average common shares outstanding – diluted | | | 148,544 | | | | 148,636 | | | | 148,628 | | | | 147,692 | |
[1] | Other expenses, net, for the three and nine months ended September 30, 2020, is inclusive of $11.9 million and $12.6 million, respectively, of transaction costs related to the separation of Aimco’s development activities. |
[2] | Interest expense for the three and nine months ended September 30, 2020, is inclusive of $7.9 million and $14.5 million, respectively, of prepayment penalties related to debt prepaid during the year. |
Included in net income for the three and nine months ended September 30, 2020 are the $9.5 million and $22.6 million, respectively, of COVID-19 related impacts detailed in the COVID-19 Response Update included in this earnings release.
12
Consolidated Balance Sheets
(in thousands) (unaudited)
| | September 30, | | | December 31, | |
| | 2020 | | | 2019 | |
Assets | | | | | | | | |
Real estate | | $ | 8,898,158 | | | $ | 8,737,591 | |
Accumulated depreciation | | | (2,858,174 | ) | | | (2,718,284 | ) |
Net real estate | | | 6,039,984 | | | | 6,019,307 | |
Cash and cash equivalents | | | 228,368 | | | | 142,902 | |
Restricted cash | | | 40,123 | | | | 34,800 | |
Mezzanine investment | | | 300,326 | | | | 280,258 | |
Goodwill | | | 37,808 | | | | 37,808 | |
Other assets | | | 345,490 | | | | 313,664 | |
Assets held for sale | | | 50,030 | | | | — | |
Total Assets | | $ | 7,042,129 | | | $ | 6,828,739 | |
| | | | | | | | |
Liabilities and Equity | | | | | | | | |
Non-recourse property debt | | $ | 4,079,251 | | | $ | 4,251,339 | |
Debt issue costs | | | (20,956 | ) | | | (20,749 | ) |
Non-recourse property debt, net | | | 4,058,295 | | | | 4,230,590 | |
Term loan, net | | | 348,502 | | | | — | |
Revolving credit facility borrowings | | | — | | | | 275,000 | |
Accrued liabilities and other | | | 356,538 | | | | 360,574 | |
Liabilities related to assets held for sale | | | 58,177 | | | | — | |
Total Liabilities | | | 4,821,512 | | | | 4,866,164 | |
| | | | | | | | |
Preferred noncontrolling interests in Aimco OP | | | 79,449 | | | | 97,064 | |
Redeemable noncontrolling interests in consolidated real estate partnership | | | 4,371 | | | | 4,716 | |
| | | | | | | | |
Equity: | | | | | | | | |
Class A Common Stock | | | 1,489 | | | | 1,489 | |
Additional paid-in capital | | | 4,000,925 | | | | 3,497,367 | |
Accumulated other comprehensive income | | | 3,579 | | | | 4,195 | |
Distributions in excess of earnings | | | (1,884,602 | ) | | | (1,722,402 | ) |
Total Aimco equity | | | 2,121,391 | | | | 1,780,649 | |
Noncontrolling interests in consolidated real estate partnerships | | | (60,212 | ) | | | (3,296 | ) |
Common noncontrolling interests in Aimco OP | | | 75,618 | | | | 83,442 | |
Total Equity | | | 2,136,797 | | | | 1,860,795 | |
Total Liabilities and Equity | | $ | 7,042,129 | | | $ | 6,828,739 | |
13
Supplemental Schedule 1
Funds From Operations and Adjusted Funds From Operations Reconciliation | (Page 1 of 2) |
Three and Nine Months Ended September 30, 2020 Compared to Three and Nine Months Ended September 30, 2019
(in thousands, except per share data) (unaudited)
Aimco believes that Economic Income (defined as Net Asset Value, or NAV, growth plus dividends) is an important measure of long-term financial performance. NAV is a non-GAAP measure and represents the estimated fair value of assets net of liabilities attributable to Aimco common stockholders. NAV is used by many investors because the value of company assets can be readily estimated, even for non-earning assets such as land or properties under development. NAV has the advantage of incorporating the investment decisions of thousands of real estate investors, enhancing comparability among companies that have differences in their accounting, and avoiding disparity that can result from application of GAAP to investment properties and various ownership structures. NAV also provides real estate investors a basis for the perceived quality and predictability of future cash flows as well as their expected growth. Some investors focus on multiples of AFFO and FFO. Aimco’s disclosure of AFFO and FFO complements its focus on Economic Income.
| | Three Months Ended September 30, | | | Nine Months Ended September 30, | |
| | 2020 | | | 2019 | | | 2020 | | | 2019 | |
Net (loss) income attributable to Aimco common stockholders | | $ | (25,046 | ) | | $ | 2,003 | | | $ | 20,845 | | | $ | 332,805 | |
Adjustments: | | | | | | | | | | | | | | | | |
Real estate depreciation and amortization, net of noncontrolling partners’ interest | | | 94,489 | | | | 95,199 | | | | 287,390 | | | | 276,353 | |
Gain on dispositions and other, net of noncontrolling partners’ interest | | | — | | | | (1,146 | ) | | | (47,204 | ) | | | (356,929 | ) |
Income tax adjustments related to gain on dispositions and other tax-related items [1] | | | 2,020 | | | | 415 | | | | 2,398 | | | | 7,151 | |
Common noncontrolling interests in Aimco OP’s share of above adjustments | | | (4,911 | ) | | | (4,931 | ) | | | (12,453 | ) | | | 3,962 | |
Amounts allocable to participating securities | | | — | | | | (142 | ) | | | (54 | ) | | | 101 | |
Nareit FFO attributable to Aimco common stockholders | | $ | 66,552 | | | $ | 91,398 | | | $ | 250,922 | | | $ | 263,443 | |
Adjustments, all net of common noncontrolling interests in Aimco OP and participating securities: | | | | | | | | | | | | | | | | |
Separation costs [2] | | | 11,218 | | | | — | | | | 11,930 | | | | — | |
Transaction costs [3] | | | 2,485 | | | | — | | | | 2,485 | | | | — | |
Prepayment penalties, net [4] | | | 7,311 | | | | 1,604 | | | | 13,514 | | | | 1,604 | |
Straight line rent [5] | | | 634 | | | | 635 | | | | 1,902 | | | | 3,590 | |
Preferred equity redemption related amounts [6] | | | — | | | | — | | | | — | | | | 3,864 | |
Severance costs, litigation, and other [7] | | | 1,891 | | | | 1,465 | | | | 2,912 | | | | 2,071 | |
Pro forma FFO attributable to Aimco common stockholders | | $ | 90,091 | | | $ | 95,102 | | | $ | 283,665 | | | $ | 274,572 | |
Capital Replacements, net of common noncontrolling interests in Aimco OP and participating securities | | | (11,398 | ) | | | (11,434 | ) | | | (34,406 | ) | | | (34,273 | ) |
AFFO attributable to Aimco common stockholders | | $ | 78,693 | | | $ | 83,668 | | | $ | 249,259 | | | $ | 240,299 | |
| | | | | | | | | | | | | | | | |
Weighted average common shares outstanding – basic | | | 148,544 | | | | 148,434 | | | | 148,532 | | | | 147,474 | |
Dilutive common share equivalents | | | — | | | | 202 | | | | 96 | | | | 218 | |
Total shares and dilutive share equivalents used to calculate Net income and Nareit FFO per share | | | 148,544 | | | | 148,636 | | | | 148,628 | | | | 147,692 | |
Adjustment to weight reverse stock split [8] | | | — | | | | — | | | | — | | | | 828 | |
Pro forma shares and dilutive share equivalents used to calculate Pro forma FFO and AFFO per share | | | 148,544 | | | | 148,636 | | | | 148,628 | | | | 148,520 | |
| | | | | | | | | | | | | | | | |
Net (loss) income attributable to Aimco per common share – diluted | | $ | (0.17 | ) | | $ | 0.01 | | | $ | 0.14 | | | $ | 2.26 | |
Nareit FFO per share – diluted | | $ | 0.45 | | | $ | 0.61 | | | $ | 1.69 | | | $ | 1.78 | |
Pro forma FFO per share – diluted | | $ | 0.61 | | | $ | 0.64 | | | $ | 1.91 | | | $ | 1.85 | |
AFFO per share – diluted | | $ | 0.53 | | | $ | 0.56 | | | $ | 1.68 | | | $ | 1.62 | |
Please see the following page for footnote descriptions.
14
Supplemental Schedule 1
Funds From Operations and Adjusted Funds From Operations Reconciliation | (Page 2 of 2) |
[1] | For the three and nine months ended September 30, 2020, income tax adjustments related to gain on dispositions and other tax-related items primarily include an increase in tax liability related to previous sales transactions. There were no property dispositions in the three months ended September 30, 2020 and September 30, 2019. |
[2] | During 2020, Aimco incurred costs in connection with the separation of its development platform. Aimco excluded these costs from Pro forma FFO because it believes they are not representative of ongoing operating performance. |
[3] | During 2020, Aimco incurred certain transaction costs related to the California joint venture and other new business pursuits. Aimco excluded these costs from Pro forma FFO because it believes they are not representative of ongoing operating performance. |
[4] | As a result of refinancing activity, Aimco incurred debt extinguishment costs, net of income tax effect. Aimco excluded such costs from Pro forma FFO because it believes these costs are not representative of ongoing operating performance. |
[5] | In 2018, Aimco assumed a 99-year ground lease with scheduled rent increases. Due to the terms of the lease, GAAP rent expense will exceed cash rent payments until 2076. Aimco includes the cash rent payments for this ground lease in Pro forma FFO but excludes the incremental straight-line non-cash rent expense. The rent expense for this lease is included in other expenses, net, on Aimco’s Consolidated Statements of Operations. |
[6] | On May 16, 2019, Aimco redeemed its Class A Perpetual Preferred Stock. Aimco excluded the redemption-related amounts from Pro forma FFO because it believes these costs are not representative of operating performance. |
[7] | In 2019, Aimco incurred severance and restructuring costs, costs related to its litigation with Airbnb, and other non-recurring costs. In 2020, Aimco incurred an unrealized loss on a derivative agreement and other non-recurring costs. Aimco excluded these costs from Pro forma FFO because it believes they are not representative of current operating performance. These costs are included in other expenses, net, on Aimco’s Consolidated Statements of Operations. |
[8] | During the first quarter 2019, Aimco completed a reverse stock split and a special dividend paid primarily in stock. For stock splits, GAAP requires the restatement of weighted average shares as if the reverse stock split occurred at the beginning of the period presented; while shares issued in the special dividend are included in weighted average shares outstanding from the date issued. To minimize confusion and facilitate comparison of period-over-period Pro forma FFO and AFFO, Aimco calculated pro forma weighted average shares for 2019 based on the effective date of the reverse stock split and ex-dividend date for the shares issued in the special dividend, thereby eliminating the per share impact of the GAAP treatment to Aimco’s reported Pro forma FFO and AFFO. |
15
Supplemental Schedule 2(a)
Funds From Operations and Adjusted Funds From Operations Information | (Page 1 of 2) |
Three and Nine Months Ended September 30, 2020 Compared to Three and Nine Months Ended September 30, 2019
(consolidated amounts, in thousands) (unaudited)
| | Three Months Ended September 30, | | | Nine Months Ended September 30, | |
| | 2020 | | | 2019 | | | 2020 | | | 2019 | |
Real estate operations [1] | | | | | | | | | | | | | | | | |
Revenues, before utility reimbursements | | | | | | | | | | | | | | | | |
Same Store | | $ | 174,530 | | | $ | 183,876 | | | $ | 538,521 | | | $ | 543,638 | |
Redevelopment/Development | | | 12,498 | | | | 11,131 | | | | 36,000 | | | | 37,958 | |
Acquisition and Other Real Estate [2] | | | 17,842 | | | | 19,242 | | | | 55,166 | | | | 48,221 | |
Total revenues, before utility reimbursements | | | 204,870 | | | | 214,249 | | | | 629,687 | | | | 629,817 | |
Expenses, net of utility reimbursements | | | | | | | | | | | | | | | | |
Same Store | | | 50,121 | | | | 50,500 | | | | 146,370 | | | | 147,130 | |
Redevelopment/Development | | | 4,919 | | | | 4,492 | | | | 14,635 | | | | 14,780 | |
Acquisition and Other Real Estate [2] | | | 7,331 | | | | 7,074 | | | | 20,690 | | | | 17,912 | |
Total expenses, net of utility reimbursements | | | 62,371 | | | | 62,066 | | | | 181,695 | | | | 179,822 | |
Property net operating income | | | 142,499 | | | | 152,183 | | | | 447,992 | | | | 449,995 | |
Property management expenses | | | (3,721 | ) | | | (4,715 | ) | | | (13,167 | ) | | | (14,471 | ) |
Casualties | | | 184 | | | | (497 | ) | | | (3,415 | ) | | | (4,485 | ) |
Other expenses, net [3] | | | (2,669 | ) | | | (1,404 | ) | | | (12,028 | ) | | | (6,934 | ) |
Interest expense on non-recourse property debt [4] | | | (38,953 | ) | | | (37,784 | ) | | | (115,797 | ) | | | (114,259 | ) |
Interest income | | | 2,265 | | | | 2,084 | | | | 6,652 | | | | 6,128 | |
NOI related to sold and held for sale communities [5] | | | 1,565 | | | | 5,370 | | | | 5,764 | | | | 21,133 | |
Total contribution from real estate operations | | | 101,170 | | | | 115,237 | | | | 316,001 | | | | 337,107 | |
| | | | | | | | | | | | | | | | |
General and administrative expenses, net | | | (8,118 | ) | | | (10,595 | ) | | | (27,922 | ) | | | (31,922 | ) |
Investment management expenses | | | (2,819 | ) | | | (1,581 | ) | | | (5,124 | ) | | | (4,319 | ) |
Depreciation and amortization related to non-real estate assets | | | (2,133 | ) | | | (2,006 | ) | | | (6,728 | ) | | | (6,128 | ) |
Mezzanine investment income, net | | | 6,870 | | | | — | | | | 20,553 | | | | — | |
Other expenses, net [6] | | | (14,126 | ) | | | (1,805 | ) | | | (10,560 | ) | | | (3,471 | ) |
Interest expense on corporate borrowings [7] | | | (3,638 | ) | | | (2,443 | ) | | | (10,389 | ) | | | (6,919 | ) |
Prepayment penalties related to non-recourse property debt | | | (7,928 | ) | | | (1,784 | ) | | | (14,471 | ) | | | (1,784 | ) |
Tax benefit, net | | | 3,768 | | | | 3,511 | | | | 10,257 | | | | 9,093 | |
Preferred dividends and distributions and related redemption costs | | | (1,687 | ) | | | (1,933 | ) | | | (5,415 | ) | | | (13,135 | ) |
Common noncontrolling interests in Aimco OP | | | (3,570 | ) | | | (5,048 | ) | | | (13,587 | ) | | | (14,826 | ) |
Proportionate adjustments | | | (1,237 | ) | | | (155 | ) | | | (1,693 | ) | | | (253 | ) |
Nareit FFO attributable to Aimco common stockholders | | $ | 66,552 | | | $ | 91,398 | | | $ | 250,922 | | | $ | 263,443 | |
Total pro forma adjustments, net of common noncontrolling interests in Aimco OP and participating securities [8] | | | 23,539 | | | | 3,704 | | | | 32,743 | | | | 11,129 | |
Pro forma FFO attributable to Aimco common stockholders | | $ | 90,091 | | | $ | 95,102 | | | $ | 283,665 | | | $ | 274,572 | |
Capital Replacements, net of common noncontrolling interests in Aimco OP and participating securities [9] | | | (11,398 | ) | | | (11,434 | ) | | | (34,406 | ) | | | (34,273 | ) |
AFFO attributable to Aimco common stockholders | | $ | 78,693 | | | $ | 83,668 | | | $ | 249,259 | | | $ | 240,299 | |
Please see the following page for footnote descriptions
16
Supplemental Schedule 2(a) (continued)
Funds From Operations and Adjusted Funds From Operations Information | (Page 2 of 2) |
[1] | Contribution from real estate operations consists of property net operating income and other items of income or expense that relate to Aimco’s portfolio, including property management expenses, casualty losses, interest expense related to non-recourse property debt encumbering the communities in this portfolio, and interest income Aimco earns on its investment in a securitization trust that holds certain Aimco property debt. |
For the three and nine months ended September 30, 2020, Aimco incurred $9.5 million and $22.6 million, respectively, of COVID-19 related impacts, detailed in the COVID-19 Response Update included in this earnings release.
[2] | Acquisition and Other Real Estate consists of communities that Aimco has acquired since January 1, 2019, as well as communities subject to limitations on rent increases, communities that Aimco expects to sell within 12 months that do not meet the criteria to be classified as held for sale, communities that Aimco expects to redevelop, and certain commercial spaces. For the three and nine months ended September 30, 2020, Acquisition and Other Real Estate revenues and expenses are also inclusive of the operating results of 1001 Brickell Bay Drive, acquired July 2019. |
[3] | For the nine months ended September 30, 2020, other expenses, net, in contribution from real estate operations includes the write-off of $2.9 million of Aimco’s straight-line rent receivables for certain commercial tenants for which collectability of future rental revenue is uncertain. In accordance with GAAP, this write-off is included in rental and other property revenues in the consolidated statements of operations. |
[4] | Interest expense for the three and nine months ended September 30, 2020, contains $0.6 million and $2.2 million, respectively, of interest expense related to sold and held for sale properties. Interest expense for the three and nine months ended September 30, 2019, contains $0.9 million and $3.7 million, respectively, of interest expense related to sold and held for sale properties. |
[5] | During 2020, Aimco sold one apartment community located in Annandale, Virginia. One community in Edgewater, New Jersey, is classified as held for sale at September 30, 2020, and is expected to sell later in 2020. |
[6] | Other expenses, net, for the three and nine months ended September 30, 2020, is inclusive of $11.9 million and $12.6 million, respectively, of transaction costs related to the separation of Aimco's development platform. |
[7] | For the three and nine months ended September 30, 2020, interest expense on corporate borrowings includes $2.8 million and $5.4 million, respectively, of net incremental interest expense primarily on Aimco’s $350 million term loan, which Aimco secured to increase liquidity. |
[8] | Pro forma adjustments are comprised of the detailed adjustments presented in Supplemental Schedule 1. |
[9] | Please refer to the Glossary for a reconciliation of the Capital Replacement spending used to compute AFFO to Capital Replacement spending per Supplemental Schedule 9. |
17
Supplemental Schedule 2(b)
Partially Owned Entities
Three and Nine Months Ended September 30, 2020 Compared to Three and Nine Months Ended September 30, 2019
(Proportionate amounts, in thousands) (unaudited)
| | Noncontrolling Interests [1] | | | Unconsolidated [2] | | | Noncontrolling Interests [1] | | | Unconsolidated [2] | |
| | For the Three Months Ended September 30, | | | For the Three Months Ended September 30, | | | For the Nine Months Ended September 30, | | | For the Nine Months Ended September 30, | |
| | 2020 | | | 2019 | | | 2020 | | | 2019 | | | 2020 | | | 2019 | | | 2020 | | | 2019 | |
Revenues, before utility reimbursements | | $ | 4,028 | | | $ | 896 | | | $ | 627 | | | $ | 594 | | | $ | 5,806 | | | $ | 2,473 | | | $ | 1,784 | | | $ | 1,790 | |
| | | | | | | | | | | | | | | | | | | | | | | | | | | | | | | | |
Expenses, net of utility reimbursements | | | 1,203 | | | | 296 | | | | 122 | | | | 127 | | | | 1,755 | | | | 788 | | | | 468 | | | | 382 | |
| | | | | | | | | | | | | | | | | | | | | | | | | | | | | | | | |
Net operating income | | | 2,825 | | | | 600 | | | | 505 | | | | 467 | | | | 4,051 | | | | 1,685 | | | | 1,316 | | | | 1,408 | |
| | | | | | | | | | | | | | | | | | | | | | | | | | | | | | | | |
Property management expenses, net | | | (121 | ) | | | (32 | ) | | | (18 | ) | | | (18 | ) | | | (186 | ) | | | (100 | ) | | | (53 | ) | | | (54 | ) |
| | | | | | | | | | | | | | | | | | | | | | | | | | | | | | | | |
Casualties | | | (7 | ) | | | — | | | | — | | | | — | | | | (9 | ) | | | 2 | | | | — | | | | — | |
| | | | | | | | | | | | | | | | | | | | | | | | | | | | | | | | |
Other expense, net | | | (19 | ) | | | (4 | ) | | | — | | | | — | | | | (33 | ) | | | (13 | ) | | | — | | | | — | |
| | | | | | | | | | | | | | | | | | | | | | | | | | | | | | | | |
Interest expense on non-recourse property debt | | | (1,115 | ) | | | (180 | ) | | | (72 | ) | | | (76 | ) | | | (1,413 | ) | | | (504 | ) | | | (218 | ) | | | (231 | ) |
| | | | | | | | | | | | | | | | | | | | | | | | | | | | | | | | |
Contribution from real estate operations | | | 1,563 | | | | 384 | | | | 415 | | | | 373 | | | | 2,410 | | | | 1,070 | | | | 1,045 | | | | 1,123 | |
| | | | | | | | | | | | | | | | | | | | | | | | | | | | | | | | |
Other non-property income (expenses), net | | | 52 | | | | (7 | ) | | | — | | | | — | | | | 151 | | | | (55 | ) | | | — | | | | — | |
| | | | | | | | | | | | | | | | | | | | | | \ | | | | | | | | | |
FFO from real estate operations | | $ | 1,615 | | | $ | 377 | | | $ | 415 | | | $ | 373 | | | $ | 2,561 | | | $ | 1,015 | | | $ | 1,045 | | | $ | 1,123 | |
| | | | | | | | | | | | | | | | | | | | | | | | | | | | | | | | |
Total apartment communities | | | 17 | | | | 6 | | | | 4 | | | | 4 | | | | | | | | | | | | | | | | | |
Total apartment homes | | | 5,409 | | | | 2,056 | | | | 142 | | | | 142 | | | | | | | | | | | | | | | | | |
Noncontrolling interests’ share of consolidated apartment homes/Aimco share of unconsolidated apartment homes | | | 1,750 | | | | 171 | | | | 72 | | | | 72 | | | | | | | | | | | | | | | | | |
[1] | Amounts represent the noncontrolling interests’ proportionate share of consolidated amounts, including the amounts related to the previously announced joint venture transaction that closed on September 8, 2020. FFO from real estate operations also includes the noncontrolling interests’ share of operating results at 1001 Brickell Bay Drive, which is excluded from apartment community and home counts. |
[2] | Amounts represent Aimco’s proportionate share of the unconsolidated real estate partnerships’ operations. |
| 18 |
Supplemental Schedule 3
Property Net Operating Income
Trailing Five Quarters
(consolidated amounts, in thousands) (unaudited)
| | Three Months Ended | |
| | September 30, 2020 | | | June 30, 2020 | | | March 31, 2020 | | | December 31, 2019 | | | September 30, 2019 | |
Revenues, before utility reimbursements | | | | | | | | | | | | | | | | | | | | |
| | | | | | | | | | | | | | | | | | | | |
Same Store | | $ | 174,530 | | | $ | 179,005 | | | $ | 184,986 | | | $ | 184,170 | | | $ | 183,876 | |
| | | | | | | | | | | | | | | | | | | | |
Redevelopment/Development | | | 12,498 | | | | 11,589 | | | | 11,913 | | | | 11,367 | | | | 11,131 | |
| | | | | | | | | | | | | | | | | | | | |
Acquisition and Other Real Estate [1] | | | 17,842 | | | | 17,981 | | | | 19,343 | | | | 19,059 | | | | 19,242 | |
| | | | | | | | | | | | | | | | | | | | |
Total revenues, before utility reimbursements | | | 204,870 | | | | 208,575 | | | | 216,242 | | | | 214,596 | | | | 214,249 | |
| | | | | | | | | | | | | | | | | | | | |
Expenses, net of utility reimbursements | | | | | | | | | | | | | | | | | | | | |
| | | | | | | | | | | | | | | | | | | | |
Same Store | | | 50,121 | | | | 48,269 | | | | 47,980 | | | | 46,514 | | | | 50,500 | |
| | | | | | | | | | | | | | | | | | | | |
Redevelopment/Development | | | 4,919 | | | | 4,970 | | | | 4,746 | | | | 4,254 | | | | 4,492 | |
| | | | | | | | | | | | | | | | | | | | |
Acquisition and Other Real Estate [1] | | | 7,331 | | | | 6,644 | | | | 6,715 | | | | 6,250 | | | | 7,074 | |
| | | | | | | | | | | | | | | | | | | | |
Total expenses, net of utility reimbursements | | | 62,371 | | | | 59,883 | | | | 59,441 | | | | 57,018 | | | | 62,066 | |
| | | | | | | | | | | | | | | | | | | | |
Property Net Operating Income | | | | | | | | | | | | | | | | | | | | |
| | | | | | | | | | | | | | | | | | | | |
Same Store | | | 124,409 | | | | 130,736 | | | | 137,006 | | | | 137,656 | | | | 133,376 | |
| | | | | | | | | | | | | | | | | | | | |
Redevelopment/Development | | | 7,579 | | | | 6,619 | | | | 7,167 | | | | 7,113 | | | | 6,639 | |
| | | | | | | | | | | | | | | | | | | | |
Acquisition and Other Real Estate [1] | | | 10,511 | | | | 11,337 | | | | 12,628 | | | | 12,809 | | | | 12,168 | |
| | | | | | | | | | | | | | | | | | | | |
Total Property Net Operating Income | | $ | 142,499 | | | $ | 148,692 | | | $ | 156,801 | | | $ | 157,578 | | | $ | 152,183 | |
| | | | | | | | | | | | | | | | | | | | |
Sold and Held For Sale Property Net Operating Income [2] | | $ | 1,565 | | | $ | 1,802 | | | $ | 2,397 | | | $ | 5,080 | | | $ | 5,370 | |
[1] | Acquisition and Other Real Estate consists of communities that Aimco has acquired since January 1, 2019, as well as communities subject to limitations on rent increases, communities that Aimco expects to sell within 12 months that do not meet the criteria to be classified as held for sale, communities that Aimco expects to redevelop, and certain commercial spaces. Acquisition and Other Real Estate revenues and expenses are also inclusive of the operating results of 1001 Brickell Bay Drive since its acquisition in July 2019. |
[2] | During 2020, Aimco sold one apartment community located in Annandale, Virginia. One community in Edgewater, New Jersey, is classified as held for sale at September 30, 2020, and is expected to sell later in 2020. |
| 19 |
Supplemental Schedule 4
Apartment Home Summary
As of September 30, 2020
(unaudited)
| | Number of Apartment Communities | | | Number of Apartment Homes | | | Aimco Share of Apartment Homes | |
Consolidated | | | | | | | | | | | | |
Same Store [1] | | | 93 | | | | 27,610 | | | | 25,968 | |
Redevelopment/Development | | | 8 | | | | 2,521 | | | | 2,521 | |
Acquisition and Other Real Estate [2] | | | 20 | | | | 2,670 | | | | 2,562 | |
Held for Sale | | | 1 | | | | 266 | | | | 266 | |
Total Consolidated | | | 122 | | | | 33,067 | | | | 31,317 | |
Unconsolidated | | | 4 | | | | 142 | | | | 72 | |
Total Portfolio [3] | | | 126 | | | | 33,209 | | | | 31,389 | |
[1] | From June 30, 2020, to September 30, 2020, Aimco’s Same Store portfolio decreased by one apartment community and 266 apartment homes due to a community being classified as held for sale. |
[2] | From June 30, 2020, to September 30, 2020, Aimco’s Acquisition and Other Real Estate portfolio increased by one apartment community and 271 apartment homes due to the acquisition of Hamilton on the Bay. |
[3] | As of September 30, 2020, the continuing portfolio for AIR is expected to consist of 98 apartment communities with 26,599 apartment homes. |
| 20 |
Supplemental Schedule 5(a)
Capitalization and Financial Metrics
As of September 30, 2020
(dollars in thousands) (unaudited)
Leverage Balances and Characteristics
| | | | | | | | | | | | | | Aimco Share | |
Debt | | Consolidated | | | Aimco Share of Unconsolidated Partnerships | | | Noncontrolling Interests | | | Total | | | Weighted Average Maturity (Years) | | | Weighted Average Stated Interest Rate | |
Fixed rate loans payable | | $ | 4,009,746 | | | $ | 6,026 | | | $ | (487,412 | ) | | $ | 3,528,360 | | | | 8.3 | | | | 3.61 | % |
Floating rate loans payable | | | 55,000 | | | | — | | | | — | | | | 55,000 | | | | 3.2 | | | | 1.34 | % |
Floating rate tax-exempt bonds | | | 14,505 | | | | — | | | | (1 | ) | | | 14,504 | | | | 12.8 | | | | 1.10 | % |
Total non-recourse property debt | | $ | 4,079,251 | | | $ | 6,026 | | | $ | (487,413 | ) | | $ | 3,597,864 | | | | 8.2 | | | | 3.57 | % |
| | | | | | | | | | | | | | | | | | | | | | | | |
Term loan | | | 350,000 | | | | — | | | | — | | | | 350,000 | | | | 0.6 | | | | 2.35 | % |
Preferred OP Units | | | 79,449 | | | | — | | | | — | | | | 79,449 | | | | 10.0 | | [1] | | 8.08 | % |
Redeemable noncontrolling interests in real estate partnership | | | 4,371 | | | | — | | | | — | | | | 4,371 | | | | 2.0 | | [2] | | — | % |
Total Leverage | | $ | 4,513,071 | | | $ | 6,026 | | | $ | (487,413 | ) | | $ | 4,031,684 | | | | 7.6 | | | | 3.55 | % |
| | | | | | | | | | | | | | | | | | | | | | | | |
Cash and restricted cash [3] | | | (255,455 | ) | | | — | | | | 6,496 | | | | (248,959 | ) | | | | | | | | |
Securitization trust assets [4] | | | (98,874 | ) | | | — | | | | — | | | | (98,874 | ) | | | | | | | | |
Net Leverage | | $ | 4,158,742 | | | $ | 6,026 | | | $ | (480,917 | ) | | $ | 3,683,851 | | | | | | | | | |
Leverage Ratios Third Quarter 2020 [5]
| | Annualized Current Quarter | | Trailing Twelve Months |
Proportionate Debt to Adjusted EBITDAre | | 7.2x | | 6.8x |
Net Leverage to Adjusted EBITDAre | | 7.4x | | 7.0x |
Adjusted EBITDAre to Adjusted Interest Expense | | 3.1x | | 3.4x |
Adjusted EBITDAre to Adjusted Interest Expense and Preferred Distributions | | 3.0x | | 3.2x |
| | Amount | | Covenant |
Fixed Charge Coverage Ratio | | 1.93x | | 1.40x |
[1] | Aimco’s Preferred OP Units are redeemable at the holder’s option. Aimco has computed the weighted-average maturity of its total leverage assuming a 10-year maturity for its Preferred OP Units. |
[2] | Redeemable noncontrolling interests in a real estate partnership relate to the 5% ownership in 1001 Brickell Bay Drive held by an outside partner with a put option that allows the holder, at his option, to redeem his interest for cash after a three-year period. The term to maturity reflects the time remaining until the put option expires. |
[3] | Restricted cash on the balance sheet includes tenant security deposits which are excluded for purposes of calculating Aimco’s net leverage. |
[4] | In 2011, $673.8 million of Aimco’s loans payable were securitized in a trust holding only these loans. Aimco purchased the subordinate positions in the trust that holds these loans for $51.5 million. These investments have a face value of $100.9 million and a carrying amount of $98.9 million and are included in other assets on Aimco’s Consolidated Balance Sheet at September 30, 2020. The amount of these investments effectively reduces Aimco’s leverage. |
[5] | Aimco calculates Adjusted EBITDAre and Adjusted Interest Expense used in its leverage ratios based on current quarter amounts, annualized, and trailing twelve months. Aimco’s Adjusted EBITDAre has been calculated on a pro forma basis as further described in the Glossary. |
| 21 |
Supplemental Schedule 5(b)
Capitalization and Financial Metrics
As of September 30, 2020
(share, unit, and dollar amounts in thousands) (unaudited)
Aimco Share Non-Recourse Property Debt
| | Amortization | | | Maturities | | | Total | | | Maturities as a Percent of Total | | | Average Rate on Maturing Debt | |
2020 4Q | | $ | 17,299 | | | $ | — | | | $ | 17,299 | | | | — | % | | | — | % |
| | | | | | | | | | | | | | | | | | | | |
2021 Q1 | | | 17,942 | | | | — | | | | 17,942 | | | | — | % | | | — | % |
2021 Q2 | | | 17,855 | | | | 64,987 | | | | 82,842 | | | | 1.81 | % | | | 4.43 | % |
2021 Q3 | | | 17,804 | | | | — | | | | 17,804 | | | | — | % | | | — | % |
2021 Q4 | | | 17,990 | | | | — | | | | 17,990 | | | | — | % | | | — | % |
Total 2021 | | | 71,591 | | | | 64,987 | | [1] | | 136,578 | | | | 1.81 | % | | | 4.43 | % |
| | | | | | | | | | | | | | | | | | | | |
2022 | | | 71,292 | | | | 249,078 | | | | 320,370 | | | | 6.92 | % | | | 4.67 | % |
2023 | | | 65,502 | | | | 220,638 | | | | 286,140 | | | | 6.13 | % | | | 3.85 | % |
2024 | | | 62,716 | | | | 217,830 | | | | 280,546 | | | | 6.05 | % | | | 3.28 | % |
2025 | | | 58,240 | | | | 289,037 | | | | 347,277 | | | | 8.03 | % | | | 3.44 | % |
2026 | | | 49,326 | | | | 281,093 | | | | 330,419 | | | | 7.81 | % | | | 3.48 | % |
2027 | | | 41,542 | | | | 264,122 | | | | 305,664 | | | | 7.34 | % | | | 3.35 | % |
2028 | | | 35,549 | | | | 245,181 | | | | 280,730 | | | | 6.81 | % | | | 3.81 | % |
2029 | | | 24,289 | | | | 297,153 | | | | 321,442 | | | | 8.26 | % | | | 4.25 | % |
Thereafter | | | 173,505 | | | | 797,894 | | | | 971,399 | | | | 22.18 | % | | | 3.13 | % |
Total | | $ | 670,851 | | | $ | 2,927,013 | | | $ | 3,597,864 | | | | | | | | | |
Preferred OP Units
| | Units Outstanding as of September 30, 2020 | | | Coupon | | | Amount | |
Preferred Partnership Units | | | 2,939 | | | | 8.08 | % | | $ | 79,449 | |
Common Stock, Partnership Units and Equivalents
| | September 30, 2020 | |
Class A Common Stock outstanding | | | 148,548 | |
Participating unvested restricted stock | | | 95 | |
Dilutive options, share equivalents and non-participating unvested restricted stock | | | 32 | |
Total shares and dilutive share equivalents | | | 148,675 | |
Common Partnership Units and equivalents outstanding | | | 7,956 | |
Total shares, units and dilutive share equivalents | | | 156,631 | |
[1] | Aimco’s 2021 maturities can be repaid by Aimco’s subordinate positions in the securitization trust, which reduces Aimco’s future refunding requirements in 2021 and 2022 by $100.9 million. |
| 22 |

Supplemental Schedule 6(a)
Same Store Operating Results
Three Months Ended September 30, 2020 Compared to Three Months Ended September 30, 2019
(proportionate amounts, in thousands, except community, home, and per home data) (unaudited)
| | | | | | | | | | | Revenues, Before Utility Reimbursements [1] | | | Expenses, Net of Utility Reimbursements | | | Net Operating Income | | | | Net Operating Income Margin | | | Average Daily Occupancy During Period | | | Average Revenue per Aimco Apartment Home | |
| Apartment Communities | | Apartment Homes | | Aimco Share of Apartment Homes | | | 3Q 2020 | | 3Q 2019 | | Growth | | | 3Q 2020 | | 3Q 2019 | | Growth | | | 3Q 2020 | | 3Q 2019 | | Growth | | | | 3Q 2020 | | | 3Q 2020 | | 3Q 2019 | | | 3Q 2020 | | 3Q 2019 | |
| | | | | | | | | | | | | | | | | | | | | | | | | | | | | | | | | | | | | | | | | | | | | | | | | | | | | | | | | | |
Atlanta | | 2 | | | 333 | | | 333 | | | $ | 1,452 | | $ | 1,483 | | | (2.1 | %) | | $ | 579 | | $ | 734 | | | (21.1 | %) | | $ | 873 | | $ | 749 | | | 16.6 | % | | | 60.1% | | | 96.5% | | 95.9% | | | $ | 1,507 | | $ | 1,548 | |
| | | | | | | | | | | | | | | | | | | | | | | | | | | | | | | | | | | | | | | | | | | | | | | | | | | | | | | | | | |
Bay Area | | 10 | | | 2,355 | | | 1,800 | | | | 16,260 | | | 16,683 | | | (2.5 | %) | | | 4,075 | | | 4,044 | | | 0.8 | % | | | 12,185 | | | 12,639 | | | (3.6 | %) | | | 74.9% | | | 92.4% | | 96.9% | | | | 3,257 | | | 3,188 | |
| | | | | | | | | | | | | | | | | | | | | | | | | | | | | | | | | | | | | | | | | | | | | | | | | | | | | | | | | | |
Boston | | 15 | | | 4,689 | | | 4,689 | | | | 27,341 | | | 28,245 | | | (3.2 | %) | | | 8,139 | | | 8,219 | | | (1.0 | %) | | | 19,202 | | | 20,026 | | | (4.1 | %) | | | 70.2% | | | 95.4% | | 97.4% | | | | 2,038 | | | 2,062 | |
| | | | | | | | | | | | | | | | | | | | | | | | | | | | | | | | | | | | | | | | | | | | | | | | | | | | | | | | | | |
Chicago | | 7 | | | 1,671 | | | 1,671 | | | | 8,991 | | | 9,110 | | | (1.3 | %) | | | 3,169 | | | 3,216 | | | (1.5 | %) | | | 5,822 | | | 5,894 | | | (1.2 | %) | | | 64.8% | | | 93.2% | | 94.6% | | | | 1,926 | | | 1,922 | |
| | | | | | | | | | | | | | | | | | | | | | | | | | | | | | | | | | | | | | | | | | | | | | | | | | | | | | | | | | |
Denver | | 7 | | | 1,925 | | | 1,886 | | | | 9,049 | | | 9,413 | | | (3.9 | %) | | | 2,441 | | | 2,371 | | | 3.0 | % | | | 6,608 | | | 7,042 | | | (6.2 | %) | | | 73.0% | | | 94.0% | | 96.9% | | | | 1,701 | | | 1,717 | |
| | | | | | | | | | | | | | | | | | | | | | | | | | | | | | | | | | | | | | | | | | | | | | | | | | | | | | | | | | |
Greater Washington, DC | | 10 | | | 5,079 | | | 5,056 | | | | 24,208 | | | 24,482 | | | (1.1 | %) | | | 7,040 | | | 6,812 | | | 3.3 | % | | | 17,168 | | | 17,670 | | | (2.8 | %) | | | 70.9% | | | 95.5% | | 97.4% | | | | 1,672 | | | 1,656 | |
| | | | | | | | | | | | | | | | | | | | | | | | | | | | | | | | | | | | | | | | | | | | | | | | | | | | | | | | | | |
Los Angeles | | 12 | | | 4,097 | | | 3,248 | | | | 26,844 | | | 29,566 | | | (9.2 | %) | | | 6,371 | | | 6,234 | | | 2.2 | % | | | 20,473 | | | 23,332 | | | (12.3 | %) | | | 76.3% | | | 92.6% | | 96.9% | | | | 2,976 | | | 3,133 | |
| | | | | | | | | | | | | | | | | | | | | | | | | | | | | | | | | | | | | | | | | | | | | | | | | | | | | | | | | | |
Miami | | 3 | | | 873 | | | 873 | | | | 5,503 | | | 5,791 | | | (5.0 | %) | | | 1,546 | | | 1,672 | | | (7.5 | %) | | | 3,957 | | | 4,119 | | | (3.9 | %) | | | 71.9% | | | 93.8% | | 95.9% | | | | 2,239 | | | 2,307 | |
| | | | | | | | | | | | | | | | | | | | | | | | | | | | | | | | | | | | | | | | | | | | | | | | | | | | | | | | | | |
Philadelphia | | 7 | | | 2,323 | | | 2,323 | | | | 16,921 | | | 18,813 | | | (10.1 | %) | | | 5,538 | | | 6,256 | | | (11.5 | %) | | | 11,383 | | | 12,557 | | | (9.3 | %) | | | 67.3% | | | 88.7% | | 95.5% | | | | 2,738 | | | 2,826 | |
| | | | | | | | | | | | | | | | | | | | | | | | | | | | | | | | | | | | | | | | | | | | | | | | | | | | | | | | | | |
San Diego | | 6 | | | 1,585 | | | 1,409 | | | | 8,588 | | | 8,520 | | | 0.8 | % | | | 1,906 | | | 1,882 | | | 1.3 | % | | | 6,682 | | | 6,638 | | | 0.7 | % | | | 77.8% | | | 97.5% | | 97.2% | | | | 2,085 | | | 2,074 | |
| | | | | | | | | | | | | | | | | | | | | | | | | | | | | | | | | | | | | | | | | | | | | | | | | | | | | | | | | | |
Seattle | | 2 | | | 239 | | | 239 | | | | 1,637 | | | 1,613 | | | 1.5 | % | | | 489 | | | 435 | | | 12.4 | % | | | 1,148 | | | 1,178 | | | (2.5 | %) | | | 70.1% | | | 94.4% | | 97.9% | | | | 2,418 | | | 2,298 | |
| | | | | | | | | | | | | | | | | | | | | | | | | | | | | | | | | | | | | | | | | | | | | | | | | | | | | | | | | | |
Other Markets | | 12 | | | 2,441 | | | 2,441 | | | | 14,593 | | | 15,994 | | | (8.8 | %) | | | 5,488 | | | 5,516 | | | (0.5 | %) | | | 9,105 | | | 10,478 | | | (13.1 | %) | | | 62.4% | | | 93.4% | | 96.3% | | | | 2,133 | | | 2,268 | |
| | | | | | | | | | | | | | | | | | | | | | | | | | | | | | | | | | | | | | | | | | | | | | | | | | | | | | | | | | |
Total | | 93 | | | 27,610 | | | 25,968 | | | $ | 161,387 | | $ | 169,713 | | | (4.9 | %) | | $ | 46,781 | | $ | 47,391 | | | (1.3 | %) | | $ | 114,606 | | $ | 122,322 | | | (6.3 | %) | | | 71.0% | | | 93.9% | | 96.7% | | | $ | 2,207 | | $ | 2,252 | |
[1] | Revenue, before utility reimbursements, is comprised 97% of residential rents and 3% from commercial tenants. Approximately 140 basis points of the third quarter 2020 year-over-year decline in revenue growth is attributable to elevated bad debt expense and approximately 80 basis points is attributable to lower commercial revenue. Elevated bad debt expense was most impactful to revenue growth in Atlanta, Boston, Los Angeles, Miami, and Other Markets. Lower commercial revenue was most impactful to revenue growth in Atlanta, Boston, Denver, and Philadelphia. |
| | | | | | | | | | | Revenues, Before Utility Reimbursements [1] | | | Expenses, Net of Utility Reimbursements | | | Net Operating Income | | | | Net Operating Income Margin | | | Average Daily Occupancy During Period | | | Average Revenue per Aimco Apartment Home | |
| Apartment Communities | | Apartment Homes | | Aimco Share of Apartment Homes | | | 3Q 2020 | | 3Q 2019 | | Growth | | | 3Q 2020 | | 3Q 2019 | | Growth | | | 3Q 2020 | | 3Q 2019 | | Growth | | | | 3Q 2020 | | | 3Q 2020 | | 3Q 2019 | | | 3Q 2020 | | 3Q 2019 | |
| | | | | | | | | | | | | | | | | | | | | | | | | | | | | | | | | | | | | | | | | | | | | | | | | | | | | | | | | | |
Suburban | | 55 | | | 19,083 | | | 18,247 | | | $ | 98,615 | | $ | 99,948 | | | (1.3 | %) | | $ | 28,262 | | $ | 28,893 | | | (2.2 | %) | | $ | 70,353 | | $ | 71,055 | | | (1.0 | %) | | | 71.3% | | | 95.7% | | 96.8% | | | $ | 1,882 | | $ | 1,887 | |
| | | | | | | | | | | | | | | | | | | | | | | | | | | | | | | | | | | | | | | | | | | | | | | | | | | | | | | | | | |
Urban | | 38 | | | 8,527 | | | 7,721 | | | | 62,772 | | | 69,765 | | | (10.0 | %) | | | 18,519 | | | 18,498 | | | 0.1 | % | | | 44,253 | | | 51,267 | | | (13.7 | %) | | | 70.5% | | | 89.5% | | 96.6% | | | | 3,027 | | | 3,117 | |
| | | | | | | | | | | | | | | | | | | | | | | | | | | | | | | | | | | | | | | | | | | | | | | | | | | | | | | | | | |
Total | | 93 | | | 27,610 | | | 25,968 | | | $ | 161,387 | | $ | 169,713 | | | (4.9 | %) | | $ | 46,781 | | $ | 47,391 | | | (1.3 | %) | | $ | 114,606 | | $ | 122,322 | | | (6.3 | %) | | | 71.0% | | | 93.9% | | 96.7% | | | $ | 2,207 | | $ | 2,252 | |
For this purpose, Aimco classifies Urban properties as those in Center City and University City Philadelphia, Mid-Wilshire and West Los Angeles, the Northern California Peninsula, Intown Boston and Cambridge, Downtown Miami and Brickell, Manhattan, and other urban center communities.
[1] | Elevated bad debt expense impacted Suburban revenue growth by 120 basis points and Urban revenue growth by 180 basis points. Lower commercial revenue impacted Suburban revenue growth by 30 basis points and Urban revenue growth by 270 basis points. |
| 23 |
Supplemental Schedule 6(b)
Same Store Operating Results
Three Months Ended September 30, 2020 Compared to Three Months Ended June 30, 2020
(proportionate amounts, in thousands, except community, home, and per home data) (unaudited)
| | | | | | | | | | | Revenues, Before Utility Reimbursements [1] | | | Expenses, Net of Utility Reimbursements | | | Net Operating Income | | | | Net Operating Income Margin | | | Average Daily Occupancy During Period | | | Average Revenue per Aimco Apartment Home | |
| Apartment Communities | | Apartment Homes | | Aimco Share of Apartment Homes | | | 3Q 2020 | | 2Q 2020 | | Growth | | | 3Q 2020 | | 2Q 2020 | | Growth | | | 3Q 2020 | | 2Q 2020 | | Growth | | | | 3Q 2020 | | | 3Q 2020 | | 2Q 2020 | | | 3Q 2020 | | 2Q 2020 | |
| | | | | | | | | | | | | | | | | | | | | | | | | | | | | | | | | | | | | | | | | | | | | | | | | | | | | | | | | | |
Atlanta | | 2 | | | 333 | | | 333 | | | $ | 1,452 | | $ | 1,351 | | | 7.5 | % | | $ | 579 | | $ | 508 | | | 14.0 | % | | $ | 873 | | $ | 843 | | | 3.6 | % | | | 60.1% | | | 96.5% | | 93.7% | | | $ | 1,507 | | $ | 1,443 | |
| | | | | | | | | | | | | | | | | | | | | | | | | | | | | | | | | | | | | | | | | | | | | | | | | | | | | | | | | | |
Bay Area | | 10 | | | 2,355 | | | 1,800 | | | | 16,260 | | | 16,699 | | | (2.6 | %) | | | 4,075 | | | 3,962 | | | 2.9 | % | | | 12,185 | | | 12,737 | | | (4.3 | %) | | | 74.9% | | | 92.4% | | 96.2% | | | | 3,257 | | | 3,216 | |
| | | | | | | | | | | | | | | | | | | | | | | | | | | | | | | | | | | | | | | | | | | | | | | | | | | | | | | | | | |
Boston | | 15 | | | 4,689 | | | 4,689 | | | | 27,341 | | | 27,662 | | | (1.2 | %) | | | 8,139 | | | 8,291 | | | (1.8 | %) | | | 19,202 | | | 19,371 | | | (0.9 | %) | | | 70.2% | | | 95.4% | | 96.0% | | | | 2,038 | | | 2,048 | |
| | | | | | | | | | | | | | | | | | | | | | | | | | | | | | | | | | | | | | | | | | | | | | | | | | | | | | | | | | |
Chicago | | 7 | | | 1,671 | | | 1,671 | | | | 8,991 | | | 9,043 | | | (0.6 | %) | | | 3,169 | | | 3,079 | | | 2.9 | % | | | 5,822 | | | 5,964 | | | (2.4 | %) | | | 64.8% | | | 93.2% | | 94.9% | | | | 1,926 | | | 1,901 | |
| | | | | | | | | | | | | | | | | | | | | | | | | | | | | | | | | | | | | | | | | | | | | | | | | | | | | | | | | | |
Denver | | 7 | | | 1,925 | | | 1,886 | | | | 9,049 | | | 8,942 | | | 1.2 | % | | | 2,441 | | | 2,351 | | | 3.8 | % | | | 6,608 | | | 6,591 | | | 0.3 | % | | | 73.0% | | | 94.0% | | 94.1% | | | | 1,701 | | | 1,679 | |
| | | | | | | | | | | | | | | | | | | | | | | | | | | | | | | | | | | | | | | | | | | | | | | | | | | | | | | | | | |
Greater Washington, DC | | 10 | | | 5,079 | | | 5,056 | | | | 24,208 | | | 24,251 | | | (0.2 | %) | | | 7,040 | | | 6,551 | | | 7.5 | % | | | 17,168 | | | 17,700 | | | (3.0 | %) | | | 70.9% | | | 95.5% | | 96.6% | | | | 1,672 | | | 1,655 | |
| | | | | | | | | | | | | | | | | | | | | | | | | | | | | | | | | | | | | | | | | | | | | | | | | | | | | | | | | | |
Los Angeles | | 12 | | | 4,097 | | | 3,248 | | | | 26,844 | | | 28,090 | | | (4.4 | %) | | | 6,371 | | | 6,349 | | | 0.3 | % | | | 20,473 | | | 21,741 | | | (5.8 | %) | | | 76.3% | | | 92.6% | | 94.5% | | | | 2,976 | | | 3,049 | |
| | | | | | | | | | | | | | | | | | | | | | | | | | | | | | | | | | | | | | | | | | | | | | | | | | | | | | | | | | |
Miami | | 3 | | | 873 | | | 873 | | | | 5,503 | | | 5,595 | | | (1.6 | %) | | | 1,546 | | | 1,645 | | | (6.0 | %) | | | 3,957 | | | 3,950 | | | 0.2 | % | | | 71.9% | | | 93.8% | | 95.1% | | | | 2,239 | | | 2,247 | |
| | | | | | | | | | | | | | | | | | | | | | | | | | | | | | | | | | | | | | | | | | | | | | | | | | | | | | | | | | |
Philadelphia | | 7 | | | 2,323 | | | 2,323 | | | | 16,921 | | | 18,551 | | | (8.8 | %) | | | 5,538 | | | 4,962 | | | 11.6 | % | | | 11,383 | | | 13,589 | | | (16.2 | %) | | | 67.3% | | | 88.7% | | 95.3% | | | | 2,738 | | | 2,793 | |
| | | | | | | | | | | | | | | | | | | | | | | | | | | | | | | | | | | | | | | | | | | | | | | | | | | | | | | | | | |
San Diego | | 6 | | | 1,585 | | | 1,409 | | | | 8,588 | | | 8,432 | | | 1.9 | % | | | 1,906 | | | 1,842 | | | 3.5 | % | | | 6,682 | | | 6,590 | | | 1.4 | % | | | 77.8% | | | 97.5% | | 95.9% | | | | 2,085 | | | 2,081 | |
| | | | | | | | | | | | | | | | | | | | | | | | | | | | | | | | | | | | | | | | | | | | | | | | | | | | | | | | | | |
Seattle | | 2 | | | 239 | | | 239 | | | | 1,637 | | | 1,684 | | | (2.8 | %) | | | 489 | | | 516 | | | (5.2 | %) | | | 1,148 | | | 1,168 | | | (1.7 | %) | | | 70.1% | | | 94.4% | | 96.5% | | | | 2,418 | | | 2,432 | |
| | | | | | | | | | | | | | | | | | | | | | | | | | | | | | | | | | | | | | | | | | | | | | | | | | | | | | | | | | |
Other Markets | | 12 | | | 2,441 | | | 2,441 | | | | 14,593 | | | 15,140 | | | (3.6 | %) | | | 5,488 | | | 5,144 | | | 6.7 | % | | | 9,105 | | | 9,996 | | | (8.9 | %) | | | 62.4% | | | 93.4% | | 95.7% | | | | 2,133 | | | 2,160 | |
| | | | | | | | | | | | | | | | | | | | | | | | | | | | | | | | | | | | | | | | | | | | | | | | | | | | | | | | | | |
Total | | 93 | | | 27,610 | | | 25,968 | | | $ | 161,387 | | $ | 165,440 | | | (2.4 | %) | | $ | 46,781 | | $ | 45,200 | | | 3.5 | % | | $ | 114,606 | | $ | 120,240 | | | (4.7 | %) | | | 71.0% | | | 93.9% | | 95.6% | | | $ | 2,207 | | $ | 2,222 | |
[1] | Revenue, before utility reimbursements, is comprised 97% of residential rents and 3% from commercial tenants. Approximately 30 basis points of the third quarter 2020 sequential decline in revenue growth is attributable to elevated bad debt expense and approximately 40 basis points is attributable to lower commercial revenue. Elevated bad debt expense was most impactful to revenue growth in Los Angeles and Miami. Lower commercial revenue was most impactful to revenue growth in Atlanta, Boston, Denver, Philadelphia, and Seattle. |
| | | | | | | | | | | Revenues, Before Utility Reimbursements [1] | | | Expenses, Net of Utility Reimbursements | | | Net Operating Income | | | | Net Operating Income Margin | | | Average Daily Occupancy During Period | | | Average Revenue per Aimco Apartment Home | |
| Apartment Communities | | Apartment Homes | | Aimco Share of Apartment Homes | | | 3Q 2020 | | 2Q 2020 | | Growth | | | 3Q 2020 | | 2Q 2020 | | Growth | | | 3Q 2020 | | 2Q 2020 | | Growth | | | | 3Q 2020 | | | 3Q 2020 | | 2Q 2020 | | | 3Q 2020 | | 2Q 2020 | |
| | | | | | | | | | | | | | | | | | | | | | | | | | | | | | | | | | | | | | | | | | | | | | | | | | | | | | | | | | |
Suburban | | 55 | | | 19,083 | | | 18,247 | | | $ | 98,615 | | $ | 97,984 | | | 0.6 | % | | $ | 28,262 | | $ | 27,642 | | | 2.2 | % | | $ | 70,353 | | $ | 70,342 | | | — | % | | | 71.3% | | | 95.7% | | 95.9% | | | $ | 1,882 | | $ | 1,866 | |
| | | | | | | | | | | | | | | | | | | | | | | | | | | | | | | | | | | | | | | | | | | | | | | | | | | | | | | | | | |
Urban | | 38 | | | 8,527 | | | 7,721 | | | | 62,772 | | | 67,456 | | | (6.9 | %) | | | 18,519 | | | 17,558 | | | 5.5 | % | | | 44,253 | | | 49,898 | | | (11.3 | %) | | | 70.5% | | | 89.5% | | 94.8% | | | | 3,027 | | | 3,073 | |
| | | | | | | | | | | | | | | | | | | | | | | | | | | | | | | | | | | | | | | | | | | | | | | | | | | | | | | | | | |
Total | | 93 | | | 27,610 | | | 25,968 | | | $ | 161,387 | | $ | 165,440 | | | (2.4 | %) | | $ | 46,781 | | $ | 45,200 | | | 3.5 | % | | $ | 114,606 | | $ | 120,240 | | | (4.7 | %) | | | 71.0% | | | 93.9% | | 95.6% | | | $ | 2,207 | | $ | 2,222 | |
For this purpose, Aimco classifies Urban properties as those in Center City and University City Philadelphia, Mid-Wilshire and West Los Angeles, the Northern California Peninsula, Intown Boston and Cambridge, Downtown Miami and Brickell, Manhattan, and other urban center communities.
[1] | Elevated bad debt expense impacted Suburban revenue growth by 30 basis points and Urban revenue growth by 50 basis points. Lower commercial revenue did not impact Suburban revenue growth but impacted Urban revenue growth by 160 basis points. |
| 24 |
Supplemental Schedule 6(c)
Same Store Operating Results
Nine Months Ended September 30, 2020 Compared to Nine Months Ended September 30, 2019
(proportionate amounts, in thousands, except community, home, and per home data) (unaudited)
| | | | | | | | | | | Revenues, Before Utility Reimbursements [1] | | | Expenses, Net of Utility Reimbursements | | | Net Operating Income | | | | Net Operating Income Margin | | | Average Daily Occupancy During Period | | | Average Revenue per Aimco Apartment Home | |
| Apartment Communities | | Apartment Homes | | Aimco Share of Apartment Homes | | | YTD 3Q 2020 | | YTD 3Q 2019 | | Growth | | | YTD 3Q 2020 | | YTD 3Q 2019 | | Growth | | | YTD 3Q 2020 | | YTD 3Q 2019 | | Growth | | | | YTD 3Q 2020 | | | YTD 3Q 2020 | | YTD 3Q 2019 | | | YTD 3Q 2020 | | YTD 3Q 2019 | |
| | | | | | | | | | | | | | | | | | | | | | | | | | | | | | | | | | | | | | | | | | | | | | | | | | | | | | | | | | |
Atlanta | | 2 | | | 333 | | | 333 | | | $ | 4,272 | | $ | 4,257 | | | 0.4 | % | | $ | 1,624 | | $ | 1,677 | | | (3.2 | %) | | $ | 2,648 | | $ | 2,580 | | | 2.6 | % | | | 62.0% | | | 95.5% | | 95.6% | | | $ | 1,492 | | $ | 1,486 | |
| | | | | | | | | | | | | | | | | | | | | | | | | | | | | | | | | | | | | | | | | | | | | | | | | | | | | | | | | | |
Bay Area | | 10 | | | 2,355 | | | 1,800 | | | | 49,842 | | | 49,747 | | | 0.2 | % | | | 11,897 | | | 11,768 | | | 1.1 | % | | | 37,945 | | | 37,979 | | | (0.1 | %) | | | 76.1% | | | 95.2% | | 97.3% | | | | 3,232 | | | 3,156 | |
| | | | | | | | | | | | | | | | | | | | | | | | | | | | | | | | | | | | | | | | | | | | | | | | | | | | | | | | | | |
Boston | | 15 | | | 4,689 | | | 4,689 | | | | 83,657 | | | 82,932 | | | 0.9 | % | | | 24,969 | | | 25,178 | | | (0.8 | %) | | | 58,688 | | | 57,754 | | | 1.6 | % | | | 70.2% | | | 96.6% | | 97.0% | | | | 2,052 | | | 2,025 | |
| | | | | | | | | | | | | | | | | | | | | | | | | | | | | | | | | | | | | | | | | | | | | | | | | | | | | | | | | | |
Chicago | | 7 | | | 1,671 | | | 1,671 | | | | 27,239 | | | 27,506 | | | (1.0 | %) | | | 9,185 | | | 8,922 | | | 2.9 | % | | | 18,054 | | | 18,584 | | | (2.9 | %) | | | 66.3% | | | 95.1% | | 95.8% | | | | 1,905 | | | 1,909 | |
| | | | | | | | | | | | | | | | | | | | | | | | | | | | | | | | | | | | | | | | | | | | | | | | | | | | | | | | | | |
Denver | | 7 | | | 1,925 | | | 1,886 | | | | 27,355 | | | 27,528 | | | (0.6 | %) | | | 7,076 | | | 7,282 | | | (2.8 | %) | | | 20,279 | | | 20,246 | | | 0.2 | % | | | 74.1% | | | 95.0% | | 96.6% | | | | 1,696 | | | 1,678 | |
| | | | | | | | | | | | | | | | | | | | | | | | | | | | | | | | | | | | | | | | | | | | | | | | | | | | | | | | | | |
Greater Washington, DC | | 10 | | | 5,079 | | | 5,056 | | | | 73,051 | | | 72,430 | | | 0.9 | % | | | 20,041 | | | 20,033 | | | 0.0 | % | | | 53,010 | | | 52,397 | | | 1.2 | % | | | 72.6% | | | 96.8% | | 97.6% | | | | 1,659 | | | 1,631 | |
| | | | | | | | | | | | | | | | | | | | | | | | | | | | | | | | | | | | | | | | | | | | | | | | | | | | | | | | | | |
Los Angeles | | 12 | | | 4,097 | | | 3,248 | | | | 84,318 | | | 87,249 | | | (3.4 | %) | | | 18,969 | | | 18,660 | | | 1.7 | % | | | 65,349 | | | 68,589 | | | (4.7 | %) | | | 77.5% | | | 94.7% | | 97.0% | | | | 3,044 | | | 3,077 | |
| | | | | | | | | | | | | | | | | | | | | | | | | | | | | | | | | | | | | | | | | | | | | | | | | | | | | | | | | | |
Miami | | 3 | | | 873 | | | 873 | | | | 16,961 | | | 17,240 | | | (1.6 | %) | | | 4,779 | | | 4,648 | | | 2.8 | % | | | 12,182 | | | 12,592 | | | (3.3 | %) | | | 71.8% | | | 95.4% | | 96.6% | | | | 2,263 | | | 2,271 | |
| | | | | | | | | | | | | | | | | | | | | | | | | | | | | | | | | | | | | | | | | | | | | | | | | | | | | | | | | | |
Philadelphia | | 7 | | | 2,323 | | | 2,323 | | | | 54,542 | | | 55,272 | | | (1.3 | %) | | | 15,329 | | | 16,511 | | | (7.2 | %) | | | 39,213 | | | 38,761 | | | 1.2 | % | | | 71.9% | | | 94.0% | | 96.0% | | | | 2,775 | | | 2,753 | |
| | | | | | | | | | | | | | | | | | | | | | | | | | | | | | | | | | | | | | | | | | | | | | | | | | | | | | | | | | |
San Diego | | 6 | | | 1,585 | | | 1,409 | | | | 25,582 | | | 25,207 | | | 1.5 | % | | | 5,469 | | | 5,448 | | | 0.4 | % | | | 20,113 | | | 19,759 | | | 1.8 | % | | | 78.6% | | | 96.8% | | 96.9% | | | | 2,084 | | | 2,051 | |
| | | | | | | | | | | | | | | | | | | | | | | | | | | | | | | | | | | | | | | | | | | | | | | | | | | | | | | | | | |
Seattle | | 2 | | | 239 | | | 239 | | | | 5,015 | | | 4,834 | | | 3.7 | % | | | 1,550 | | | 1,383 | | | 12.1 | % | | | 3,465 | | | 3,451 | | | 0.4 | % | | | 69.1% | | | 96.1% | | 96.9% | | | | 2,425 | | | 2,320 | |
| | | | | | | | | | | | | | | | | | | | | | | | | | | | | | | | | | | | | | | | | | | | | | | | | | | | | | | | | | |
Other Markets | | 12 | | | 2,441 | | | 2,441 | | | | 45,785 | | | 47,421 | | | (3.4 | %) | | | 16,083 | | | 16,329 | | | (1.5 | %) | | | 29,702 | | | 31,092 | | | (4.5 | %) | | | 64.9% | | | 95.5% | | 96.3% | | | | 2,183 | | | 2,241 | |
| | | | | | | | | | | | | | | | | | | | | | | | | | | | | | | | | | | | | | | | | | | | | | | | | | | | | | | | | | |
Total | | 93 | | | 27,610 | | | 25,968 | | | $ | 497,619 | | $ | 501,623 | | | (0.8 | %) | | $ | 136,971 | | $ | 137,839 | | | (0.6 | %) | | $ | 360,648 | | $ | 363,784 | | | (0.9 | %) | | | 72.5% | | | 95.7% | | 96.8% | | | $ | 2,225 | | $ | 2,216 | |
[1] | Revenue, before utility reimbursements, is comprised 97% of residential rents and 3% from commercial tenants. Approximately 90 basis points of the third quarter 2020 year-to-date decline in revenue growth is attributable to elevated bad debt expense and approximately 40 basis points is attributable to lower commercial revenue. Elevated bad debt expense was most impactful to revenue growth in Los Angeles, Miami, San Diego, and Other Markets. Lower commercial revenue was most impactful to revenue growth in Atlanta, Boston, Denver, Philadelphia, and Seattle. |
| | | | | | | | | | | Revenues, Before Utility Reimbursements [1] | | | Expenses, Net of Utility Reimbursements | | | Net Operating Income | | | | Net Operating Income Margin | | | Average Daily Occupancy During Period | | | Average Revenue per Aimco Apartment Home | |
| Apartment Communities | | Apartment Homes | | Aimco Share of Apartment Homes | | | YTD 3Q 2020 | | YTD 3Q 2019 | | Growth | | | YTD 3Q 2020 | | YTD 3Q 2019 | | Growth | | | YTD 3Q 2020 | | YTD 3Q 2019 | | Growth | | | | YTD 3Q 2020 | | | YTD 3Q 2020 | | YTD 3Q 2019 | | | YTD 3Q 2020 | | YTD 3Q 2019 | |
| | | | | | | | | | | | | | | | | | | | | | | | | | | | | | | | | | | | | | | | | | | | | | | | | | | | | | | | | | |
Suburban | | 55 | | | 19,083 | | | 18,247 | | | $ | 297,296 | | $ | 295,638 | | | 0.6 | % | | $ | 83,507 | | $ | 84,346 | | | (1.0 | %) | | $ | 213,789 | | $ | 211,292 | | | 1.2 | % | | | 71.9% | | | 96.4% | | 96.8% | | | $ | 5,631 | | $ | 5,578 | |
| | | | | | | | | | | | | | | | | | | | | | | | | | | | | | | | | | | | | | | | | | | | | | | | | | | | | | | | | | |
Urban | | 38 | | | 8,527 | | | 7,721 | | | | 200,323 | | | 205,985 | | | (2.7 | %) | | | 53,464 | | | 53,493 | | | (0.1 | %) | | | 146,859 | | | 152,492 | | | (3.7 | %) | | | 73.3% | | | 93.9% | | 96.9% | | | | 9,206 | | | 9,177 | |
| | | | | | | | | | | | | | | | | | | | | | | | | | | | | | | | | | | | | | | | | | | | | | | | | | | | | | | | | | |
Total | | 93 | | | 27,610 | | | 25,968 | | | $ | 497,619 | | $ | 501,623 | | | (0.8 | %) | | $ | 136,971 | | $ | 137,839 | | | (0.6 | %) | | $ | 360,648 | | $ | 363,784 | | | (0.9 | %) | | | 72.5% | | | 95.7% | | 96.8% | | | $ | 2,225 | | $ | 2,216 | |
For this purpose, Aimco classifies Urban properties as those in Center City and University City Philadelphia, Mid-Wilshire and West Los Angeles, the Northern California Peninsula, Intown Boston and Cambridge, Downtown Miami and Brickell, Manhattan, and other urban center communities.
[1] | Elevated bad debt expense impacted Suburban revenue growth by 70 basis points and Urban revenue growth by 100 basis points. Lower commercial revenue impacted Suburban revenue growth by 20 basis points and Urban revenue growth by 130 basis points. |
| 25 |
Supplemental Schedule 6(d)
Same Store Operating Expense Detail
(proportionate amounts, in thousands) (unaudited)
Quarterly Comparison
| | 3Q 2020 | | | % of Total | | | 3Q 2019 | | | $ Change | | | % Change | |
Operating expenses [1] | | $ | 23,503 | | | | 50.2 | % | | $ | 23,444 | | | $ | 59 | | | | 0.3 | % |
Utility expense, net of reimbursement | | | 2,670 | | | | 5.7 | % | | | 2,810 | | | | (140 | ) | | | (5.0 | %) |
Real estate taxes | | | 18,520 | | | | 39.6 | % | | | 18,744 | | | | (224 | ) | | | (1.2 | %) |
Insurance | | | 2,088 | | | | 4.5 | % | | | 2,393 | | | | (305 | ) | | | (12.7 | %) |
Total | | $ | 46,781 | | | | 100.0 | % | | $ | 47,391 | | | $ | (610 | ) | | | (1.3 | %) |
Sequential Comparison
| | 3Q 2020 | | | % of Total | | | 2Q 2020 | | | $ Change | | | % Change | |
Operating expenses [1] | | $ | 23,503 | | | | 50.2 | % | | $ | 21,911 | | | $ | 1,592 | | | | 7.3 | % |
Utility expense, net of reimbursement | | | 2,670 | | | | 5.7 | % | | | 2,514 | | | | 156 | | | | 6.2 | % |
Real estate taxes | | | 18,520 | | | | 39.6 | % | | | 18,154 | | | | 366 | | | | 2.0 | % |
Insurance | | | 2,088 | | | | 4.5 | % | | | 2,621 | | | | (533 | ) | | | (20.3 | %) |
Total | | $ | 46,781 | | | | 100.0 | % | | $ | 45,200 | | | $ | 1,581 | | | | 3.5 | % |
Year-to-Date Comparison
| | YTD 3Q 2020 | | | % of Total | | | YTD 3Q 2019 | | | $ Change | | | % Change | |
Operating expenses [1] | | $ | 66,086 | | | | 48.2 | % | | $ | 68,239 | | | $ | (2,153 | ) | | | (3.2 | %) |
Utility expense, net of reimbursement | | | 8,319 | | | | 6.1 | % | | | 8,680 | | | | (361 | ) | | | (4.2 | %) |
Real estate taxes | | | 55,236 | | | | 40.3 | % | | | 54,224 | | | | 1,012 | | | | 1.9 | % |
Insurance | | | 7,330 | | | | 5.4 | % | | | 6,696 | | | | 634 | | | | 9.5 | % |
Total | | $ | 136,971 | | | | 100.0 | % | | $ | 137,839 | | | $ | (868 | ) | | | (0.6 | %) |
[1] | Includes onsite payroll, repairs and maintenance, software and technology expenses, marketing, expensed turnover costs, and other property related operating expenses. |
| 26 |
Supplemental Schedule 7(a)
Portfolio Data by Market
Third Quarter 2020 Compared to Third Quarter 2019
(unaudited)
| | Quarter Ended September 30, 2020 | | | Quarter Ended September 30, 2019 | |
| | Apartment Communities | | | Apartment Homes | | | Aimco Share of Apartment Homes | | | % Aimco NOI [1] | | | Average Revenue per Aimco Apartment Home | | | Apartment Communities | | | Apartment Homes | | | Aimco Share of Apartment Homes | | | % Aimco NOI [1] | | | Average Revenue per Aimco Apartment Home | |
| | | | | | | | | | | | | | | | | | | | | | | | | | | | | | | | | | | | | | | | |
Atlanta | | | 4 | | | | 505 | | | | 505 | | | | 1.1 | % | | $ | 1,803 | | | | 5 | | | | 817 | | | | 817 | | | | 1.2 | % | | $ | 1,720 | |
| | | | | | | | | | | | | | | | | | | | | | | | | | | | | | | | | | | | | | | | |
Bay Area | | | 12 | | | | 2,632 | | | | 2,077 | | | | 9.8 | % | | | 3,141 | | | | 12 | | | | 2,632 | | | | 2,632 | | | | 11.3 | % | | | 3,120 | |
| | | | | | | | | | | | | | | | | | | | | | | | | | | | | | | | | | | | | | | | |
Boston | | | 15 | | | | 4,689 | | | | 4,689 | | | | 14.6 | % | | | 2,038 | | �� | | 15 | | | | 4,689 | | | | 4,689 | | | | 13.0 | % | | | 2,062 | |
| | | | | | | | | | | | | | | | | | | | | | | | | | | | | | | | | | | | | | | | |
Chicago | | | 8 | | | | 1,729 | | | | 1,729 | | | | 4.6 | % | | | 1,958 | | | | 7 | | | | 1,671 | | | | 1,671 | | | | 3.8 | % | | | 1,922 | |
| | | | | | | | | | | | | | | | | | | | | | | | | | | | | | | | | | | | | | | | |
Denver | | | 9 | | | | 2,404 | | | | 2,365 | | | | 5.7 | % | | | 1,782 | | | | 8 | | | | 2,151 | | | | 2,112 | | | | 4.5 | % | | | 1,728 | |
| | | | | | | | | | | | | | | | | | | | | | | | | | | | | | | | | | | | | | | | |
Greater Washington, DC | | | 11 | | | | 5,238 | | | | 5,215 | | | | 13.4 | % | | | 1,676 | | | | 13 | | | | 5,760 | | | | 5,737 | | | | 13.0 | % | | | 1,666 | |
| | | | | | | | | | | | | | | | | | | | | | | | | | | | | | | | | | | | | | | | |
Los Angeles | | | 13 | | | | 4,347 | | | | 3,498 | | | | 16.8 | % | | | 2,989 | | | | 13 | | | | 4,347 | | | | 4,346 | | | | 20.3 | % | | | 3,125 | |
| | | | | | | | | | | | | | | | | | | | | | | | | | | | | | | | | | | | | | | | |
Miami | | | 6 | | | | 2,726 | | | | 2,726 | | | | 6.7 | % | | | 2,198 | | | | 5 | | | | 2,442 | | | | 2,442 | | | | 5.9 | % | | | 2,351 | |
| | | | | | | | | | | | | | | | | | | | | | | | | | | | | | | | | | | | | | | | |
Philadelphia | | | 9 | | | | 2,748 | | | | 2,669 | | | | 8.9 | % | | | 2,532 | | | | 9 | | | | 2,748 | | | | 2,669 | | | | 7.8 | % | | | 2,542 | |
| | | | | | | | | | | | | | | | | | | | | | | | | | | | | | | | | | | | | | | | |
San Diego | | | 12 | | | | 2,423 | | | | 2,177 | | | | 7.6 | % | | | 1,994 | | | | 12 | | | | 2,423 | | | | 2,353 | | | | 7.0 | % | | | 1,975 | |
| | | | | | | | | | | | | | | | | | | | | | | | | | | | | | | | | | | | | | | | |
Seattle | | | 2 | | | | 239 | | | | 239 | | | | 0.9 | % | | | 2,418 | | | | 2 | | | | 239 | | | | 239 | | | | 0.8 | % | | | 2,298 | |
| | | | | | | | | | | | | | | | | | | | | | | | | | | | | | | | | | | | | | | | |
Other Markets | | | 25 | | | | 3,529 | | | | 3,500 | | | | 9.9 | % | | | 2,319 | | | | 27 | | | | 3,905 | | | | 3,876 | | | | 11.4 | % | | | 2,325 | |
| | | | | | | | | | | | | | | | | | | | | | | | | | | | | | | | | | | | | | | | |
Total [2] | | | 126 | | | | 33,209 | | | | 31,389 | | | | 100.0 | % | | $ | 2,212 | | | | 128 | | | | 33,824 | | | | 33,583 | | | | 100.0 | % | | $ | 2,262 | |
[1] | NOI represents the operating results of apartment communities including ancillary commercial rents. NOI does not include any office related rents or other material commercial rents. |
[2] | The information presented above includes those apartment communities in which Aimco held an equity interest as of the end of each period presented. |
| 27 |
Supplemental Schedule 7(b)
Portfolio Data by Market
Second Quarter 2020 Market Information
(unaudited)
Aimco portfolio strategy seeks predictable rent growth from a portfolio of apartment communities that is diversified across “A,” “B,” and “C+” price points, averaging “B/B+” in quality, and is also diversified across several of the largest markets in the United States. The schedule below illustrates Aimco’s portfolio quality based on second quarter 2020 data, the most recent period for which third-party data is available. Aimco adjusts the portfolio data to remove any apartment communities sold subsequent to the reported period.
The average age of Aimco’s portfolio, adjusted for its sizable investment in redevelopment, is approximately 25 years.
| Quarter Ended June 30, 2020 | |
| Apartment Communities [1] | | | Apartment Homes | | | Aimco Share of Apartment Homes | | | % Aimco NOI [2] | | | Average Rent per Aimco Apartment Home [3] | | | Market Rent [4] | | | Percentage of Market Rent Average | | | Average Age of Apartment Communities | |
| | | | | | | | | | | | | | | | | | | | | | | | | | | | | | | |
Atlanta | | 4 | | | | 505 | | | | 505 | | | | 0.9 | % | | $ | 1,745 | | | $ | 1,206 | | | | 144.7 | % | | | 26 | |
| | | | | | | | | | | | | | | | | | | | | | | | | | | | | | | |
Bay Area | | 12 | | | | 2,632 | | | | 2,077 | | | | 11.8 | % | | | 2,982 | | | | 2,805 | | | | 106.3 | % | | | 21 | |
| | | | | | | | | | | | | | | | | | | | | | | | | | | | | | | |
Boston | | 15 | | | | 4,689 | | | | 4,689 | | | | 13.2 | % | | | 1,957 | | | | 2,340 | | | | 83.6 | % | | | 33 | |
| | | | | | | | | | | | | | | | | | | | | | | | | | | | | | | |
Chicago | | 8 | | | | 1,729 | | | | 1,729 | | | | 4.0 | % | | | 1,770 | | | | 1,442 | | | | 122.7 | % | | | 26 | |
| | | | | | | | | | | | | | | | | | | | | | | | | | | | | | | |
Denver | | 9 | | | | 2,404 | | | | 2,365 | | | | 4.8 | % | | | 1,614 | | | | 1,399 | | | | 115.4 | % | | | 19 | |
| | | | | | | | | | | | | | | | | | | | | | | | | | | | | | | |
Greater Washington, DC | | 11 | | | | 5,238 | | | | 5,215 | | | | 12.5 | % | | | 1,597 | | | | 1,815 | | | | 88.0 | % | | | 49 | |
| | | | | | | | | | | | | | | | | | | | | | | | | | | | | | | |
Los Angeles | | 13 | | | | 4,347 | | | | 3,498 | | | | 19.7 | % | | | 2,978 | | | | 1,962 | | | | 151.8 | % | | | 15 | |
| | | | | | | | | | | | | | | | | | | | | | | | | | | | | | | |
Miami | | 5 | | | | 2,455 | | | | 2,455 | | | | 5.9 | % | | | 2,185 | | | | 1,557 | | | | 140.3 | % | | | 26 | |
| | | | | | | | | | | | | | | | | | | | | | | | | | | | | | | |
Philadelphia | | 9 | | | | 2,748 | | | | 2,669 | | | | 9.3 | % | | | 2,350 | | | | 1,395 | | | | 168.5 | % | | | 20 | |
| | | | | | | | | | | | | | | | | | | | | | | | | | | | | | | |
San Diego | | 12 | | | | 2,423 | | | | 2,177 | | | | 7.1 | % | | | 1,897 | | | | 1,815 | | | | 104.5 | % | | | 30 | |
| | | | | | | | | | | | | | | | | | | | | | | | | | | | | | | |
Seattle | | 2 | | | | 239 | | | | 239 | | | | 0.8 | % | | | 2,204 | | | | 1,804 | | | | 122.2 | % | | | 6 | |
| | | | | | | | | | | | | | | | | | | | | | | | | | | | | | | |
Other Markets | | 25 | | | | 3,529 | | | | 3,500 | | | | 10.0 | % | | | 2,216 | | | | 2,062 | | | | 107.5 | % | | | 26 | |
| | | | | | | | | | | | | | | | | | | | | | | | | | | | | | | |
Total | | 125 | | | | 32,938 | | | | 31,118 | | | | 100.0 | % | | $ | 2,120 | | | $ | 1,890 | | | | 112.2 | % | | | 25 | |
[1] | The portfolio information presented above includes all apartment communities in which Aimco held an equity interest as of June 30, 2020, adjusted for communities subsequently sold. |
[2] | NOI represents the operating results of apartment communities including ancillary commercial rents. NOI does not include any office related rents or other material commercial rents. |
[3] | Represents rents, after concessions and vacancy loss, divided by Aimco Share of Apartment Homes. Does not include other rental income. |
| 28 |
Supplemental Schedule 8
Apartment Community Disposition and Acquisition Activity
(dollars in millions, except average revenue per home) (unaudited)
Full Year 2020 Dispositions [1] | | | | | | | | | | | | | | | | | | | | | | | | | |
| | | | | | | | | | | | | | | | | | | | | | | | | | | | | | | | | | |
Number of Apartment Communities [2] | | | Number of Apartment Homes | | | Weighted Average Ownership | | | Gross Proceeds | | | NOI Cap Rate [3] | | | Free Cash Flow Cap Rate [4] | | | Property Debt | | | Net Sales Proceeds [5] | | | Average Revenue per Home | |
| | | | | | | | | | | | | | | | | | | | | | | | | | | | | | | | | | |
| 1 | | | | 219 | | | 100.0% | | | $ | 58.9 | | | 5.4% | | | 4.9% | | | $ | (19.7 | ) | | $ | 36.9 | | | $ | 1,835 | |
Full Year 2020 Acquisitions | | | | | | | | | | | | |
| | | | | | | | | | | | | | | | |
Apartment Community Name | | Location | | Month Acquired | | Apartment Homes | | Purchase Price | | | Average Rent per Apartment Home [6] |
| | | | | | | | | | | | | | | | |
Hamilton on the Bay | | Miami, FL | | August | | 271 | | $ | 89.6 | | | $ 1,631 |
[1] | During September 2020, Aimco formed a joint venture with a passive investor which provides for the co-ownership of 12 multi-family communities with 4,051 units located in California. The properties included in the joint venture were valued at $2.40 billion, or approximately $592,000 per unit, equivalent to an implied NOI cap rate of approximately 4.2%. In exchange for a 39% interest subject to $475 million of property debt, Aimco received $461 million. In accordance with GAAP, Aimco did not recognize a gain on this transaction and will continue to consolidate the properties, which are excluded from the property sales activity above. |
[2] | During the nine months ended September 30, 2020, Aimco sold one apartment community in Annandale, Virginia. |
[3] | NOI Cap Rate is calculated based on Aimco’s share of the proportionate property NOI for the trailing twelve months prior to sale, less a management fee of 3% of revenue, divided by Aimco gross proceeds. |
[4] | Free Cash Flow Cap Rate represents the NOI Cap Rate, as adjusted for assumed Capital Replacements spending of $1,200 per apartment home. |
[5] | Net Sales Proceeds are after repayment of debt, if any, net working capital settlements, payment of transaction costs and debt prepayment penalties, if applicable. |
[6] | Represents average rent per apartment home for leases in place at the time of acquisition. Aimco purchased Hamilton on the Bay with the expectation to increase rents and create significant value through redevelopment given its waterfront location in the Edgewater neighborhood of Miami. |
| 29 |
Supplemental Schedule 9
Apartment Community Capital Additions Information
Three and Nine Months Ended September 30, 2020
(consolidated amounts in thousands, except per apartment home data) (unaudited)
Aimco classifies capital additions as Capital Replacements (“CR”), Capital Improvements (“CI”), Capital Enhancements (“CE”), Redevelopment, Development, Initial Capital Expenditures (“ICE”), or Casualty. Recurring capital additions are apportioned between CR and CI based on the useful life of the item under consideration and the period over which Aimco has owned the item. Under this method of classification, CR represents the portion of the item consumed during Aimco’s ownership of the item, while CI represents the portion of the item consumed prior to Aimco’s period of ownership.
| | Three Months Ended September 30, 2020 | | | Nine Months Ended September 30, 2020 | |
Capital Additions [1] | | | | | | | | |
Capital Replacements | | | | | | | | |
Buildings and grounds | | $ | 7,289 | | | $ | 21,902 | |
Turnover capital additions | | | 1,438 | | | | 3,227 | |
Capitalized site payroll and indirect costs | | | 1,189 | | | | 3,201 | |
Capital Replacements | | | 9,916 | | | | 28,330 | |
Capital Improvements | | | 4,419 | | | | 9,066 | |
Capital Enhancements | | | 6,581 | | | | 23,178 | |
Redevelopment | | | 37,380 | | | | 106,873 | |
Development | | | 19,288 | | | | 79,486 | |
Initial Capital Expenditures | | | 1,786 | | | | 3,989 | |
Casualty | | | 1,702 | | | | 7,411 | |
Total | | $ | 81,072 | | | $ | 258,333 | |
| | | | | | | | |
Total apartment homes | | | 33,067 | | | | 33,067 | |
| | | | | | | | |
Capital Replacements per apartment home | | $ | 300 | | | $ | 857 | |
[1] | For the three and nine months ended September 30, 2020, capital additions for Aimco’s apartment communities included $3.7 million and $10.8 million of capitalized interest costs, respectively. |
| 30 |
Supplemental Schedule 10
Redevelopment and Development Portfolio | (Page 1 of 2) |
As of September 30, 2020
(dollars in millions, except per home information) (unaudited)
Aimco executes redevelopments using a range of approaches. Aimco prefers to limit risk by executing redevelopments using a short-cycle approach, in which it renovates an apartment community in stages. These short-cycle redevelopments can be completed one apartment home at a time, when that home is vacated and available for renovation, or one floor at a time, thereby limiting the number of down homes and lease-up risk. As a result, short-cycle redevelopments provide Aimco the flexibility to maintain current earnings while aligning the timing of the completed apartment homes with market demand. The following table summarizes value-creating investments related to short-cycle redevelopments.
| | | | | | Number of Apartment Homes in Redevelopment or To Be Constructed | | Investment | | | | | | | | | |
| | Location | | Total Homes | | Approved | | Completed | | Leased | | Planned [1] | | To-Date | | Remaining | | Current Project Scope |
Bay Parc | | Miami, FL | | 474 | | 90 | | 75 | | 69 | | $27.7 | | $26.6 | | $1.1 | | Amenities (complete) and renovation of six floors of apartment homes |
Flamingo Point Center Tower [2] | | Miami Beach, FL | | 520 | | 58 | | 18 | | 20 | | 16.0 | | 7.5 | | 8.5 | | Renovation of apartment homes on the turn, corridors and commercial space |
Total | | | | 994 | | 148 | | 93 | | 89 | | $43.7 | | $34.1 | | $9.6 | | | | | | | | | | |
| | | | | | | | | | | | | | | | | | | | | | | | | | |
When short-cycle redevelopments are not possible, Aimco may engage in redevelopment activities where an entire building or community is vacated. Aimco refers to these as long-cycle redevelopments. Aimco undertakes some ground-up development when warranted by risk-adjusted investment returns. |
| | | | | | | | | | | | | | | | | | | | | | | | | | |
The following table summarizes value-creating investments related to long-cycle developments and redevelopments. |
| | | | | | | | | | | | | | | | | | | | | | | | | | |
| | | | | | Number of Apartment Homes in Redevelopment or To Be Constructed | | Investment | | | | | | | Average Revenue per Home Redeveloped or Constructed |
| | Location | | Approved | | Completed | | Leased | | Planned [1] | | To-Date | | Remaining | | Expected Initial Occupancy [3] | | Expected Stabilized Occupancy [3] | | Expected NOI Stabilization [3] | | Prior to Investment | | Range of Stabilized Rents [4] |
*707 Leahy | | Redwood City, CA | | 110 | | 60 | | 53 | | $26.5 | | $25.2 | | $1.3 | | 1Q 2020 | | 1Q 2021 | | 2Q 2022 | | $2,800 | | $3,500 - $3,900 |
Eldridge Townhomes | | Elmhurst, IL | | 58 | | 54 | | 57 | | 35.1 | | 33.9 | | 1.2 | | 2Q 2020 | | 4Q 2020 | | 1Q 2022 | | n/a | | $4,300 - $4,700 |
*Flamingo Point North Tower [2] | | Miami Beach, FL | | 366 | | — | | — | | 171.0 | | 86.7 | | 84.3 | | 4Q 2021 | | 1Q 2023 | | 2Q 2024 | | $1,977 | [5] | $4,750 - $5,350 |
*The Fremont | | Denver, CO (MSA) | | 253 | | 98 | | 85 | | 87.0 | | 85.5 | | 1.5 | | 3Q 2020 | | 4Q 2021 | | 1Q 2023 | | n/a | | $2,200 - $2,500 |
Parc Mosaic | | Boulder, CO | | 226 | | 226 | | 215 | | 124.6 | | 123.8 | | 0.8 | | 3Q 2019 | | 4Q 2020 | | 1Q 2022 | | n/a | | $3,200 - $3,400 |
*Prism | | Cambridge, MA | | 136 | | — | | — | | 73.2 | | 51.6 | | 21.6 | | 1Q 2021 | | 2Q 2022 | | 3Q 2023 | | n/a | | $2,950 - $3,250 |
| | | | | | | | | | | | | | | | | | | | | | | | | | |
Subtotal | | | | | | 1,149 | | 438 | | 410 | | $517.4 | | $406.7 | | $110.7 | | | | | | | | | | |
| | | | | | | | | | | | | | | | | | | | | | | | | | |
Total | | | | | | 1,297 | | 531 | | 499 | | $561.1 | | $440.8 | | $120.3 | | | | | | | | | | |
* Represents properties Aimco expects to lease from AIR following the separation of its development activities.
[1] | Planned investment relates to the current phase of the redevelopment or development. |
[2] | Common area and amenity redevelopment at Flamingo Point is complete and has been excluded from this presentation. Aimco is now presenting, for the purpose of this reporting, the Center Tower and North Tower renovations as stand-alone projects. |
[3] | Delivery timing and stabilization is subject to change and are based on the best estimate at this time. |
[4] | Aimco previously provided the expected rent achievement at these communities based on the project’s underwriting. Due to the increased uncertainty resulting from COVID-19, Aimco is now presenting a range of stabilized rate achievement based on its best judgement at this time. As future rent achievement becomes more certain, these amounts will be updated. |
[5] | Previously, the North Tower at Flamingo Point consisted of 614 apartment homes. Upon completion of the redevelopment there will be 366 larger luxury apartment homes at the North Tower. For comparison, revenue generated by the North Tower apartments prior to investment would equate to average revenue per home (based on the post redevelopment unit count) of $3,316. |
See the following page for Terms and Definitions.
| 31 |
Supplemental Schedule 10 (Continued)
Redevelopment and Development Portfolio
(Page 2 of 2)
Terms and Definitions
Total Planned Investment - represents total estimated investment, net of tax and other credits earned by Aimco as a direct result of its redevelopment or development of the community. Total estimated investment includes all capitalized costs projected to be incurred to redevelop or develop the respective community, as determined in accordance with GAAP.
Expected Stabilized Occupancy - period in which Aimco expects to achieve stabilized occupancy (greater than 90%).
Expected NOI Stabilization - period in which Aimco expects to achieve stabilized rents and operating costs, generally five quarters after Stabilized Occupancy.
Average Revenue per Apartment Home Redeveloped or Constructed - represents the actual revenues per apartment home, which includes rents and other rental income, prior to redevelopment, and the projected revenues per apartment home following redevelopment or construction, excluding rent and other rental income from commercial leases (which are presented separately on this schedule) and resident utility reimbursements. Projections of stabilized revenues per apartment home are based on management’s judgment. These projections consider factors including but not limited to: current rent; other rental income expectations; and revenue achievement to date as compared to current market rents.
| 32 |
GLOSSARY AND RECONCILIATIONS OF NON-GAAP FINANCIAL AND OPERATING MEASURES
This Earnings Release and Supplemental Information include certain financial and operating measures used by Aimco management that are not calculated in accordance with accounting principles generally accepted in the United States, or GAAP. Aimco’s definitions and calculations of these non-GAAP financial and operating measures and other terms may differ from the definitions and methodologies used by other REITs and, accordingly, may not be comparable. These non-GAAP financial and operating measures should not be considered an alternative to GAAP net income or any other GAAP measurement of performance and should not be considered an alternative measure of liquidity.
AIMCO OP: AIMCO Properties, L.P., a Delaware limited partnership, is the operating partnership in Aimco’s UPREIT structure. Aimco owns approximately 93.5% of the legal interest in the common partnership units of the Aimco OP and 94.9% of the economic interest in the common partnership units of the Aimco OP.
AIMCO PROPORTIONATE FINANCIAL INFORMATION: Within this Earnings Release and Supplemental Information, Aimco provides certain financial information necessary to calculate Aimco’s share of financial information. This information is not, nor is it intended to be, a presentation in accordance with GAAP. Aimco’s proportionate share of financial information includes Aimco’s share of unconsolidated real estate partnerships and excludes the noncontrolling interest partners’ share of consolidated real estate partnerships.
Aimco does not control the unconsolidated real estate partnerships and the calculation of Aimco’s share of the assets and liabilities and revenues and expenses does not represent a legal claim to a proportionate share of such items. The amount of cash distributions partners in such partnerships may receive is based upon specific provisions in the partnership agreements and may vary based on whether such distributions are generated from operations, capital events or liquidation.
Proportionate information benefits the users of Aimco’s financial information by providing the amount of revenues, expenses, assets, liabilities, and other items attributable to Aimco stockholders. Other companies may calculate their proportionate information differently than Aimco does, limiting the usefulness as a comparative measure. Because of these limitations, the non-GAAP Aimco proportionate financial information should not be considered in isolation or as a substitute for information included in Aimco’s financial statements as reported under GAAP.
AVERAGE AGE OF APARTMENT COMMUNITIES: Calculated by Aimco on a property-by-property basis based on the year the community was originally built, adjusted for redevelopment and/or other major capital improvements that effectively reduce the age of the community. Such investments include construction of new buildings and/or amenities, replacement or modernization of mechanical, plumbing, and electrical systems and other investments that are consequential in nature. The average age of apartment communities is weighted by the estimated fair value of the properties, and is updated annually during the first quarter, as well as upon completion of a long-cycle redevelopment.
AVERAGE REVENUE PER APARTMENT HOME: Represents Aimco proportionate average monthly rental and other property revenues, excluding utility cost reimbursements, divided by the number of occupied apartment homes as of the end of the period.
| 33 |
CAPITAL ADDITIONS DEFINITIONS
CAPITAL IMPROVEMENTS (CI): CI represent capital additions made to replace the portion of acquired apartment communities consumed prior to Aimco’s period of ownership and not contemplated in Aimco’s underwriting of an acquisition.
CAPITAL REPLACEMENTS (CR): Unlike CI, CR does not increase the useful life of an asset from its original purchase condition. CR represent capital additions made to replace the portion of acquired capital assets consumed during Aimco’s period of ownership. CR is deducted in the calculation of AFFO. A reconciliation between CR amounts on Schedule 2 and Schedule 9 is as follows (in thousands, unaudited):
| | Three Months Ended September 30, 2020 | | | Nine Months Ended September 30, 2020 | |
Capital Replacements (Schedule 9) | | $ | 9,916 | | | $ | 28,330 | |
Adjustments | | | | | | | | |
Proportionate share of Capital Replacements spending | | | (869 | ) | | | (2,238 | ) |
Amortization of incremental costs to obtain leases [1] | | | 2,269 | | | | 8,029 | |
Capital Replacement spending attributable to commercial spaces and sold properties | | | 82 | | | | 285 | |
Capital Replacements (Schedule 2) | | $ | 11,398 | | | $ | 34,406 | |
[1] Amortization of incremental costs to obtain leases includes the write-off of lease commissions during the three and nine months ended September 30, 2020.
CASUALTY CAPITAL ADDITIONS: Casualty capital additions represent capitalized costs incurred in connection with the restoration of an apartment community after a casualty event.
CAPITAL ENHANCEMENTS (CE): CE may include kitchen and bath remodeling; energy conservation projects; and investments in longer-lived materials designed to reduce costs. CE differs from Redevelopment Additions in that they are generally lesser in scope and do not significantly disrupt property operations.
INITIAL CAPITAL EXPENDITURES (ICE): ICE represent capital additions contemplated in the underwriting at Aimco’s recently acquired communities.
REDEVELOPMENT ADDITIONS: Redevelopment additions represent capital additions intended to enhance the value of the apartment community through the ability to generate higher average rental rates, and may include costs related to entitlement, which enhance the value of a community through increased density, and costs related to renovation of exteriors, common areas, or apartment homes.
DEVELOPMENT ADDITIONS: Development additions represent construction and related capitalized costs associated with the ground-up development of apartment communities.
ECONOMIC INCOME: As discussed in Supplemental Schedule 1, Economic Income represents stockholder value creation as measured by the change in estimated net asset value, or NAV, per share, plus cash dividends per share. Aimco believes Economic Income is important to investors as it represents a measure of total return we have earned for our stockholders. NAV, as used in our calculation of Economic Income, is a non-GAAP measure and represents the estimated fair value of assets net of liabilities attributable to Aimco’s common stockholders and the Aimco Operating Partnership’s common unitholders on a diluted basis. Aimco reports and reconciles Economic Income to GAAP equity annually. Please refer to the section entitled Management’s Discussion and Analysis of Financial Condition and Results of Operations described in Item 7 of our Annual Report on Form 10-K for the year ended December 31, 2019 for more information about Economic Income.
| 34 |
FREE CASH FLOW: Free Cash Flow, as calculated for Aimco’s retained portfolio, represents an apartment community’s property net operating income, less spending for Capital Replacements. Capital Replacement spending is a measure of the cost of capital asset used during the period. Aimco believes that Free Cash Flow is useful to investors as a supplemental measure of apartment community performance because it takes into consideration costs incurred during the period to replace capital assets that have been consumed during Aimco’s ownership.
FREE CASH FLOW CAP RATE: Free Cash Flow Cap Rate represents the NOI Cap Rate, adjusted for assumed Capital Replacements spending of $1,200 per apartment home.
FREE CASH FLOW MARGIN: Free Cash Flow Margin represents an apartment community’s property net operating income less $1,200 per apartment home of assumed annual Capital Replacement spending, as a percentage of the apartment community’s rental and other property revenues.
LEVERAGE RATIO DEFINITIONS
Aimco’s leverage strategy targets the ratio of Net Leverage to Adjusted EBITDAre to be below 7.0x and the ratio of Adjusted EBITDAre to Adjusted Interest and Preferred Distributions to be greater than 2.5x. Aimco also focuses on the ratios of Proportionate Debt to Adjusted EBITDAre and Adjusted EBITDAre Coverage of Adjusted Interest. Aimco believes these ratios, which are based in part on non-GAAP financial information, are commonly used by investors and analysts to assess the relative financial risk associated with balance sheets of companies within the same industry, and they are believed to be similar to measures used by rating agencies to assess entity credit quality. EBITDAre and Adjusted EBITDAre should not be considered alternatives to net income (loss) as determined in accordance with GAAP as indicators of performance. There can be no assurance that Aimco’s method of calculating EBITDAre and Adjusted EBITDAre is comparable with that of other real estate investment trusts.
Aimco’s net leverage includes Aimco’s share of long-term, non-recourse property debt, outstanding borrowings on its revolving credit facility, its term loan, and outstanding preferred OP Units, reduced by cash and restricted cash on-hand, excluding tenant security deposits, and its investment in a securitization trust that holds certain of its property debt. Aimco reconciles consolidated balances to its net leverage on Supplemental Schedule 5(a).
Aimco calculates Adjusted EBITDAre and Adjusted Interest Expense used in its leverage ratios based on current quarter amounts, annualized, and trailing twelve months.
EBITDAre AND ADJUSTED EBITDAre
EARNINGS BEFORE INTEREST, TAXES, DEPRECIATION, AND AMORTIZATION FOR REAL ESTATE (“EBITDAre”): Nareit defines EBITDAre as net income computed in accordance with GAAP, before interest expense, income taxes, depreciation and amortization expense, further adjusted for:
| • | gains and losses on the dispositions of depreciated property; |
| • | impairment write-downs of depreciated property; |
| • | impairment write-downs of investments in unconsolidated partnerships caused by a decrease in the value of the depreciated property in such partnerships; and |
| • | adjustments to reflect the Aimco’s share of EBITDAre of investments in unconsolidated entities. |
Aimco believes that EBITDAre is useful to investors, creditors and rating agencies as a supplemental measure of Aimco’s ability to incur and service debt because it is a recognized measure of performance
| 35 |
by the real estate industry and facilitates comparison of credit strength between Aimco and other companies.
ADJUSTED EBITDAre: Adjusted EBITDAre is defined by Aimco as EBITDAre adjusted to exclude the effect of the following items for the reasons set forth below:
| • | net income attributable to noncontrolling interests in consolidated real estate partnerships and EBITDAre adjustments attributable to noncontrolling interests, to allow investors to compare a measure of Aimco’s earnings before the effects of Aimco’s capital structure and indebtedness with that of other companies in the real estate industry; |
| • | the amount of interest income recognized by Aimco related to its investment in the subordinated tranches in a securitization trust holding primarily Aimco property debt, as Aimco views its interest cost on this debt to be net of any interest income received; and |
| • | the amount by which GAAP rent expense exceeds cash rents for a long-term ground lease for which expense exceeds cash payments until 2076. The excess of the GAAP rent expense over the cash payments for this lease does not reflect a current obligation that affects Aimco’s ability to service debt. |
A reconciliation of net income to EBITDAre and Adjusted EBITDAre for Aimco’s portfolio for the quarter ended and trailing twelve months ended September 30, 2020, is as follows (in thousands, unaudited):
| | Quarter Ended | | | Twelve Months Ended | |
| | September 30, 2020 | | | September 30, 2020 | |
Net income | | $ | (24,815 | ) | | $ | 170,132 | |
Adjustments: | | | | | | | | |
Interest expense | | | 50,519 | | | | 186,503 | |
Income tax benefit | | | (1,747 | ) | | | (9,052 | ) |
Depreciation and amortization | | | 98,249 | | | | 393,558 | |
Gain on disposition of real estate | | | — | | | | (193,443 | ) |
Recovery of losses on notes receivable | | | 8 | | | | 8 | |
Adjustment related to EBITDAre of unconsolidated partnerships | | | 212 | | | | 846 | |
EBITDAre | | $ | 122,426 | | | $ | 548,552 | |
Net loss attributable to noncontrolling interests in consolidated real estate partnerships | | | 154 | | | | 69 | |
EBITDAre adjustments attributable to noncontrolling interests | | | (2,771 | ) | | | (4,519 | ) |
Interest income received on securitization investment | | | (2,265 | ) | | | (8,778 | ) |
Non-cash straight-line rent | | | 669 | | | | 2,701 | |
Pro forma adjustments, net [1] | | | 6,828 | | | | (8,186 | ) |
Adjusted EBITDAre | | $ | 125,041 | | | $ | 529,839 | |
Annualized Adjusted EBITDAre | | $ | 500,164 | | | | | |
| [1] | Pro forma adjustments, net, includes pro forma adjustments to Nareit FFO per Supplemental Schedule 1, as well as adjustments for which annualization would distort results and adjustments to reflect the acquisition of Hamilton on the Bay and the California joint venture transaction as if both transactions closed on July 1, 2020 (annualized current quarter) and October 1, 2019 (trailing twelve months). |
ADJUSTED INTEREST EXPENSE: Adjusted Interest Expense represents Aimco’s proportionate share of interest expense on non-recourse property debt and interest on the credit facility borrowings and term loan less (i) prepayment penalties, if any, and (ii) the amount of interest income recognized by Aimco related to its investment in the subordinated tranches in a securitization trust holding primarily Aimco property debt.
| 36 |
Adjusted Interest Expense and Preferred Distributions for the quarter and trailing twelve months ended September 30, 2020, as used in the leverage ratios on Supplemental Schedule 5(a), are calculated as follows (in thousands, unaudited):
| | Quarter Ended | | | Twelve Months Ended | |
| | September 30, 2020 | | | September 30, 2020 | |
Interest expense per consolidated statement of operations | | $ | 50,519 | | | $ | 186,503 | |
Adjustments: | | | | | | | | |
Adjustments related to interest of consolidated and unconsolidated partnerships | | | (1,043 | ) | | | (1,272 | ) |
Debt prepayment penalties | | | (7,930 | ) | | | (19,506 | ) |
Interest income received on securitization investment | | | (2,265 | ) | | | (8,778 | ) |
Adjusted Interest Expense | | $ | 39,281 | | | $ | 156,947 | |
Preferred distributions | | | 1,687 | | | | 7,323 | |
Adjusted Interest Expense and Preferred Distributions | | $ | 40,968 | | | $ | 164,270 | |
Annualized Adjusted Interest Expense | | $ | 157,124 | | | | | |
Annualized Adjusted Interest Expense and Preferred Distributions | | $ | 163,872 | | | | | |
FIXED CHARGE COVERAGE RATIO: As defined by Aimco’s credit agreement, the ratio of (a) EBITDA to (b) fixed charges, which represent the sum of (i) Aimco’s proportionate share of interest expense (excluding prepayment penalties and amortization of debt issuance costs), (ii) debt amortization, and (iii) Preferred Distributions, for the four fiscal quarters preceding the date of calculation. The calculation of certain of these measures as defined by Aimco’s Credit Agreement may differ from those used by Aimco in the calculations of its Leverage Ratios.
PREFERRED DISTRIBUTIONS: Preferred Distributions includes the distributions paid with respect to the Aimco OP’s Preferred Partnership Units.
OTHER LEVERAGE: Other Leverage includes Preferred OP Units and redeemable noncontrolling interests.
PREFERRED OP UNITS: Preferred OP Units represent the redemption amounts for the Aimco OP’s Preferred Partnership Units and may be found in Aimco’s consolidated balance sheets and on Supplemental Schedule 5(b).
PROPORTIONATE DEBT TO ADJUSTED EBITDAre RATIO: The ratio of (a) Aimco’s share of net leverage as calculated on Supplemental Schedule 5(a), excluding Preferred OP Units and redeemable noncontrolling interests, to (b) Adjusted EBITDAre.
NET LEVERAGE TO ADJUSTED EBITDAre RATIO: The ratio of (a) Aimco’s share of net leverage as calculated on Supplemental Schedule 5(a), to (b) Adjusted EBITDAre.
NAREIT FUNDS FROM OPERATIONS (Nareit FFO): Nareit FFO is a commonly used measure of REIT performance, which the National Association of Real Estate Investment Trusts (Nareit) defines as net income computed in accordance with GAAP, excluding: depreciation and amortization related to real estate; gains and losses from sales or impairment of depreciable assets and land used in the primary business of the REIT; and income taxes directly associated with a gain or loss on sale of real estate; and including Aimco’s share of Nareit FFO of unconsolidated partnerships and joint ventures. Aimco computes Nareit FFO for all periods presented in accordance with the guidance set forth by Nareit.
In addition to Nareit FFO, Aimco uses PRO FORMA FUNDS FROM OPERATIONS (Pro forma FFO) and ADJUSTED FUNDS FROM OPERATIONS (AFFO) to measure short-term performance. Pro forma FFO
| 37 |
represents Nareit FFO as defined above, excluding certain amounts that are unique or occur infrequently. Aimco’s pro forma adjustments are defined in further detail in the footnotes to Supplemental Schedule 1.
AFFO represents Pro forma FFO reduced by Capital Replacements and is Aimco’s primary measure of current period performance.
Nareit FFO, Pro forma FFO, and AFFO are non-GAAP measures that Aimco believes are helpful to investors in understanding Aimco’s short-term performance because they capture features particular to real estate performance by recognizing that real estate generally appreciates over time or maintains residual value to a much greater extent than other capital assets such as machinery, computers or other personal property. Nareit FFO, Pro forma FFO, and AFFO should not be considered alternatives to net income (loss) as determined in accordance with GAAP, as indicators of performance. There can be no assurance that Aimco’s method of computing Nareit FFO, Pro forma FFO or AFFO is comparable with that of other real estate investment trusts.
NET OPERATING INCOME (NOI) CAP RATE: NOI Cap Rate is calculated based on Aimco’s share of the proportionate property NOI for the trailing twelve months prior to sale, less a 3% management fee, divided by Aimco gross proceeds.
NET OPERATING INCOME (NOI) MARGIN: Represents an apartment community’s net operating income as a percentage of the apartment community’s rental and other property revenues.
OTHER EXPENSES, NET: Other expenses, net, allocated to contribution from real estate operations on Supplemental Schedule 2 generally includes ground lease rent expense, franchise taxes, expenses specifically related to Aimco’s administration of its real estate partnerships (for example, services such as audit, tax, and legal), and other amounts not included in property NOI for purposes of evaluating segment performance. Other expenses, net, not allocated to contribution from real estate operations generally consists of risk management activities related to Aimco’s unconsolidated partnerships and certain other corporate expenses.
PROPERTY NET OPERATING INCOME (NOI) and PROPORTIONATE PROPERTY NOI: NOI is defined by Aimco as total property rental and other property revenues less direct property operating expenses, including real estate taxes. NOI does not include: property management revenues, primarily from affiliates; casualties; property management expenses; depreciation; or interest expense. NOI is helpful because it helps both investors and management to understand the operating performance of real estate excluding costs associated with decisions about acquisition pricing, overhead allocations, and financing arrangements. NOI is also considered by many in the real estate industry to be a useful measure for determining the value of real estate. Reconciliations of NOI as presented in this Earnings Release and Supplemental Information to Aimco’s consolidated GAAP amounts are provided below.
Due to the diversity of its economic ownership interests in its apartment communities in the periods presented, Aimco evaluates the performance of the apartment communities in its segments using Proportionate Property NOI, which represents Aimco’s share of the NOI for the apartment communities that Aimco consolidates and manages, but excludes apartment communities that it does not consolidate. Proportionate Property NOI is defined as Aimco share of rental and other property revenue less Aimco share of property operating expenses. In its evaluation of community results, Aimco excludes utility cost reimbursement from rental and other property revenues and reflects such amount as a reduction of the related utility expense within property operating expenses. The following table presents the reconciliation of GAAP rental and other property revenue to the proportionate revenues before utility reimbursements and GAAP property operating expenses to proportionate expenses, net of utility reimbursements. The table also presents the reconciliation of consolidated Same Store revenue before utility reimbursements and
| 38 |
expenses, net of utility reimbursements as presented on Supplemental Schedule 2(a) to the proportionate amounts presented on Supplemental Schedule 6.
Segment NOI Reconciliation | |
(in thousands) (unaudited) | | Three Months Ended | |
| | September 30, 2020 | | | September 30, 2019 | |
| | Revenues, Before Utility Reimbursements | | | Expenses, Net of Utility Reimbursements | | | Revenues, Before Utility Reimbursements | | | Expenses, Net of Utility Reimbursements | |
Total Real Estate Operations | | | | | | | | | | | | | | | | |
Total (per consolidated statements of operations) | | $ | 215,455 | | | $ | 74,929 | | | $ | 229,827 | | | $ | 77,484 | |
Adjustment: Utilities reimbursement [1] | | | (8,503 | ) | | | (8,503 | ) | | | (7,494 | ) | | | (7,494 | ) |
Adjustment: Sold properties and other amounts not allocated [2] | | | (2,082 | ) | | | (4,055 | ) | | | (8,084 | ) | | | (7,924 | ) |
Total (per Supplemental Schedule 2) | | | 204,870 | | | | 62,371 | | | | 214,249 | | | | 62,066 | |
Proportionate adjustment [3] | | | (4,028 | ) | | | (1,203 | ) | | | (896 | ) | | | (296 | ) |
Proportionate property net operating income | | $ | 200,842 | | | $ | 61,168 | | | $ | 213,353 | | | $ | 61,770 | |
| | | | | | | | | | | | | | | | |
Total Same Store Operations | | | | | | | | | | | | | | | | |
Same Store amounts (per Supplemental Schedule 2) | | $ | 174,530 | | | $ | 50,121 | | | $ | 183,876 | | | $ | 50,500 | |
Proportionate adjustment [3] | | | (13,143 | ) | | | (3,340 | ) | | | (14,163 | ) | | | (3,109 | ) |
Same Store amounts, adjusted (per Supplemental Schedule 6) | | $ | 161,387 | | | $ | 46,781 | | | $ | 169,713 | | | $ | 47,391 | |
Segment NOI Reconciliation | |
(in thousands) (unaudited) | | Nine Months Ended | |
| | September 30, 2020 | | | September 30, 2019 | |
| | Revenues, Before Utility Reimbursements | | | Expenses, Net of Utility Reimbursements | | | Revenues, Before Utility Reimbursements | | | Expenses, Net of Utility Reimbursements | |
Total Real Estate Operations | | | | | | | | | | | | | | | | |
Total (per consolidated statements of operations) | | $ | 658,815 | | | $ | 224,532 | | | $ | 684,262 | | | $ | 232,090 | |
Adjustment: Utilities reimbursement [1] | | | (23,862 | ) | | | (23,862 | ) | | | (21,916 | ) | | | (21,916 | ) |
Adjustment: Sold properties and other amounts not allocated [2] | | | (5,266 | ) | | | (18,975 | ) | | | (32,529 | ) | | | (30,352 | ) |
Total (per Supplemental Schedule 2) | | | 629,687 | | | | 181,695 | | | | 629,817 | | | | 179,822 | |
Proportionate adjustment [3] | | | (5,806 | ) | | | (1,755 | ) | | | (2,473 | ) | | | (788 | ) |
Proportionate property net operating income | | $ | 623,881 | | | $ | 179,940 | | | $ | 627,344 | | | $ | 179,034 | |
| | | | | | | | | | | | | | | | |
Total Same Store Operations | | | | | | | | | | | | | | | | |
Same Store amounts (per Supplemental Schedule 2) | | $ | 538,521 | | | $ | 146,370 | | | $ | 543,638 | | | $ | 147,130 | |
Proportionate adjustment [3] | | | (40,902 | ) | | | (9,399 | ) | | | (42,015 | ) | | | (9,291 | ) |
Same Store amounts, adjusted (per Supplemental Schedule 6) | | $ | 497,619 | | | $ | 136,971 | | | $ | 501,623 | | | $ | 137,839 | |
[1] | Approximately two-thirds of Aimco’s utility costs are reimbursed by residents. These reimbursements are included in rental and other property revenues on Aimco’s consolidated statements of operations prepared in accordance with GAAP. This adjustment represents the reclassification of utility reimbursements from revenues to property operating expenses for the purpose of evaluating segment results and as presented on Supplemental Schedule 2, Supplemental Schedule 3, and Supplemental Schedule 6. Aimco also excludes the reimbursement amounts from the calculation of Average Revenue per Apartment Home throughout this Earnings Release and Supplemental Schedules. | |
[2] | Sold properties and other amounts not allocated includes operating results of apartment communities sold during the periods shown or held for sale at the end of the period, as well as property management and casualty expense, which are not included in property operating expenses, net of utility reimbursements in the Supplemental Schedule 2 presentation. The write-off of straight-line rent receivables, recognized due to the impact of COVID-19 and the resulting economic impact on our commercial tenants, are included in consolidated rental and property revenues and are not included in our measurement of segment performance for the three and nine months ended September 30, 2020. | |
[3] | Proportionate adjustments represent the noncontrolling interests’ share of the rental and other property revenues before utility reimbursements and property operating expenses, net of utility reimbursements. Such adjustment is necessary to reconcile consolidated amounts presented on Supplemental Schedule 2 to the amounts allocated to Aimco’s operating segments, as well as to reconcile Same Store amounts presented on Supplemental Schedule 2 to proportionate same store amounts presented on Supplemental Schedules 6. | |
| 39 |
PORTFOLIO QUALITY RATINGS: Aimco measures the quality of apartment communities in its portfolio based on average rents of its apartment homes compared to local market average rents as reported by a third-party provider of commercial real estate performance and analysis. Under this rating system, Aimco classifies as “A” quality apartment communities those earning rents greater than 125% of local market average; as “B” quality apartment communities those earning rents between 90% and 125% of local market average; “C+” quality apartment communities those earning rents greater than $1,100 per month, but lower than 90% of local market average; and “C” quality apartment communities those earning rents less than $1,100 per month and lower than 90% of local market average.
REAL ESTATE CLASSIFICATIONS: Aimco’s portfolio of apartment communities is diversified by both price point and geography. Aimco’s portfolio is classified into three segments, as follows:
SAME STORE: Same Store apartment communities are apartment communities that (a) are owned and managed by Aimco, (b) had reached a stabilized level of operations as of January 1, 2019, and maintained it throughout the current and the comparable prior periods, and (c) are not expected to be sold within 12 months.
REDEVELOPMENT/DEVELOPMENT: Includes apartment communities currently under construction that have not achieved a stabilized level of operations and communities that have been completed in recent years that had not achieved and maintained stabilized operations for both the current and the comparable prior periods.
ACQUISITION AND OTHER REAL ESTATE: Includes communities acquired since January 1, 2019, communities subject to limitations on rent increases, communities that Aimco expects to sell within 12 months that do not meet the criteria to be classified as held for sale, communities that Aimco expects to redevelop, and certain commercial spaces.
SOLD AND HELD FOR SALE APARTMENT COMMUNITIES: Apartment communities either sold since January 1, 2019 or classified as held for sale at the end of the period. For purposes of highlighting results of operations related to Aimco’s retained portfolio, results for Sold and Held For Sale Apartment Communities are excluded from property net operating income and presented separately on a net basis on Supplemental Schedule 2. Information about property net operating income for sold and held for sale apartment communities may be found on Supplemental Schedule 3.
TURNOVER and RETENTION: Turnover represents the percentage of residents who have moved out in the trailing twelve months. It is calculated by dividing the number of move outs in the trailing twelve months, exclusive of intra-community transfers, by the daily average number of occupied apartment homes during the trailing twelve months. For the twelve months ended September 30, 2020, Turnover was 41.9%, 280 basis points lower than the twelve months ended September 30, 2019. Inclusive of intra-community transfers, Turnover was 46.6% for the trailing twelve months ended September 30, 2020.
Retention represents the inverse of Turnover, as defined above.
| 40 |