Item 1: Report to Shareholders| Personal Strategy Income Fund | November 30, 2005 |
The views and opinions in this report were current as of November 30, 2005. They are not guarantees of performance or investment results and should not be taken as investment advice. Investment decisions reflect a variety of factors, and the managers reserve the right to change their views about individual stocks, sectors, and the markets at any time. As a result, the views expressed should not be relied upon as a forecast of the fund’s future investment intent. The report is certified under the Sarbanes-Oxley Act of 2002, which requires mutual funds and other public companies to affirm that, to the best of their knowledge, the information in their financial reports is fairly and accurately stated in all material respects.
REPORTS ON THE WEB
Sign up for our E-mail Program, and you can begin to receive updated fund reports and prospectuses online rather than through the mail. Log in to your account at troweprice.com for more information.
Fellow Shareholders
Stronger stock markets, undeterred by rising oil prices and the Fed’s short-term interest rate increases, helped the Personal Strategy Funds generate favorable returns for the six-month period ended November 30, 2005. Small-cap shares paced the advance. With interest rates rising across all maturities, investment-grade bond returns were lackluster, but high-yield issues produced decent gains. Despite the greenback’s strength, non-U.S. stocks outperformed their domestic peers in U.S. dollar terms, and emerging markets produced outstanding results.
MARKET ENVIRONMENT
In the last six months, the U.S. economy continued its steady growth. The nation’s gross domestic product (GDP) expanded by more than 3%, job creation continued at a solid pace, and unemployment hovered around 5%. Inflation remained relatively modest even though oil prices spiked in late August to $70 per barrel after Hurricane Katrina severely disrupted energy production along the Gulf Coast. As gasoline prices temporarily surged to more than $3 per gallon and it appeared that higher heating oil and natural gas prices would produce a significant jump in heating costs this winter, consumer sentiment soured. By the end of November, however, oil supplies had increased and pump prices had dropped to pre-Katrina levels.
Although Federal Reserve officials acknowledged that the summer’s storm damage and the prospects for elevated energy costs had generated economic uncertainty, they concluded the impact on the economy would be minimal and opted to continue the tightening monetary policy. During the six months ended November 30, the central bank methodically raised the federal funds target rate to 4.00%—a level not seen in more than four years. After the reporting period ended, the Fed boosted the target rate another 25 basis points (0.25%) to 4.25% on December 13, the 13th rate increase since June 2004, when the fed funds rate stood at 1.00%.
| THE FED’S ROLE AND WHAT IT MEANS TO YOU |
After the January 31, 2006, Federal Open Market Committee (FOMC) meeting, Chairman Alan Greenspan will retire. His successor will be Ben S. Bernanke, currently the chairman of President Bush’s Council of Economic Advisers, and former Fed governor and Princeton professor. Mary Miller, director of T. Rowe Price’s Fixed Income Division, says, “For 18 years Alan Greenspan has been a steady hand at the Fed’s helm, guiding us through volatile financial markets and geopolitical events with sound reasoning and long-term perspective. His inflation-fighting resolve has structurally lowered inflation expectations, leading to milder business cycles and greater prosperity.”
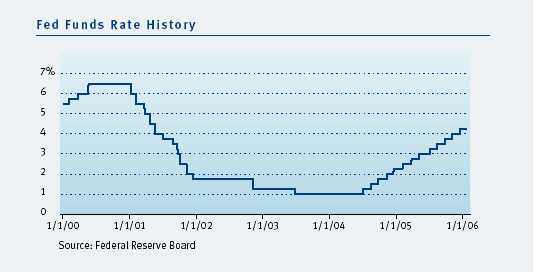
Why should you care about the Fed’s moves or Greenspan’s successor? The short answer is the central bank’s actions—including setting monetary policy and overseeing the integrity of the banking system—impact mortgage rates, credit card costs, and fixed-income yields. At the most visible level, the Fed raises short-term interest rates to curb inflation when the economy is growing quickly and lowers them when it wants to stimulate economic growth. The chart below shows the FOMC systematically lowering rates in 2001 as the economy slipped into recession following the implosion of the dot-com bubble. Once the economy gained traction, the Fed started raising the fed funds rate. The stairstep increases from mid-2004 to date have had the desired effect of slowing GDP growth while keeping inflation from accelerating. Most credit-market experts correctly anticipated the December 13 rate increase and expect another quarter-point rate hike at the January 31 FOMC meeting.
Miller thinks that Bernanke’s monetary policy should dovetail seamlessly with Greenspan’s. In his statement to the Senate Banking Committee, Bernanke affirmed, “under Greenspan, monetary policy has become increasingly transparent to the public and financial markets, a trend I strongly support.” This focus, in Miller’s view, is a positive for credit-market stability. She added, “The incoming chairman’s pledge to target the inflation level he considers consistent with long-term price stability is not a departure from present practices and should continue to benefit fixed-income investors.”
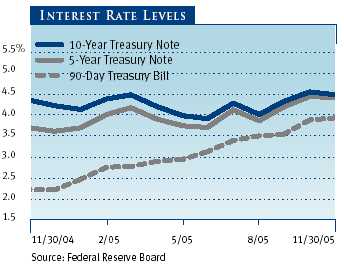
As shown in the graph on page 1, money market yields climbed steadily in the first half of our fiscal year, tracking the fed funds rate. Intermediate-term interest rates also increased but to a lesser extent. Long-term rates were relatively stable, resulting in a significant narrowing of the difference between short- and long-term rates—also known as a flattening of the Treasury yield curve. In late November, five-year Treasury yields were briefly lower than two-year Treasury yields.
Supported by solid economic and corporate profit growth, relatively low interest rates, and increased merger activity, U.S. stocks rose in the last six months. Small-cap shares decisively surpassed their larger peers: the small-cap Russell 2000 Index gained 10.47% compared to 5.88% for the large-cap S&P 500 Index. As measured by various Russell indexes, growth stocks outperformed their value counterparts across all market capitalizations—a reversal of the value outperformance trend that has prevailed for several years.
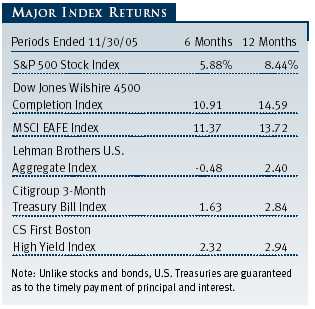
Investment-grade bond returns were flat or negative. Corporate and U.S. government bonds weakened the most, especially long-term issues. Mortgage-and asset-backed securities were little changed, but high-yield securities rebounded from a period of weakness in the spring and posted gains. The Lehman Brothers U.S. Aggregate Index, which measures the performance of domestic investment-grade taxable bonds, returned -0.48%.
Non-U.S. equity markets outperformed those in the U.S. Among developed international markets, Japanese shares fared much better than European stocks in U.S. dollar terms. The MSCI EAFE Index, a measure of large-cap share performance in Europe, Australasia, and the Far East, returned 11.37%.
PERFORMANCE AND STRATEGY REVIEW
The funds’ investment committee meets monthly to adjust the weightings of stocks, bonds, and money market securities within the appropriate ranges for each fund. Economic fundamentals and market conditions drive these allocation changes.
For much of the last 12 months, we have maintained a 7% overweight to stocks. With stocks outperforming bonds during that period, the increased allocation to stocks was beneficial. However, within the past six months, we have shifted about 1% of our assets from stocks into bonds, reducing our exposure to equities. Within our fixed-income holdings, we maintained a heightened allocation to cash and short-term bonds to mitigate the impact of rising interest rates while capturing the rise in short-term yields.
Within our stock holdings, we increased our domestic large-cap allocation, particularly high-quality growth stocks. We believe we have entered a period of solid but slowing earnings growth and that investors are likely to follow historical precedents and pay a premium for those high-quality large-caps whose earnings grow faster than the market. We decreased our allocation to small-cap companies because their valuations are no longer as compelling as they had been earlier. Our overweighting in large-cap growth contributed to the portfolios’ performance relative to their weighted benchmarks.
Strong returns in non-U.S. markets extended their multi-year rally into 2005 and boosted the funds’ performance for the period. However, given several years of solid performance by non-U.S. equities and the prospects of more favorable profit growth in U.S. companies, we reduced our allocation to non-U.S. equities in early 2005 and increased our purchases of U.S. equities. We currently have a neutral weighting in non-U.S. equities as we believe valuations are reasonable. Even though economic growth in the developed markets of Europe and Japan has been lackluster, many companies have been able to use productivity gains to squeeze more earnings out of modest revenue growth.
Within our fixed-income holdings, we have increased our allocation over the past 12 months to investment-grade bonds and reduced our exposure to high-yield bonds, given the historically rich valuations in the high-yield sector.
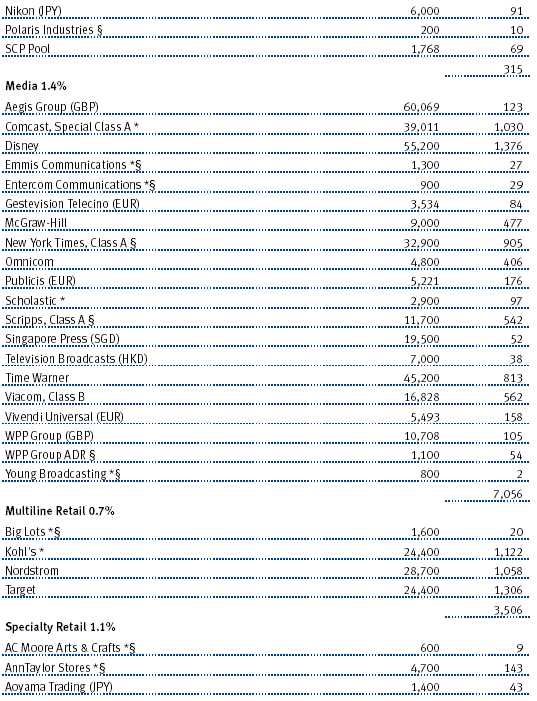
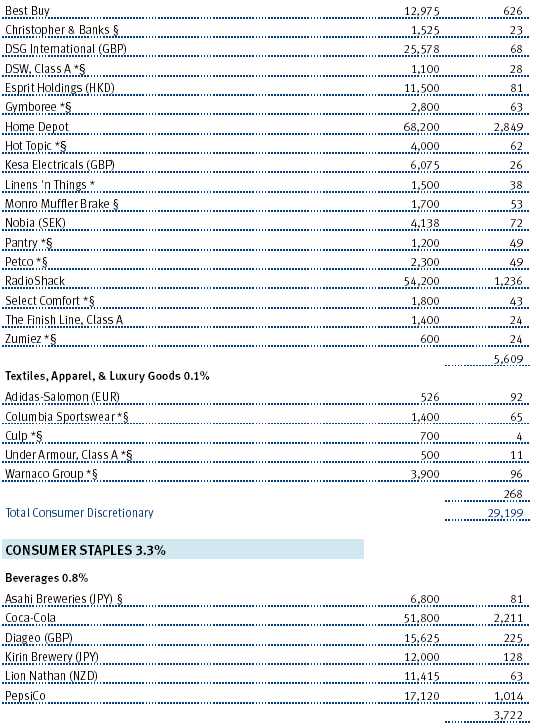
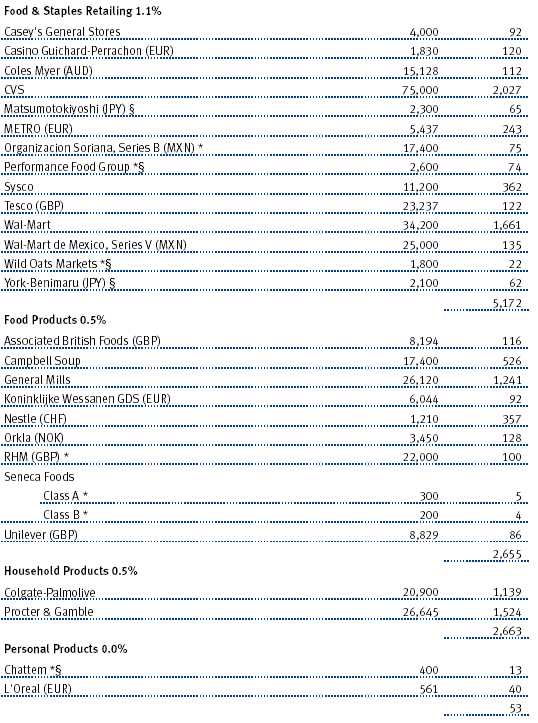
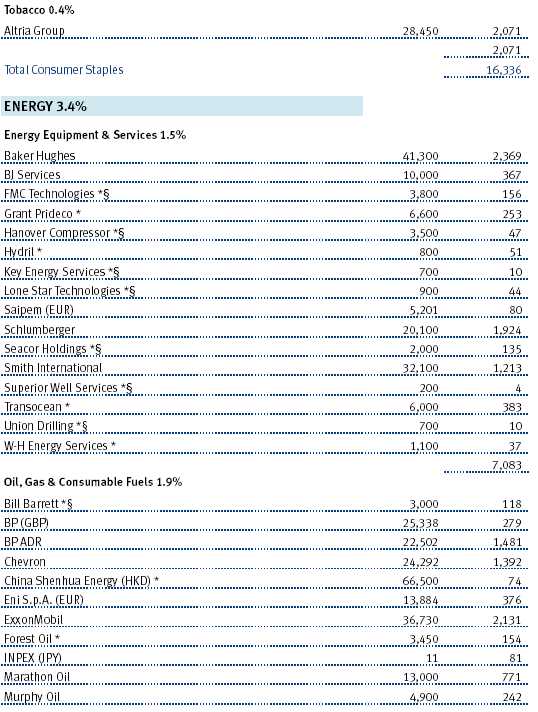
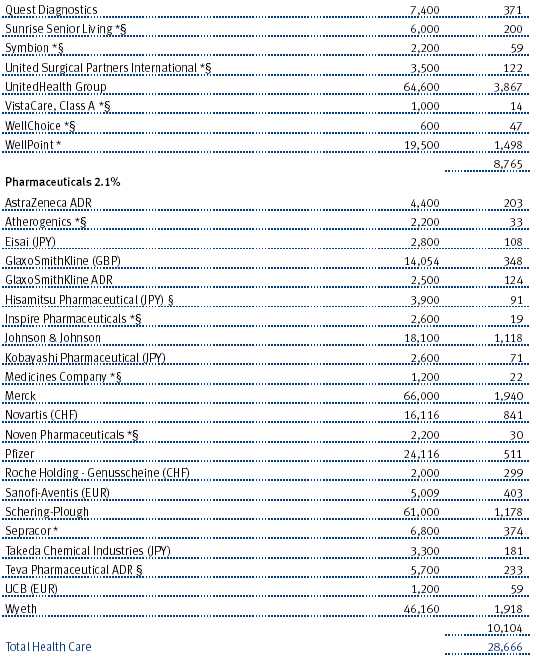
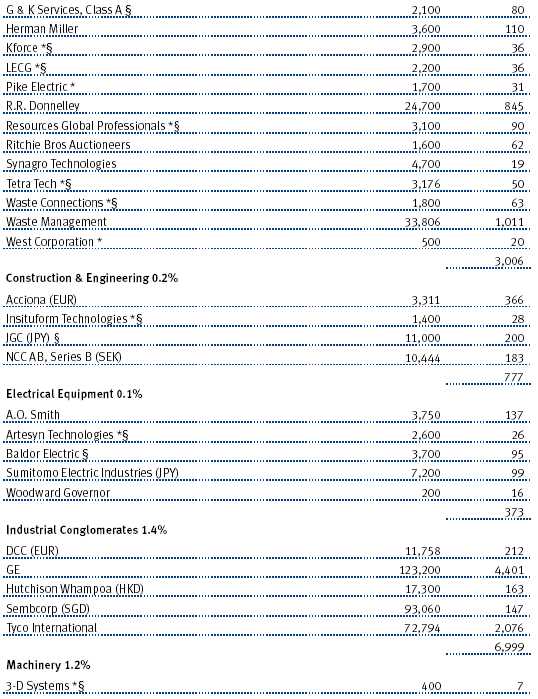
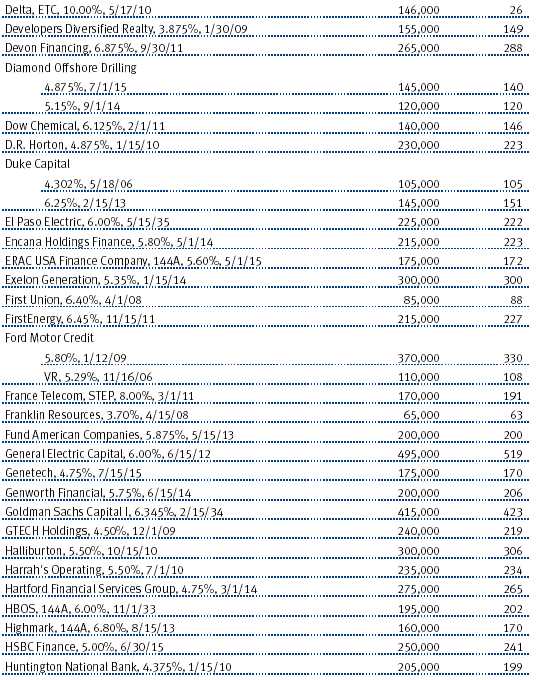
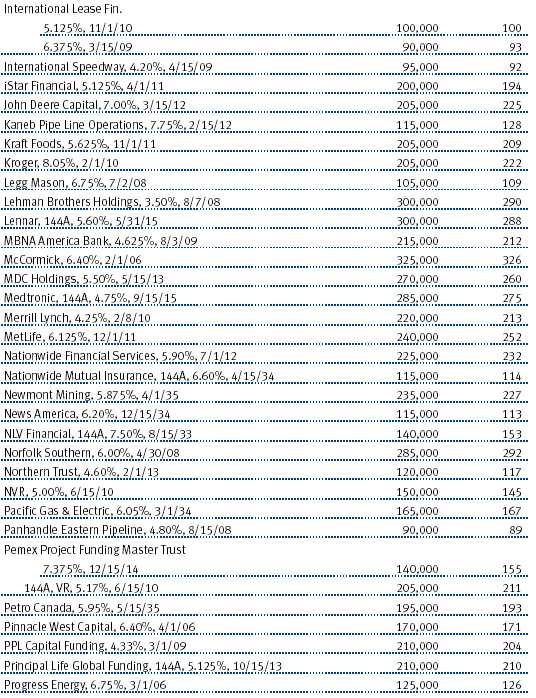
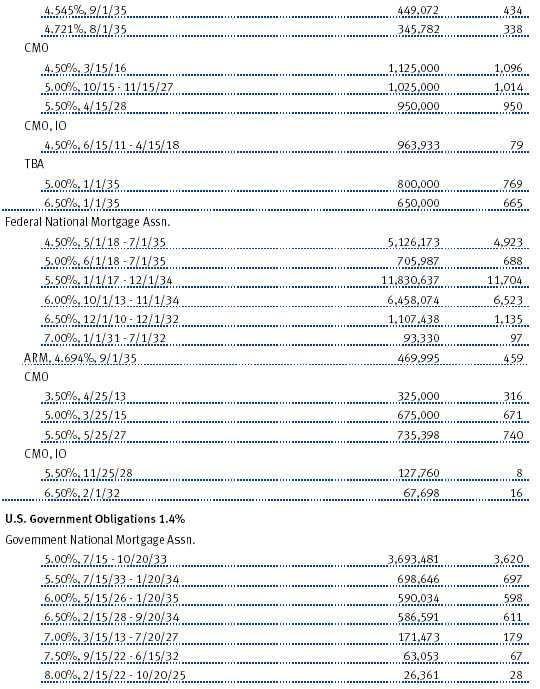
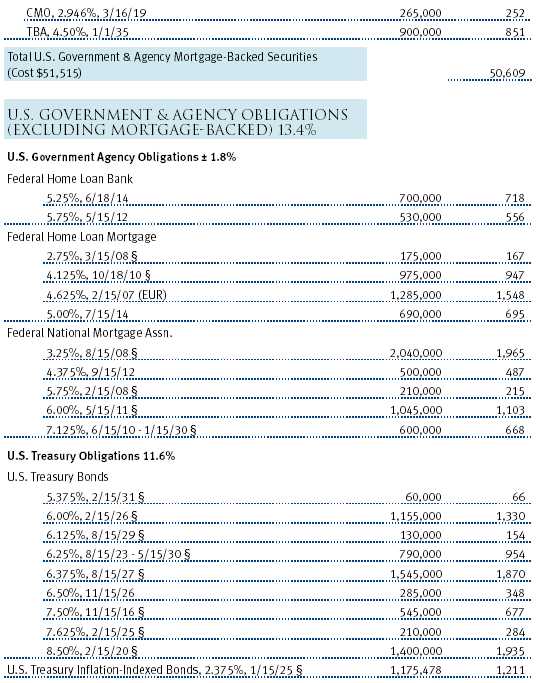
Among our major equity holdings, Microsoft continues to generate solid revenue and earnings and maintains 60% operating margins. Nevertheless, it continues to trade at a discount relative to its peers. The company is no longer solely a software company. Microsoft has expanded into home entertainment with its Xbox 360 video game console and is likely to solidify its presence with the 2007 release of its next-generation operating software. The economy’s recovery is improving fundamentals across General Electric’s business lines. The company’s largest businesses, power and aerospace, are poised to generate double-digit earnings per share growth during the next two years. Also, the health care division is introducing new products, and NBC/Universal is improving despite the loss of some key programs. American International Group, the large international insurance company, continues to post strong results and embark on important strategic initiatives despite the disruption from its change in top management and the restatement of its annual earnings back to 2000. UnitedHealth Group has gained market share while maintaining a strong balance sheet. The company has diversified its revenue base and improved its operating margins. (Please refer to our portfolio of investments for a complete listing of the funds’ holdings and the amount each represents in the portfolios.)
PERSONAL STRATEGY INCOME FUND
| The Personal Strategy Income Fund’s investment objective is to gen- |
| erate the highest total return consistent with an emphasis on income |
| first and capital appreciation second. The typical mix of securities for |
| the fund is 40% stocks, 40% bonds, and 20% money market securi- |
| ties, although allocations can vary by as much as 10 percentage points |
| above or below these levels. |
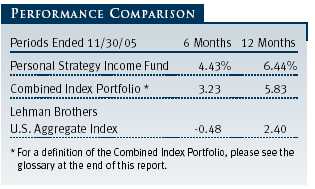
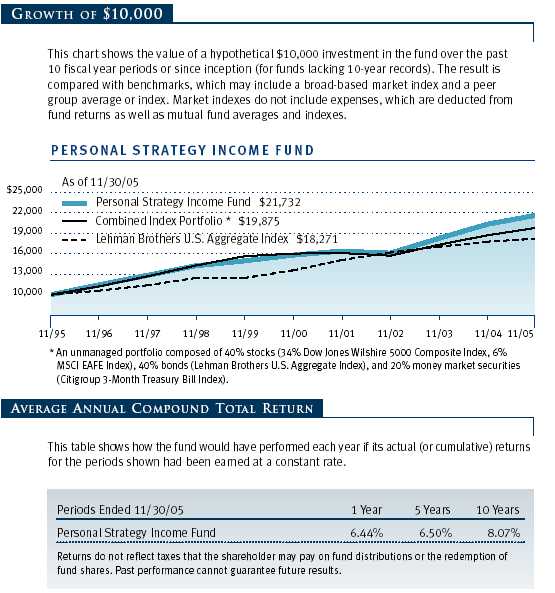
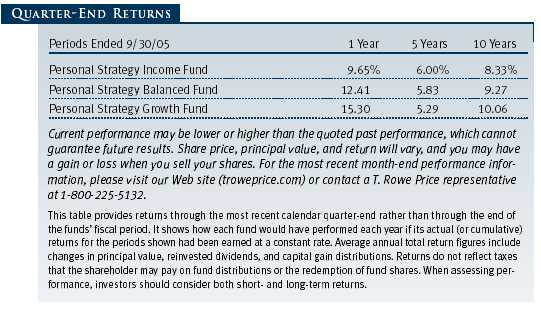
The Personal Strategy Income Fund posted gains for the 6- and 12-month periods ended November 30, 2005, as shown in the table. The fund outpaced the Combined Index Portfolio and the Lehman Brothers U.S. Aggregate Index for the 6- and 12-month periods, aided by our heavier exposure to stocks relative to bonds and the strong performance of our non-U.S. equities.
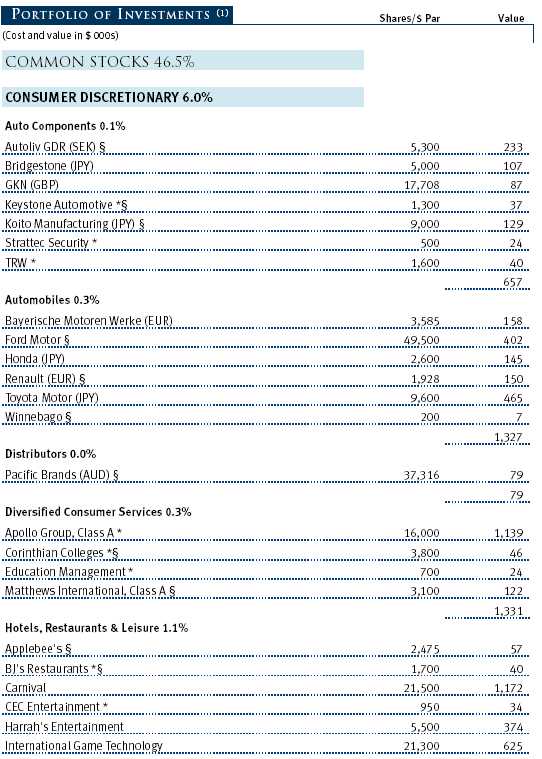
At the end of the period, 39.3% of the fund’s net assets were in bonds, representing a slight increase since our last report. Stock holdings were 46.5%, virtually identical to six months ago. Cash has decreased slightly to 14.2%. Over the last six months, we also reduced the allocation of small-cap stocks and increased our holding of investment-grade bonds.
PERSONAL STRATEGY BALANCED FUND
| The Personal Strategy Balanced Fund’s investment objective is to gen- |
| erate the highest total return consistent with an equal emphasis on |
| income and capital appreciation. The typical asset mix of securities is |
| 60% stocks, 30% bonds, and 10% cash, although allocations can vary |
| by as much as 10 percentage points above or below these levels. This |
| asset allocation entails higher risk but also a higher potential return |
| over the long term than the Personal Strategy Income Fund. |
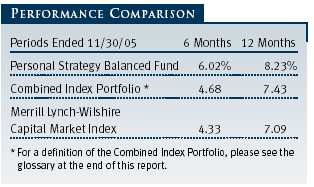
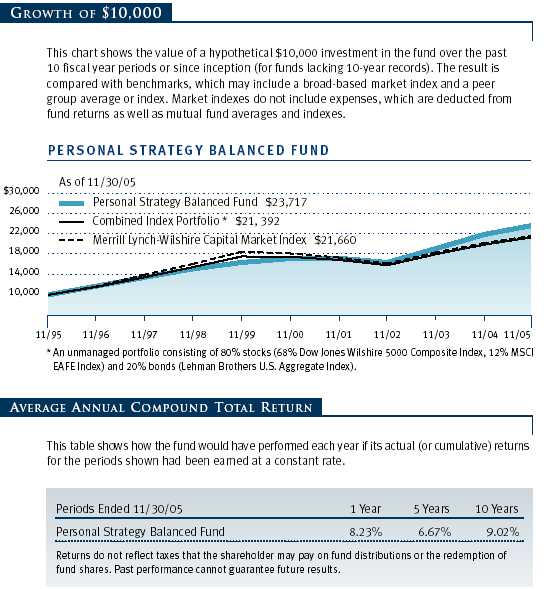
The Personal Strategy Balanced Fund posted gains for the six and 12 months ended November 30, 2005, as shown in the table. The fund outpaced the Combined Index Portfolio and the Merrill Lynch-Wilshire Capital Market Index for the 6- and 12-month periods, aided by our heavier exposure to stocks relative to bonds and the strong performance of our non-U.S. equities.
We continue to underweight fixed income, but over the past six months, we increased the target allocation by 1%. The fund’s bond allocation is 28.4%, slightly below our neutral level of 30%. The fund’s cash position has increased to 5.6%, a shade higher than six months ago. As mentioned in the Performance and Strategy Review section, we have maintained a relatively heavier stock allocation and reallocated our stock holdings—reducing small-cap shares to supplement large-cap growth.
PERSONAL STRATEGY GROWTH FUND
| The Personal Strategy Growth Fund’s investment objective is to seek |
| capital appreciation by investing primarily in common stocks. The |
| typical asset mix is 80% stocks and 20% bond and money market |
| securities, although allocations can vary by as much as 10 percentage |
| points above or below these levels. This asset allocation entails higher |
| risk but also a higher potential return over the long term than the |
| Personal Strategy Income and Personal Strategy Balanced Funds. |
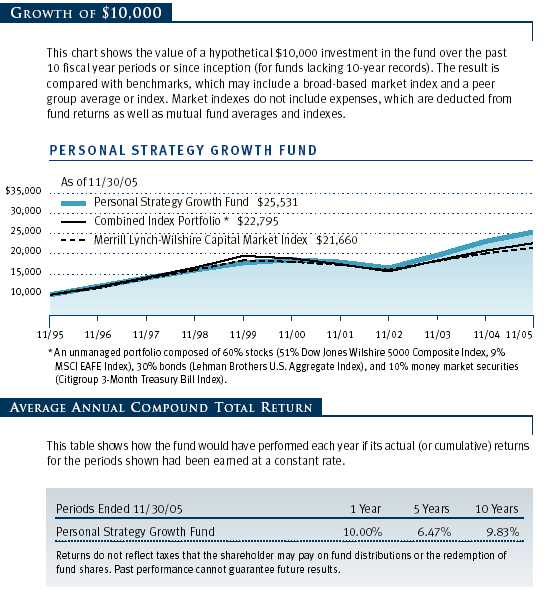
The Personal Strategy Growth Fund posted gains for the six and 12 months ended November 30, 2005, as shown in the table. The fund outpaced the Combined Index Portfolio and the Merrill Lynch-Wilshire Capital Market Index for the 6- and 12-month periods, aided by our heavier exposure to stocks relative to bonds and the strong performance of our non-U.S. equities.

We made a few changes in the fund’s allocations between stocks and bonds. Since the fund’s primary objective is growth, we maintain a large position in equities—86.1% at the end of this period, which is 1% less than what had been our targeted weight at the end of May. As a result of our decision to shift a small allocation from stocks to bonds in August, our bond position of 12.7% has increased from the 11.5% allocation six months ago. During the year, as mentioned in the Performance and Strategy Review section, we reallocated our stock holdings, reducing small-cap to supplement large-cap growth.
OUTLOOK
The Federal Reserve may be approaching the end of its rate hikes, but we believe that with the maturing of the economic cycle the upward pressure on interest rates will continue. For the past year, long-term rates, particularly the 30-year Treasury, have moved very little at the same time that short-term rates have climbed, but eventually they will begin to move in the same direction as short-term rates. Although we do not necessarily believe that equity markets will outperform fixed income for the next three to six months, we believe that they will over the next two years. Profit growth will likely remain solid, but the rate of growth should decelerate as higher interest rates and energy costs take their toll on corporate earnings growth. With their varying investment objectives in mind, the funds also maintain solid allocations in fixed income and cash to dampen overall portfolio volatility and moderate risk. Investors should be well served by this fundamental commitment to diversification across asset classes.
Respectfully submitted,

Edmund M. Notzon III
Chairman of the funds’ Investment Advisory Committee
December 16, 2005
The committee chairman has day-to-day responsibility for managing the portfolios and works with committee members in developing and executing the funds’ investment programs.
RISKS OF INVESTING
As with all stock and bond mutual funds, each fund’s share price can fall because of weakness in the stock or bond markets, a particular industry, or specific holdings. Stock markets can decline for many reasons, including adverse political or economic developments, changes in investor psychology, or heavy institutional selling. The prospects for an industry or company may deteriorate because of a variety of factors, including disappointing earnings or changes in the competitive environment. In addition, the investment manager’s assessment of companies held in a fund may prove incorrect, resulting in losses or poor performance even in rising markets.
Bonds are subject to interest rate risk, the decline in bond prices that usually accompanies a rise in interest rates, and credit risk, the chance that any fund holding could have its credit rating downgraded or that a bond issuer will default (fail to make timely payments of interest or principal), potentially reducing the fund’s income level and share price. High-yield corporate bonds could have greater price declines than funds that invest primarily in high-quality bonds. Companies issuing high-yield bonds are not as strong financially as those with higher credit ratings, so the bonds are usually considered speculative investments.
Funds that invest overseas may carry more risk than funds that invest strictly in U.S. assets. Risks can result from varying stages of economic and political development, differing regulatory environments, trading days, and accounting standards, and higher transaction costs of non-U.S. markets. Non-U.S. investments are also subject to currency risk, or a decline in the value of a foreign currency versus the U.S. dollar, which reduces the dollar value of securities denominated in that currency.
GLOSSARY
Citigroup 3-Month Treasury Bill Index: An unmanaged index that tracks short-term U.S. government debt instruments.
Combined Index Portfolios: Unmanaged portfolios composed of the following underlying indexes:
Personal Strategy Income—40% stocks (34% Dow Jones Wilshire 5000 Composite Index, 6% MSCI EAFE Index), 40% bonds (Lehman Brothers U.S. Aggregate Index), and 20% money market securities (Citigroup 3-Month Treasury Bill Index).
Personal Strategy Balanced—60% stocks (51% Dow Jones Wilshire 5000 Composite Index, 9% MSCI EAFE Index), 30% bonds (Lehman Brothers U.S. Aggregate Index), and 10% money market securities (Citigroup 3-Month Treasury Bill Index).
Personal Strategy Growth—80% stocks (68% Dow Jones Wilshire 5000 Composite Index, 12% MSCI EAFE Index) and 20% bonds (Lehman Brothers U.S. Aggregate Index).
CS First Boston High Yield Index: An unmanaged index constructed to mirror the high-yield debt market.
Dow Jones Wilshire 4500 Completion Index: An unmanaged index that tracks the performance of all stocks in the Dow Jones Wilshire 5000 Composite Index, excluding those found in the S&P 500 Stock Index.
Dow Jones Wilshire 5000 Composite Index: An unmanaged index that tracks the performance of the most active stocks in the broad U.S. market.
Duration: The average time (expressed in years) it takes investors to receive the present value of the future cash flows on their investment. It is used to measure the sensitivity of bond prices to interest rate changes (the shorter the duration, the less the bond’s price will rise or fall in value when interest rates change). Duration is affected by maturity, the coupon, and the time interval between payments. Other things being equal, a bond with a higher coupon will have a shorter duration, while zero-coupon bonds have the longest.
Lehman Brothers U.S. Aggregate Index: An unmanaged index that tracks investment-grade corporate and government bonds.
Merrill Lynch-Wilshire Capital Market Index: A market capitalization-weighted index including the Wilshire 5000 and Merrill Lynch High Yield II and Domestic Master indexes.
MSCI EAFE Index: An unmanaged index that tracks the stocks of about 1,000 companies in Europe, Australasia, and the Far East (EAFE).
Russell 2000 Index: Consists of the smallest 2,000 companies in the Russell 3000 Index. Performance is reported on a total return basis.
Russell 2000 Value Index: Market-weighted total return index that measures the performance of companies within the Russell 2000 Index having lower price/book value ratios and lower forecasted growth rates.
Russell 2000 Growth Index: Market-weighted total return index that measures the performance of companies within the Russell 2000 Index having higher price/book value ratios and higher forecasted growth rates.
S&P 500 Stock Index: An unmanaged index that tracks the stocks of 500 primarily large-cap U.S. companies.

As a mutual fund shareholder, you may incur two types of costs: (1) transaction costs such as redemption fees or sales loads and (2) ongoing costs, including management fees, distribution and service (12b-1) fees, and other fund expenses. The following example is intended to help you understand your ongoing costs (in dollars) of investing in the fund and to compare these costs with the ongoing costs of investing in other mutual funds. The example is based on an investment of $1,000 invested at the beginning of the most recent six-month period and held for the entire period.
Actual Expenses
The first line of the following table (“Actual”) provides information about actual account values and actual expenses. You may use the information in this line, together with your account balance, to estimate the expenses that you paid over the period. Simply divide your account value by $1,000 (for example, an $8,600 account value divided by $1,000 = 8.6), then multiply the result by the number in the first line under the heading “Expenses Paid During Period” to estimate the expenses you paid on your account during this period.
Hypothetical Example for Comparison Purposes
The information on the second line of the table (“Hypothetical”) is based on hypothetical account values and expenses derived from the fund’s actual expense ratio and an assumed 5% per year rate of return before expenses (not the fund’s actual return). You may compare the ongoing costs of investing in the fund with other funds by contrasting this 5% hypothetical example and the 5% hypothetical examples that appear in the shareholder reports of the other funds. The hypothetical account values and expenses may not be used to estimate the actual ending account balance or expenses you paid for the period.
Note: T. Rowe Price charges an annual small-account maintenance fee of $10, generally for accounts with less than $2,000 ($500 for UGMA/UTMA). The fee is waived for any investor whose T. Rowe Price mutual fund accounts total $25,000 or more, accounts employing automatic investing, and IRAs and other retirement plan accounts that utilize a prototype plan sponsored by T. Rowe Price (although a separate custodial or administrative fee may apply to such accounts). This fee is not included in the accompanying table. If you are subject to the fee, keep it in mind when you are estimating the ongoing expenses of investing in the fund and when comparing the expenses of this fund with other funds.
You should also be aware that the expenses shown in the table highlight only your ongoing costs and do not reflect any transaction costs, such as redemption fees or sales loads. Therefore, the second line of the table is useful in comparing ongoing costs only and will not help you determine the relative total costs of owning different funds. To the extent a fund charges transaction costs, however, the total cost of owning that fund is higher.

Unaudited
The accompanying notes are an integral part of these financial statements.
Unaudited


The accompanying notes are an integral part of these financial statements.
Unaudited
The accompanying notes are an integral part of these financial statements.
Unaudited
The accompanying notes are an integral part of these financial statements.
Unaudited
The accompanying notes are an integral part of these financial statements.
Unaudited
| NOTES TO FINANCIAL STATEMENTS |
NOTE 1 - SIGNIFICANT ACCOUNTING POLICIES
T. Rowe Price Personal Strategy Funds, Inc. (the corporation) is registered under the Investment Company Act of 1940 (the 1940 Act). The Personal Strategy Income Fund (the fund), a diversified, open-end management investment company, is one portfolio established by the corporation. The fund commenced operations on July 29, 1994. The fund seeks the highest total return over time consistent with a primary emphasis on income and a secondary emphasis on capital growth. The fund pursues this objective by investing in a diversified portfolio typically consisting of about 40% stocks, 40% bonds, and 20% money market securities.
The accompanying financial statements were prepared in accordance with accounting principles generally accepted in the United States of America, which require the use of estimates made by fund management. Fund management believes that estimates and security valuations are appropriate; however actual results may differ from those estimates, and the security valuations reflected in the financial statements may differ from the value the fund ultimately realizes upon sale of the securities.
Valuation The fund values its investments and computes its net asset value per share at the close of the New York Stock Exchange (NYSE), normally 4 p.m. ET, each day that the NYSE is open for business. Equity securities listed or regularly traded on a securities exchange or in the over-the-counter market are valued at the last quoted sale price or, for certain markets, the official closing price at the time the valuations are made, except for OTC Bulletin Board securities, which are valued at the mean of the latest bid and asked prices. A security that is listed or traded on more than one exchange is valued at the quotation on the exchange determined to be the primary market for such security. Listed securities not traded on a particular day are valued at the mean of the latest bid and asked prices for domestic securities and the last quoted sale price for international securities.
Debt securities are generally traded in the over-the-counter market. Securities with original maturities of one year or more are valued at prices furnished by dealers who make markets in such securities or by an independent pricing service, which considers yield or price of bonds of comparable quality, coupon, maturity, and type, as well as prices quoted by dealers who make markets in such securities. Securities with original maturities of less than one year are valued at amortized cost in local currency, which approximates fair value when combined with accrued interest.
Investments in mutual funds are valued at the mutual fund’s closing net asset value per share on the day of valuation. Financial futures contracts are valued at closing settlement prices.
Other investments, including restricted securities, and those for which the above valuation procedures are inappropriate or are deemed not to reflect fair value are stated at fair value as determined in good faith by the T. Rowe Price Valuation Committee, established by the fund’s Board of Directors.
Most foreign markets close before the close of trading on the NYSE. If the fund determines that developments between the close of a foreign market and the close of the NYSE will, in its judgment, materially affect the value of some or all of its portfolio securities, which in turn will affect the fund’s share price, the fund will adjust the previous closing prices to reflect the fair value of the securities as of the close of the NYSE, as determined in good faith by the T. Rowe Price Valuation Committee, established by the fund’s Board of Directors. A fund may also fair value securities in other situations, such as when a particular foreign market is closed but the fund is open. In deciding whether to make fair value adjustments, the fund reviews a variety of factors, including developments in foreign markets, the performance of U.S. securities markets, and the performance of instruments trading in U.S. markets that represent foreign securities and baskets of foreign securities. The fund uses outside pricing services to provide it with closing market prices and information used for adjusting those prices. The fund cannot predict when and how often it will use closing prices and when it will adjust those prices to reflect fair value. As a means of evaluating its fair value process, the fund routinely compares closing market prices, the next day’s opening prices in the same markets, and adjusted prices.
Currency Translation Assets, including investments, and liabilities denominated in foreign currencies are translated into U.S. dollar values each day at the prevailing exchange rate, using the mean of the bid and asked prices of such currencies against U.S. dollars as quoted by a major bank. Purchases and sales of securities, income, and expenses are translated into U.S. dollars at the prevailing exchange rate on the date of the transaction. The effect of changes in foreign currency exchange rates on realized and unrealized security gains and losses is reflected as a component of security gains and losses.
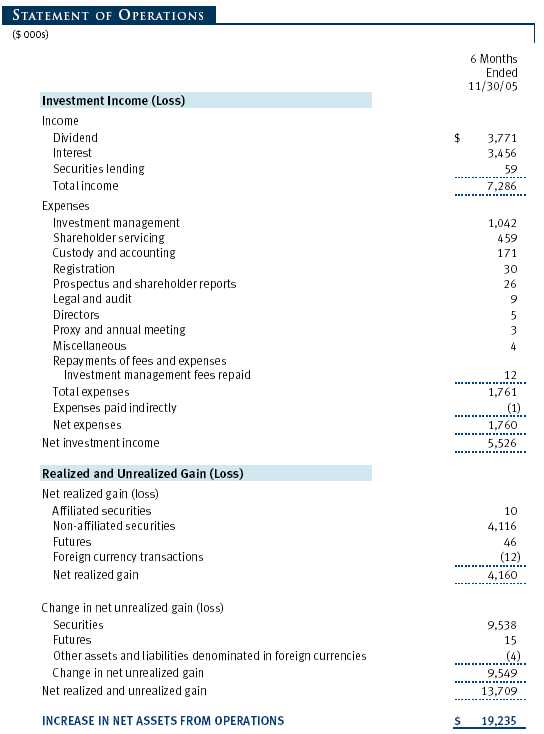
Rebates and Credits Subject to best execution, the fund may direct certain security trades to brokers who have agreed to rebate a portion of the related brokerage commission to the fund in cash. Commission rebates are included in realized gain on securities in the accompanying financial statements and totaled $3,000 for the six months ended November 30, 2005. Additionally, the fund earns credits on temporarily uninvested cash balances at the custodian that reduce the fund’s custody charges. Custody expense in the accompanying financial statements is presented before reduction for credits, which are reflected as expenses paid indirectly.
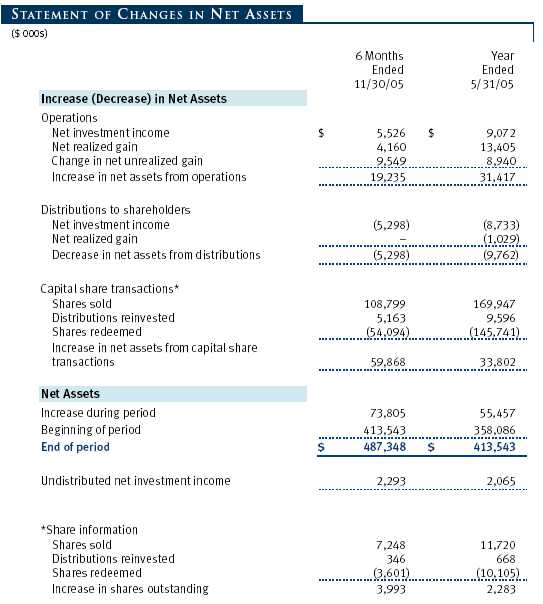
Investment Transactions, Investment Income, and Distributions Income and expenses are recorded on the accrual basis. Premiums and discounts on debt securities are amortized for financial reporting purposes. Inflation adjustments to the principal amount of inflation-indexed bonds are included in interest income. Dividends received from mutual fund investments are reflected as dividend income; capital gain distributions are reflected as realized gain/loss. Dividend income and capital gain distributions are recorded on the ex-dividend date. Investment transactions are accounted for on the trade date. Realized gains and losses are reported on the identified cost basis. Payments (“variation margin”) made or received to settle the daily fluctuations in the value of futures contracts are recorded as unrealized gains or losses until the contracts are closed. Unsettled variation margin on futures contracts is included in other assets or liabilities, and unrealized gains and losses on futures contracts are included in the change in net unrealized gain or loss in the accompanying financial statements. Paydown gains and losses are recorded as an adjustment to interest income. Distributions to shareholders are recorded on the ex-dividend date. Income distributions are declared and paid on a quarterly basis. Capital gain distributions, if any, are declared and paid by the fund, typically on an annual basis.
NOTE 2 - INVESTMENT TRANSACTIONS
Consistent with its investment objective, the fund engages in the following practices to manage exposure to certain risks or enhance performance. The investment objective, policies, program, and risk factors of the fund are described more fully in the fund’s prospectus and Statement of Additional Information.
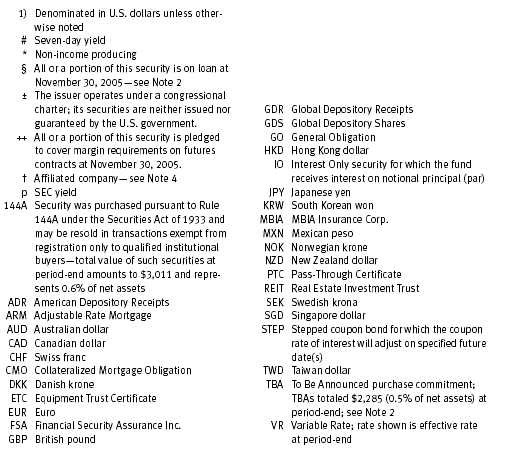
Restricted Securities The fund may invest in securities that are subject to legal or contractual restrictions on resale. Although certain of these securities may be readily sold, for example, under Rule 144A, others may be illiquid, their sale may involve substantial delays and additional costs, and prompt sale at an acceptable price may be difficult.
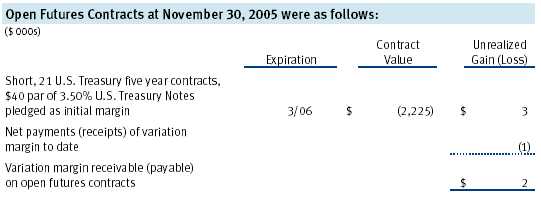
Futures Contracts During the six months ended November 30, 2005, the fund was a party to futures contracts, which provide for the future sale by one party and purchase by another of a specified amount of a specific financial instrument at an agreed upon price, date, time, and place. Risks arise from possible illiquidity of the futures market and from movements in security values and/or interest rates.
TBA Purchase Commitments During the six months ended November 30, 2005, the fund entered into TBA (to be announced) purchase commitments, pursuant to which it agrees to purchase mortgage-backed securities for a fixed unit price, with payment and delivery at a scheduled future date beyond the customary settlement period for that security. With TBA transactions, the particular securities to be delivered are not identified at trade date; however, delivered securities must meet specified terms, including issuer, rate, and mortgage term, and be within industry-accepted “good delivery” standards. The fund generally enters into TBAs with the intention of taking possession of the underlying mortgage securities. Until settlement, the fund maintains cash reserves and liquid assets sufficient to settle its TBAs.
Dollar Rolls During the six months ended November 30, 2005, the fund entered into dollar roll transactions, pursuant to which it sells a mortgage-backed TBA or security and simultaneously purchases a similar, but not identical, TBA with the same issuer, rate, and terms. The fund may execute a “roll” to obtain better underlying mortgage securities or to enhance returns. The fund generally enters into dollar roll transactions with the intention of taking possession of the underlying mortgage securities, but may close a contract prior to settlement or “roll” settlement to a later date if deemed in the best interest of shareholders. Actual mortgages received by the fund may be less favorable than those anticipated. The fund accounts for dollar roll transactions as purchases and sales, which has the effect of increasing its portfolio turnover rate.
Securities Lending The fund lends its securities to approved brokers to earn additional income. It receives as collateral cash and U.S. government securities valued at 102% to 105% of the value of the securities on loan. Cash collateral is invested in money market pooled accounts managed by the fund’s lending agents in accordance with investment guidelines approved by fund management. Collateral is maintained over the life of the loan in an amount not less than the value of loaned securities, as determined at the close of fund business each day; any additional collateral required due to changes in security values is delivered to the fund the next business day. Although risk is mitigated by the collateral, the fund could experience a delay in recovering its securities and a possible loss of income or value if the borrower fails to return the securities. Securities lending revenue recognized by the fund consists of earnings on invested collateral and borrowing fees , net of any rebates to the borrower and compensation to the lending agent. At November 30, 2005, the value of loaned securities was $78,791,000; aggregate collateral consisted of $80,732,000 in money market pooled accounts and U.S. government securities valued at $1,040,000.
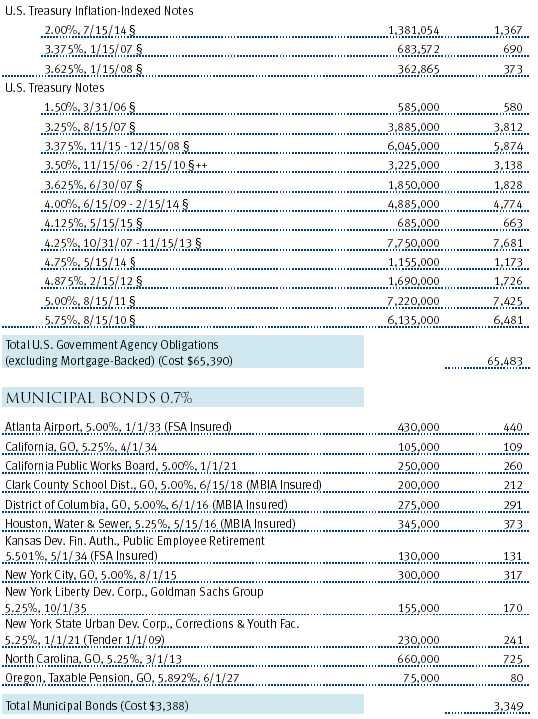
Other Purchases and sales of portfolio securities, other than short-term and U.S. government securities, aggregated $73,589,000 and $43,102,000, respectively, for the six months ended November 30, 2005. Purchases and sales of U.S. government securities aggregated $94,229,000 and $72,314,000, respectively, for the six months ended November 30, 2005.
NOTE 3 - FEDERAL INCOME TAXES
No provision for federal income taxes is required since the fund intends to continue to qualify as a regulated investment company under Subchapter M of the Internal Revenue Code and distribute to shareholders all of its taxable income and gains. Federal income tax regulations differ from generally accepted accounting principles; therefore, distributions determined in accordance with tax regulations may differ in amount or character from net investment income and realized gains for financial reporting purposes. Financial reporting records are adjusted for permanent book/tax differences to reflect tax character. Financial records are not adjusted for temporary differences. The amount and character of tax-basis distributions and composition of net assets are finalized at fiscal year-end; accordingly, tax-basis balances have not been determined as of November 30, 2005.
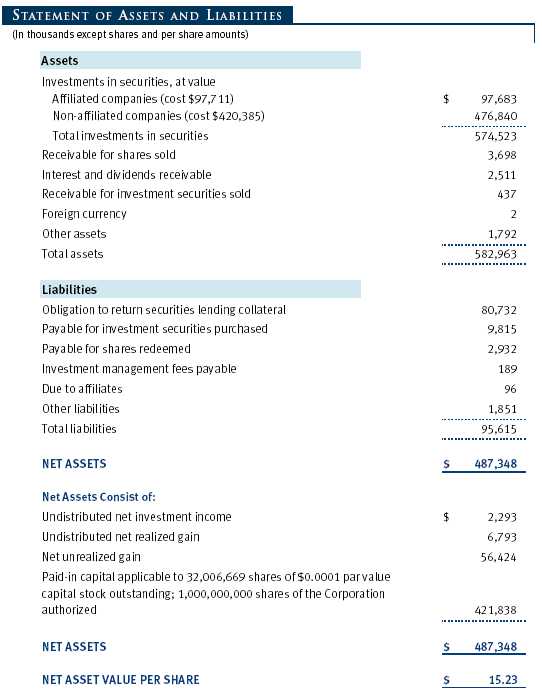
At November 30, 2005, the cost of investments for federal income tax purposes was $518,096,000. Net unrealized gain aggregated $56,424,000 at period-end, of which $61,997,000 related to appreciated investments and $5,573,000 related to depreciated investments.
NOTE 4 - RELATED PARTY TRANSACTIONS
The fund is managed by T. Rowe Price Associates, Inc. (the manager or Price Associates), a wholly owned subsidiary of T. Rowe Price Group, Inc. The investment management agreement between the fund and the manager provides for an annual investment management fee, which is computed daily and paid monthly. The fee consists of an individual fund fee, equal to 0.15% of the fund’s average daily net assets, and a group fee. The group fee rate is calculated based on the combined net assets of certain mutual funds sponsored by Price Associates (the group) applied to a graduated fee schedule, with rates ranging from 0.48% for the first $1 billion of assets to 0.29% for assets in excess of $160 billion. The fund’s group fee is determined by applying the group fee rate to the fund’s average daily net assets. At November 30, 2005, the effective annual group fee rate was 0.31%.
The fund is also subject to a contractual expense limitation through September 30, 2006. During the limitation period, the manager is required to waive its management fee and reimburse the fund for any expenses, excluding interest, taxes, brokerage commissions, and extraordinary expenses, that would otherwise cause the fund’s ratio of total expenses to average net assets (expense ratio) to exceed its expense limitation of 0.80%. The fund is required to repay the manager for expenses previously reimbursed and management fees waived to the extent the fund’s net assets have grown or expenses have declined sufficiently to allow repayment without causing the fund’s expense ratio to exceed its expense limitation. However, no repayment will be made more than three years after the date of any reimbursement or waiver or later than September 30, 2008. Pursuant to this agreement, at November 30, 2005, management fees waived in the amount of $645,000 remain subject to repayment by the fund .
In addition, the fund has entered into service agreements with Price Associates and two wholly owned subsidiaries of Price Associates (collectively, Price). Price Associates computes the daily share price and maintains the financial records of the fund. T. Rowe Price Services, Inc., provides shareholder and administrative services in its capacity as the fund’s transfer and dividend disbursing agent. T. Rowe Price Retirement Plan Services, Inc., provides subaccounting and recordkeeping services for certain retirement accounts invested in the fund. For the six months ended November 30, 2005, expenses incurred pursuant to these service agreements were $62,000 for Price Associates, $97,000 for T. Rowe Price Services, Inc., and $270,000 for T. Rowe Price Retirement Plan Services, Inc. The total amount payable at period end pursuant to these service agreements is reflected as Due to Affiliates in the accompanying financial statements.
The fund may invest in the T. Rowe Price Reserve Investment Fund and the T. Rowe Price Government Reserve Investment Fund (collectively, the T. Rowe Price Reserve Funds), open-end management investment companies managed by Price Associates and affiliates of the fund. The T. Rowe Price Reserve Funds are offered as cash management options to mutual funds, trusts, and other accounts managed by Price Associates and/or its affiliates, and are not available for direct purchase by members of the public. The T. Rowe Price Reserve Funds pay no investment management fees. During the six months ended November 30, 2005, dividend income from the T. Rowe Price Reserve Funds totaled $1,292,000, and the value of shares of the T. Rowe Price Reserve Funds held at November 30, 2005 and May 31, 2005 was $75,587,000 and $67,809,000, respectively.
The fund may invest in the T. Rowe Price Institutional High Yield Fund, Inc. (High Yield Fund) as a means of gaining efficient and cost-effective exposure to the high-yield bond markets. The High Yield Fund is an open-end management investment company managed by Price Associates, and an affiliate of the fund. The High Yield Fund pays an annual all-inclusive management and administrative fee to Price Associates equal to 0.50% of average daily net assets. To ensure that T. Rowe Price Personal Strategy Income Fund does not incur duplicate fees for its assets invested in High Yield Fund, Price Associates has agreed to reduce its management fee to the fund. Accordingly, the management fee waiver reflected on the accompanying Statement of Operations includes $50,000 of management fees permanently waived pursuant to this agreement. During the six months ended November 30, 2005, purchases and sales of High Yield Fund were $3,089,000 and $1,991,000, respectively. Realized gains during the period were $10,000, and investment income during the period was $775,000. At November 30, 2005 and May 31, 2005, the value of shares of High Yield Fund held were $22,096,000 and $20,981,000, respectively.
| INFORMATION ON PROXY VOTING POLICIES, PROCEDURES, AND RECORDS |
A description of the policies and procedures used by T. Rowe Price funds and portfolios to determine how to vote proxies relating to portfolio securities is available in each fund’s Statement of Additional Information, which you may request by calling 1-800-225-5132 or by accessing the SEC’s Web site, www.sec.gov. The description of our proxy voting policies and procedures is also available on our Web site, www.troweprice.com. To access it, click on the words “Company Info” at the top of our homepage for individual investors. Then, in the window that appears, click on the “Proxy Voting Policy” navigation button in the top left corner.
Each fund’s most recent annual proxy voting record is available on our Web site and through the SEC’s Web site. To access it through our Web site, follow the directions above, then click on the words “Proxy Voting Record” at the bottom of the Proxy Voting Policy page.
| HOW TO OBTAIN QUARTERLY PORTFOLIO HOLDINGS |
The fund files a complete schedule of portfolio holdings with the Securities and Exchange Commission for the first and third quarters of each fiscal year on Form N-Q. The fund’s Form N-Q is available electronically on the SEC’s Web site (www.sec.gov); hard copies may be reviewed and copied at the SEC’s Public Reference Room, 450 Fifth St. N.W., Washington, DC 20549. For more information on the Public Reference Room, call 1-800-SEC-0330.
Item 2. Code of Ethics.
A code of ethics, as defined in Item 2 of Form N-CSR, applicable to its principal executive officer, principal financial officer, principal accounting officer or controller, or persons performing similar functions is filed as an exhibit to the registrant’s annual Form N-CSR. No substantive amendments were approved or waivers were granted to this code of ethics during the registrant’s most recent fiscal half-year.
Item 3. Audit Committee Financial Expert.
Disclosure required in registrant’s annual Form N-CSR.
Item 4. Principal Accountant Fees and Services.
Disclosure required in registrant’s annual Form N-CSR.
Item 5. Audit Committee of Listed Registrants.
Not applicable.
Item 6. Schedule of Investments.
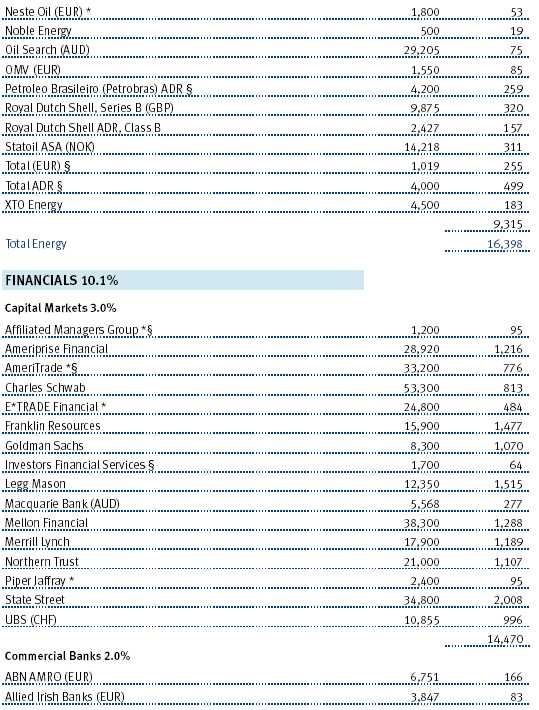
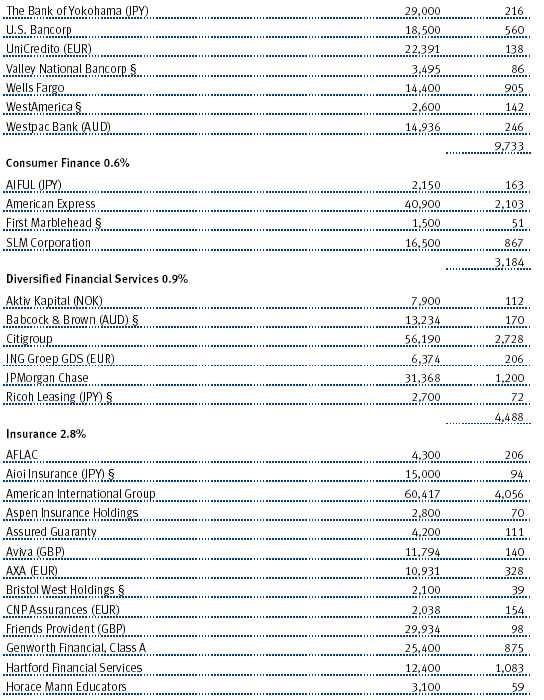
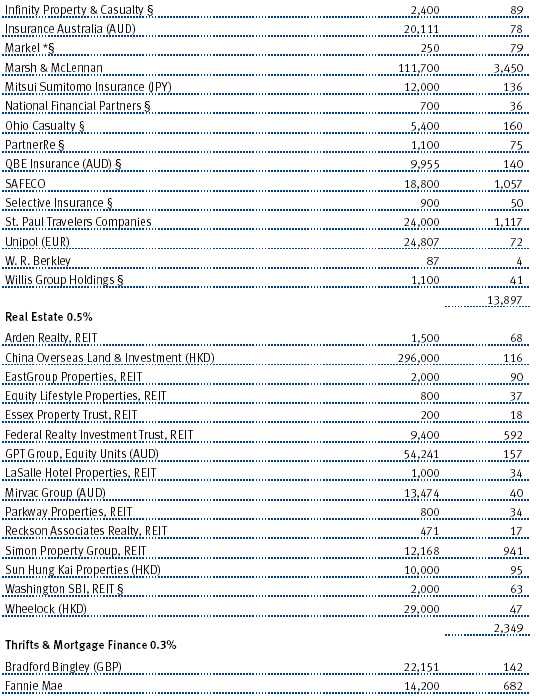
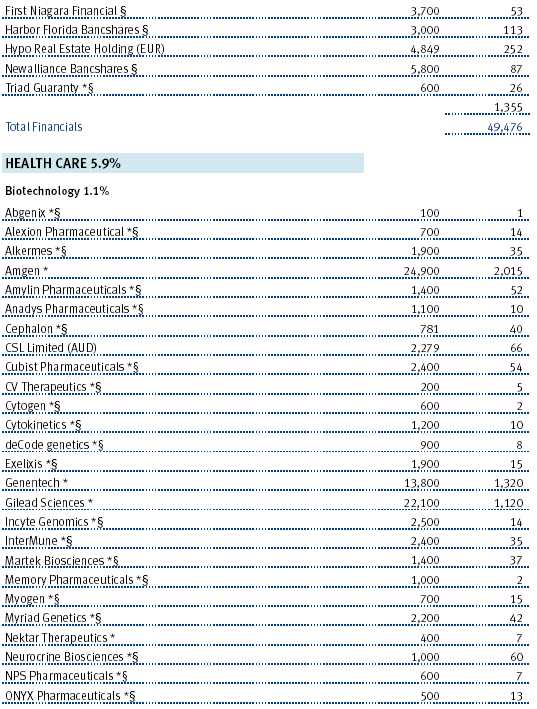
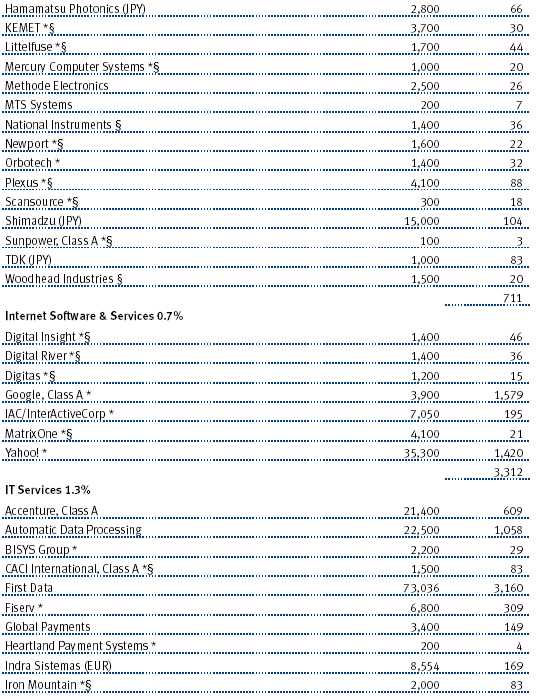
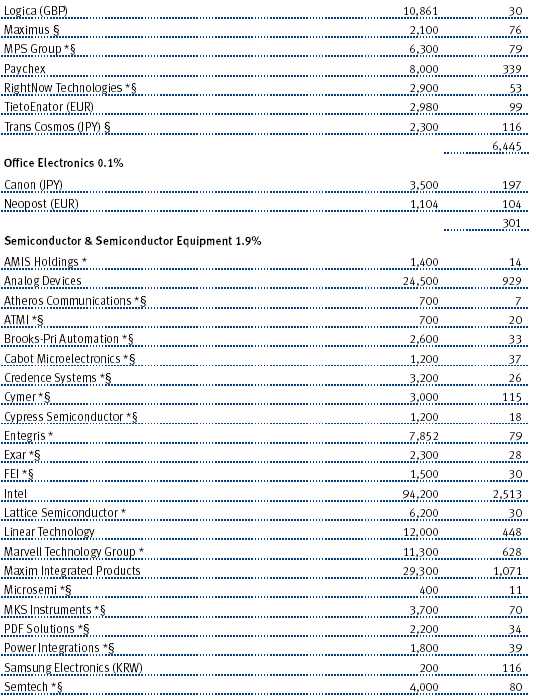
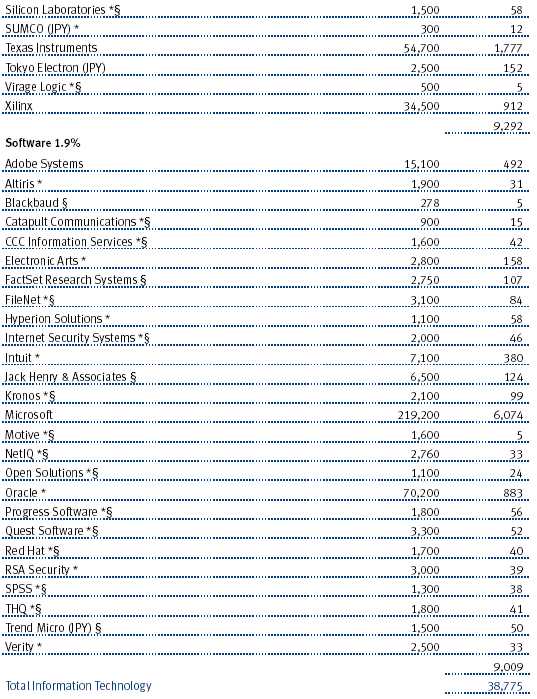
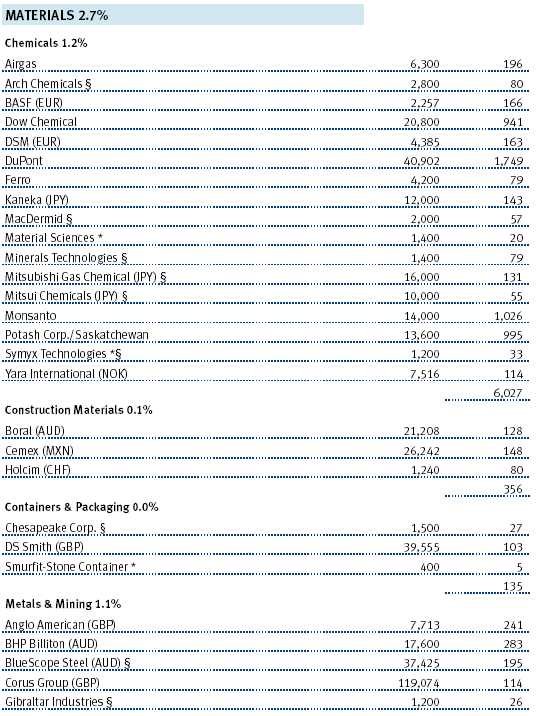
Not applicable. The complete schedule of investments is included in Item 1 of this Form N-CSR.
Item 7. Disclosure of Proxy Voting Policies and Procedures for Closed-End Management Investment Companies.
Not applicable.
Item 8. Portfolio Managers of Closed-End Management Investment Companies.
Not applicable.
Item 9. Purchases of Equity Securities by Closed-End Management Investment Company and Affiliated Purchasers.
Not applicable.
Item 10. Submission of Matters to a Vote of Security Holders.
Not applicable.
Item 11. Controls and Procedures.
(a) The registrant’s principal executive officer and principal financial officer have evaluated the registrant’s disclosure controls and procedures within 90 days of this filing and have concluded that the registrant’s disclosure controls and procedures were effective, as of that date, in ensuring that information required to be disclosed by the registrant in this Form N-CSR was recorded, processed, summarized, and reported timely.
(b) The registrant’s principal executive officer and principal financial officer are aware of no change in the registrant’s internal control over financial reporting that occurred during the registrant’s second fiscal quarter covered by this report that has materially affected, or is reasonably likely to materially affect, the registrant’s internal control over financial reporting.
Item 12. Exhibits.
(a)(1) The registrant’s code of ethics pursuant to Item 2 of Form N-CSR is filed with the registrant’s annual Form N-CSR.
(2) Separate certifications by the registrant's principal executive officer and principal financial officer, pursuant to Section 302 of the Sarbanes-Oxley Act of 2002 and required by Rule 30a-2(a) under the Investment Company Act of 1940, are attached.
(3) Written solicitation to repurchase securities issued by closed-end companies: not applicable.
(b) A certification by the registrant's principal executive officer and principal financial officer, pursuant to Section 906 of the Sarbanes-Oxley Act of 2002 and required by Rule 30a-2(b) under the Investment Company Act of 1940, is attached.
| | |
SIGNATURES |
| |
| | Pursuant to the requirements of the Securities Exchange Act of 1934 and the Investment |
| Company Act of 1940, the registrant has duly caused this report to be signed on its behalf by the |
| undersigned, thereunto duly authorized. |
| |
| T. Rowe Price Personal Strategy Funds, Inc. |
| |
| By | /s/ James S. Riepe |
| | James S. Riepe |
| | Principal Executive Officer |
| |
| Date | January 13, 2006 |
| |
| |
| | Pursuant to the requirements of the Securities Exchange Act of 1934 and the Investment |
| Company Act of 1940, this report has been signed below by the following persons on behalf of |
| the registrant and in the capacities and on the dates indicated. |
| |
| |
| By | /s/ James S. Riepe |
| | James S. Riepe |
| | Principal Executive Officer |
| |
| Date | January 13, 2006 |
| |
| |
| |
| By | /s/ Joseph A. Carrier |
| | Joseph A. Carrier |
| | Principal Financial Officer |
| |
| Date | January 13, 2006 |