| UNITED STATES |
| SECURITIES AND EXCHANGE COMMISSION |
| Washington, D.C. 20549 |
| |
FORM N-CSR |
| |
CERTIFIED SHAREHOLDER REPORT OF REGISTERED |
MANAGEMENT INVESTMENT COMPANIES |
| |
| |
| |
| Investment Company Act File Number: 811-07173 |
|
| |
| T. Rowe Price Personal Strategy Funds, Inc. |
|
| (Exact name of registrant as specified in charter) |
| |
| 100 East Pratt Street, Baltimore, MD 21202 |
|
| (Address of principal executive offices) |
| |
| David Oestreicher |
| 100 East Pratt Street, Baltimore, MD 21202 |
|
| (Name and address of agent for service) |
| |
| |
| Registrant’s telephone number, including area code: (410) 345-2000 |
| |
| |
| Date of fiscal year end: May 31 |
| |
| |
| Date of reporting period: November 30, 2009 |
Item 1: Report to Shareholders| Personal Strategy Growth Fund | November 30, 2009 |
The views and opinions in this report were current as of November 30, 2009. They are not guarantees of performance or investment results and should not be taken as investment advice. Investment decisions reflect a variety of factors, and the managers reserve the right to change their views about individual stocks, sectors, and the markets at any time. As a result, the views expressed should not be relied upon as a forecast of the fund’s future investment intent. The report is certified under the Sarbanes-Oxley Act, which requires mutual funds and other public companies to affirm that, to the best of their knowledge, the information in their financial reports is fairly and accurately stated in all material respects.
REPORTS ON THE WEB
Sign up for our E-mail Program, and you can begin to receive updated fund reports and prospectuses online rather than through the mail. Log in to your account at troweprice.com for more information.
Manager’s Letter
Fellow Shareholders
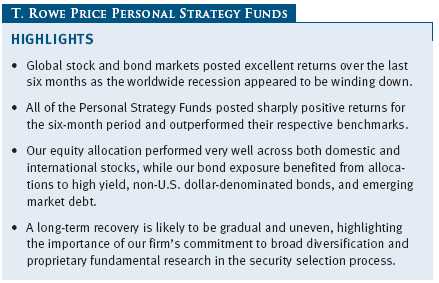
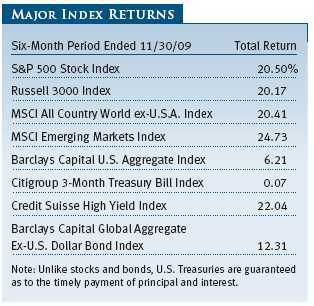
The global economic downturn appeared to be winding down during the six-month period ended November 30, 2009, causing investors to turn their attention to the long, slow process of recovery. U.S. stocks continued to rally from their March lows but were outperformed by non-U.S. equities, where emerging markets led the way. Bond markets were generally positive, with particular strength among credit-sensitive sectors such as high yield, investment-grade corporates, and emerging market debt.
All of the Personal Strategy Funds outperformed their respective benchmarks by a substantial margin. Relying on our disciplined, fundamental approach to identify attractive long-term investment opportunities for our shareholders, we are encouraged by recent signs of economic strength and continue to position the funds for a gradual return to sustainable growth.
MARKET ENVIRONMENT
The longest and deepest U.S. recession since the Great Depression appears to be coming to an end. After shrinking at an annualized rate of more than 5% in the fourth quarter of 2008 and the first quarter of 2009, the economy contracted by only 0.7% in the second quarter of 2009 and grew by over 2% in the third. Job losses have slowed in recent months, although unemployment remains high and consumer spending restrained.
Stocks
U.S. stocks produced strong gains in the six months ended November 30, 2009, extending a remarkable rally that began in early March. Most major U.S. stock indexes surged roughly 60% to 70% from their March lows, although they remain 25% to 30% below their 2007 highs. Large-cap shares generally outperformed their smaller peers. Growth stocks narrowly outpaced value among large-cap shares but trailed in the small- and mid-cap universe.
As measured by the S&P 500, all sectors in the large-cap universe generated positive returns in the last six months. Information technology shares were among the top performers due to attractive valuations, aggressive cost cutting, and unexpectedly resilient revenues. Consumer discretionary and industrials and business services stocks also did well, as investors anticipated them to benefit from an eventual economic recovery, while materials stocks climbed with commodity prices. Utilities and telecommunication services, which are often perceived as safe havens in an economic downturn, lagged with modest gains.
Non-U.S. developed market stocks performed in line with U.S. shares in the last six months. European shares fared well, but Japanese stocks trailed significantly. Emerging markets outperformed developed markets, led by Latin America. A weak dollar tended to enhance returns for U.S. investors.
Bonds
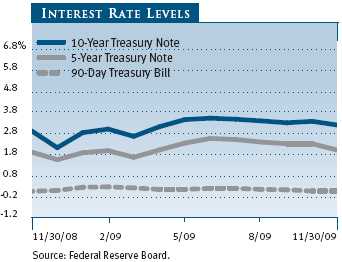
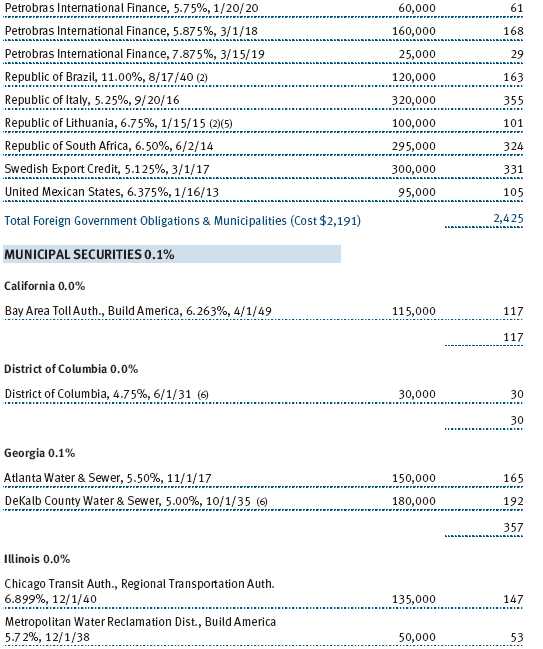
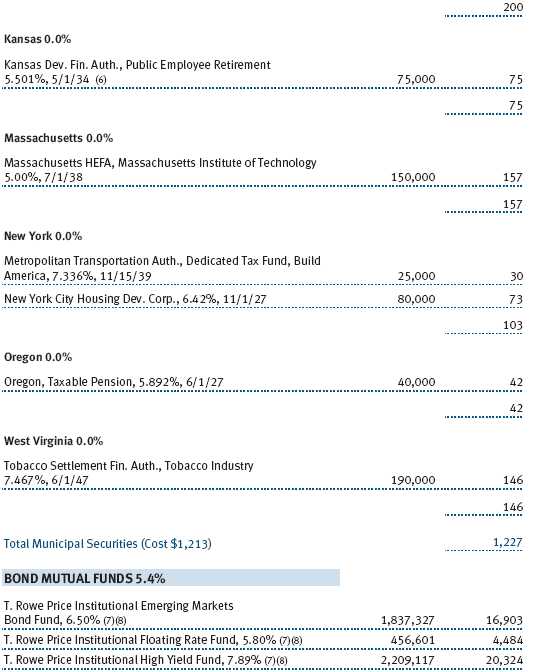
Domestic bond returns were broadly positive, as credit market conditions continued to improve and Federal Reserve officials stated that they intend to keep short-term interest rates very low “for an extended period.” High yield bonds fared best and produced strong gains, but investment-grade corporate bonds also performed very well. Asset-backed securities, which are backed by credit card, auto loan, or other debt payments, generate less robust gains. Intermediate- and long-term U.S. Treasury yields declined somewhat despite signs of economic improvement and heavy new issuance by the Treasury Department. Municipal bonds and agency mortgage-backed securities lagged with relatively mild gains, while money market yields hovered near 0%.
Non-U.S. bond returns were solidly positive. Emerging market debt did well as global economic stabilization boosted capital flows and enhanced liquidity. Corporate debt outpaced government debt, and the new issue market for both segments showed renewed vigor. High-quality bonds issued in developed countries trailed slightly, but returns were enhanced by the dollar’s weakness versus other currencies.
STRATEGY AND PERFORMANCE REVIEW
All of the Personal Strategy Funds posted sharply positive returns for the six-month period and outperformed their respective benchmarks. (See each fund’s commentary for more specific performance information.) Our outperformance relative to the benchmarks was due to strong security selection in the underlying portfolios and allocations to high yield bonds, non-U.S. dollar-denominated bonds, and emerging market bonds—all strong-performing sectors that are absent from the benchmark. An overweight to equities and an underweight to cash also helped relative returns, while an underweight to high yield versus investment grade detracted as high yield bonds outperformed.
Stocks
Our equity allocations have performed very well over the last six months, providing strong absolute performance across both domestic and international stocks, as well as all capitalizations and styles. Our U.S. equities modestly outperformed the Russell 3000 Index over the period. Large-cap value and small-cap stocks were positive contributors, while large-cap growth shares weighed on relative returns. International equities significantly outperformed, with both developed and emerging markets providing strong relative outperformance versus their respective benchmarks.
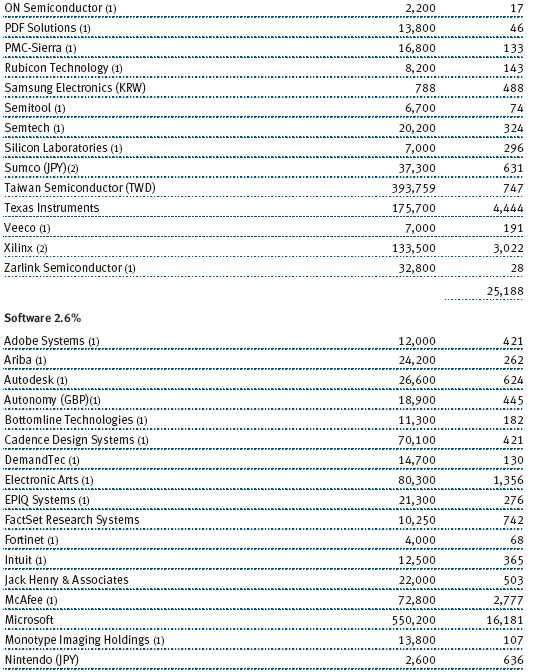
Among the funds’ larger equity positions, Microsoft was a top contributor as the company rebounded from a difficult period. Microsoft remains dominant in desktop software and is entering a major product cycle with Windows 7 (and Office 2010) that we expect to drive better-than-expected earnings growth from current depressed levels. Apple benefited from the rapid adoption of smartphones—handheld devices that combine phone, e-mail, Web browsing, and other computing capabilities.
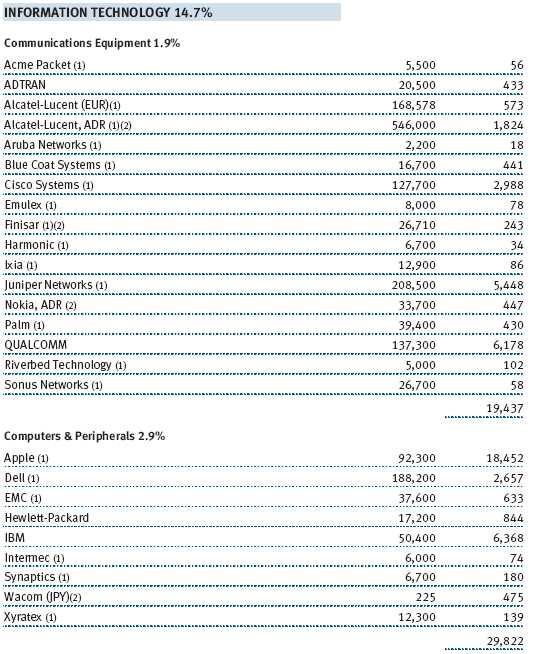
Apple’s iPhone has become a consumer phenomenon and a major driver of revenue and earnings. The company continues to innovate and deliver solid results with its Mac computers and iPod line of media devices. Amazon.com posted strong third-quarter results. Its recent price war with Wal-Mart may cause some short-term challenges, but the online retailer continues to take share from both online and offline retail at an increasing rate. Global investment bank Goldman Sachs contributed good gains. Benefiting from a unique franchise that has even greater differentiation now that its weaker peers have fallen away, we believe that Goldman is poised for solid long-term gains. (Please refer to each fund’s portfolio of investments for a complete listing of holdings and the amount each represents in the portfolio.)
Bonds
The fixed income portion of the portfolios also provided strong absolute and relative returns. Allocations to high yield bonds, non-U.S. dollar-denominated bonds, and emerging market bonds significantly aided relative and absolute performance. The fixed income portion of the portfolios is benchmarked versus the Barclays Capital U.S. Aggregate Index, which does not have any exposure to these sectors. All three areas outperformed the index by a wide margin, although an underweight to high yield bonds relative to investment grade hampered returns. Positive security selection within our investment-grade and emerging market bond portfolios was also among the top contributors to our relative outperformance.
High yield bonds continued to perform very well over the period. Low interest rates and abundant liquidity bolstered the high yield market, freeing companies to issue new debt or refinance existing debt under more attractive terms, lowering near-term default expectations. Although this sector can be volatile, we believe that its long-term performance potential makes it an appropriate addition to a broadly diversified investment portfolio. In addition, we strive to manage risk by emphasizing higher-quality debt, which can weigh on returns when the markets are favoring riskier assets. Non-U.S. developed market government debt also posted solid gains, led by non-core markets such as Greece and Italy. Non-U.S. corporate bonds benefited from increased risk appetite, improved liquidity, and early signs of global economic recovery. European investment-grade corporate bonds were among our top performers as risk appetite returned to the markets. Emerging markets entered the global recession in a better position than many developed markets because their financial systems were less exposed to the complexities that initiated the downfall. They have weathered the storm relatively well and emerged earlier than developed markets.
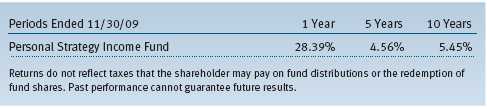
Personal Strategy Income Fund
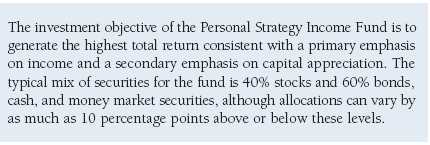
The Personal Strategy Income Fund returned 14.26% for the six-month period ended November 30, 2009. Our strong results relative to the combined index portfolio were due to positive security selection in the underlying portfolios, as well as out-of-benchmark allocations to high yield bonds, non-U.S. dollar-denominated bonds, and emerging market bonds. An overweight to equities and underweight to cash also contributed to relative returns, while an underweight to high yield versus investment grade detracted as high yield bonds outperformed for the period. The fund also outperformed the Lipper Mixed-Asset Target Allocation Conservative Funds Index, a peer group benchmark that measures the performance of similar funds with a mix of between 20% and 40% equities, with the remainder invested in bonds and short-term investments.
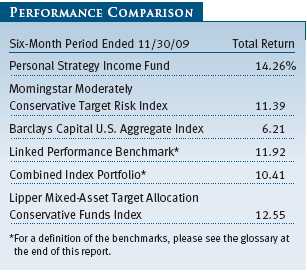
Please note some important changes to the fund’s performance benchmarks. The Morningstar Moderately Conservative Target Risk Index is replacing the Barclays Capital U.S. Aggregate Index as the fund’s broad market benchmark, although we are including the Barclays index return in this report for continuity. The Morningstar index contains a mix of stocks, bonds, and short-term investments that we feel better reflects the fund’s multi-class investment allocation and provides a more appropriate market performance comparison than the Barclays index.
We continue to overweight the fund’s equity exposure relative to fixed income but have reduced our exposure modestly because the recent rally has made stock valuations less attractive. At the end of the reporting period, the fund’s overall target equity allocation was 43% versus a neutral allocation of 40%. We remain slightly underweight to small-cap versus large-cap stocks as small-caps currently trade at a premium valuation relative to large-caps. We are currently neutral in growth versus value stocks. The value segment could benefit as earnings rebound from depressed levels, although growth stocks with consistently good earnings have fared better during the recent downturn. We are modestly overweight in non-U.S. equities based on attractive valuations. We believe that the positive long-term growth prospects of emerging markets, in particular, should offset any short-term volatility that we may experience.
Within fixed income, we increased our exposure to high yield relative to investment-grade bonds based on expectations for a gradually improving economy and lower default rates. We continue to favor our recently established position in emerging market bonds as yields are still wide relative to recent history. The International Monetary Fund has provided valuable support to many developing economies, greatly reducing the default risk for government issues. That said, fundamental credit research remains a critical element of the security selection process in this uncertain environment. At the end of the reporting period, the fund’s target allocation to bonds and cash stood at 57% versus a 60% neutral allocation.
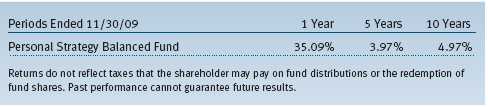
Personal Strategy Balanced Fund
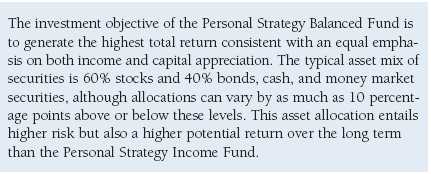
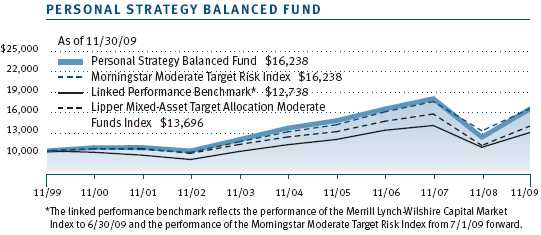
For the six-month period ended November 30, 2009, the Personal Strategy Balanced Fund posted a 17.43% return. Our strong results relative to the combined index portfolio were due to positive security selection in the underlying portfolios, as well as out-of-benchmark allocations to high yield bonds, non-U.S. dollar-denominated bonds, and emerging market bonds. An overweight to equities and an underweight to cash also contributed to relative returns, while an underweight to high yield versus investment grade detracted as high yield bonds outperformed for the period. The fund also outperformed the Lipper Mixed-Asset Target Allocation Moderate Funds Index, a peer group benchmark that measures the performance of similar funds with a mix of between 40% and 60% equities, with the remainder invested in bonds and short-term investments.
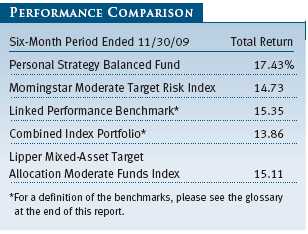
Please note some important changes to the fund’s performance benchmarks. Due to the discontinuation of the Merrill Lynch-Wilshire Capital Market Index on June 30, 2009, we have replaced it with the Morningstar Moderate Target Risk Index. We have also created a linked performance benchmark that combines data from the Merrill Lynch index before its discontinuation and the Morningstar index from that point forward.
We continue to overweight the fund’s equity exposure relative to fixed income but have reduced our exposure modestly because the recent rally has made stock valuations less attractive. At the end of the reporting period, the fund’s overall target equity allocation was 63% versus a neutral allocation of 60%. We remain slightly underweight to small-cap versus large-cap stocks as small-caps currently trade at a premium valuation relative to large-caps. We are currently neutral in growth versus value stocks. The value segment could benefit as earnings rebound from depressed levels, although growth stocks with consistently good earnings have fared better during the recent downturn. We are modestly overweight in non-U.S. equities based on attractive valuations. We believe that the positive long-term growth prospects of emerging markets, in particular, should offset any short-term volatility that we may experience.
Within fixed income, we increased our exposure to high yield relative to investment-grade bonds based on expectations for a gradually improving economy and lower default rates. We continue to favor our recently established position in emerging market bonds as yields are still wide relative to recent history. The International Monetary Fund has provided valuable support to many developing economies, greatly reducing the default risk for government issues. That said, fundamental credit research remains a critical element of the security selection process in this uncertain environment. At the end of the reporting period, the fund’s target allocation to bonds and cash stood at 37% versus a 40% neutral allocation.
Personal Strategy Growth Fund
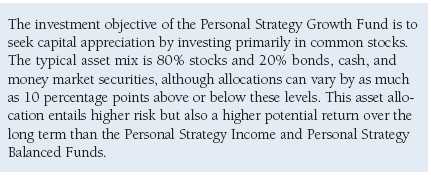
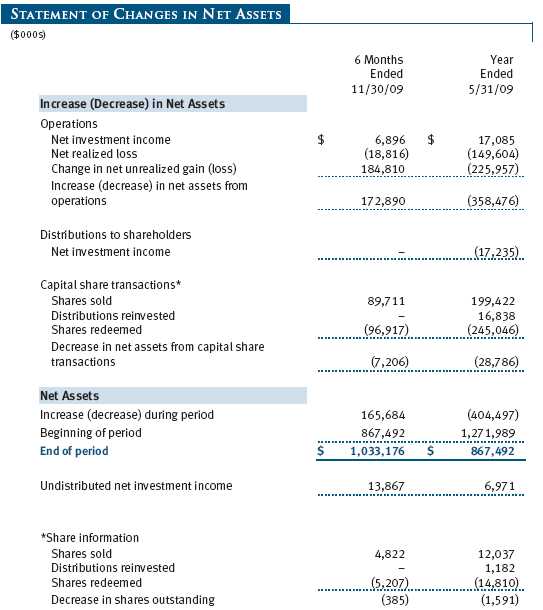
For the six-month period ended November 30, 2009, the Personal Strategy Growth Fund posted a 20.04% return. Our strong results relative to the combined index portfolio were due to positive security selection in the underlying portfolios, as well as out-of-benchmark allocations to high yield bonds, non-U.S. dollar-denominated bonds, and emerging market bonds. An overweight to equities and an underweight to cash also contributed to relative returns, while an underweight to high yield versus investment grade detracted as high yield bonds outperformed for the period. The fund also outperformed the Lipper Mixed-Asset Target Allocation Growth Funds Index, a peer group benchmark that measures the performance of similar funds with a mix of between 60% and 80% equities, with the remainder invested in bonds and short-term investments.
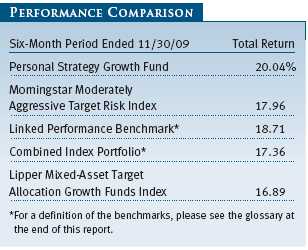
Please note some important changes to the fund’s performance benchmarks. Due to the discontinuation of the Merrill Lynch-Wilshire Capital Market Index on June 30, 2009, we have replaced it with the Morningstar Moderately Aggressive Target Risk Index. We have also created a linked performance benchmark that combines data from the Merrill Lynch index before its discontinuation and the Morningstar index from that point forward.
We continue to overweight the fund’s equity exposure relative to fixed income but have reduced our exposure modestly because the recent rally has made stock valuations less attractive. At the end of the reporting period, the fund’s overall target equity allocation was 83% versus a neutral allocation of 80%. We remain slightly underweight to small-cap versus large-cap stocks as small-caps currently trade at a premium valuation relative to large-caps. We are currently neutral in growth versus value stocks. The value segment could benefit as earnings rebound from depressed levels, although growth stocks with consistently good earnings have fared better during the recent downturn. We are modestly overweight in non-U.S. equities based on attractive valuations. We believe that the positive long-term growth prospects of emerging markets, in particular, should offset any short-term volatility that we may experience.
Within fixed income, we increased our exposure to high yield relative to investment-grade bonds based on expectations for a gradually improving economy and lower default rates. We continue to favor our recently established position in emerging market bonds as yields are still wide relative to recent history. The International Monetary Fund has provided valuable support to many developing economies, greatly reducing the default risk for government issues. That said, fundamental credit research remains a critical element of the security selection process in this uncertain environment. At the end of the reporting period, the fund’s target allocation to bonds and cash stood at 17% versus a 20% neutral allocation.
OUTLOOK
Although companies are beginning to benefit from extensive cost cutting, they cannot cut their way to prosperity, and a resumption of revenue growth will be necessary to further boost U.S. stock markets. European shares have rallied since 2008, but prospects remain subdued over the next three to five years. Japanese markets continue to be anemic, although scattered opportunities exist.
Among U.S. bonds, the market for Treasuries, agencies, and mortgage-backed securities will be challenged to absorb the increased supply resulting from new issuance, reduced government purchases, and eventual Federal Reserve efforts to unwind its balance sheet. Policymakers will have to chart a careful course when the time comes to withdraw liquidity from the system.
Long-term fundamentals in emerging markets are positive as the global economy grows, domestic wealth increases, and capital markets mature, although the timing and scope of recovery will vary from country to country.
While we are pleased with the performance of the Personal Strategy Funds over the past six months, we realize that the road ahead remains challenging. We believe that the U.S. and global economies have started on a path to recovery, although it is likely to be gradual and uneven, with more swings in store for economies and markets. In this uncertain environment, security selection is likely to play a leading role.
Our active management approach takes advantage of T. Rowe Price’s disciplined investment process, global research platform, and seasoned professional judgment. Our stock and bond investment professionals work together to evaluate and identify the best investment opportunities, building a broadly diversified portfolio. Although there is no guarantee that an actively managed portfolio will outperform, we believe that our approach will add value for shareholders over the long term.
Respectfully submitted,

Edmund M. Notzon III
Chairman of the funds’ Investment Advisory Committee
December 18, 2009
The committee chairman has day-to-day responsibility for managing the portfolios and works with committee members in developing and executing the funds’ investment programs.
RISKS OF INVESTING
As with all stock and bond mutual funds, each fund’s share price can fall because of weakness in the stock or bond markets, a particular industry, or specific holdings. Stock markets can decline for many reasons, including adverse political or economic developments, changes in investor psychology, or heavy institutional selling. The prospects for an industry or company may deteriorate because of a variety of factors, including disappointing earnings or changes in the competitive environment. In addition, the investment manager’s assessment of companies held in a fund may prove incorrect, resulting in losses or poor performance even in rising markets.
Bonds are subject to interest rate risk, the decline in bond prices that usually accompanies a rise in interest rates, and credit risk, the chance that any fund holding could have its credit rating downgraded or that a bond issuer will default (fail to make timely payments of interest or principal), potentially reducing the fund’s income level and share price. High yield corporate bonds could have greater price declines than funds that invest primarily in high-quality bonds. Companies issuing high yield bonds are not as strong financially as those with higher credit ratings, so the bonds are usually considered speculative investments.
Funds that invest overseas may carry more risk than funds that invest strictly in U.S. assets. Risks can result from varying stages of economic and political development; differing regulatory environments, trading days, and accounting standards; and higher transaction costs of non-U.S. markets. Non-U.S. investments are also subject to currency risk, or a decline in the value of a foreign currency versus the U.S. dollar, which reduces the dollar value of securities denominated in that currency.
GLOSSARY
Barclays Capital Global Aggregate Ex-U.S. Dollar Bond Index: An unmanaged index that tracks an international basket of bonds that contains 65% government, 14% corporate, 13% agency, and 8% mortgage-related bonds.
Barclays Capital U.S. Aggregate Index: An unmanaged index that tracks investment-grade corporate and government bonds.
Citigroup 3-Month Treasury Bill Index: An unmanaged index that tracks short-term U.S. government debt instruments.
Combined index portfolios: Unmanaged portfolios composed of the following underlying indexes:
• Personal Strategy Income—40% stocks (32% Russell 3000 Index, 8% MSCI All Country World ex-U.S.A. Index), 40% bonds (Barclays Capital U.S. Aggregate Index), and 20% money market securities (Citigroup 3-Month Treasury Bill Index).
• Personal Strategy Balanced—60% stocks (48% Russell 3000 Index, 12% MSCI All Country World ex-U.S.A. Index), 30% bonds (Barclays Capital U.S. Aggregate Index), and 10% money market securities (Citigroup 3-Month Treasury Bill Index).
• Personal Strategy Growth—80% stocks (64% Russell 3000 Index, 16% MSCI All Country World ex-U.S.A. Index) and 20% bonds (Barclays Capital U.S. Aggregate Index).
Credit Suisse High Yield Index: Tracks the performance of domestic noninvestment-grade corporate bonds.
Duration: A measure of a bond or bond fund’s sensitivity to changes in interest rates. For example, a fund with a four-year duration would fall about 4% in response to a one-percentage-point rise in interest rates, and vice versa.
Linked performance benchmark – Personal Strategy Balanced Fund: A benchmark that reflects the performance of the Merrill Lynch-Wilshire Capital Market Index through June 30, 2009, and the performance of the Morningstar Moderate Target Risk Index from July 1, 2009, through the end of the reporting period.
Linked performance benchmark – Personal Strategy Growth Fund: A benchmark that reflects the performance of the Merrill Lynch-Wilshire Capital Market Index through June 30, 2009, and the performance of the Morningstar Moderately Aggressive Target Risk Index from July 1, 2009, through the end of the reporting period.
Linked performance benchmark – Personal Strategy Income Fund: A benchmark that reflects the performance of the Barclays Capital U.S. Aggregate Index through June 30, 2009, and the performance of the Morningstar Moderately Conservative Target Risk Index from July 1, 2009, through the end of the reporting period.
Lipper indexes: Fund benchmarks that consist of a small number (10 to 30) of the largest mutual funds in a particular category as tracked by Lipper Inc.
Merrill Lynch-Wilshire Capital Market Index: A market capitalization-weighted index including the Wilshire 5000 and Merrill Lynch High Yield II and Domestic Master indexes. The index was discontinued on June 30, 2009.
Morningstar Moderately Conservative Target Risk Index: Represents a portfolio of global equities (fixed at 40%), bonds, and other asset classes.
Morningstar Moderate Target Risk Index: Represents a portfolio of global equities (fixed at 60%), bonds, and other asset classes.
Morningstar Moderately Aggressive Target Risk Index: Represents a portfolio of global equities (fixed at 80%), bonds, and other asset classes.
MSCI All Country World ex-U.S.A. Index: An index that measures equity market performance of developed and emerging countries, excluding the U.S.
MSCI Emerging Markets Index: A capitalization-weighted index of stocks from 26 emerging market countries that only includes securities that may be traded by foreign investors.
Russell 3000 Index: An index that tracks the performance of the 3,000 largest U.S. companies, representing approximately 98% of the investable U.S. equity market.
S&P 500 Index: An index that tracks the stocks of 500 primarily large-cap U.S. companies.
Yield curve: A graphic depiction of the relationship between yields and maturity dates for a set of similar securities, such as Treasuries or municipal securities. Yield curves typically slope upward, indicating that longer maturities offer higher yields. When the yield curve is flat, there is little or no difference between the yields offered by shorter- and longer-term securities.

Performance and Expenses
This chart shows the value of a hypothetical $10,000 investment in the fund over the past 10 fiscal year periods or since inception (for funds lacking 10-year records). The result is compared with benchmarks, which may include a broad-based market index and a peer group average or index. Market indexes do not include expenses, which are deducted from fund returns as well as mutual fund averages and indexes.

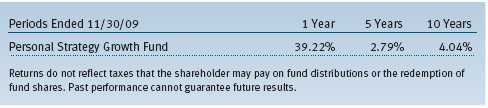
| AVERAGE ANNUAL COMPOUND TOTAL RETURN |
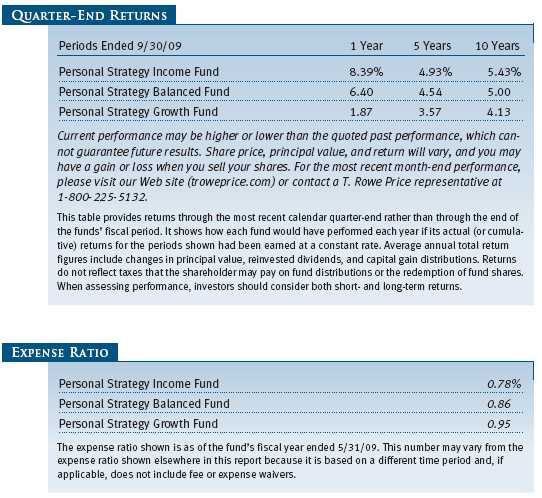
This table shows how the fund would have performed each year if its actual (or cumulative) returns for the periods shown had been earned at a constant rate.
This chart shows the value of a hypothetical $10,000 investment in the fund over the past 10 fiscal year periods or since inception (for funds lacking 10-year records). The result is compared with benchmarks, which may include a broad-based market index and a peer group average or index. Market indexes do not include expenses, which are deducted from fund returns as well as mutual fund averages and indexes.
| AVERAGE ANNUAL COMPOUND TOTAL RETURN |
This table shows how the fund would have performed each year if its actual (or cumulative) returns for the periods shown had been earned at a constant rate.
This chart shows the value of a hypothetical $10,000 investment in the fund over the past 10 fiscal year periods or since inception (for funds lacking 10-year records). The result is compared with benchmarks, which may include a broad-based market index and a peer group average or index. Market indexes do not include expenses, which are deducted from fund returns as well as mutual fund averages and indexes.

| AVERAGE ANNUAL COMPOUND TOTAL RETURN |
This table shows how the fund would have performed each year if its actual (or cumulative) returns for the periods shown had been earned at a constant rate.
As a mutual fund shareholder, you may incur two types of costs: (1) transaction costs, such as redemption fees or sales loads, and (2) ongoing costs, including management fees, distribution and service (12b-1) fees, and other fund expenses. The following example is intended to help you understand your ongoing costs (in dollars) of investing in the fund and to compare these costs with the ongoing costs of investing in other mutual funds. The example is based on an investment of $1,000 invested at the beginning of the most recent six-month period and held for the entire period.
Actual Expenses
The first line of the following table (“Actual”) provides information about actual account values and expenses based on the fund’s actual returns. You may use the information in this line, together with your account balance, to estimate the expenses that you paid over the period. Simply divide your account value by $1,000 (for example, an $8,600 account value divided by $1,000 = 8.6), then multiply the result by the number in the first line under the heading “Expenses Paid During Period” to estimate the expenses you paid on your account during this period.
Hypothetical Example for Comparison Purposes
The information on the second line of the table (“Hypothetical”) is based on hypothetical account values and expenses derived from the fund’s actual expense ratio and an assumed 5% per year rate of return before expenses (not the fund’s actual return). You may compare the ongoing costs of investing in the fund with other funds by contrasting this 5% hypothetical example and the 5% hypothetical examples that appear in the shareholder reports of the other funds. The hypothetical account values and expenses may not be used to estimate the actual ending account balance or expenses you paid for the period.
Note: T. Rowe Price charges an annual small-account maintenance fee of $10, generally for accounts with less than $2,000 ($500 for UGMA/UTMA). The fee is waived for any investor whose T. Rowe Price mutual fund accounts total $25,000 or more, accounts employing automatic investing, and IRAs and other retirement plan accounts that utilize a prototype plan sponsored by T. Rowe Price (although a separate custodial or administrative fee may apply to such accounts). This fee is not included in the accompanying table. If you are subject to the fee, keep it in mind when you are estimating the ongoing expenses of investing in the fund and when comparing the expenses of this fund with other funds.
You should also be aware that the expenses shown in the table highlight only your ongoing costs and do not reflect any transaction costs, such as redemption fees or sales loads. Therefore, the second line of the table is useful in comparing ongoing costs only and will not help you determine the relative total costs of owning different funds. To the extent a fund charges transaction costs, however, the total cost of owning that fund is higher.

Unaudited
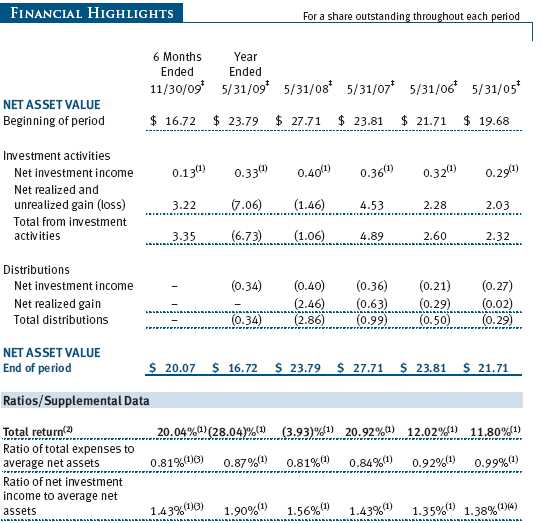
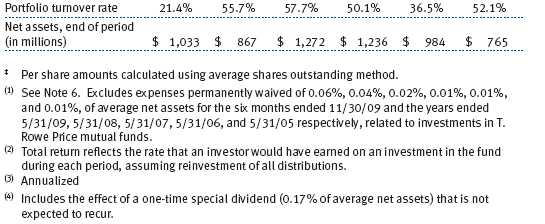
The accompanying notes are an integral part of these financial statements.
Unaudited


The accompanying notes are an integral part of these financial statements.
Unaudited
The accompanying notes are an integral part of these financial statements.
Unaudited

The accompanying notes are an integral part of these financial statements.
Unaudited
The accompanying notes are an integral part of these financial statements.
Unaudited
| NOTES TO FINANCIAL STATEMENTS |
T. Rowe Price Personal Strategy Funds, Inc. (the corporation), is registered under the Investment Company Act of 1940 (the 1940 Act). The Personal Strategy Growth Fund (the fund), a diversified, open-end management investment company, is one portfolio established by the corporation. The fund commenced operations on July 29, 1994. The fund seeks the highest total return over time consistent with a primary emphasis on capital growth and a secondary emphasis on income. The fund pursues this objective by investing in a diversified portfolio typically consisting of about 80% stocks and 20% bonds and money market securities.
NOTE 1 - SIGNIFICANT ACCOUNTING POLICIES
Basis of Preparation The accompanying financial statements were prepared in accordance with accounting principles generally accepted in the United States of America (GAAP), which require the use of estimates made by fund management. Fund management believes that estimates and security valuations are appropriate; however, actual results may differ from those estimates, and the security valuations reflected in the accompanying financial statements may differ from the value the fund ultimately realizes on the securities. Further, fund management believes that no events have occurred between November 30, 2009, the date of this report, and January 22, 2010, the date of issuance of the financial statements, that require adjustment of, or disclosure in, the accompanying financial statements.
Investment Transactions, Investment Income, and Distributions Income and expenses are recorded on the accrual basis. Premiums and discounts on debt securities are amortized for financial reporting purposes. Inflation adjustments to the principal amount of inflation-indexed bonds are reflected as interest income. Dividends received from mutual fund investments are reflected as dividend income; capital gain distributions are reflected as realized gain/loss. Earnings on investments recognized as partnerships for federal income tax purposes reflect the tax character of such earnings. Dividend income and capital gain distributions are recorded on the ex-dividend date. Income tax-related interest and penalties, if incurred, would be recorded as income tax expense. Investment transactions are accounted for on the trade date. Realized gains and losses are reported on the identified cost basis. Paydown gains and losses are recorded as an adjustment to interest income. Distributions to shareholders are recorded on the ex-dividend date. Income distributions are declared and paid annually. Capital gain distributions, if any, are generally declared and paid by the fund, annually.
Currency Translation Assets, including investments, and liabilities denominated in foreign currencies are translated into U.S. dollar values each day at the prevailing exchange rate, using the mean of the bid and asked prices of such currencies against U.S. dollars as quoted by a major bank. Purchases and sales of securities, income, and expenses are translated into U.S. dollars at the prevailing exchange rate on the date of the transaction. The effect of changes in foreign currency exchange rates on realized and unrealized security gains and losses is reflected as a component of security gains and losses.
Rebates and Credits Subject to best execution, the fund may direct certain security trades to brokers who have agreed to rebate a portion of the related brokerage commission to the fund in cash. Commission rebates are reflected as realized gain on securities in the accompanying financial statements and totaled $7,000 for the six months ended November 30, 2009. Additionally, the fund earns credits on temporarily uninvested cash balances held at the custodian, which reduce the fund’s custody charges. Custody expense in the accompanying financial statements is presented before reduction for credits.
NOTE 2 - VALUATION
The fund’s investments are reported at fair value as defined under GAAP. The fund determines the values of its assets and liabilities and computes its net asset value per share at the close of the New York Stock Exchange (NYSE), normally 4 p.m. ET, each day that the NYSE is open for business.
Valuation Methods Equity securities listed or regularly traded on a securities exchange or in the over-the-counter (OTC) market are valued at the last quoted sale price or, for certain markets, the official closing price at the time the valuations are made, except for OTC Bulletin Board securities, which are valued at the mean of the latest bid and asked prices. A security that is listed or traded on more than one exchange is valued at the quotation on the exchange determined to be the primary market for such security. Listed securities not traded on a particular day are valued at the mean of the latest bid and asked prices for domestic securities and the last quoted sale price for international securities.
Debt securities are generally traded in the OTC market. Securities with remaining maturities of one year or more at the time of acquisition are valued at prices furnished by dealers who make markets in such securities or by an independent pricing service, which considers the yield or price of bonds of comparable quality, coupon, maturity, and type, as well as prices quoted by dealers who make markets in such securities. Securities with remaining maturities of less than one year at the time of acquisition generally use amortized cost in local currency to approximate fair value. However, if amortized cost is deemed not to reflect fair value or the fund holds a significant amount of such securities with remaining maturities of more than 60 days, the securities are valued at prices furnished by dealers who make markets in such securities or by an independent pricing service.
Investments in mutual funds are valued at the mutual fund’s closing net asset value per share on the day of valuation. Investments in private investment companies are valued at the entity’s net asset value (or equivalent) as of the valuation date. Swaps are valued at prices furnished by independent swap dealers or by an independent pricing service.
Other investments, including restricted securities, and those financial instruments for which the above valuation procedures are inappropriate or are deemed not to reflect fair value are stated at fair value as determined in good faith by the T. Rowe Price Valuation Committee, established by the fund’s Board of Directors.
For valuation purposes, the last quoted prices of non-U.S. equity securities may be adjusted under the circumstances described below. If the fund determines that developments between the close of a foreign market and the close of the NYSE will, in its judgment, materially affect the value of some or all of its portfolio securities, the fund will adjust the previous closing prices to reflect what it believes to be the fair value of the securities as of the close of the NYSE. In deciding whether it is necessary to adjust closing prices to reflect fair value, the fund reviews a variety of factors, including developments in foreign markets, the performance of U.S. securities markets, and the performance of instruments trading in U.S. markets that represent foreign securities and baskets of foreign securities. A fund may also fair value securities in other situations, such as when a particular foreign market is closed but the fund is open. The fund uses outside pricing services to provide it with closing prices and information to evaluate and/or adjust those prices. The fund cannot predict how often it will use closing prices and how often it will determine it necessary to adjust those prices to reflect fair value. As a means of evaluating its security valuation process, the fund routinely compares closing prices, the next day’s opening prices in the same markets, and adjusted prices.
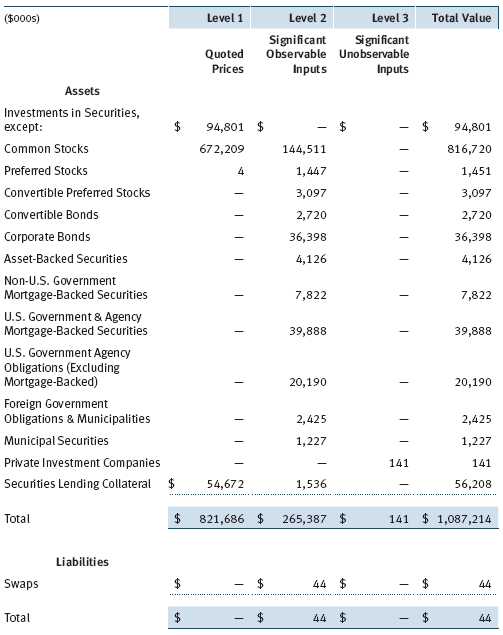
Valuation Inputs Various inputs are used to determine the value of the fund’s financial instruments. These inputs are summarized in the three broad levels listed below:
Level 1 – quoted prices in active markets for identical securities
Level 2 – observable inputs other than Level 1 quoted prices (including, but not limited to, quoted prices for similar securities, interest rates, prepayment speeds, credit risk)
Level 3 – unobservable inputs
Observable inputs are those based on market data obtained from sources independent of the fund, and unobservable inputs reflect the fund’s own assumptions based on the best information available. The input levels are not necessarily an indication of the risk or liquidity associated with financial instruments at that level. For example, non-U.S. equity securities actively traded in foreign markets generally are reflected in Level 2 despite the availability of closing prices because the fund evaluates and determines whether those closing prices reflect fair value at the close of the NYSE or require adjustment, as described above. The fund’s investments are summarized by level, based on the inputs used to determine their values. The following table summarizes the financial instruments, based on the inputs used to determine their values on November 30, 2009:
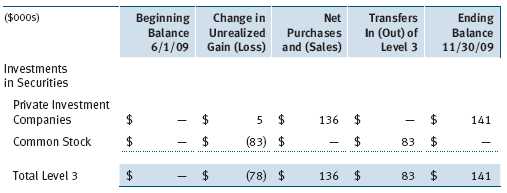
Following is a reconciliation of the fund’s Level 3 holdings for the six months ended November 30, 2009. Transfers into and out of Level 3 are reflected at the value of the financial instrument at the beginning of the period. Gain (loss) reflects both realized and change in unrealized gain (loss) on Level 3 holdings during the period, if any, and is included on the accompanying Statement of Operations. The change in unrealized gain/loss on Level 3 instruments held at November 30, 2009 totaled $(78,000) for the six months ended November 30, 2009.
NOTE 3 - DERIVATIVE INSTRUMENTS
During the six months ended November 30, 2009, the fund invested in derivative instruments. As defined by GAAP, a derivative is a financial instrument whose value is derived from an underlying security price, foreign exchange rate, interest rate, index of prices or rates, or other variable; it requires little or no initial investment and permits or requires net settlement. The fund invests in derivatives only if the expected risks and rewards are consistent with its investment objectives, policies, and overall risk profile, as described in its prospectus and Statement of Additional Information. The fund may use derivatives for a variety of purposes, such as seeking to hedge against declines in principal value, increase yield, invest in an asset with greater efficiency and at a lower cost than is possible through direct investment, or to adjust credit exposure. The risks associated with the use of derivatives are different from, and potentially much greater than, the risks associated with investing directly in the instruments on which the derivatives are based. Investments in derivatives can magnify returns positively or negatively; however, the fund at all times maintains sufficient cash reserves, liquid assets, or other SEC-permitted asset types to cover the settlement obligations under its open derivative contracts. During the six months ended November 30, 2009, the fund’s exposure to derivatives, based on underlying notional amounts, was generally between 0% and 1% of net assets.
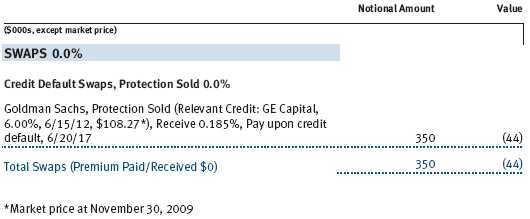
The fund values its derivatives at fair value, as described below and in Note 2, and recognizes changes in fair value currently in its results of operations. Accordingly, the fund does not follow hedge accounting, even for derivatives employed as economic hedges. As of November 30, 2009, the fund held credit derivatives with a fair value of $44,000, included in unrealized loss on swaps on the accompanying Statement of Assets and Liabilities.
Additionally, the amount of gains and losses on derivative instruments recognized in fund earnings during the six months ended November 30, 2009 and the related location on the accompanying Statement of Operations is summarized in the following table by primary underlying risk exposure:
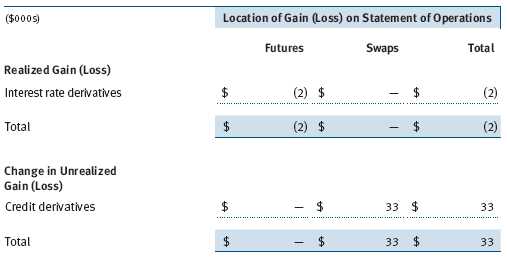
Futures Contracts The fund is subject to interest rate risk in the normal course of pursuing its investment objectives and uses futures contracts to help manage such risk. The fund may enter into futures contracts to manage exposure to interest rates, security prices, foreign currencies, and credit quality; as an efficient means of adjusting exposure to all or part of a target market; to enhance income; as a cash management tool; and/or to adjust credit exposure. A futures contract provides for the future sale by one party and purchase by another of a specified amount of a particular underlying financial instrument at an agreed-upon price, date, time, and place. The fund currently invests only in exchange-traded futures, which generally are standardized as to maturity date, underlying financial instrument, and other contract terms. Upon entering into a futures contract, the fund is required to deposit with the broker cash or securities in an amount equal to a certain percentage of the contract value (initial margin deposit); the margin deposit must then be maintained at the established level over the life of the contract. Subsequent payments are made or received by the fund each day to settle daily fluctuations in the value of the contract (variation margin), which reflect changes in the value of the underlying financial instrument. Variation margin is recorded as unrealized gain or loss until the contract is closed. The value of a futures contract included in net assets is the amount of unsettled variation margin; net variation margin receivable is reflected as an asset, and net variation margin payable is reflected as a liability on the accompanying Statement of Assets and Liabilities. Risks related to the use of futures contracts include possible illiquidity of the futures markets, contract prices that can be highly volatile and imperfectly correlated to movements in hedged security values and/or interest rates, and potential losses in excess of the fund’s initial investment.
Credit Default Swaps The fund is subject to credit risk in the normal course of pursuing its investment objectives and uses swap contracts to help manage such risk. The fund may use swaps in an effort to manage exposure to changes in interest rates and credit quality, to adjust overall exposure to certain markets, to enhance total return or protect the value of portfolio securities, to serve as a cash management tool, and/or to adjust portfolio duration or credit exposure. Credit default swaps are agreements where one party (the protection buyer) agrees to make periodic payments to another party (the protection seller) in exchange for protection against specified credit events, such as certain defaults and bankruptcies related to an underlying credit instrument, index, or issuer thereof. Upon occurrence of a specified credit event, the protection seller is required to pay the buyer the difference between the notional amount of the swap and the value of the underlying credit, either in the form of a net cash settlement or by paying the gross notional amount and accepting delivery of the relevant underlying credit. Generally, the payment risk for the seller of protection is inversely related to the current market price of the underlying credit; therefore, the payment risk increases as the price of the relevant underlying credit declines due to market valuations of credit quality. As of November 30, 2009, the notional amount of protection sold by the fund totaled $350,000 (0.0% of net assets), which reflects the maximum potential amount the fund could be required to pay under such contracts. The value of a swap included in net assets is the unrealized gain or loss on the contract. Appreciated swaps are reflected as assets, and depreciated swaps are reflected as liabilities on the accompanying Statement of Assets and Liabilities. Net periodic receipts or payments required by swaps are accrued daily and are recorded as realized gain or loss for financial reporting purposes; fluctuations in the fair value of swaps are reflected in the change in net unrealized gain or loss and are reclassified to realized gain or loss upon termination prior to maturity or cash settlement. Risks related to the use of credit default swaps include the possible inability of the fund to accurately assess the current and future creditworthiness of underlying issuers, the possible failure of a counterparty to perform in accordance with the terms of the swap agreements, potential government regulation that could adversely affect the fund’s swap investments, and potential losses in excess of the fund’s initial investment.
Counterparty Risk and Collateral The fund has entered into collateral agreements with certain counterparties to mitigate counterparty risk associated with over-the-counter (OTC) derivatives, including swaps and forward currency exchange contracts. Subject to certain minimum exposure requirements (which range from $100,000 to $500,000), collateral generally is determined based on the net aggregate unrealized gain or loss on all OTC derivative contracts with a particular counterparty. Collateral, both pledged by and for the benefit of the fund, is held in a segregated account by a third-party agent and can be in the form of cash or debt securities issued by the U.S. government or related agencies. Securities posted as collateral by the fund are so noted in the accompanying Portfolio of Investments and remain in the fund’s net assets. As of November 30, 2009, no collateral was pledged by either the fund or counterparties.
The fund’s maximum risk of loss from counterparty credit risk on OTC derivatives is the aggregate unrealized gain on appreciated contracts in excess of any collateral pledged by the counterparty for the benefit of the fund. Counterparty risk related to exchange-traded futures and options contracts is minimal because the exchange’s clearinghouse provides protection against defaults. In accordance with standard derivatives agreements, counterparties to OTC derivatives may be able to terminate derivative contracts prior to maturity in the event the fund fails to maintain sufficient asset coverage; its net assets decline by stated percentages; or it otherwise fails to meet the terms of its agreements, which would cause the fund to accelerate payment of any net liability owed to the counterparty under the contract. For exchange-traded derivatives such as futures and options, each broker in its sole discretion may change margin requirements applicable to the fund.
NOTE 4 - OTHER INVESTMENT TRANSACTIONS
Consistent with its investment objective, the fund engages in the following practices to manage exposure to certain risks or to enhance performance. The investment objective, policies, program, and risk factors of the fund are described more fully in the fund’s prospectus and Statement of Additional Information.
Restricted Securities The fund may invest in securities that are subject to legal or contractual restrictions on resale. Prompt sale of such securities at an acceptable price may be difficult and may involve substantial delays and additional costs.
TBA Purchase Commitments During the six months ended November 30, 2009, the fund entered into to be announced (TBA) purchase commitments, pursuant to which it agrees to purchase mortgage-backed securities for a fixed unit price, with payment and delivery at a scheduled future date beyond the customary settlement period for that security. With TBA transactions, the particular securities to be delivered are not identified at the trade date; however, delivered securities must meet specified terms, including issuer, rate, and mortgage term, and be within industry-accepted “good delivery” standards. The fund generally enters into TBA transactions with the intention of taking possession of the underlying mortgage securities. Until settlement, the fund maintains cash reserves and liquid assets sufficient to settle its TBA commitments.
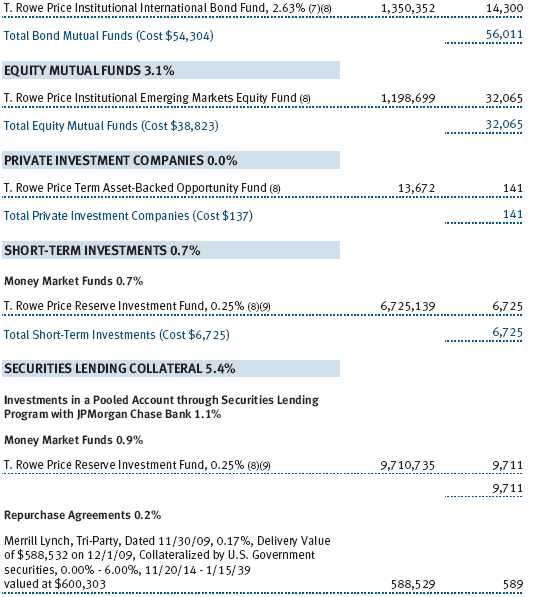
Repurchase Agreements All repurchase agreements are fully collateralized by U.S. government securities. Collateral is in the possession of the fund’s custodian or, for tri-party agreements, the custodian designated by the agreement. Collateral is evaluated daily to ensure that its market value exceeds the delivery value of the repurchase agreements at maturity. Although risk is mitigated by the collateral, the fund could experience a delay in recovering its value and a possible loss of income or value if the counterparty fails to perform in accordance with the terms of the agreement.
Securities Lending The fund lends its securities to approved brokers to earn additional income. It receives as collateral cash and U.S. government securities valued at 102% to 105% of the value of the securities on loan. Cash collateral is invested by the fund’s lending agent(s) in accordance with investment guidelines approved by fund management. Although risk is mitigated by the collateral, the fund could experience a delay in recovering its securities and a possible loss of income or value if the borrower fails to return the securities or if collateral investments decline in value. Securities lending revenue recognized by the fund consists of earnings on invested collateral and borrowing fees, net of any rebates to the borrower and compensation to the lending agent. On November 30, 2009, the value of loaned securities was $54,685,000.
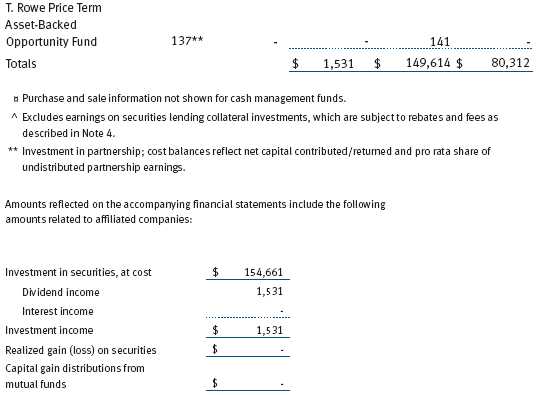
T. Rowe Price Term Asset-Backed Opportunity Fund, L.L.C. During the six months ended November 30, 2009, the fund invested in the T. Rowe Price Term Asset-Backed Opportunity Fund, L.L.C. (private fund), a private investment company managed by Price Associates that participates in the Term Asset-Backed Securities Loan Facility (TALF) program created and administered by the Federal Reserve Bank of New York (FRBNY). The TALF program provides eligible borrowers with term loans secured by eligible asset-backed securities and/or commercial mortgage-backed securities, which are either owned by the borrower or purchased by the borrower and subsequently pledged as collateral for a TALF loan. TALF loans generally are nonrecourse in nature. The private fund is treated as a partnership for federal income tax purposes. It has a limited life extending five years from final termination of the TALF program, currently scheduled for June 30, 2010, with two possible one-year extensions. Invested capital generally will be returned to investors as underlying securities are liquidated and the TALF loans mature, with the balance paid at maturity of the private fund. Ownership interests in the private fund may not be redeemed, sold, or assigned. As of November 30, 2009, the fund had outstanding capital commitments in the amount of $332,000, which may be called at the discretion of the private fund’s manager.
Other Purchases and sales of portfolio securities other than short-term and U.S. government securities aggregated $163,308,000 and $176,834,000, respectively, for the six months ended November 30, 2009. Purchases and sales of U.S. government securities aggregated $40,497,000 and $23,649,000, respectively, for the six months ended November 30, 2009.
NOTE 5 - FEDERAL INCOME TAXES
No provision for federal income taxes is required since the fund intends to continue to qualify as a regulated investment company under Subchapter M of the Internal Revenue Code and distribute to shareholders all of its taxable income and gains. Distributions determined in accordance with federal income tax regulations may differ in amount or character from net investment income and realized gains for financial reporting purposes. Financial reporting records are adjusted for permanent book/tax differences to reflect tax character but are not adjusted for temporary differences. The amount and character of tax-basis distributions and composition of net assets are finalized at fiscal year-end; accordingly, tax-basis balances have not been determined as of November 30, 2009.
In accordance with federal tax regulations, the fund deferred recognition of certain capital loss amounts previously recognized in the prior fiscal year for financial reporting purposes until the current fiscal period for tax purposes. Such deferrals amounted to $88,973,000 and related to net capital losses realized between November 1 and the fund’s fiscal year-end date. Further, the fund intends to retain realized gains to the extent of available capital loss carryforwards. As of November 30, 2008, the fund had $35,465,000 of unused capital loss carryforwards, of which $35,465,000 expire in fiscal 2017.
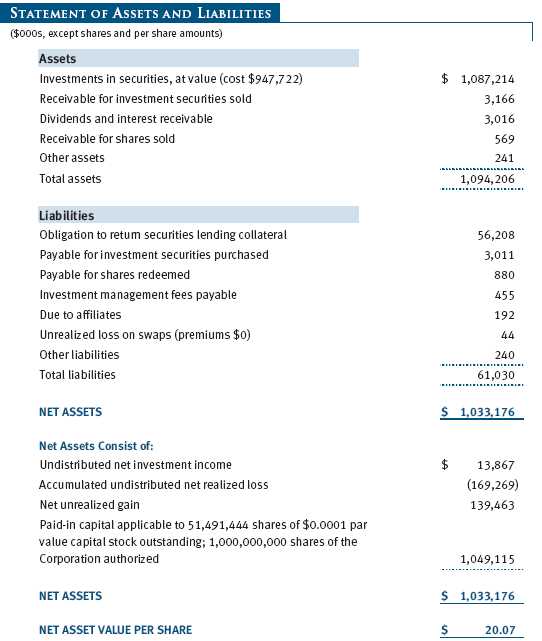
At November 30, 2009, the cost of investments for federal income tax purposes was $947,722,000. Net unrealized gain aggregated $139,463,000 at period-end, of which $192,915,000 related to appreciated investments and $53,452,000 related to depreciated investments.
NOTE 6 - RELATED PARTY TRANSACTIONS
The fund is managed by T. Rowe Price Associates, Inc. (the manager or Price Associates), a wholly owned subsidiary of T. Rowe Price Group, Inc. The investment management agreement between the fund and the manager provides for an annual investment management fee, which is computed daily and paid monthly. The fee consists of an individual fund fee, equal to 0.30% of the fund’s average daily net assets, and a group fee. The group fee rate is calculated based on the combined net assets of certain mutual funds sponsored by Price Associates (the group) applied to a graduated fee schedule, with rates ranging from 0.48% for the first $1 billion of assets to 0.285% for assets in excess of $220 billion. The fund’s group fee is determined by applying the group fee rate to the fund’s average daily net assets. At November 30, 2009, the effective annual group fee rate was 0.31%.
In addition, the fund has entered into service agreements with Price Associates and two wholly owned subsidiaries of Price Associates (collectively, Price). Price Associates computes the daily share price and provides certain other administrative services to the fund. T. Rowe Price Services, Inc., provides shareholder and administrative services in its capacity as the fund’s transfer and dividend disbursing agent. T. Rowe Price Retirement Plan Services, Inc., provides subaccounting and recordkeeping services for certain retirement accounts invested in the fund. For the six months ended November 30, 2009, expenses incurred pursuant to these service agreements were $67,000 for Price Associates; $288,000 for T. Rowe Price Services, Inc.; and $385,000 for T. Rowe Price Retirement Plan Services, Inc. The total amount payable at period-end pursuant to these service agreements is reflected as Due to Affiliates in the accompanying financial statements.
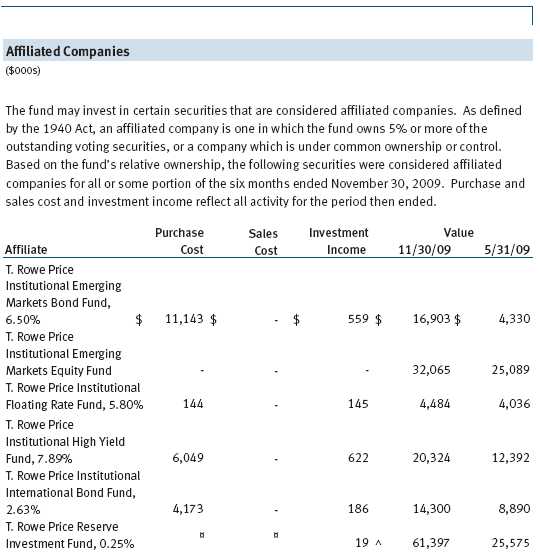
The fund may invest in the T. Rowe Price Reserve Investment Fund and the T. Rowe Price Government Reserve Investment Fund (collectively, the T. Rowe Price Reserve Investment Funds), open-end management investment companies managed by Price Associates and considered affiliates of the fund. The T. Rowe Price Reserve Investment Funds are offered as cash management options to mutual funds, trusts, and other accounts managed by Price Associates and/or its affiliates and are not available for direct purchase by members of the public. The T. Rowe Price Reserve Investment Funds pay no investment management fees.
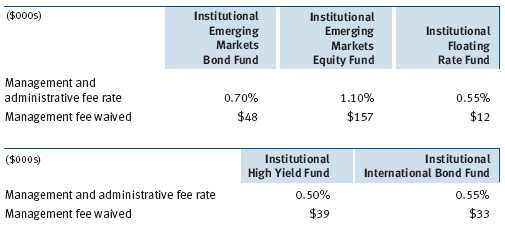
The fund may also invest in certain T. Rowe Price institutional funds (underlying institutional funds) as a means of gaining efficient and cost-effective exposure to certain markets. The underlying institutional funds are open-end management investment companies managed by Price Associates and/or T. Rowe Price International, Inc. (collectively, the Price managers) and are considered affiliates of the fund. Each underlying institutional fund pays an all-inclusive management and administrative fee to its Price manager. To ensure that the fund does not incur duplicate fees, each Price manager has agreed to permanently waive a portion of its management fee charged to the fund in an amount sufficient to fully offset the fees paid by the underlying institutional funds related to fund assets invested therein. Accordingly, the accompanying Statement of Operations includes management fees permanently waived pursuant to this agreement. Annual fee rates and amounts waived within the accompanying Statement of Operations related to shares of the underlying institutional funds for the six months ended November 30, 2009, are as follows:
| INFORMATION ON PROXY VOTING POLICIES, PROCEDURES, AND RECORDS |
A description of the policies and procedures used by T. Rowe Price funds and portfolios to determine how to vote proxies relating to portfolio securities is available in each fund’s Statement of Additional Information, which you may request by calling 1-800-225-5132 or by accessing the SEC’s Web site, www.sec.gov. The description of our proxy voting policies and procedures is also available on our Web site, www.troweprice.com. To access it, click on the words “Our Company” at the top of our corporate homepage. Then, when the next page appears, click on the words “Proxy Voting Policies” on the left side of the page.
Each fund’s most recent annual proxy voting record is available on our Web site and through the SEC’s Web site. To access it through our Web site, follow the directions above, then click on the words “Proxy Voting Records” on the right side of the Proxy Voting Policies page.
| HOW TO OBTAIN QUARTERLY PORTFOLIO HOLDINGS |
The fund files a complete schedule of portfolio holdings with the Securities and Exchange Commission for the first and third quarters of each fiscal year on Form N-Q. The fund’s Form N-Q is available electronically on the SEC’s Web site (www.sec.gov); hard copies may be reviewed and copied at the SEC’s Public Reference Room, 450 Fifth St. N.W., Washington, DC 20549. For more information on the Public Reference Room, call 1-800-SEC-0330.
Item 2. Code of Ethics.
A code of ethics, as defined in Item 2 of Form N-CSR, applicable to its principal executive officer, principal financial officer, principal accounting officer or controller, or persons performing similar functions is filed as an exhibit to the registrant’s annual Form N-CSR. No substantive amendments were approved or waivers were granted to this code of ethics during the registrant’s most recent fiscal half-year.
Item 3. Audit Committee Financial Expert.
Disclosure required in registrant’s annual Form N-CSR.
Item 4. Principal Accountant Fees and Services.
Disclosure required in registrant’s annual Form N-CSR.
Item 5. Audit Committee of Listed Registrants.
Not applicable.
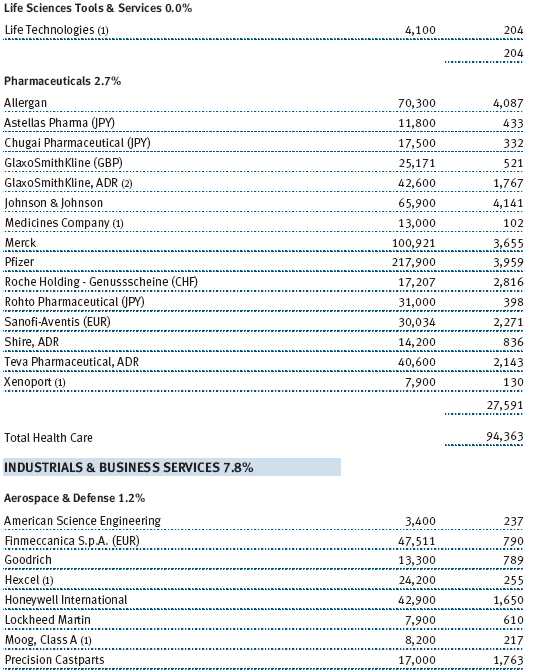
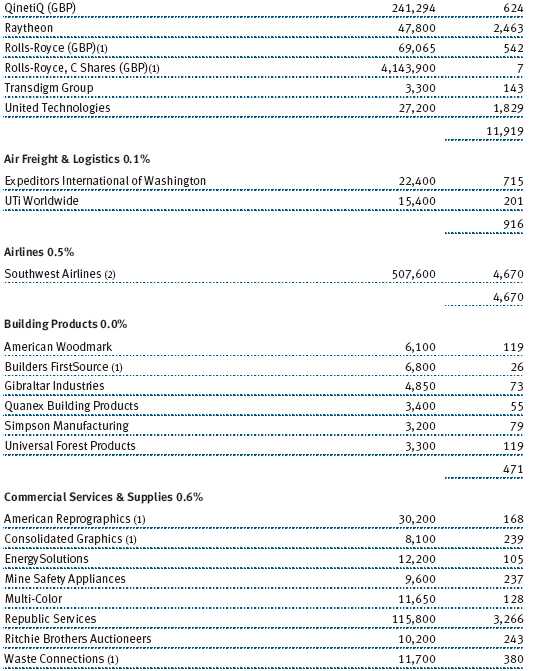
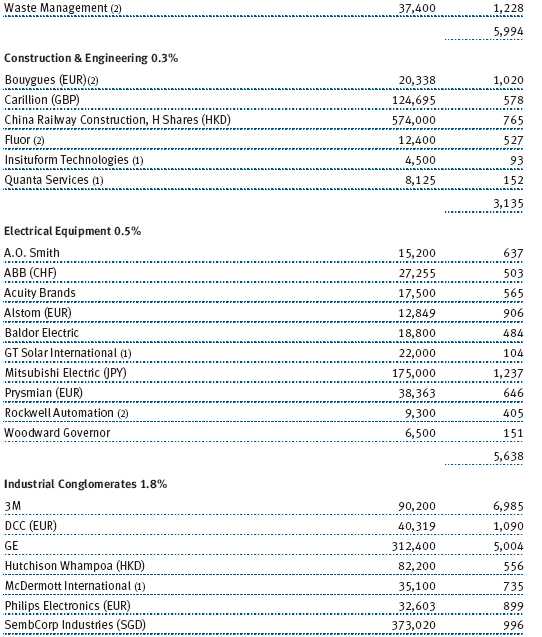
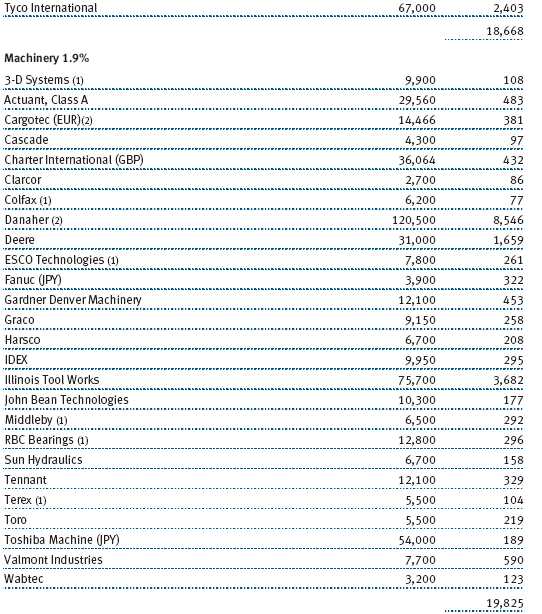
Item 6. Investments.
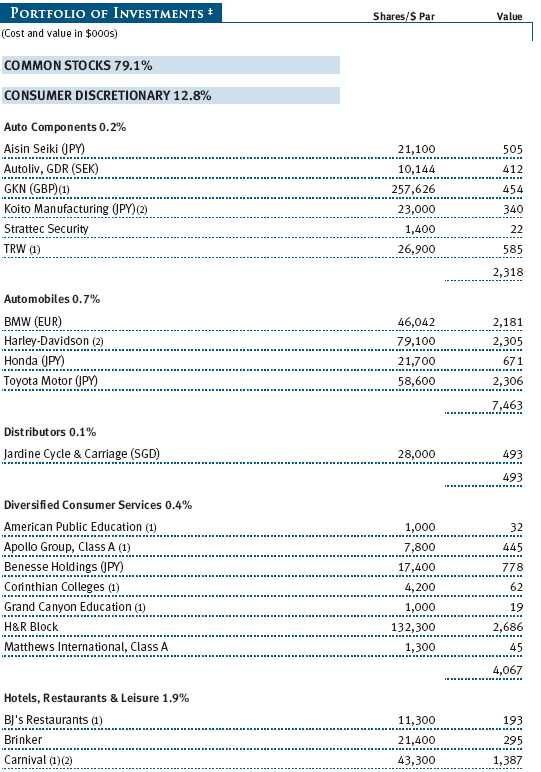
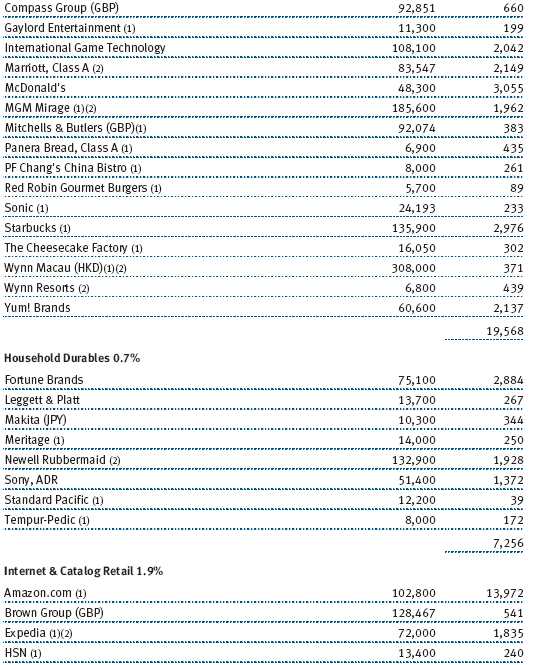
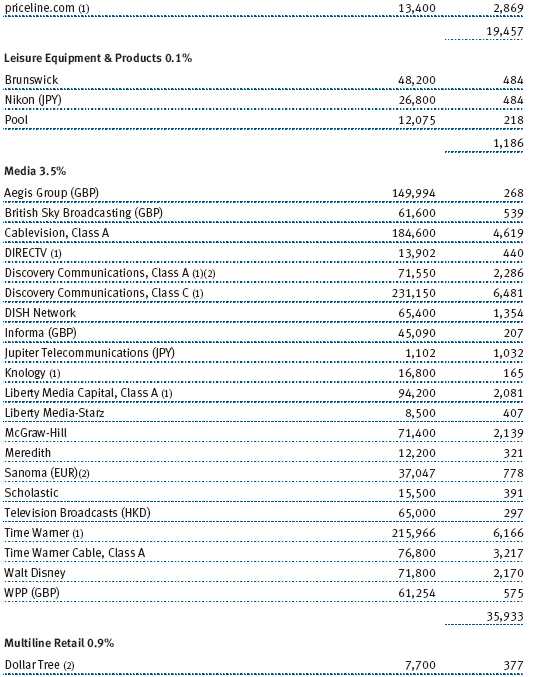
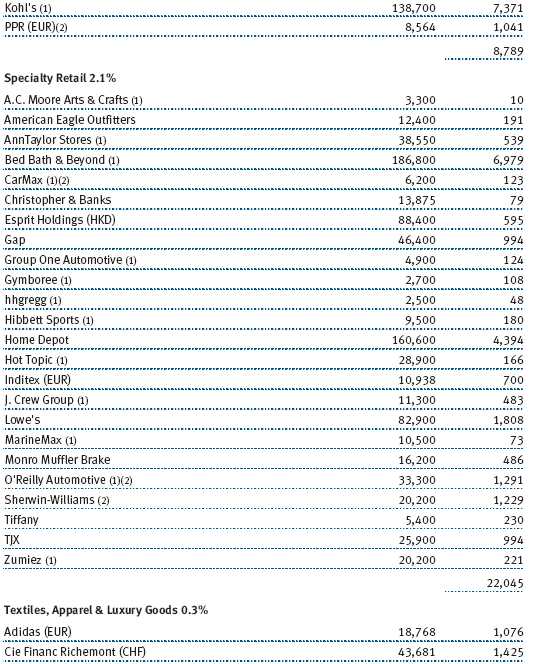
(a) Not applicable. The complete schedule of investments is included in Item 1 of this Form N-CSR.
(b) Not applicable.
Item 7. Disclosure of Proxy Voting Policies and Procedures for Closed-End Management Investment Companies.
Not applicable.
Item 8. Portfolio Managers of Closed-End Management Investment Companies.
Not applicable.
Item 9. Purchases of Equity Securities by Closed-End Management Investment Company and Affiliated Purchasers.
Not applicable.
Item 10. Submission of Matters to a Vote of Security Holders.
Not applicable.
Item 11. Controls and Procedures.
(a) The registrant’s principal executive officer and principal financial officer have evaluated the registrant’s disclosure controls and procedures within 90 days of this filing and have concluded that the registrant’s disclosure controls and procedures were effective, as of that date, in ensuring that information required to be disclosed by the registrant in this Form N-CSR was recorded, processed, summarized, and reported timely.
(b) The registrant’s principal executive officer and principal financial officer are aware of no change in the registrant’s internal control over financial reporting that occurred during the registrant’s second fiscal quarter covered by this report that has materially affected, or is reasonably likely to materially affect, the registrant’s internal control over financial reporting.
Item 12. Exhibits.
(a)(1) The registrant’s code of ethics pursuant to Item 2 of Form N-CSR is filed with the registrant’s annual Form N-CSR.
(2) Separate certifications by the registrant's principal executive officer and principal financial officer, pursuant to Section 302 of the Sarbanes-Oxley Act of 2002 and required by Rule 30a-2(a) under the Investment Company Act of 1940, are attached.
(3) Written solicitation to repurchase securities issued by closed-end companies: not applicable.
(b) A certification by the registrant's principal executive officer and principal financial officer, pursuant to Section 906 of the Sarbanes-Oxley Act of 2002 and required by Rule 30a-2(b) under the Investment Company Act of 1940, is attached.
| | |
SIGNATURES |
| |
| | Pursuant to the requirements of the Securities Exchange Act of 1934 and the Investment |
| Company Act of 1940, the registrant has duly caused this report to be signed on its behalf by the |
| undersigned, thereunto duly authorized. |
| |
| T. Rowe Price Personal Strategy Funds, Inc. |
| |
| |
| |
| By | /s/ Edward C. Bernard |
| | Edward C. Bernard |
| | Principal Executive Officer |
| |
| Date | January 22, 2010 |
| |
| |
| |
| | Pursuant to the requirements of the Securities Exchange Act of 1934 and the Investment |
| Company Act of 1940, this report has been signed below by the following persons on behalf of |
| the registrant and in the capacities and on the dates indicated. |
| |
| |
| By | /s/ Edward C. Bernard |
| | Edward C. Bernard |
| | Principal Executive Officer |
| |
| Date | January 22, 2010 |
| |
| |
| |
| By | /s/ Gregory K. Hinkle |
| | Gregory K. Hinkle |
| | Principal Financial Officer |
| |
| Date | January 22, 2010 |