UNITED STATES
SECURITIES AND EXCHANGE COMMISSION
Washington, D.C. 20549
FORM N-CSR
CERTIFIED SHAREHOLDER REPORT OF REGISTERED
MANAGEMENT INVESTMENT COMPANIES
Investment Company Act File Number: 811-07173
| T. Rowe Price Personal Strategy Funds, Inc. |
|
| (Exact name of registrant as specified in charter) |
| |
| 100 East Pratt Street, Baltimore, MD 21202 |
|
| (Address of principal executive offices) |
| |
| David Oestreicher |
| 100 East Pratt Street, Baltimore, MD 21202 |
|
| (Name and address of agent for service) |
Registrant’s telephone number, including area code: (410) 345-2000
Date of fiscal year end: May 31
Date of reporting period: November 30, 2012
Item 1. Report to Shareholders
| Personal Strategy Growth Fund | November 30, 2012 |
The views and opinions in this report were current as of November 30, 2012. They are not guarantees of performance or investment results and should not be taken as investment advice. Investment decisions reflect a variety of factors, and the managers reserve the right to change their views about individual stocks, sectors, and the markets at any time. As a result, the views expressed should not be relied upon as a forecast of the fund’s future investment intent. The report is certified under the Sarbanes-Oxley Act, which requires mutual funds and other public companies to affirm that, to the best of their knowledge, the information in their financial reports is fairly and accurately stated in all material respects.
REPORTS ON THE WEB
Sign up for our E-mail Program, and you can begin to receive updated fund reports and prospectuses online rather than through the mail. Log in to your account at troweprice.com for more information.
Manager’s Letter
Fellow Shareholders
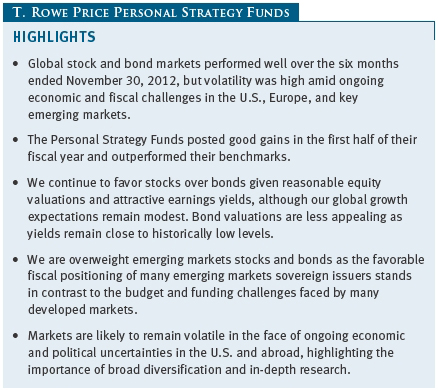
Major U.S. stock indexes produced solid results in the six-month period ended November 30, 2012, despite the ongoing European sovereign debt crisis, China’s economic slowdown, and decelerating U.S. corporate earnings growth. Non-U.S. equity markets outperformed U.S. shares, led by markets in the developed world. Domestic bonds produced moderate gains, led by higher-risk issues, as fixed income investors continued seeking attractive yields in a low interest rate environment. Emerging markets debt rose by double digits, while non-U.S. developed markets bonds posted more modest gains.
MARKET ENVIRONMENT
Accommodative actions by central banks around the world lifted investor sentiment during the period. In the U.S., the Federal Reserve kept the fed funds target rate in its 0.00% to 0.25% range and projected that short-term rates will remain low at least until mid-2015. The Fed extended its Maturity Extension Program through the end of the year and initiated a third round of quantitative easing (commonly known as QE3) through the purchase of $40 billion of agency mortgage-backed securities each month. Significantly, the Fed set no expiration date on its buying program, but rather indicated that it would continue making asset purchases as long as “the outlook for the labor market does not improve substantially.” (Shortly after the end of our reporting period, the Fed announced further Treasury bond purchases and set a specific target for the unemployment rate, 6.5%, for the end of its mortgage-backed securities purchase program.)
European Central Bank President Mario Draghi pledged to do “whatever it takes to preserve the euro” and followed up with a conditional plan to purchase short-term sovereign debt of financially troubled eurozone countries that agree to enter formal assistance programs and institute economic reforms. The Bank of Japan moved to expand its own asset purchase program in its continuing effort to fight deflation. The period ended with significant uncertainty about U.S. fiscal policy, however, as the Obama administration and congressional Republicans attempted to reach an agreement to prevent or lessen the economic impact of the year-end fiscal cliff, a series of tax increases and spending cuts scheduled to take effect in January 2013.

U.S. stocks produced solid gains over the past six months. Large-cap stocks outperformed their smaller counterparts for the period, and value shares fared better than growth across all market capitalizations. Non-U.S. equities produced excellent results over the last six months, with developed and emerging European markets among the best performers. Investors were encouraged by European efforts to stabilize the debt crisis and contain rising government bond yields in peripheral eurozone countries. Japanese shares lagged amid declining exports, a strong yen, and a weakening economy.
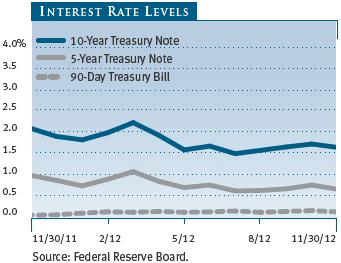
U.S. bonds produced moderate returns over the six-month period, with the Barclays U.S. Aggregate Bond Index returning 1.99%. In the investment-grade universe, corporate and municipal bonds performed well. Asset- and agency mortgage-backed securities trailed with lesser gains. Treasuries also lagged, as long-term yields edged higher during the period. High yield securities strongly outperformed their higher-quality counterparts.
PORTFOLIO REVIEW AND POSITIONING
Stocks
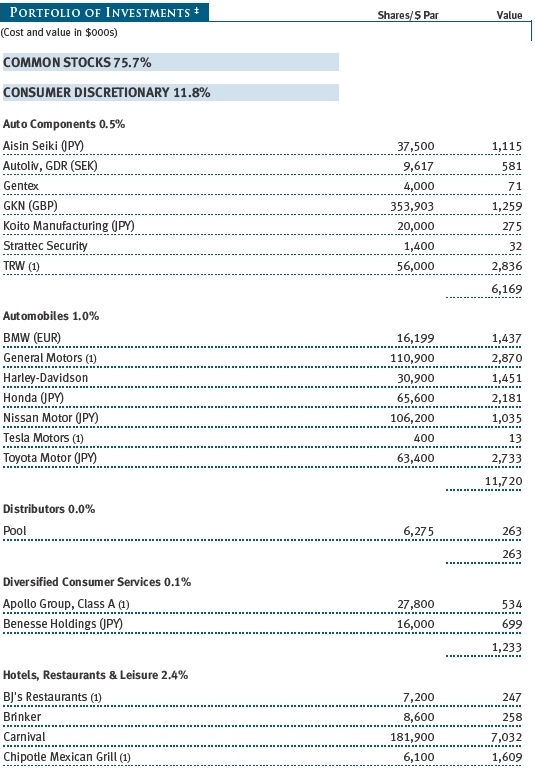
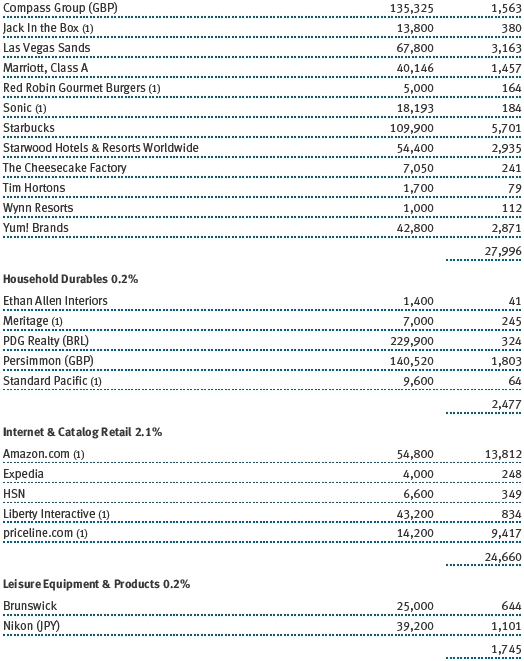
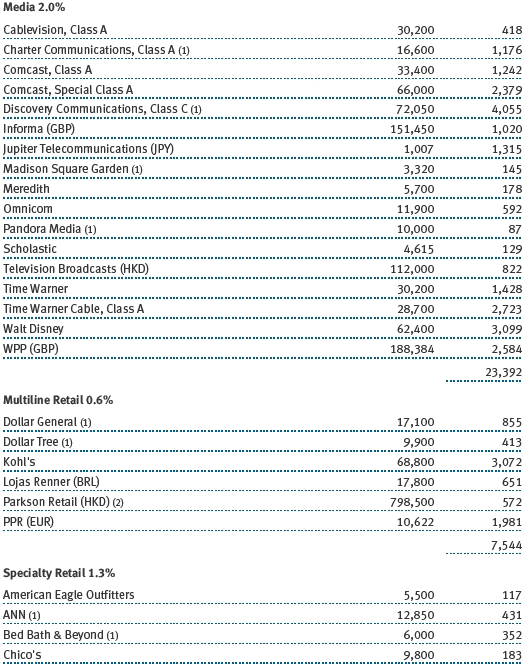
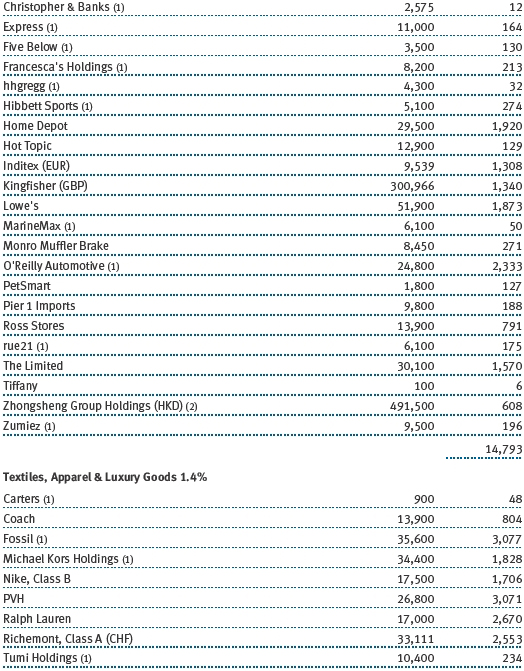
An overweight to stocks versus bonds helped performance in the six months since our last report. The domestic large-cap value stock portfolio was among the funds’ best absolute performers over the period and outpaced its style-specific benchmark. Financials stocks were particularly strong, led by JPMorgan Chase, Moody’s, and Bank of America. The health care sector also generated strong results, with Pfizer and Merck among the biggest contributors. Utilities stocks managed only a modest overall gain, with Exelon and MDU Resources among our weakest performers. The funds’ U.S. large-cap growth stock portfolio posted solid gains but lagged the broader equity markets. Google, the world’s leading Web search engine, and Internet shopping giant Amazon.com were standout performers. Our non-U.S. developed markets stock portfolio generated double-digit gains but lagged its benchmark. Emerging markets equities were also strong, and security selection boosted results for the emerging market stock portfolio versus its benchmark. (Please refer to the portfolio of investments for a complete list of holdings and the amount each represents in the portfolio.)
We modestly reduced the size of our overweight to stocks versus bonds during the reporting period. Stocks remain reasonably valued and still appear attractive relative to historical valuations. Recent monetary easing from central banks around the world has helped to reduce some of the downside risk, but the uncertainty of U.S. fiscal policy and austerity measures in Europe are constraining upside potential. U.S. corporate balance sheets and profit margins still appear healthy, buoyed by cautious hiring and capital expenditure trends. However, a slowing global economy may weigh on revenue and earnings growth. Stocks offer dividend yields that are competitive with bond yields, which remain low despite modest inflationary pressures.
We favor domestic growth stocks over value stocks. A low-growth economy often benefits growth stocks more than value, as growth companies tend to rely less on a strong economy to increase corporate earnings. A modest improvement in global economic growth is unlikely to provide a sufficient catalyst for value stocks to outperform. Valuations currently favor large-cap stocks over small-caps, as the latter’s solid performance in recent years has reinforced the rich pricing in the small-cap universe.
U.S. economic growth prospects appear better than those of overseas developed markets, but we remain neutral between the two as the weaker growth has been priced into current international stock valuations. Valuations for stocks from developed markets outside the U.S. reflect challenging fundamentals, including a weakening European economy. However, this is balanced by expectations for higher growth in emerging markets. We are overweight emerging markets equities relative to developed equity markets due to their better intermediate- to long-term growth prospects. However, we trimmed the size of our overweight in light of slowing global economic growth, which could constrain growth in export-oriented economies over the short term. Although global growth may be slowing, emerging economies face fewer headwinds due to debt and fiscal issues and have more flexibility to respond to any economic and fiscal challenges that may arise.
We are underweight real assets stocks versus global equities as the prospects for muted global economic growth may weigh on commodity prices. We expect commodities demand to remain subdued as China shifts its growth model from industrial production and exports to domestic consumption. Over the long term, however, exposure to energy and natural resources, real estate, basic materials, equipment, utilities and infrastructure, and commodities should expand the funds’ broad diversification and position them to perform well under a variety of market conditions, including periods of rising inflation.
Bonds
Our fixed income allocation generated positive overall returns for the past six months and outperformed the benchmark Barclays U.S. Aggregate Bond Index. Diversifying sectors such as high yield, emerging markets debt, and non-U.S. developed markets bonds, which are not included in the Barclays benchmark, were strong contributors. Our allocation to U.S. investment-grade bonds generated more modest gains, but security selection helped our underlying portfolio outperform its benchmark by a substantial margin.
We reduced the size of our overweight allocation to high yield versus investment-grade bonds due to narrowing yield spreads and aggressive trends in the new issue market, such as debt covenant terms that are less favorable to bondholders. Despite this, high yield bonds remain attractive relative to other fixed income sectors in this low-yield environment, particularly in light of our expectations for gradual economic improvement. In addition, many high yield issuers have improved their financial condition significantly since the 2008 global financial crisis, taking advantage of low interest rates to refinance debt and extend maturities. The tendency for high yield debt to be less sensitive to changes in interest rates is appealing given that interest rates are generally near historical lows. We trimmed our allocation to emerging markets debt but remain overweight versus U.S. investment-grade bonds. Slower global growth prospects have eased inflationary concerns in emerging markets, and the favorable fiscal positioning of many emerging markets sovereign issuers stands in contrast to the budget and funding challenges faced by many developed markets. Despite easier monetary policies and persistent fiscal deficits, we believe the U.S. dollar should continue to benefit as a defensive currency during periods of heightened risk aversion.
PERFORMANCE COMPARISON
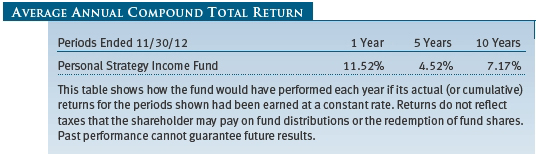
Personal Strategy Income Fund
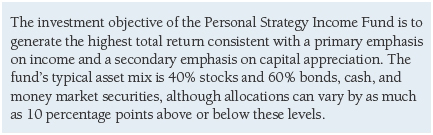
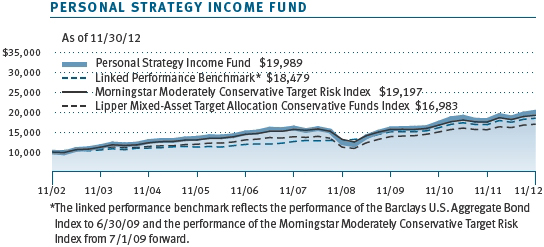
As shown in the Performance Comparison table, the Personal Strategy Income Fund gained 7.70% for the six months ended November 30, 2012. The fund comfortably outpaced its combined index portfolio, Morningstar benchmark, and Lipper peer group index for the period.

Allocations to sectors not included in the fund’s broader fixed income benchmark were positive overall for the six-month period. Exposure to emerging markets debt and high yield bonds was particularly beneficial, while non-U.S. developed markets bonds helped to a lesser extent. Our portfolio of real assets stocks provided strong absolute returns and outperformed its style benchmark during the period, but it had little net impact on overall fund results versus our blended equity benchmark, as the sector generally underperformed the broader equity markets. Security selection also boosted results as a majority of the fund’s underlying portfolios outperformed their respective benchmarks. Among stocks, our domestic large-cap value portfolio performed best versus its benchmark, while U.S. large-cap growth and emerging markets stocks were also helpful. Stocks from non-U.S. developed markets were positive but slightly underperformed their benchmark. Our investment-grade bonds outperformed their benchmark and again led relative performance in the fund’s fixed income allocation. Our emphasis on stocks over bonds helped relative results. Please see the Portfolio Review and Positioning section for more information.
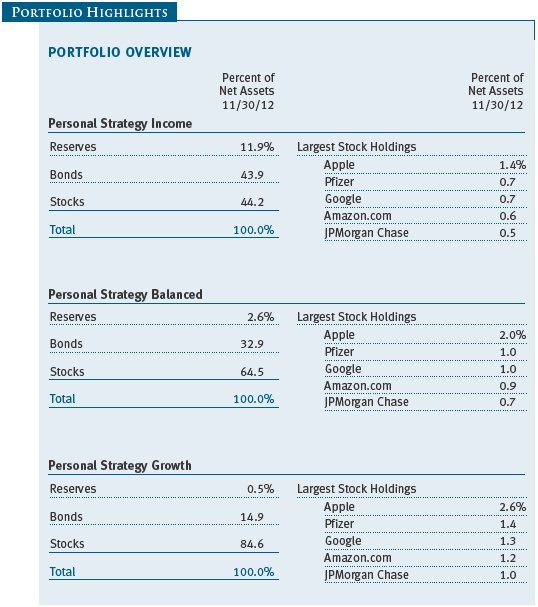
The fund’s target allocation to equities was 44% at the end of the current reporting period versus 45% on May 31, 2012. The target allocation to bonds and cash was 56% at the end of the period versus 55% six months ago. The actual allocations may differ from the target allocations due to investment time horizon, market conditions, trading environment, and other factors.
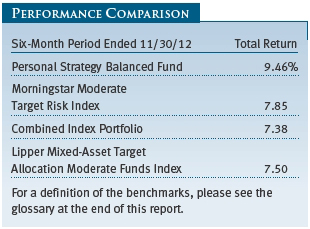
Personal Strategy Balanced Fund

As shown in the Performance Comparison table, the Personal Strategy Balanced Fund gained 9.46% for the six months ended November 30, 2012. The fund comfortably outpaced its combined index portfolio, Morningstar benchmark, and Lipper peer group index for the period.
Allocations to sectors not included in the fund’s broader fixed income benchmark were positive overall for the six-month period. Exposure to emerging markets debt and high yield bonds was particularly beneficial, while non-U.S. developed markets bonds helped to a lesser extent. Our portfolio of real assets stocks provided strong absolute returns and outperformed its style benchmark during the period, but it had little net impact on overall fund results versus our blended equity benchmark, as the sector generally underperformed the broader equity markets. Security selection also boosted results as a majority of the fund’s underlying portfolios outperformed their respective benchmarks. Among stocks, our domestic large-cap value portfolio performed best versus its benchmark, while U.S. large-cap growth and emerging markets stocks were also helpful. Our investment-grade bonds outperformed their benchmark and again led relative performance in the fund’s fixed income allocation. Our emphasis on stocks over bonds helped relative results. Please see the Portfolio Review and Positioning section for more information.
The fund’s target allocation to equities was 64% at the end of the current reporting period versus 65% on May 31, 2012. The target allocation to bonds and cash was 36% at the end of the period versus 35% six months ago. The actual allocations may differ from the target allocations due to investment time horizon, market conditions, trading environment, and other factors.
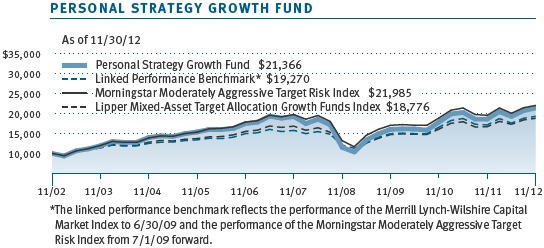
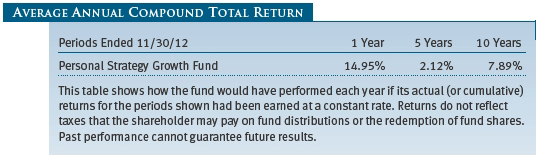
Personal Strategy Growth Fund
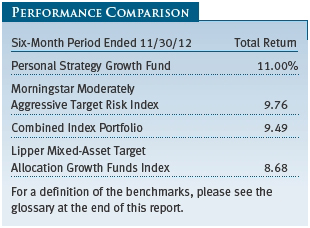
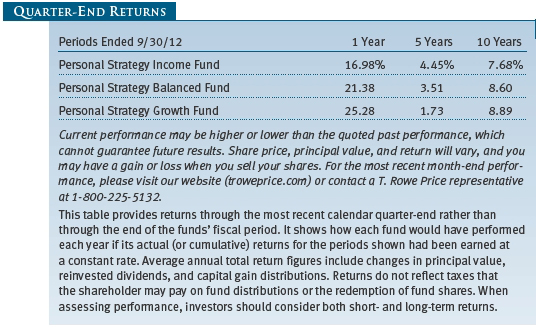
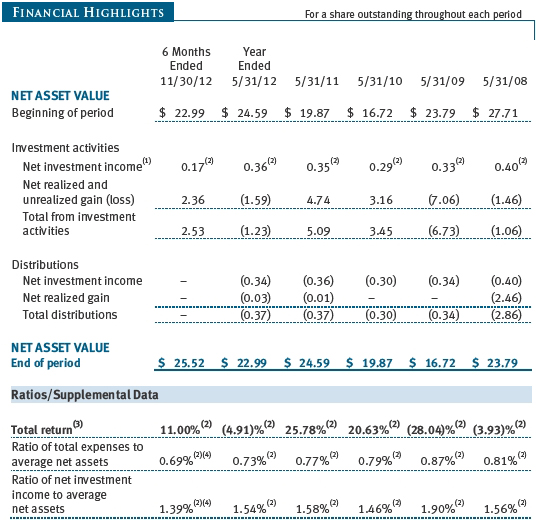
As shown in the Performance Comparison table, the Personal Strategy Growth Fund gained 11.00% for the six months ended November 30, 2012. The fund outpaced its combined index portfolio, Morningstar benchmark, and Lipper peer group index for the period.
Security selection was the primary factor behind the fund’s outperformance versus its benchmarks over the past six months. Our portfolio of large-cap value stocks comfortably outpaced its style-specific benchmark, while U.S. large-cap growth and non-U.S. emerging markets stocks also performed well. Stock selection in non-U.S. developed markets weighed on results. Our investment-grade bonds outperformed their benchmark and again led relative performance in the fund’s fixed income allocation. Allocations to sectors not included in the fund’s broader fixed income benchmarks were also positive. Exposure to emerging markets debt and high yield bonds was particularly beneficial, while non-U.S developed markets bonds helped to a lesser extent. Our portfolio of real assets stocks provided strong absolute returns and outperformed its style benchmark during the period, but it had little impact on overall fund results versus our blended equity benchmark, as the sector generally underperformed the broader equity markets. Our emphasis on stocks over bonds helped relative results. Please see the Portfolio Review and Positioning section for more information.
The fund’s target allocation to equities was 84% at the end of the current reporting period versus 85% on May 31, 2012. The target allocation to bonds and cash was 16% at the end of the period versus 15% six months ago. The actual allocations may differ from the target allocations due to investment time horizon, market conditions, trading environment, and other factors.
OUTLOOK
We expect modest economic improvement in most of the world’s major markets, though significant risks remain. U.S. growth expectations remain modest amid weak capital spending and labor market conditions, hindered by uncertainty about the federal government’s “fiscal cliff,” including the expiration of the Bush-era tax cuts and looming reductions in government spending. Outside the U.S., much of Europe is mired in recession, and the potential for weaker growth in key emerging markets such as China, Brazil, and India may lead to renewed caution on the part of investors.
There are reasons for optimism, however. U.S. economic data are showing incremental improvements in employment, housing, and retail spending. Corporate balance sheets and earnings remain strong even as earnings growth decelerates. Against a backdrop of diminishing productivity gains, companies may increase employment and investment to meet incrementally rising demand, while the potential for lower energy prices should provide further support. Equity valuations are attractive relative to historical levels, and stocks offer dividend yields that, in many cases, are competitive with bond yields. European policymakers appear to have stabilized the Continent’s debt crisis. Although a cure remains elusive as we await substantive progress on the long-term fiscal problems plaguing many European countries, the danger of a disorderly breakup of the eurozone has receded substantially. Although economic growth in emerging markets appears to be slowing, it remains robust. We believe that the worst of China’s economic slowdown has passed, and we are starting to see better numbers as the country charts a path toward more sustainable growth rates.
Although market volatility has ebbed from its high level at midyear, economic and political uncertainties persist in the U.S. and abroad. While no investment can be protected from every scenario, we believe that a highly diversified portfolio and a focus on careful research improve our opportunity for success.
Respectfully submitted,

Charles Shriver
Portfolio manager and chairman of the funds’ Investment Advisory Committee
December 17, 2012
The committee chairman has day-to-day responsibility for managing the portfolios and works with committee members in developing and executing the funds’ investment programs.
RISKS OF INVESTING
As with all stock and bond mutual funds, each fund’s share price can fall because of weakness in the stock or bond markets, a particular industry, or specific holdings. Stock markets can decline for many reasons, including adverse political or economic developments, changes in investor psychology, or heavy institutional selling. The prospects for an industry or company may deteriorate because of a variety of factors, including disappointing earnings or changes in the competitive environment. In addition, the investment manager’s assessment of companies held in a fund may prove incorrect, resulting in losses or poor performance even in rising markets.
Bonds are subject to interest rate risk, the decline in bond prices that usually accompanies a rise in interest rates, and credit risk, the chance that any fund holding could have its credit rating downgraded or that a bond issuer will default (fail to make timely payments of interest or principal), potentially reducing the fund’s income level and share price. High yield corporate bonds could have greater price declines than funds that invest primarily in high-quality bonds. Companies issuing high yield bonds are not as strong financially as those with higher credit ratings, so the bonds are usually considered speculative investments.
Funds that invest overseas may carry more risk than funds that invest strictly in U.S. assets. Risks can result from varying stages of economic and political development; differing regulatory environments, trading days, and accounting standards; and higher transaction costs of non-U.S. markets. Non-U.S. investments are also subject to currency risk, or a decline in the value of a foreign currency versus the U.S. dollar, which reduces the dollar value of securities denominated in that currency.
GLOSSARY
Barclays U.S. Aggregate Bond Index: An unmanaged index that tracks investment-grade bonds, including corporate, government, and mortgage-backed securities.
Barclays Global Aggregate ex U.S. Dollar Bond Index: Tracks the performance of government, corporate, agency, and mortgage-related bonds in Europe, the Asia-Pacific region, and Canada.
Citigroup 3-Month Treasury Bill Index: An unmanaged index that tracks short-term U.S. government debt instruments.
Combined index portfolios: Unmanaged portfolios composed of the following underlying indexes as of November 30, 2012:
- Personal Strategy Income—40% stocks (28% Russell 3000 Index, 12% MSCI All Country World Index ex USA), 40% bonds (Barclays U.S. Aggregate Bond Index), and 20% money market securities (Citigroup 3-Month Treasury Bill Index).
- Personal Strategy Balanced—60% stocks (42% Russell 3000 Index, 18% MSCI All Country World Index ex USA), 30% bonds (Barclays U.S. Aggregate Bond Index), and 10% money market securities (Citigroup 3-Month Treasury Bill Index).
- Personal Strategy Growth—80% stocks (56% Russell 3000 Index, 24% MSCI All Country World Index ex USA) and 20% bonds (Barclays U.S. Aggregate Bond Index).
Credit Suisse High Yield Index: Tracks the performance of domestic noninvestment-grade corporate bonds.
Lipper Mixed-Asset Target Allocation Conservative Funds Index: A peer group benchmark that measures the performance of similar funds with a mix of between 20% and 40% equities, with the remainder invested in bonds and short-term investments.
Lipper Mixed-Asset Target Allocation Growth Funds Index: A peer group benchmark that measures the performance of similar funds with a mix of between 60% and 80% equities, with the remainder invested in bonds and short-term investments.
Lipper Mixed-Asset Target Allocation Moderate Funds Index: A peer group benchmark that measures the performance of similar funds with a mix of between 40% and 60% equities, with the remainder invested in bonds and short-term investments.
Morningstar Moderate Target Risk Index: Represents a portfolio of global equities (fixed at 60%), bonds, and other asset classes.
Morningstar Moderately Aggressive Target Risk Index: Represents a portfolio of global equities (fixed at 80%), bonds, and other asset classes.
Morningstar Moderately Conservative Target Risk Index: Represents a portfolio of global equities (fixed at 40%), bonds, and other asset classes.
MSCI All Country World Index ex USA: An index that measures equity market performance of developed and emerging countries, excluding the U.S.
MSCI Emerging Markets Index: A capitalization-weighted index of stocks from 26 emerging market countries that only includes securities that may be traded by foreign investors.
Russell 3000 Index: An index that tracks the performance of the 3,000 largest U.S. companies, representing approximately 98% of the investable U.S. equity market.
S&P 500 Index: An index that tracks the stocks of 500 primarily large-cap U.S. companies.
Performance and Expenses
This chart shows the value of a hypothetical $10,000 investment in the fund over the past 10 fiscal year periods or since inception (for funds lacking 10-year records). The result is compared with benchmarks, which may include a broad-based market index and a peer group average or index. Market indexes do not include expenses, which are deducted from fund returns as well as mutual fund averages and indexes.
This chart shows the value of a hypothetical $10,000 investment in the fund over the past 10 fiscal year periods or since inception (for funds lacking 10-year records). The result is compared with benchmarks, which may include a broad-based market index and a peer group average or index. Market indexes do not include expenses, which are deducted from fund returns as well as mutual fund averages and indexes.


This chart shows the value of a hypothetical $10,000 investment in the fund over the past 10 fiscal year periods or since inception (for funds lacking 10-year records). The result is compared with benchmarks, which may include a broad-based market index and a peer group average or index. Market indexes do not include expenses, which are deducted from fund returns as well as mutual fund averages and indexes.
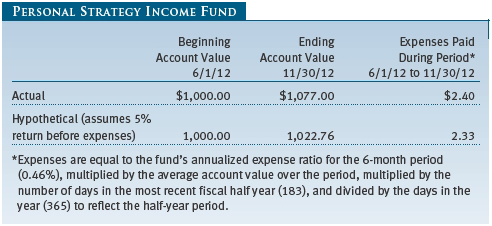
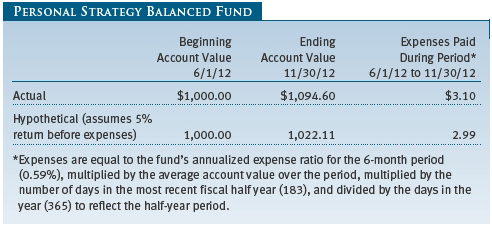
As a mutual fund shareholder, you may incur two types of costs: (1) transaction costs, such as redemption fees or sales loads, and (2) ongoing costs, including management fees, distribution and service (12b-1) fees, and other fund expenses. The following example is intended to help you understand your ongoing costs (in dollars) of investing in the fund and to compare these costs with the ongoing costs of investing in other mutual funds. The example is based on an investment of $1,000 invested at the beginning of the most recent six-month period and held for the entire period.
Actual Expenses
The first line of the following table (Actual) provides information about actual account values and expenses based on the fund’s actual returns. You may use the information on this line, together with your account balance, to estimate the expenses that you paid over the period. Simply divide your account value by $1,000 (for example, an $8,600 account value divided by $1,000 = 8.6), then multiply the result by the number on the first line under the heading “Expenses Paid During Period” to estimate the expenses you paid on your account during this period.
Hypothetical Example for Comparison Purposes
The information on the second line of the table (Hypothetical) is based on hypothetical account values and expenses derived from the fund’s actual expense ratio and an assumed 5% per year rate of return before expenses (not the fund’s actual return). You may compare the ongoing costs of investing in the fund with other funds by contrasting this 5% hypothetical example and the 5% hypothetical examples that appear in the shareholder reports of the other funds. The hypothetical account values and expenses may not be used to estimate the actual ending account balance or expenses you paid for the period.
Note: T. Rowe Price charges an annual account service fee of $20, generally for accounts with less than $10,000. The fee is waived for any investor whose T. Rowe Price mutual fund accounts total $50,000 or more; accounts electing to receive electronic delivery of account statements, transaction confirmations, prospectuses, and shareholder reports; or accounts of an investor who is a T. Rowe Price Preferred Services, Personal Services, or Enhanced Personal Services client (enrollment in these programs generally requires T. Rowe Price assets of at least $100,000). This fee is not included in the accompanying table. If you are subject to the fee, keep it in mind when you are estimating the ongoing expenses of investing in the fund and when comparing the expenses of this fund with other funds.
You should also be aware that the expenses shown in the table highlight only your ongoing costs and do not reflect any transaction costs, such as redemption fees or sales loads. Therefore, the second line of the table is useful in comparing ongoing costs only and will not help you determine the relative total costs of owning different funds. To the extent a fund charges transaction costs, however, the total cost of owning that fund is higher.


Unaudited
The accompanying notes are an integral part of these financial statements.
Unaudited


The accompanying notes are an integral part of these financial statements.
Unaudited
The accompanying notes are an integral part of these financial statements.
Unaudited

The accompanying notes are an integral part of these financial statements.
Unaudited
The accompanying notes are an integral part of these financial statements.
Unaudited
| Notes to Financial Statements |
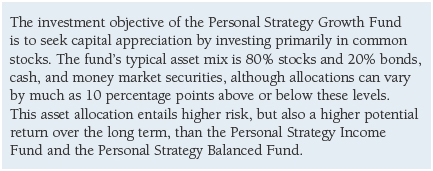
T. Rowe Price Personal Strategy Funds, Inc. (the corporation), is registered under the Investment Company Act of 1940 (the 1940 Act). The Personal Strategy Growth Fund (the fund) is a diversified, open-end management investment company established by the corporation. The fund commenced operations on July 29, 1994. The fund seeks the highest total return over time consistent with a primary emphasis on capital growth and a secondary emphasis on income. The fund pursues this objective by investing in a diversified portfolio typically consisting of approximately 80% stocks and 20% bonds and money market securities.
NOTE 1 - SIGNIFICANT ACCOUNTING POLICIES
Basis of Preparation The accompanying financial statements were prepared in accordance with accounting principles generally accepted in the United States of America (GAAP), which require the use of estimates made by management. Management believes that estimates and valuations are appropriate; however, actual results may differ from those estimates, and the valuations reflected in the accompanying financial statements may differ from the value ultimately realized upon sale or maturity.
Investment Transactions, Investment Income, and Distributions Income and expenses are recorded on the accrual basis. Premiums and discounts on debt securities are amortized for financial reporting purposes. Paydown gains and losses are recorded as an adjustment to interest income. Inflation adjustments to the principal amount of inflation-indexed bonds are reflected as interest income. Dividends received from mutual fund investments are reflected as dividend income; capital gain distributions are reflected as realized gain/loss. Earnings on investments recognized as partnerships for federal income tax purposes reflect the tax character of such earnings. Dividend income and capital gain distributions are recorded on the ex-dividend date. Income tax-related interest and penalties, if incurred, would be recorded as income tax expense. Investment transactions are accounted for on the trade date. Realized gains and losses are reported on the identified cost basis. Distributions to shareholders are recorded on the ex-dividend date. Income distributions are declared and paid quarterly. Capital gain distributions, if any, are generally declared and paid by the fund annually.
Currency Translation Assets, including investments, and liabilities denominated in foreign currencies are translated into U.S. dollar values each day at the prevailing exchange rate, using the mean of the bid and asked prices of such currencies against U.S. dollars as quoted by a major bank. Purchases and sales of securities, income, and expenses are translated into U.S. dollars at the prevailing exchange rate on the date of the transaction. The effect of changes in foreign currency exchange rates on realized and unrealized security gains and losses is reflected as a component of security gains and losses.
Rebates and Credits Subject to best execution, the fund may direct certain security trades to brokers who have agreed to rebate a portion of the related brokerage commission to the fund in cash. Commission rebates are reflected as realized gain on securities in the accompanying financial statements and totaled $6,000 for the six months ended November 30, 2012. Additionally, the fund earns credits on temporarily uninvested cash balances held at the custodian, which reduce the fund’s custody charges. Custody expense in the accompanying financial statements is presented before reduction for credits.
New Accounting Pronouncements In May 2011, the Financial Accounting Standards Board (FASB) issued amended guidance to align fair value measurement and disclosure requirements in U.S. GAAP with International Financial Reporting Standards. The guidance is effective for fiscal years and interim periods beginning on or after December 15, 2011. Adoption had no effect on net assets or results of operations.
In December 2011, the FASB issued amended guidance to enhance disclosure for offsetting assets and liabilities. The guidance is effective for fiscal years and interim periods beginning on or after January 1, 2013. Adoption will have no effect on the fund’s net assets or results of operations.
NOTE 2 - VALUATION
The fund’s financial instruments are reported at fair value as defined by GAAP. The fund determines the values of its assets and liabilities and computes its net asset value per share at the close of the New York Stock Exchange (NYSE), normally 4 p.m. ET, each day that the NYSE is open for business.
Valuation Methods Equity securities listed or regularly traded on a securities exchange or in the over-the-counter (OTC) market are valued at the last quoted sale price or, for certain markets, the official closing price at the time the valuations are made, except for OTC Bulletin Board securities, which are valued at the mean of the latest bid and asked prices. A security that is listed or traded on more than one exchange is valued at the quotation on the exchange determined to be the primary market for such security. Listed securities not traded on a particular day are valued at the mean of the latest bid and asked prices for domestic securities and the last quoted sale price for international securities.
Debt securities are generally traded in the OTC market. Securities with remaining maturities of one year or more at the time of acquisition are valued at prices furnished by dealers who make markets in such securities or by an independent pricing service, which considers the yield or price of bonds of comparable quality, coupon, maturity, and type, as well as prices quoted by dealers who make markets in such securities. Securities with remaining maturities of less than one year at the time of acquisition generally use amortized cost in local currency to approximate fair value. However, if amortized cost is deemed not to reflect fair value or the fund holds a significant amount of such securities with remaining maturities of more than 60 days, the securities are valued at prices furnished by dealers who make markets in such securities or by an independent pricing service.
Investments in mutual funds are valued at the mutual fund’s closing net asset value per share on the day of valuation. Financial futures contracts are valued at closing settlement prices. Swaps are valued at prices furnished by independent swap dealers or by an independent pricing service.
Other investments, including restricted securities and private placements, and those financial instruments for which the above valuation procedures are inappropriate or are deemed not to reflect fair value, are stated at fair value as determined in good faith by the T. Rowe Price Valuation Committee, established by the fund’s Board of Directors (the Board). Subject to oversight by the Board, the Valuation Committee develops pricing-related policies and procedures and approves all fair-value determinations. The Valuation Committee regularly makes good faith judgments, using a wide variety of sources and information, to establish and adjust valuations of certain securities as events occur and circumstances warrant. For instance, in determining the fair value of private-equity instruments, the Valuation Committee considers a variety of factors, including the company’s business prospects, its financial performance, strategic events impacting the company, relevant valuations of similar companies, new rounds of financing, and any negotiated transactions of significant size between other investors in the company. Because any fair-value determination involves a significant amount of judgment, there is a degree of subjectivity inherent in such pricing decisions.
For valuation purposes, the last quoted prices of non-U.S. equity securities may be adjusted under the circumstances described below. If the fund determines that developments between the close of a foreign market and the close of the NYSE will, in its judgment, materially affect the value of some or all of its portfolio securities, the fund will adjust the previous closing prices to reflect what it believes to be the fair value of the securities as of the close of the NYSE. In deciding whether it is necessary to adjust closing prices to reflect fair value, the fund reviews a variety of factors, including developments in foreign markets, the performance of U.S. securities markets, and the performance of instruments trading in U.S. markets that represent foreign securities and baskets of foreign securities. A fund may also fair value securities in other situations, such as when a particular foreign market is closed but the fund is open. The fund uses outside pricing services to provide it with closing prices and information to evaluate and/or adjust those prices. The fund cannot predict how often it will use closing prices and how often it will determine it necessary to adjust those prices to reflect fair value. As a means of evaluating its security valuation process, the fund routinely compares closing prices, the next day’s opening prices in the same markets, and adjusted prices. Additionally, trading in the underlying securities of the fund may take place in various foreign markets on certain days when the fund is not open for business and does not calculate a net asset value. As a result, net asset values may be significantly affected on days when shareholders cannot make transactions.
Valuation Inputs Various inputs are used to determine the value of the fund’s financial instruments. These inputs are summarized in the three broad levels listed below:
Level 1 – quoted prices in active markets for identical financial instruments
Level 2 – observable inputs other than Level 1 quoted prices (including, but not limited to, quoted prices for similar financial instruments, interest rates, prepayment speeds, and credit risk)
Level 3 – unobservable inputs
Observable inputs are those based on market data obtained from sources independent of the fund, and unobservable inputs reflect the fund’s own assumptions based on the best information available. The input levels are not necessarily an indication of the risk or liquidity associated with financial instruments at that level. For example, non-U.S. equity securities actively traded in foreign markets generally are reflected in Level 2 despite the availability of closing prices because the fund evaluates and determines whether those closing prices reflect fair value at the close of the NYSE or require adjustment, as described above. The following table summarizes the fund’s financial instruments, based on the inputs used to determine their values on November 30, 2012:

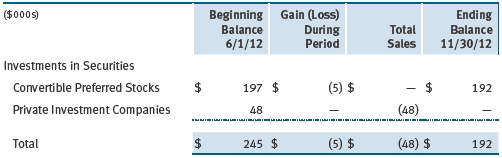
Following is a reconciliation of the fund’s Level 3 holdings for the six months ended November 30, 2012. Gain (loss) reflects both realized and change in unrealized gain (loss) on Level 3 holdings during the period, if any, and is included on the accompanying Statement of Operations. The change in unrealized gain (loss) on Level 3 instruments held at November 30, 2012, totaled $(5,000) for the six months ended November 30, 2012.
NOTE 3 - DERIVATIVE INSTRUMENTS
During the six months ended November 30, 2012, the fund invested in derivative instruments. As defined by GAAP, a derivative is a financial instrument whose value is derived from an underlying security price, foreign exchange rate, interest rate, index of prices or rates, or other variable; it requires little or no initial investment and permits or requires net settlement. The fund invests in derivatives only if the expected risks and rewards are consistent with its investment objectives, policies, and overall risk profile, as described in its prospectus and Statement of Additional Information. The fund may use derivatives for a variety of purposes, such as seeking to hedge against declines in principal value, increase yield, invest in an asset with greater efficiency and at a lower cost than is possible through direct investment, or to adjust credit exposure. The risks associated with the use of derivatives are different from, and potentially much greater than, the risks associated with investing directly in the instruments on which the derivatives are based. Investments in derivatives can magnify returns positively or negatively; however, the fund at all times maintains sufficient cash reserves, liquid assets, or other SEC-permitted asset types to cover the settlement obligations under its open derivative contracts.
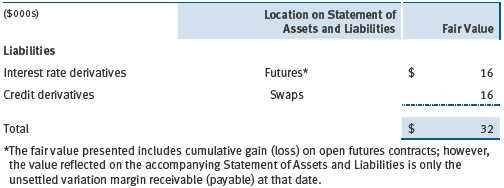
The fund values its derivatives at fair value, as described below and in Note 2, and recognizes changes in fair value currently in its results of operations. Accordingly, the fund does not follow hedge accounting, even for derivatives employed as economic hedges. The fund does not offset the fair value of derivative instruments against the right to reclaim or obligation to return collateral. The following table summarizes the fair value of the fund’s derivative instruments held as of November 30, 2012, and the related location on the accompanying Statement of Assets and Liabilities, presented by primary underlying risk exposure:
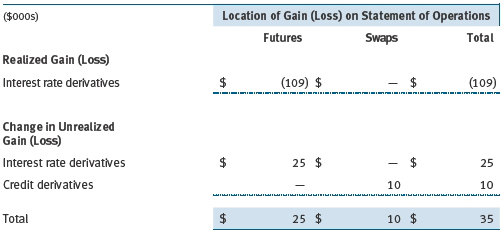
Additionally, the amount of gains and losses on derivative instruments recognized in fund earnings during the six months ended November 30, 2012, and the related location on the accompanying Statement of Operations is summarized in the following table by primary underlying risk exposure:
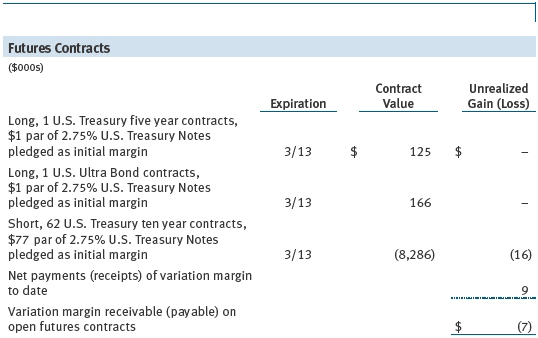
Futures Contracts The fund is subject to interest rate risk in the normal course of pursuing its investment objectives and uses futures contracts to help manage such risk. The fund may enter into futures contracts to manage exposure to interest rates, security prices, foreign currencies, and credit quality; as an efficient means of adjusting exposure to all or part of a target market; to enhance income; as a cash management tool; and/or to adjust credit exposure. A futures contract provides for the future sale by one party and purchase by another of a specified amount of a particular underlying financial instrument at an agreed-upon price, date, time, and place. The fund currently invests only in exchange-traded futures, which generally are standardized as to maturity date, underlying financial instrument, and other contract terms. Upon entering into a futures contract, the fund is required to deposit collateral with the broker in the form of cash or securities in an amount equal to a certain percentage of the contract value (margin requirement); the margin requirement must then be maintained at the established level over the life of the contract. Subsequent payments are made or received by the fund each day to settle daily fluctuations in the value of the contract (variation margin), which reflect changes in the value of the underlying financial instrument. Variation margin is recorded as unrealized gain or loss until the contract is closed. The value of a futures contract included in net assets is the amount of unsettled variation margin; net variation margin receivable is reflected as an asset, and net variation margin payable is reflected as a liability on the accompanying Statement of Assets and Liabilities. Risks related to the use of futures contracts include possible illiquidity of the futures markets, contract prices that can be highly volatile and imperfectly correlated to movements in hedged security values and/or interest rates, and potential losses in excess of the fund’s initial investment. During the six months ended November 30, 2012, the fund’s exposure to futures, based on underlying notional amounts, was generally less than 1% of net assets.
Credit Default Swaps The fund is subject to credit risk in the normal course of pursuing its investment objectives and uses swap contracts to help manage such risk. The fund may use swaps in an effort to manage exposure to changes in interest rates, inflation rates, and credit quality; to adjust overall exposure to certain markets; to enhance total return or protect the value of portfolio securities; to serve as a cash management tool; and/or to adjust portfolio duration or credit exposure. Credit default swaps are agreements where one party (the protection buyer) agrees to make periodic payments to another party (the protection seller) in exchange for protection against specified credit events, such as certain defaults and bankruptcies related to an underlying credit instrument, or issuer or index of such instruments. Upon occurrence of a specified credit event, the protection seller is required to pay the buyer the difference between the notional amount of the swap and the value of the underlying credit, either in the form of a net cash settlement or by paying the gross notional amount and accepting delivery of the relevant underlying credit. For credit default swaps where the underlying credit is an index, a specified credit event may affect all or individual underlying securities included in the index and will be settled based upon the relative weighting of the affected underlying security(s) within the index. Generally, the payment risk for the seller of protection is inversely related to the current market price and/or credit rating of the underlying credit, both of which are indicators of market valuations of credit quality. Therefore, payment risk increases as the price of the relevant underlying credit and/or credit rating declines. Generally payment risk increases as the market value of a swap contract declines in relation to the notional amount. As of November 30, 2012, the notional amount of protection sold by the fund totaled $350,000 (0.0% of net assets), which reflects the maximum potential amount the fund could be required to pay under such contracts. The value of a swap included in net assets is the unrealized gain or loss on the contract plus or minus any unamortized premiums paid or received, respectively. Appreciated swaps and premiums paid are reflected as assets, and depreciated swaps and premiums received are reflected as liabilities on the accompanying Statement of Assets and Liabilities. Net periodic receipts or payments required by swaps are accrued daily and are recorded as realized gain or loss for financial reporting purposes when settled; fluctuations in the fair value of swaps are reflected in the change in net unrealized gain or loss and are reclassified to realized gain or loss upon termination prior to maturity or cash settlement. Risks related to the use of credit default swaps include the possible inability of the fund to accurately assess the current and future creditworthiness of underlying issuers, the possible failure of a counterparty to perform in accordance with the terms of the swap agreements, potential government regulation that could adversely affect the fund’s swap investments, and potential losses in excess of the fund’s initial investment. During the six months ended November 30, 2012, the fund’s exposure to swaps, based on underlying notional amounts, was generally less than 1% of net assets.
NOTE 4 - OTHER INVESTMENT TRANSACTIONS
Consistent with its investment objective, the fund engages in the following practices to manage exposure to certain risks and/or to enhance performance. The investment objective, policies, program, and risk factors of the fund are described more fully in the fund’s prospectus and Statement of Additional Information.
Restricted Securities The fund may invest in securities that are subject to legal or contractual restrictions on resale. Prompt sale of such securities at an acceptable price may be difficult and may involve substantial delays and additional costs.
Repurchase Agreements All repurchase agreements are fully collateralized by U.S. government securities. Collateral is in the possession of the fund’s custodian or, for tri-party agreements, the custodian designated by the agreement. Collateral is evaluated daily to ensure that its market value exceeds the delivery value of the repurchase agreements at maturity. Although risk is mitigated by the collateral, the fund could experience a delay in recovering its value and a possible loss of income or value if the counterparty fails to perform in accordance with the terms of the agreement.
TBA Purchase and Sale Commitments During the six months ended November 30, 2012, the fund entered into to be announced (TBA) purchase and/or sale commitments, pursuant to which it agrees to purchase or sell, respectively, mortgage-backed securities for a fixed unit price, with payment and delivery at a scheduled future date beyond the customary settlement period for such mortgage-backed securities. With TBA transactions, the particular securities to be delivered are not identified at the trade date; however, delivered securities must meet specified terms, including issuer, rate, and mortgage term, and be within industry-accepted “good delivery” standards. The fund generally enters into TBA purchase transactions with the intention of taking possession of the underlying mortgage securities; however, for either purchase or sale transactions, the fund also may extend the settlement by “rolling” the transaction. Until settlement, the fund maintains cash reserves and liquid assets sufficient to settle its TBA commitments.
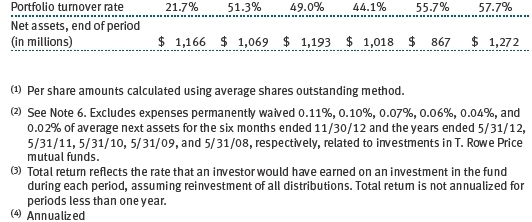
Securities Lending The fund lends its securities to approved brokers to earn additional income. It receives as collateral cash and U.S. government securities valued at 102% to 105% of the value of the securities on loan. Collateral is maintained over the life of the loan in an amount not less than the value of loaned securities as determined at the close of fund business each day; any additional collateral required due to changes in security values is delivered to the fund the next business day. Cash collateral is invested by the fund’s lending agent(s) in accordance with investment guidelines approved by management. Although risk is mitigated by the collateral, the fund could experience a delay in recovering its securities and a possible loss of income or value if the borrower fails to return the securities or if collateral investments decline in value. Securities lending revenue recognized by the fund consists of earnings on invested collateral and borrowing fees, net of any rebates to the borrower and compensation to the lending agent. In accordance with GAAP, investments made with cash collateral are reflected in the accompanying financial statements, but collateral received in the form of securities is not. At November 30, 2012, the value of loaned securities was $4,341,000; the value of cash collateral investments was $4,615,000.
Counterparty Risk and Collateral The fund has entered into collateral agreements with certain counterparties to mitigate counterparty risk associated with certain over-the-counter (OTC) financial instruments, including swaps, forward currency exchange contracts, TBA purchase commitments, and OTC options (collectively, covered OTC instruments). Subject to certain minimum exposure requirements (which typically range from $100,000 to $500,000), collateral requirements generally are determined and transfers made based on the net aggregate unrealized gain or loss on all OTC instruments covered by a particular collateral agreement with a specified counterparty. At any point in time, the fund’s risk of loss from counterparty credit risk on covered OTC instruments is the aggregate unrealized gain on appreciated covered OTC instruments in excess of collateral, if any, pledged by the counterparty to the fund. Further, in accordance with the terms of the relevant agreements, counterparties to certain OTC instruments may be able to terminate the contracts prior to maturity upon the occurrence of certain stated events, such as a decline in net assets above a certain percentage or a failure by the fund to perform its obligations under the contract. Upon termination, all transactions would typically be liquidated and a net amount would be owed by or payable to the fund.
Counterparty risk related to exchange-traded futures and options contracts is minimal because the exchange’s clearinghouse provides protection against counterparty defaults. Generally, for exchange-traded derivatives such as futures and options, each broker, in its sole discretion, may change margin requirements applicable to the fund.
Collateral can be in the form of cash or debt securities issued by the U.S. government or related agencies. For OTC instruments, collateral both pledged by the fund to a counterparty and pledged by a counterparty to the fund, is held in a segregated account by a third-party agent. For exchange-traded instruments, margin posted by the fund is held by the broker. Cash posted by the fund as collateral or to meet margin requirements is reflected as restricted cash in the accompanying financial statements and securities posted by the fund are so noted in the accompanying Portfolio of Investments; both remain in the fund’s assets. Collateral pledged by counterparties is not included in the fund’s assets because the fund does not obtain effective control over those assets. As of November 30, 2012, no collateral had been posted by the fund to counterparties for covered OTC instruments. As of November 30, 2012, no collateral was pledged by counterparties to the fund for covered OTC instruments. As of November 30, 2012, securities valued at $88,000 had been posted by the fund to the broker for exchange-traded derivatives.
Other Purchases and sales of portfolio securities other than short-term and U.S. government securities aggregated $178,128,000 and $199,041,000, respectively, for the six months ended November 30, 2012. Purchases and sales of U.S. government securities aggregated $65,062,000 and $52,510,000, respectively, for the six months ended November 30, 2012.
NOTE 5 - FEDERAL INCOME TAXES
No provision for federal income taxes is required since the fund intends to continue to qualify as a regulated investment company under Subchapter M of the Internal Revenue Code and distribute to shareholders all of its taxable income and gains. Distributions determined in accordance with federal income tax regulations may differ in amount or character from net investment income and realized gains for financial reporting purposes. Financial reporting records are adjusted for permanent book/tax differences to reflect tax character but are not adjusted for temporary differences. The amount and character of tax-basis distributions and composition of net assets are finalized at fiscal year-end; accordingly, tax-basis balances have not been determined as of the date of this report.
The fund intends to retain realized gains to the extent of available capital loss carryforwards. As a result of the Regulated Investment Company Modernization Act of 2010, net capital losses realized on or after June 1, 2011 (effective date) may be carried forward indefinitely to offset future realized capital gains; however, post-effective losses must be used before pre-effective capital loss carryforwards with expiration dates. Accordingly, it is possible that all or a portion of the fund’s pre-effective capital loss carryforwards could expire unused. As of May 31, 2012, the fund had $39,025,000 of available capital loss carryforwards, which expire as follows: $38,864,000 in fiscal 2018; $161,000 have no expiration.
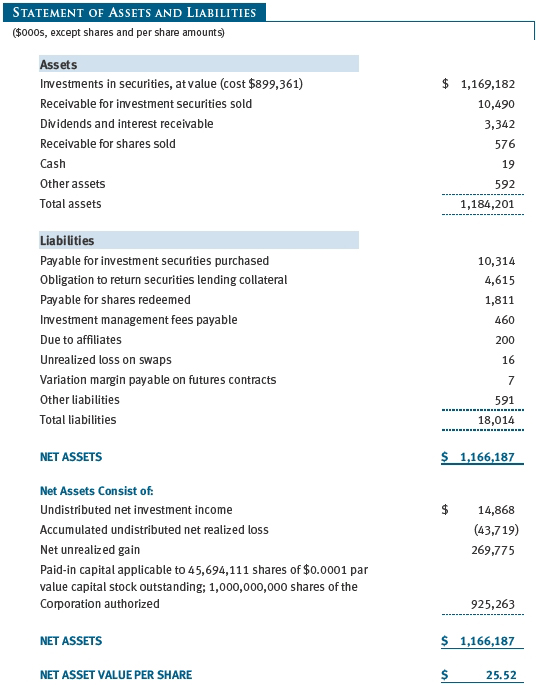
At November 30, 2012, the cost of investments for federal income tax purposes was $918,183,000. Net unrealized gain aggregated $250,953,000 at period-end, of which $291,025,000 related to appreciated investments and $40,072,000 related to depreciated investments.
NOTE 6 - RELATED PARTY TRANSACTIONS
The fund is managed by T. Rowe Price Associates, Inc. (Price Associates), a wholly owned subsidiary of T. Rowe Price Group, Inc. (Price Group). The investment management agreement between the fund and Price Associates provides for an annual investment management fee, which is computed daily and paid monthly. The fee consists of an individual fund fee, equal to 0.30% of the fund’s average daily net assets, and a group fee. The group fee rate is calculated based on the combined net assets of certain mutual funds sponsored by Price Associates (the group) applied to a graduated fee schedule, with rates ranging from 0.48% for the first $1 billion of assets to 0.28% for assets in excess of $300 billion. The fund’s group fee is determined by applying the group fee rate to the fund’s average daily net assets. At November 30, 2012, the effective annual group fee rate was 0.30%.
In addition, the fund has entered into service agreements with Price Associates and two wholly owned subsidiaries of Price Associates (collectively, Price). Price Associates computes the daily share price and provides certain other administrative services to the fund. T. Rowe Price Services, Inc., provides shareholder and administrative services in its capacity as the fund’s transfer and dividend disbursing agent. T. Rowe Price Retirement Plan Services, Inc., provides subaccounting and recordkeeping services for certain retirement accounts invested in the fund. For the six months ended November 30, 2012, expenses incurred pursuant to these service agreements were $95,000 for Price Associates; $250,000 for T. Rowe Price Services, Inc.; and $230,000 for T. Rowe Price Retirement Plan Services, Inc. The total amount payable at period-end pursuant to these service agreements is reflected as Due to Affiliates in the accompanying financial statements.
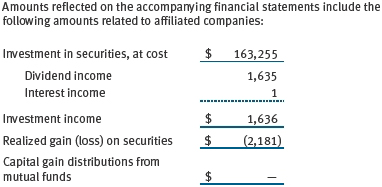
The fund may invest in the T. Rowe Price Reserve Investment Fund and the T. Rowe Price Government Reserve Investment Fund (collectively, the T. Rowe Price Reserve Investment Funds), open-end management investment companies managed by Price Associates and considered affiliates of the fund. The T. Rowe Price Reserve Investment Funds are offered as cash management options to mutual funds, trusts, and other accounts managed by Price Associates and/or its affiliates and are not available for direct purchase by members of the public. The T. Rowe Price Reserve Investment Funds pay no investment management fees.
The fund may also invest in certain T. Rowe Price institutional funds and/or the T. Rowe Price Real Assets Fund (collectively, the underlying institutional funds) as a means of gaining efficient and cost-effective exposure to certain markets. The underlying institutional funds are open-end management investment companies managed by Price Associates and are considered affiliates of the fund. Each institutional fund pays an all-inclusive management and administrative fee to Price Associates; Real Assets Fund pays a management fee to Price Associates as well as operating expenses. To ensure that the fund does not incur duplicate management fees, Price Associates has agreed to permanently waive a portion of its management fee charged to the fund in an amount sufficient to fully offset the management fees paid by the underlying institutional funds related to fund assets invested therein. Accordingly, the accompanying Statement of Operations includes management fees permanently waived pursuant to this agreement. Annual fee rates and amounts waived within the accompanying Statement of Operations related to shares of the underlying institutional funds for the six months ended November 30, 2012, are as follows:

| Information on Proxy Voting Policies, Procedures, and Records |
A description of the policies and procedures used by T. Rowe Price funds and portfolios to determine how to vote proxies relating to portfolio securities is available in each fund’s Statement of Additional Information, which you may request by calling 1-800-225-5132 or by accessing the SEC’s website, sec.gov. The description of our proxy voting policies and procedures is also available on our website, troweprice.com. To access it, click on the words “Our Company” at the top of our corporate homepage. Then, when the next page appears, click on the words “Proxy Voting Policies” on the left side of the page.
Each fund’s most recent annual proxy voting record is available on our website and through the SEC’s website. To access it through our website, follow the directions above, then click on the words “Proxy Voting Records” on the right side of the Proxy Voting Policies page.
| How to Obtain Quarterly Portfolio Holdings |
The fund files a complete schedule of portfolio holdings with the Securities and Exchange Commission for the first and third quarters of each fiscal year on Form N-Q. The fund’s Form N-Q is available electronically on the SEC’s website (sec.gov); hard copies may be reviewed and copied at the SEC’s Public Reference Room, 100 F St. N.E., Washington, DC 20549. For more information on the Public Reference Room, call 1-800-SEC-0330.
Item 2. Code of Ethics.
A code of ethics, as defined in Item 2 of Form N-CSR, applicable to its principal executive officer, principal financial officer, principal accounting officer or controller, or persons performing similar functions is filed as an exhibit to the registrant’s annual Form N-CSR. No substantive amendments were approved or waivers were granted to this code of ethics during the registrant’s most recent fiscal half-year.
Item 3. Audit Committee Financial Expert.
Disclosure required in registrant’s annual Form N-CSR.
Item 4. Principal Accountant Fees and Services.
Disclosure required in registrant’s annual Form N-CSR.
Item 5. Audit Committee of Listed Registrants.
Not applicable.
Item 6. Investments.
(a) Not applicable. The complete schedule of investments is included in Item 1 of this Form N-CSR.
(b) Not applicable.
Item 7. Disclosure of Proxy Voting Policies and Procedures for Closed-End Management Investment Companies.
Not applicable.
Item 8. Portfolio Managers of Closed-End Management Investment Companies.
Not applicable.
Item 9. Purchases of Equity Securities by Closed-End Management Investment Company and Affiliated Purchasers.
Not applicable.
Item 10. Submission of Matters to a Vote of Security Holders.
Not applicable.
Item 11. Controls and Procedures.
(a) The registrant’s principal executive officer and principal financial officer have evaluated the registrant’s disclosure controls and procedures within 90 days of this filing and have concluded that the registrant’s disclosure controls and procedures were effective, as of that date, in ensuring that information required to be disclosed by the registrant in this Form N-CSR was recorded, processed, summarized, and reported timely.
(b) The registrant’s principal executive officer and principal financial officer are aware of no change in the registrant’s internal control over financial reporting that occurred during the registrant’s second fiscal quarter covered by this report that has materially affected, or is reasonably likely to materially affect, the registrant’s internal control over financial reporting.
Item 12. Exhibits.
(a)(1) The registrant’s code of ethics pursuant to Item 2 of Form N-CSR is filed with the registrant’s annual Form N-CSR.
(2) Separate certifications by the registrant's principal executive officer and principal financial officer, pursuant to Section 302 of the Sarbanes-Oxley Act of 2002 and required by Rule 30a-2(a) under the Investment Company Act of 1940, are attached.
(3) Written solicitation to repurchase securities issued by closed-end companies: not applicable.
(b) A certification by the registrant's principal executive officer and principal financial officer, pursuant to Section 906 of the Sarbanes-Oxley Act of 2002 and required by Rule 30a-2(b) under the Investment Company Act of 1940, is attached.
SIGNATURES
Pursuant to the requirements of the Securities Exchange Act of 1934 and the Investment Company Act of 1940, the registrant has duly caused this report to be signed on its behalf by the undersigned, thereunto duly authorized.
T. Rowe Price Personal Strategy Funds, Inc.
| By | /s/ Edward C. Bernard |
| | Edward C. Bernard |
| | Principal Executive Officer |
| | |
| Date January 23, 2013 | | |
Pursuant to the requirements of the Securities Exchange Act of 1934 and the Investment Company Act of 1940, this report has been signed below by the following persons on behalf of the registrant and in the capacities and on the dates indicated.
| By | /s/ Edward C. Bernard |
| | Edward C. Bernard |
| | Principal Executive Officer |
| | |
| Date January 23, 2013 | | |
| | |
| | |
| By | /s/ Gregory K. Hinkle |
| | Gregory K. Hinkle |
| | Principal Financial Officer |
| | |
| Date January 23, 2013 | | |