UNITED STATES
SECURITIES AND EXCHANGE COMMISSION
Washington, D.C. 20549
FORM N-CSR
CERTIFIED SHAREHOLDER REPORT OF REGISTERED
MANAGEMENT INVESTMENT COMPANIES
Investment Company Act File Number: 811-07173
| T. Rowe Price Personal Strategy Funds, Inc. |
| (Exact name of registrant as specified in charter) |
| 100 East Pratt Street, Baltimore, MD 21202 |
| (Address of principal executive offices) |
| David Oestreicher |
| 100 East Pratt Street, Baltimore, MD 21202 |
| (Name and address of agent for service) |
Registrant’s telephone number, including area code: (410) 345-2000
Date of fiscal year end: May 31
Date of reporting period: May 31, 2015
Item 1. Report to Shareholders
 |
| Personal Strategy Growth Fund | May 31, 2015 |
The views and opinions in this report were current as of May 31, 2015. They are not guarantees of performance or investment results and should not be taken as investment advice. Investment decisions reflect a variety of factors, and the managers reserve the right to change their views about individual stocks, sectors, and the markets at any time. As a result, the views expressed should not be relied upon as a forecast of the fund’s future investment intent. The report is certified under the Sarbanes-Oxley Act, which requires mutual funds and other public companies to affirm that, to the best of their knowledge, the information in their financial reports is fairly and accurately stated in all material respects.
REPORTS ON THE WEB
Sign up for our E-mail Program, and you can begin to receive updated fund reports and prospectuses online rather than through the mail. Log in to your account at troweprice.com for more information.
Manager’s Letter
Fellow Shareholders
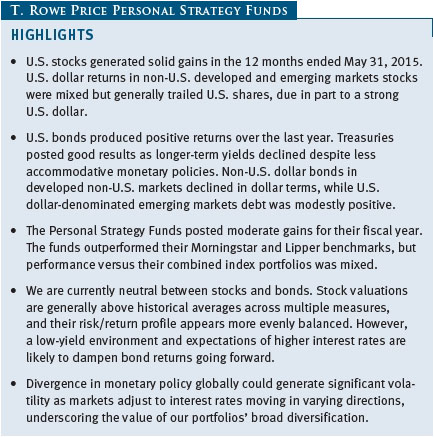
U.S. stocks posted solid gains in the 12 months ended May 31, 2015, as optimism about a gradually improving U.S. economy and monetary stimulus overseas overrode concerns about impending interest rate hikes, a stronger dollar, and disappointing economic growth in early 2015. Stocks in overseas developed markets recorded good returns in local currency terms, but a stronger U.S. dollar erased much of the gains for U.S. investors. Emerging markets stocks significantly lagged U.S. shares as geopolitical tensions, lower commodity prices, and currency weakness weighed on various markets. Domestic investment-grade bonds produced modest gains over the last year as longer-term Treasury yields declined but rebounded somewhat from their lowest levels. In addition, interest rate volatility has increased. High yield bonds lagged higher-quality issues as the steep drop in oil prices weighed on the profits of energy companies that make up a large segment of the below investment-grade market. Non-U.S. dollar bonds in developed non-U.S. markets declined in dollar terms, driven by the U.S. dollar’s strong appreciation versus most currencies. U.S. dollar-denominated emerging markets debt was modestly positive.
MARKET ENVIRONMENT
The U.S. economy contracted at an annualized rate of 0.7% in the first quarter of 2015, according to the most recent estimates. However, U.S. economic growth has been relatively strong over the last year compared with growth in other developed economies, such as Japan and across Europe. The first-quarter contraction was in part attributable to transitory factors, including harsh winter weather, a stronger dollar, a West Coast ports strike, and plunging oil prices in the second half of 2014. We believe the economy is bouncing back in the current quarter, as evidenced by increased consumer spending, a pickup in exports, greater business fixed investment outside of the oil industry, and solid jobs and income growth.
U.S. stocks generated solid gains for the 12-month period. There were periods of heightened volatility, however, amid concerns about sluggish global growth, geopolitical tensions in Ukraine and the Middle East, as well as the prospective timing of the Federal Reserve’s (Fed) initial move to raise short-term U.S. interest rates. The U.S. dollar strengthened considerably against most other currencies, which weighed on the earnings of U.S. companies that obtain a significant portion of their revenues from international operations. Much of the dollar strength stemmed from diverging monetary policies and growth trajectories between the U.S. and overseas economies, with the Fed poised to begin raising interest rates later in 2015 even as many other global central banks, including the European Central Bank (ECB) and the Bank of Japan (BoJ), implemented aggressive stimulus policies. An unfavorable global supply/demand imbalance driven by technological advances coupled with a weak global growth environment contributed to a sharp drop in prices for oil and other commodities, which weighed heavily on energy companies. As the period ended, the minutes from the Fed’s April policy meeting showed that a midyear rate “liftoff” is unlikely. Fed Chair Janet Yellen stated, however, that the central bank is still on track to begin raising rates in 2015, with a first rate hike expected by September.
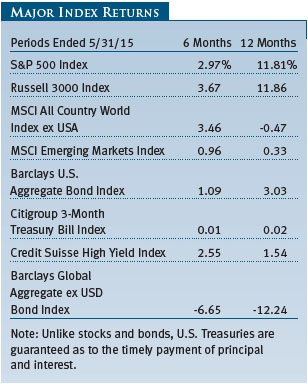
Stocks in developed non-U.S. markets were roughly flat overall and lagged U.S. shares, but underlying returns were mixed. Developed Asian markets were led by Hong Kong and Japan, both of which returned 16% in U.S. dollar terms. Hong Kong shares were lifted by strength in Chinese shares and Chinese stimulus measures, while Japan emerged from a tax-induced recession, thanks in part to the BoJ’s expanded quantitative easing (QE) measures, lower energy prices, and growth in corporate profits earned overseas due to a weaker yen. European markets recorded solid gains in local currency terms, but a nearly 20% decline in the euro versus the U.S. dollar over the past year resulted in losses in many eurozone markets in dollar terms. Markets were buoyed early in 2015 after the ECB initiated an aggressive QE program with plans to buy €60 billion of bonds per month through at least September 2016.
Emerging markets equities rose slightly overall in U.S. dollar terms over the last year. A few markets generated good gains, but most emerging regions posted significant losses. In Asia, however, Chinese stocks surged higher, with the Philippines, Taiwan, and India also recording gains. In Latin America, Brazilian equities plunged 28% in dollar terms amid investors’ disappointment at the reelection of President Dilma Rousseff, economic and currency weakness, and a corruption scandal at a large state-owned energy company. Among emerging European markets, shares in Russia and Turkey posted steep losses. Several emerging and frontier markets in the Middle East fell sharply due to lower oil prices.

U.S. bonds produced positive returns over the last year. Treasuries posted good results as longer-term yields declined despite the Federal Reserve curtailing its asset purchases in 2014 and concluding them in October. Agency mortgage-backed and municipal securities also recorded decent gains. High yield bonds trailed investment-grade issues and experienced selling pressure in late 2014 as falling oil prices reduced profits of companies in the energy sector, the largest segment of the high yield market. The asset class has performed well in 2015, however, supported by a bounce in oil prices, moderate levels of new issuance, and lower sensitivity to the anticipation of rising interest rates than investment-grade securities. Non-U.S. dollar bonds in developed non-U.S. markets declined in dollar terms, driven by the U.S. dollar’s strong appreciation versus most currencies, which outstripped the component of returns from the overall decline of yields in key government bond markets. U.S. dollar-denominated emerging markets debt was modestly positive.
PORTFOLIO REVIEW AND POSITIONING
Asset Allocation
The three Personal Strategy portfolios have the ability to overweight or underweight allocations to asset classes or sub-asset classes based on the views of the T. Rowe Price Asset Allocation Committee. The committee generally meets on a monthly basis to evaluate economic, market, and earnings trends, among various factors, and looks for opportunities over a 6- to 18-month investment horizon. Characteristically, we will seek to overweight segments of the market we believe are attractively valued and underweight those parts of the market that are more richly valued.
Early in the funds’ fiscal year, we moved to a neutral allocation profile between stocks and bonds and maintained that position for the remainder of the reporting period. Equity markets have trended higher even as earnings growth has moderated, resulting in valuations that are above historical averages. The near-term risk/return profile for equities is becoming less favorable, with limited expected upside support from earnings growth and with margins at peak levels. However, underlying fundamentals remain solid, and improving economic growth should support equities. We expect modest returns from bonds as the current low-yield environment offers a weak foundation, and rising interest rates should be a headwind once rates begin to rise. However, we expect that a rise in U.S. interest rates may be limited by increased demand as U.S. yields remain among the highest across developed markets. We expect monetary policy to remain accommodative for some time to come as global central banks seek to support growth, which should moderate downside risks to bonds.
Stocks
We increased our overweight to non-U.S. equities versus U.S. stocks as valuations for overseas stocks look modestly more attractive than domestic shares. Non-U.S. economies and companies should benefit from aggressive central bank stimulus programs and weaker currencies versus the U.S. dollar. Earnings and profit margins in Europe remain well below pre-financial crisis levels compared with the U.S., where earnings and margins are at or near peak levels. We favor emerging markets equities over developed markets stocks. Emerging markets valuations are attractive overall, but conditions vary by country as low commodity prices hurt commodity exporters and helped resource-hungry importers. Slower global economic growth and prospects for higher U.S. interest rates remain near-term risks. We are overweight global equities relative to real assets stocks. Improved drilling technologies and increased production capacity have raised energy supplies, while slower global economic growth has dampened aggregate demand expectations and weighed on global oil prices. Rising real interest rates could present a headwind for real assets, as real assets-related equities typically underperform broader equities when nominal rates rise and inflation remains low or declines. Fundamentals for real estate are favorable, and the sector may benefit from improving economic environments supported by lower energy prices. However, valuations for real estate remain rich, and the sector remains sensitive to rising rates.
In the U.S., we favor growth stocks over value; however, we have moderated the overweight allocation over the last 12 months. A slow-growth economy often benefits growth stocks more than value stocks as growth companies tend to rely less on a strong economy to increase corporate earnings. However, steady improvement in the U.S. recovery has tempered our view somewhat. We are overweight U.S. large-cap stocks versus small-caps as the latter remain richly priced compared with their large-cap peers. Outside the U.S., we remain overweight to value stocks as share prices are attractive in value-oriented sectors, such as European financials that should benefit from improving economic and credit growth. Further, we see greater potential for a broad improvement in earnings and margins, which remain well below their 2007 peaks in Europe. Both Japan and Europe are in earlier stages of recovery versus the U.S., and more cyclical, value-oriented sectors may benefit as these economies are supported by aggressive monetary easing and more competitive currencies.
Bonds
Our fixed income allocation generated modest gains for the past 12 months but lagged the benchmark Barclays U.S. Aggregate Bond Index. Allocations to diversifying sectors, which are not included in the Barclays benchmark, detracted from results. Non-U.S. developed markets debt was particularly weak due to the stronger U.S. dollar. Our high yield and emerging markets debt registered moderate gains but underperformed the Barclays index.
We slightly increased our overweight to high yield bonds relative to investment-grade debt, as the high yield market features better yields, a lower duration profile, and less sensitivity to rising interest rates. Many high yield issuers have improved their financial condition significantly since the 2008 global financial crisis, taking advantage of low interest rates to refinance debt and extend maturities. However, we are mindful that low commodity prices are challenging energy and commodity-related high yield issuers, which represent a significant portion of the market. While overall default rates may trend higher, they remain low compared with historical averages. Continued strength in merger and acquisition (M&A) activity may provide support to select issuers.
We moved between overweight and neutral allocations to emerging markets debt versus U.S. investment-grade bonds during the fiscal year, but we recently trimmed our emerging markets exposure and now have a neutral position. Muted global economic growth, a strong dollar, and the start of Fed interest rate policy normalization remain near-term risks to emerging markets debt. While bond valuations have improved somewhat, emerging markets currencies remain notably undervalued. Considerable disparity exists in the strength of various developing economies, with the potential for declining commodity prices to further the divide. Lower commodity prices are a positive for many commodity importers by reducing inflation and providing policy flexibility, while commodity-exporting countries’ fiscal positions are vulnerable.
We continued to favor U.S. investment-grade debt over non-U.S. dollar-denominated debt. However, we reduced the size of our underweight to nondollar bonds as we believe the continued pace of U.S. dollar strength is limited. Despite recent dollar weakness after a significant rise since the third quarter of 2014, the U.S. dollar remains supported by the prospects for continued stronger growth and higher interest rates relative to other developed countries. Aggressive monetary stimulus measures by the ECB and BoJ to spur growth and inflation could provide catalysts for their currencies to decline even further relative to the dollar.
PERFORMANCE COMPARISON
Personal Strategy Income Fund

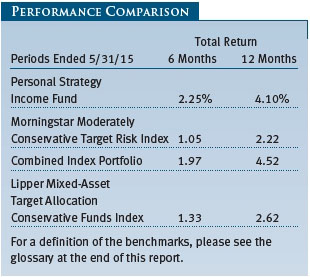
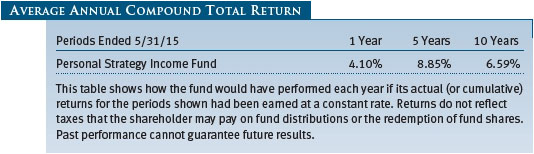
As shown in the Performance Comparison table, the Personal Strategy Income Fund returned 2.25% and 4.10% for the 6- and 12-month periods ended May 31, 2015, respectively. The fund outpaced its combined index portfolio for the six-month period but trailed for the 12-month period. The fund outperformed its Morningstar and Lipper peer group indexes for both periods.
Diversifying allocations to sectors not included in the fund’s broad fixed income benchmark (the Barclays U.S. Aggregate Bond Index) detracted from results for the 12-month period. In particular, our exposure to international developed markets debt weighed on performance as a stronger U.S. dollar punished the asset class. Our portfolio of real assets stocks also hurt results as oil and commodity prices plummeted. This was offset somewhat, however, by positive contributions from our U.S. and global real estate holdings.
Security selection was positive overall and benefited the fund’s performance versus its combined index portfolio over the past 12 months. Stock selection was particularly helpful, led by our U.S. large-cap growth and value shares as well as stocks in non-U.S. developed and emerging markets. Security selection in our investment-grade bond portfolio weighed on results, due largely to an underweight position in Treasuries, which performed well for the period. Our emerging markets debt holdings also hurt results, with positions in Russia, Ukraine, and Venezuela detracting.
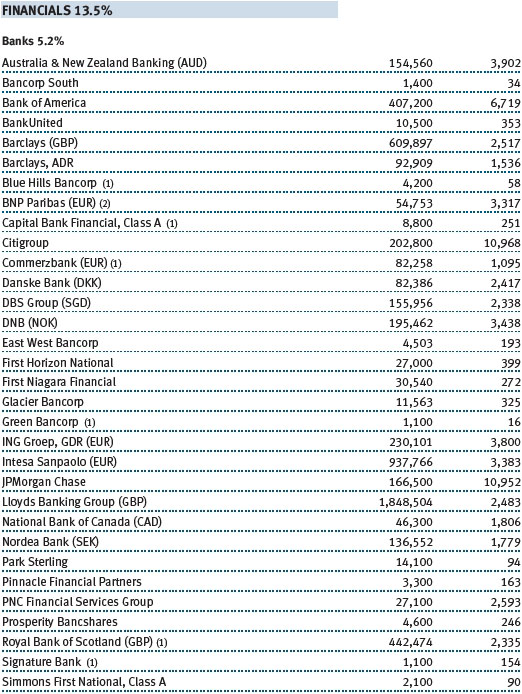
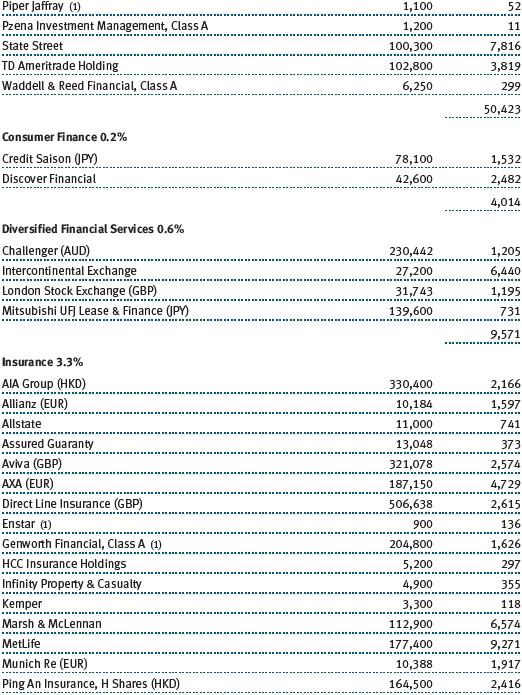
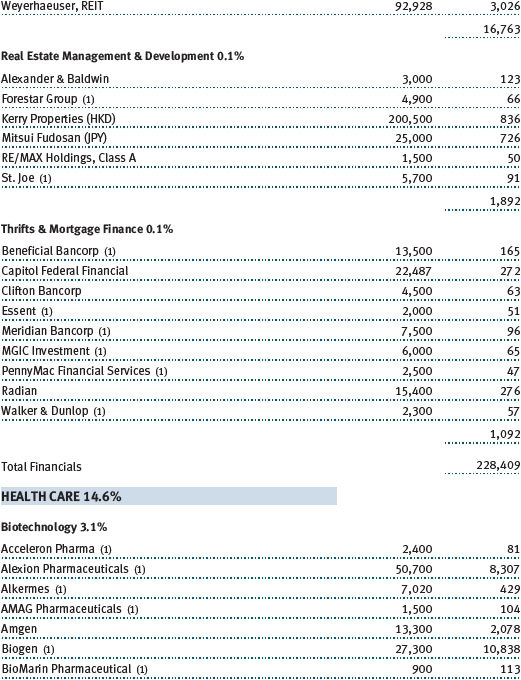
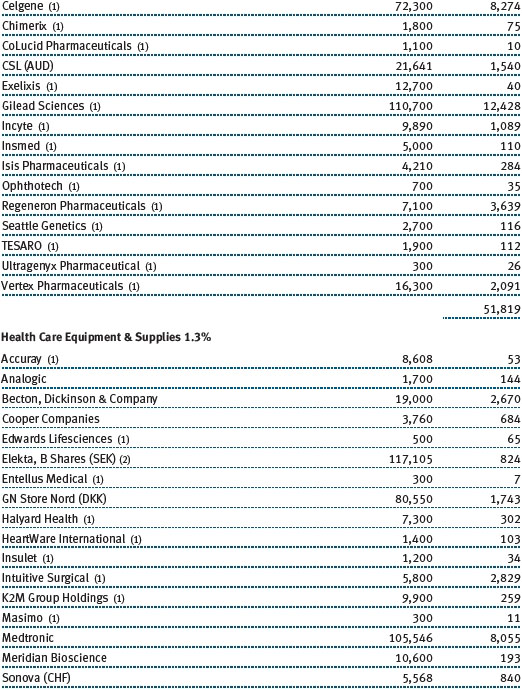
U.S. companies across a range of industries made positive contributions to performance over the past 12 months. Holdings in the health care sector generated strong gains, led by the biotechnology industry. Gilead Sciences, which maintains a dominant position in the HIV antiviral market, moved higher on strong earnings results for Harvoni, a one-pill treatment for hepatitis C. Pharmacyclics performed well after the company announced better-than-expected revenue forecasts for its leukemia drug Imbruvica. Later, AbbVie agreed to acquire the company in a $21 billion deal. In the information technology sector, Amazon.com was among our strongest performers. We are particularly optimistic about the prospects for long-term growth in its cloud computing and Amazon Web Services (AWS) online storage businesses. Several of our energy holdings detracted from results as global oil prices fell sharply. These included global exploration and production company Apache as well as onshore production companies with exposure to North American shale oil, such as Pioneer Natural Resources and Range Resources. Energy equipment and services companies were also punished, including WorleyParsons and China Oilfield Services. Wynn Resorts struggled as slowing economic growth and a corruption crackdown in China punished its Asian gaming operations. (Please refer to the portfolio of investments for a complete list of holdings and the amount each represents in the portfolio.)
Tactical decisions to overweight and underweight asset classes were helpful overall, but underlying results were mixed. Underweight allocations to real assets and international bonds helped relative performance, while an overweight to non-U.S. equities versus U.S. stocks hindered results.
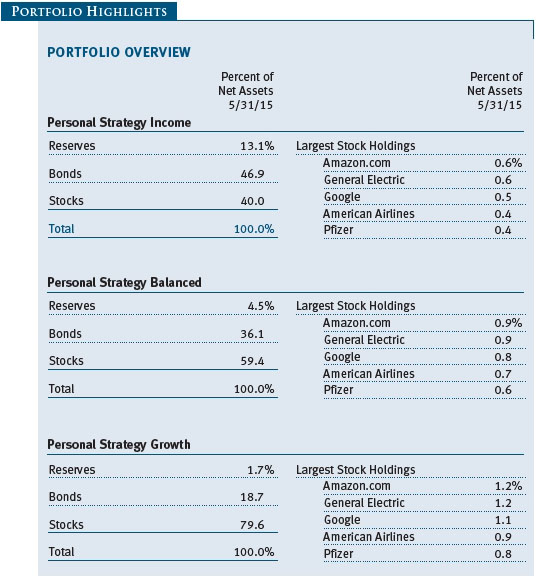
At the end of the reporting period, the fund’s target allocations were 40% stocks and 60% bonds and cash. Both targets were unchanged from our last report on November 30, 2014. The actual allocations may differ from the target allocations due to investment time horizon, market conditions, trading environment, and other factors.
Personal Strategy Balanced Fund
![]()
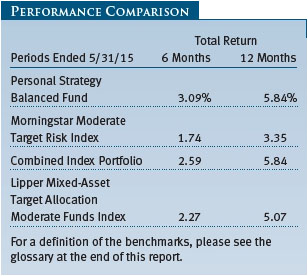
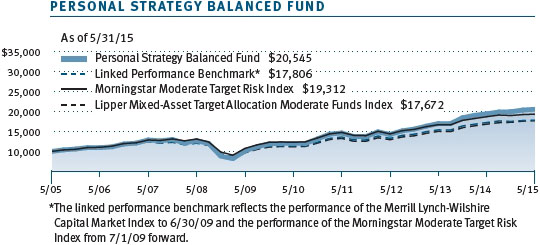
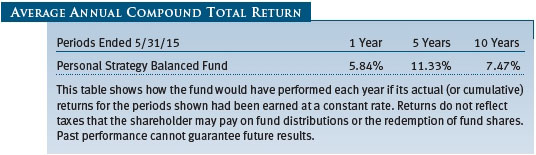
As shown in the Performance Comparison table, the Personal Strategy Balanced Fund returned 3.09% and 5.84% for the 6- and 12-month periods ended May 31, 2015, respectively. The fund outpaced its combined index portfolio for the six-month period and performed in line with the custom benchmark for the 12-month period. The fund outperformed its Morningstar and Lipper peer group indexes for both periods.
Security selection was positive overall and benefited the fund’s performance versus its combined index portfolio over the past 12 months. Stock selection was particularly helpful, led by our U.S. large-cap growth and value shares, as well as stocks in non-U.S. developed and emerging markets. Security selection in our investment-grade bond portfolio weighed on results, due largely to an underweight position in Treasuries, which performed well for the period. Our emerging markets debt holdings also hurt results, with positions in Russia, Ukraine, and Venezuela detracting.
U.S. companies across a range of industries made positive contributions to performance over the past 12 months. Holdings in the health care sector generated strong gains, led by the biotechnology industry. Gilead Sciences, which maintains a dominant position in the HIV antiviral market, moved higher on strong earnings results for Harvoni, a one-pill treatment for hepatitis C. Pharmacyclics performed well after the company announced better-than-expected revenue forecasts for its leukemia drug Imbruvica. Later, AbbVie agreed to acquire the company in a $21 billion deal. In the information technology sector, Amazon.com was among our strongest performers. We are particularly optimistic about the prospects for long-term growth in its cloud computing and Amazon Web Services (AWS) online storage businesses. Several of our energy holdings detracted from results as global oil prices fell sharply. These included global exploration and production company Apache as well as onshore production companies with exposure to North American shale oil, such as Pioneer Natural Resources and Range Resources. Energy equipment and services companies were also punished, including WorleyParsons and China Oilfield Services. Wynn Resorts struggled as slowing economic growth and a corruption crackdown in China punished its Asian gaming operations. (Please refer to the portfolio of investments for a complete list of holdings and the amount each represents in the portfolio.)
Tactical decisions to overweight and underweight asset classes were helpful overall, but underlying results were mixed. Underweight allocations to real assets and international bonds helped relative performance, while an overweight to non-U.S. equities versus U.S. stocks hindered results.
Diversifying allocations to sectors not included in the fund’s broad fixed income benchmark (the Barclays U.S. Aggregate Bond Index) detracted significantly from results for the 12-month period. In particular, our exposure to international developed markets debt weighed on performance as a stronger U.S. dollar punished the asset class. Our portfolio of real assets stocks also hurt results as oil and commodity prices plummeted. This was offset somewhat, however, by positive contributions from our U.S. and global real estate holdings.
At the end of the reporting period, the fund’s target allocations were 60% stocks and 40% bonds and cash. Both targets were unchanged from our last report on November 30, 2014. The actual allocations may differ from the target allocations due to investment time horizon, market conditions, trading environment, and other factors.
Personal Strategy Growth Fund
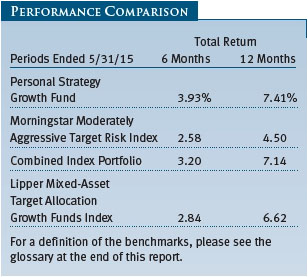
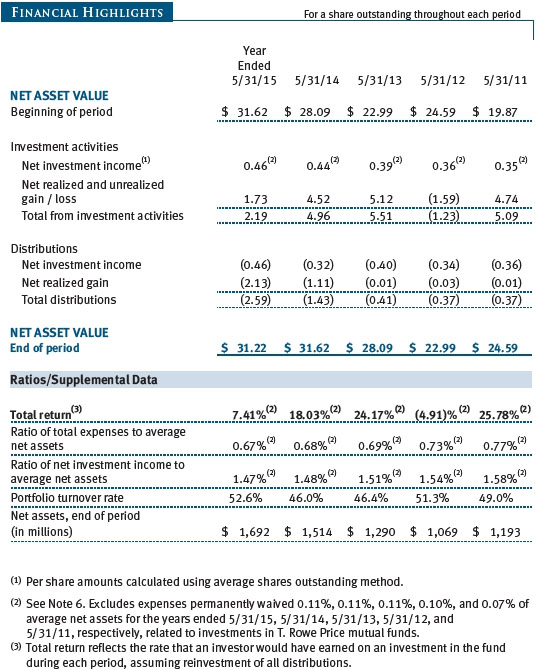
As shown in the Performance Comparison table, the Personal Strategy Growth Fund returned 3.93% and 7.41% for the 6- and 12-month periods ended May 31, 2015, respectively. The fund outpaced its combined index portfolio, Morningstar and Lipper peer group indexes for both periods.
Security selection was positive overall and benefited the fund’s performance versus its combined index portfolio over the past 12 months. Stock selection was particularly helpful, led by our U.S. large-cap growth and value shares, as well as stocks in non-U.S. developed and emerging markets. Security selection in our investment-grade bond portfolio weighed on results, due largely to an underweight position in Treasuries, which performed well for the period. Our emerging markets debt holdings also hurt results, with positions in Russia, Ukraine, and Venezuela detracting.
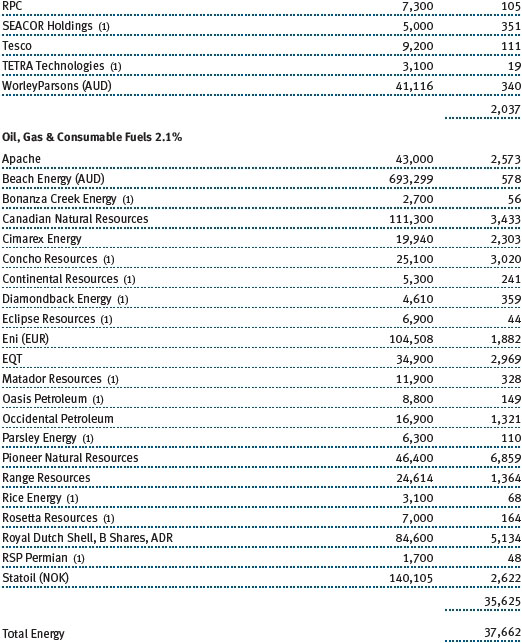
U.S. companies across a range of industries made positive contributions to performance over the past 12 months. Holdings in the health care sector generated strong gains, led by the biotechnology industry. Gilead Sciences, which maintains a dominant position in the HIV antiviral market, moved higher on strong earnings results for Harvoni, a one-pill treatment for hepatitis C. Pharmacyclics performed well after the company announced better-than-expected revenue forecasts for its leukemia drug Imbruvica. Later, AbbVie agreed to acquire the company in a $21 billion deal. In the information technology sector, Amazon.com was among our strongest performers. We are particularly optimistic about the prospects for long-term growth in its cloud computing and Amazon Web Services (AWS) online storage businesses. Several of our energy holdings detracted from results as global oil prices fell sharply. These included global exploration and production company Apache as well as onshore production companies with exposure to North American shale oil, such as Pioneer Natural Resources and Range Resources. Energy equipment and services companies were also punished, including WorleyParsons and China Oilfield Services. Wynn Resorts struggled as slowing economic growth and a corruption crackdown in China punished its Asian gaming operations. (Please refer to the portfolio of investments for a complete list of holdings and the amount each represents in the portfolio.)
Tactical decisions to overweight and underweight asset classes produced mixed results and had little net impact on relative performance. Underweight allocations to real assets and international bonds helped relative performance, but this was largely offset by an overweight to non-U.S. equities versus U.S. stocks, which hindered results.
Diversifying allocations to sectors not included in the fund’s broad fixed income benchmark (the Barclays U.S. Aggregate Bond Index) detracted significantly from results for the 12-month period. In particular, our exposure to international developed markets debt weighed on performance as a stronger U.S. dollar punished the asset class. Our portfolio of real assets stocks also hurt results as oil and commodity prices plummeted. However, this was offset somewhat by positive contributions from our U.S. and global real estate holdings.
At the end of the current reporting period, the fund’s target allocations were 80% equities and 20% bonds and cash. Both targets were unchanged from our last report on November 30, 2014. The actual allocations may differ from the target allocations due to investment time horizon, market conditions, trading environment, and other factors.
OUTLOOK
We expect global economic growth to trend modestly higher in 2015, with stronger growth in developed markets—particularly in Europe—offsetting more sluggish growth in emerging markets. Given the slow start to the year, growth expectations for 2015 have been revised lower to near 2.5%. Inflation remains below the Fed’s 2% target, although there is some evidence that wages are beginning to rise from trough levels as the labor market has improved. Fed policy remains broadly accommodative, with balance sheet assets of more than $4 trillion and interest rate increases not expected until later this year. On the corporate front, healthy balance sheets and cash flows grant companies a measure of flexibility in the use of capital to increase capital spending, engage in M&As, and return capital to shareholders through dividend increases and share buybacks.
Europe’s economy appears to have firmed, and growth should trend higher in 2015, supported by diminished fiscal headwinds, an improved credit environment, and a weaker euro, which is expected to boost exports. Monetary policy remains highly accommodative as the ECB’s QE program continues. Risks to the improved growth scenario include uncertainty about Greek debt and the country’s ability to remain in the eurozone, longstanding structural issues, still-elevated unemployment, and political instability in some countries.
Japan’s economy emerged from a tax-induced recession in the fourth quarter of 2014 and has enjoyed two consecutive quarters of expansion. While growth has improved, consumer spending and wage growth remain tepid, and long-awaited structural reforms have been slow to materialize. The BoJ is continuing its QE program, but the recent stabilization of the yen and lower oil prices are undermining its ability to boost inflation toward its 2% target.
Conditions in emerging markets continue to diverge. Slowing global growth has hurt global trade, weighed on commodity prices, and punished commodity-producing economies. Weak economic data persist in China, raising concerns that the lowered official growth target of “around 7%” in 2015 may prove difficult to achieve. Despite signs of weaker economic growth, the domestic Chinese equity market is advancing. The People’s Bank of China is taking steps to stimulate growth and lending activity through debt-for-bond swaps, which allow commercial banks to use local government bailout bonds as collateral for low-cost loans from the central bank.
Markets are likely to be somewhat choppy against a backdrop of divergent monetary policies and modest global economic growth. Currency volatility and persistent geopolitical concerns, particularly in the Middle East and Eastern Europe, pose additional risks. However, we believe that a highly diversified portfolio and a careful focus on fundamental research can improve our ability to identify compelling investment opportunities on behalf of our shareholders.
Respectfully submitted,

Charles Shriver
Portfolio manager and chairman of the funds’ Investment Advisory Committee
June 15, 2015
The committee chairman has day-to-day responsibility for managing the portfolios and works with committee members in developing and executing the funds’ investment programs.
RISKS OF INVESTING
As with all stock and bond mutual funds, each fund’s share price can fall because of weakness in the stock or bond markets, a particular industry, or specific holdings. Stock markets can decline for many reasons, including adverse political or economic developments, changes in investor psychology, or heavy institutional selling. The prospects for an industry or company may deteriorate because of a variety of factors, including disappointing earnings or changes in the competitive environment. In addition, the investment manager’s assessment of companies held in a fund may prove incorrect, resulting in losses or poor performance even in rising markets.
Bonds are subject to interest rate risk, the decline in bond prices that usually accompanies a rise in interest rates, and credit risk, the chance that any fund holding could have its credit rating downgraded or that a bond issuer will default (fail to make timely payments of interest or principal), potentially reducing the fund’s income level and share price. High yield corporate bonds could have greater price declines than funds that invest primarily in high-quality bonds. Companies issuing high yield bonds are not as strong financially as those with higher credit ratings, so the bonds are usually considered speculative investments.
Funds that invest overseas may carry more risk than funds that invest strictly in U.S. assets. Risks can result from varying stages of economic and political development; differing regulatory environments, trading days, and accounting standards; and higher transaction costs of non-U.S. markets. Non-U.S. investments are also subject to currency risk, or a decline in the value of a foreign currency versus the U.S. dollar, which reduces the dollar value of securities denominated in that currency.
GLOSSARY
Barclays Global Aggregate ex U.S. Dollar Bond Index: Tracks the performance of government, corporate, agency, and mortgage-related bonds in Europe, the Asia-Pacific region, and Canada.
Barclays U.S. Aggregate Bond Index: An unmanaged index that tracks investment-grade bonds, including corporate, government, and mortgage-backed securities.
Citigroup 3-Month Treasury Bill Index: An unmanaged index that tracks short-term U.S. government debt instruments.
Combined index portfolios: Unmanaged portfolios composed of the following underlying indexes as of May 31, 2015:
| ● | Personal Strategy Income—40% stocks (28% Russell 3000 Index, 12% MSCI All Country World Index ex USA), 40% bonds (Barclays U.S. Aggregate Bond Index), and 20% money market securities (Citigroup 3-Month Treasury Bill Index). |
| ● | Personal Strategy Balanced—60% stocks (42% Russell 3000 Index, 18% MSCI All Country World Index ex USA), 30% bonds (Barclays U.S. Aggregate Bond Index), and 10% money market securities (Citigroup 3-Month Treasury Bill Index). |
| ● | Personal Strategy Growth—80% stocks (56% Russell 3000 Index, 24% MSCI All Country World Index ex USA) and 20% bonds (Barclays U.S. Aggregate Bond Index). |
Credit Suisse High Yield Index: Tracks the performance of domestic noninvestment-grade corporate bonds.
Federal funds rate (or target rate): The interest rate charged on overnight loans of reserves by one financial institution to another in the United States. The Federal Reserve sets a target federal funds rate to affect the direction of interest rates.
Gross domestic product: The total market value of all goods and services produced in a country in a given year.
Lipper Mixed-Asset Target Allocation Conservative Funds Index: A peer group benchmark that measures the performance of similar funds with a mix of between 20% and 40% equities, with the remainder invested in bonds and short-term investments.
Lipper Mixed-Asset Target Allocation Growth Funds Index: A peer group benchmark that measures the performance of similar funds with a mix of between 60% and 80% equities, with the remainder invested in bonds and short-term investments.
Lipper Mixed-Asset Target Allocation Moderate Funds Index: A peer group benchmark that measures the performance of similar funds with a mix of between 40% and 60% equities, with the remainder invested in bonds and short-term investments.
Morningstar Moderate Target Risk Index: Represents a portfolio of global equities (fixed at 60%), bonds, and other asset classes.
Morningstar Moderately Aggressive Target Risk Index: Represents a portfolio of global equities (fixed at 80%), bonds, and other asset classes.
Morningstar Moderately Conservative Target Risk Index: Represents a portfolio of global equities (fixed at 40%), bonds, and other asset classes.
MSCI All Country World Index ex USA: An index that measures equity market performance of developed and emerging countries, excluding the U.S.
MSCI Emerging Markets Index: A capitalization-weighted index of stocks from emerging market countries that only includes securities that may be traded by foreign investors.
Russell 3000 Index: An index that tracks the performance of the 3,000 largest U.S. companies, representing approximately 98% of the investable U.S. equity market.
S&P 500 Index: An index that tracks the stocks of 500 primarily large-cap U.S. companies.
Note: MSCI makes no express or implied warranties or representations and shall have no liability whatsoever with respect to any MSCI data contained herein. The MSCI data may not be further redistributed or used as a basis for other indices or any securities or financial products. This report is not approved, reviewed, or produced by MSCI.
Note: Russell Investment Group is the source and owner of the trademarks, service marks, and copyrights related to the Russell indexes. Russell® is a trademark of Russell Investment Group.
Performance and Expenses
| Growth of $10,000 |
This chart shows the value of a hypothetical $10,000 investment in the fund over the past 10 fiscal year periods or since inception (for funds lacking 10-year records). The result is compared with benchmarks, which may include a broad-based market index and a peer group average or index. Market indexes do not include expenses, which are deducted from fund returns as well as mutual fund averages and indexes.


| Fund Expense Example |
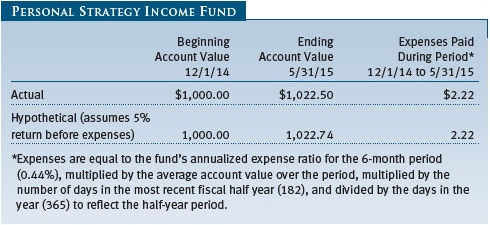
As a mutual fund shareholder, you may incur two types of costs: (1) transaction costs, such as redemption fees or sales loads, and (2) ongoing costs, including management fees, distribution and service (12b-1) fees, and other fund expenses. The following example is intended to help you understand your ongoing costs (in dollars) of investing in the fund and to compare these costs with the ongoing costs of investing in other mutual funds. The example is based on an investment of $1,000 invested at the beginning of the most recent six-month period and held for the entire period.
Actual Expenses
The first line of the following table (Actual) provides information about actual account values and expenses based on the fund’s actual returns. You may use the information on this line, together with your account balance, to estimate the expenses that you paid over the period. Simply divide your account value by $1,000 (for example, an $8,600 account value divided by $1,000 = 8.6), then multiply the result by the number on the first line under the heading “Expenses Paid During Period” to estimate the expenses you paid on your account during this period.
Hypothetical Example for Comparison Purposes
The information on the second line of the table (Hypothetical) is based on hypothetical account values and expenses derived from the fund’s actual expense ratio and an assumed 5% per year rate of return before expenses (not the fund’s actual return). You may compare the ongoing costs of investing in the fund with other funds by contrasting this 5% hypothetical example and the 5% hypothetical examples that appear in the shareholder reports of the other funds. The hypothetical account values and expenses may not be used to estimate the actual ending account balance or expenses you paid for the period.
Note: T. Rowe Price charges an annual account service fee of $20, generally for accounts with less than $10,000. The fee is waived for any investor whose T. Rowe Price mutual fund accounts total $50,000 or more; accounts electing to receive electronic delivery of account statements, transaction confirmations, prospectuses, and shareholder reports; or accounts of an investor who is a T. Rowe Price Preferred Services, Personal Services, or Enhanced Personal Services client (enrollment in these programs generally requires T. Rowe Price assets of at least $100,000). This fee is not included in the accompanying table. If you are subject to the fee, keep it in mind when you are estimating the ongoing expenses of investing in the fund and when comparing the expenses of this fund with other funds.
You should also be aware that the expenses shown in the table highlight only your ongoing costs and do not reflect any transaction costs, such as redemption fees or sales loads. Therefore, the second line of the table is useful in comparing ongoing costs only and will not help you determine the relative total costs of owning different funds. To the extent a fund charges transaction costs, however, the total cost of owning that fund is higher.


The accompanying notes are an integral part of these financial statements.


The accompanying notes are an integral part of these financial statements.

The accompanying notes are an integral part of these financial statements.

The accompanying notes are an integral part of these financial statements.
The accompanying notes are an integral part of these financial statements.
| Notes to Financial Statements |
T. Rowe Price Personal Strategy Funds, Inc. (the corporation), is registered under the Investment Company Act of 1940 (the 1940 Act). The Personal Strategy Growth Fund (the fund) is a diversified, open-end management investment company established by the corporation. The fund commenced operations on July 29, 1994. The fund seeks the highest total return over time consistent with a primary emphasis on capital growth and a secondary emphasis on income. The fund pursues this objective by investing in a diversified portfolio typically consisting of approximately 80% stocks and 20% bonds and money market securities.
NOTE 1 - SIGNIFICANT ACCOUNTING POLICIES
Basis of Preparation The fund is an investment company and follows accounting and reporting guidance in the Financial Accounting Standards Board (FASB) Accounting Standards Codification Topic 946 (ASC 946). The accompanying financial statements were prepared in accordance with accounting principles generally accepted in the United States of America (GAAP), including but not limited to ASC 946. GAAP requires the use of estimates made by management. Management believes that estimates and valuations are appropriate; however, actual results may differ from those estimates, and the valuations reflected in the accompanying financial statements may differ from the value ultimately realized upon sale or maturity.
Investment Transactions, Investment Income, and Distributions Income and expenses are recorded on the accrual basis. Premiums and discounts on debt securities are amortized for financial reporting purposes. Paydown gains and losses are recorded as an adjustment to interest income. Inflation adjustments to the principal amount of inflation-indexed bonds are reflected as interest income. Dividends received from mutual fund investments are reflected as dividend income; capital gain distributions are reflected as realized gain/loss. Dividend income and capital gain distributions are recorded on the ex-dividend date. Income tax-related interest and penalties, if incurred, would be recorded as income tax expense. Investment transactions are accounted for on the trade date. Realized gains and losses are reported on the identified cost basis. Distributions to shareholders are recorded on the ex-dividend date. Distributions from REITs are initially recorded as dividend income and, to the extent such represent a return of capital or capital gain for tax purposes, are reclassified when such information becomes available. Income distributions are declared and paid annually. Capital gain distributions, if any, are generally declared and paid by the fund annually.
Currency Translation Assets, including investments, and liabilities denominated in foreign currencies are translated into U.S. dollar values each day at the prevailing exchange rate, using the mean of the bid and asked prices of such currencies against U.S. dollars as quoted by a major bank. Purchases and sales of securities, income, and expenses are translated into U.S. dollars at the prevailing exchange rate on the date of the transaction. The effect of changes in foreign currency exchange rates on realized and unrealized security gains and losses is reflected as a component of security gains and losses.
Rebates Subject to best execution, the fund may direct certain security trades to brokers who have agreed to rebate a portion of the related brokerage commission to the fund in cash. Commission rebates are reflected as realized gain on securities in the accompanying financial statements and totaled $13,000 for the year ended May 31, 2015.
New Accounting Guidance In June 2014, FASB issued Accounting Standards Update (ASU) No. 2014-11, Transfers and Servicing (Topic 860), Repurchase-to-Maturity Transactions, Repurchase Financings, and Disclosures. The ASU changes the accounting for certain repurchase agreements and expands disclosure requirements related to repurchase agreements, securities lending, repurchase-to-maturity and similar transactions. The ASU is effective for interim and annual reporting periods beginning after December 15, 2014. Adoption will have no effect on the fund’s net assets or results of operations.
In May 2015, FASB issued ASU No. 2015-07, Fair Value Measurement (Topic 820), Disclosures for Investments in Certain Entities That Calculate Net Asset Value per Share (or Its Equivalent). The ASU removes the requirement to categorize within the fair value hierarchy all investments for which fair value is measured using the net asset value per share practical expedient and amends certain disclosure requirements for such investments. The ASU is effective for interim and annual reporting periods beginning after December 15, 2015. Adoption will have no effect on the fund’s net assets or results of operations.
NOTE 2 - VALUATION
The fund’s financial instruments are valued and its net asset value (NAV) per share is computed at the close of the New York Stock Exchange (NYSE), normally 4 p.m. ET, each day the NYSE is open for business.
Fair Value The fund’s financial instruments are reported at fair value, which GAAP defines as the price that would be received to sell an asset or paid to transfer a liability in an orderly transaction between market participants at the measurement date. The T. Rowe Price Valuation Committee (the Valuation Committee) has been established by the fund’s Board of Directors (the Board) to ensure that financial instruments are appropriately priced at fair value in accordance with GAAP and the 1940 Act. Subject to oversight by the Board, the Valuation Committee develops and oversees pricing-related policies and procedures and approves all fair value determinations. Specifically, the Valuation Committee establishes procedures to value securities; determines pricing techniques, sources, and persons eligible to effect fair value pricing actions; oversees the selection, services, and performance of pricing vendors; oversees valuation-related business continuity practices; and provides guidance on internal controls and valuation-related matters. The Valuation Committee reports to the Board; is chaired by the fund’s treasurer; and has representation from legal, portfolio management and trading, operations, and risk management.
Various valuation techniques and inputs are used to determine the fair value of financial instruments. GAAP establishes the following fair value hierarchy that categorizes the inputs used to measure fair value:
Level 1 – quoted prices (unadjusted) in active markets for identical financial instruments that the fund can access at the reporting date
Level 2 – inputs other than Level 1 quoted prices that are observable, either directly or indirectly (including, but not limited to, quoted prices for similar financial instruments in active markets, quoted prices for identical or similar financial instruments in inactive markets, interest rates and yield curves, implied volatilities, and credit spreads)
Level 3 – unobservable inputs
Observable inputs are developed using market data, such as publicly available information about actual events or transactions, and reflect the assumptions that market participants would use to price the financial instrument. Unobservable inputs are those for which market data are not available and are developed using the best information available about the assumptions that market participants would use to price the financial instrument. GAAP requires valuation techniques to maximize the use of relevant observable inputs and minimize the use of unobservable inputs. When multiple inputs are used to derive fair value, the financial instrument is assigned to the level within the fair value hierarchy based on the lowest-level input that is significant to the fair value of the financial instrument. Input levels are not necessarily an indication of the risk or liquidity associated with financial instruments at that level but rather the degree of judgment used in determining those values.
Valuation Techniques Equity securities listed or regularly traded on a securities exchange or in the over-the-counter (OTC) market are valued at the last quoted sale price or, for certain markets, the official closing price at the time the valuations are made. OTC Bulletin Board securities are valued at the mean of the closing bid and asked prices. A security that is listed or traded on more than one exchange is valued at the quotation on the exchange determined to be the primary market for such security. Listed securities not traded on a particular day are valued at the mean of the closing bid and asked prices for domestic securities and the last quoted sale or closing price for international securities.
For valuation purposes, the last quoted prices of non-U.S. equity securities may be adjusted to reflect the fair value of such securities at the close of the NYSE. If the fund determines that developments between the close of a foreign market and the close of the NYSE will, in its judgment, materially affect the value of some or all of its portfolio securities, the fund will adjust the previous quoted prices to reflect what it believes to be the fair value of the securities as of the close of the NYSE. In deciding whether it is necessary to adjust quoted prices to reflect fair value, the fund reviews a variety of factors, including developments in foreign markets, the performance of U.S. securities markets, and the performance of instruments trading in U.S. markets that represent foreign securities and baskets of foreign securities. The fund may also fair value securities in other situations, such as when a particular foreign market is closed but the fund is open. The fund uses outside pricing services to provide it with quoted prices and information to evaluate or adjust those prices. The fund cannot predict how often it will use quoted prices and how often it will determine it necessary to adjust those prices to reflect fair value. As a means of evaluating its security valuation process, the fund routinely compares quoted prices, the next day’s opening prices in the same markets, and adjusted prices.
Actively traded domestic equity securities generally are categorized in Level 1 of the fair value hierarchy. Non-U.S. equity securities generally are categorized in Level 2 of the fair value hierarchy despite the availability of quoted prices because, as described above, the fund evaluates and determines whether those quoted prices reflect fair value at the close of the NYSE or require adjustment. OTC Bulletin Board securities, certain preferred securities, and equity securities traded in inactive markets generally are categorized in Level 2 of the fair value hierarchy.
Debt securities generally are traded in the OTC market. Securities with remaining maturities of one year or more at the time of acquisition are valued at prices furnished by dealers who make markets in such securities or by an independent pricing service, which considers the yield or price of bonds of comparable quality, coupon, maturity, and type, as well as prices quoted by dealers who make markets in such securities. Generally, debt securities are categorized in Level 2 of the fair value hierarchy; however, to the extent the valuations include significant unobservable inputs, the securities would be categorized in Level 3.
Investments in mutual funds are valued at the mutual fund’s closing NAV per share on the day of valuation and are categorized in Level 1 of the fair value hierarchy. Financial futures contracts are valued at closing settlement prices and are categorized in Level 1 of the fair value hierarchy. Swaps are valued at prices furnished by independent swap dealers or by an independent pricing service and generally are categorized in Level 2 of the fair value hierarchy; however, if unobservable inputs are significant to the valuation, the swap would be categorized in Level 3. Assets and liabilities other than financial instruments, including short-term receivables and payables, are carried at cost, or estimated realizable value, if less, which approximates fair value.
Thinly traded financial instruments and those for which the above valuation procedures are inappropriate or are deemed not to reflect fair value are stated at fair value as determined in good faith by the Valuation Committee. The objective of any fair value pricing determination is to arrive at a price that could reasonably be expected from a current sale. Financial instruments fair valued by the Valuation Committee are primarily private placements, restricted securities, warrants, rights, and other securities that are not publicly traded.
Subject to oversight by the Board, the Valuation Committee regularly makes good faith judgments to establish and adjust the fair valuations of certain securities as events occur and circumstances warrant. For instance, in determining the fair value of an equity investment with limited market activity, such as a private placement or a thinly traded public company stock, the Valuation Committee considers a variety of factors, which may include, but are not limited to, the issuer’s business prospects, its financial standing and performance, recent investment transactions in the issuer, new rounds of financing, negotiated transactions of significant size between other investors in the company, relevant market valuations of peer companies, strategic events affecting the company, market liquidity for the issuer, and general economic conditions and events. In consultation with the investment and pricing teams, the Valuation Committee will determine an appropriate valuation technique based on available information, which may include both observable and unobservable inputs. The Valuation Committee typically will afford greatest weight to actual prices in arm’s length transactions, to the extent they represent orderly transactions between market participants; transaction information can be reliably obtained; and prices are deemed representative of fair value. However, the Valuation Committee may also consider other valuation methods such as market-based valuation multiples; a discount or premium from market value of a similar, freely traded security of the same issuer; or some combination. Fair value determinations are reviewed on a regular basis and updated as information becomes available, including actual purchase and sale transactions of the issue. Because any fair value determination involves a significant amount of judgment, there is a degree of subjectivity inherent in such pricing decisions, and fair value prices determined by the Valuation Committee could differ from those of other market participants. Depending on the relative significance of unobservable inputs, including the valuation technique(s) used, fair valued securities may be categorized in Level 2 or 3 of the fair value hierarchy.
Valuation Inputs The following table summarizes the fund’s financial instruments, based on the inputs used to determine their fair values on May 31, 2015:

There were no material transfers between Levels 1 and 2 during the year ended May 31, 2015.
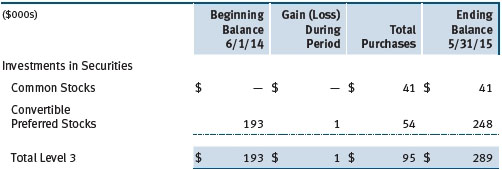
Following is a reconciliation of the fund’s Level 3 holdings for the year ended May 31, 2015. Gain (loss) reflects both realized and change in unrealized gain/loss on Level 3 holdings during the period, if any, and is included on the accompanying Statement of Operations. The change in unrealized gain/loss on Level 3 instruments held at May 31, 2015, totaled $1,000 for the year ended May 31, 2015.
NOTE 3 - DERIVATIVE INSTRUMENTS
During the year ended May 31, 2015, the fund invested in derivative instruments. As defined by GAAP, a derivative is a financial instrument whose value is derived from an underlying security price, foreign exchange rate, interest rate, index of prices or rates, or other variable; it requires little or no initial investment and permits or requires net settlement. The fund invests in derivatives only if the expected risks and rewards are consistent with its investment objectives, policies, and overall risk profile, as described in its prospectus and Statement of Additional Information. The fund may use derivatives for a variety of purposes, such as seeking to hedge against declines in principal value, increase yield, invest in an asset with greater efficiency and at a lower cost than is possible through direct investment, or to adjust credit exposure. The risks associated with the use of derivatives are different from, and potentially much greater than, the risks associated with investing directly in the instruments on which the derivatives are based. The fund at all times maintains sufficient cash reserves, liquid assets, or other SEC-permitted asset types to cover its settlement obligations under open derivative contracts.
The fund values its derivatives at fair value, as described in Note 2, and recognizes changes in fair value currently in its results of operations. Accordingly, the fund does not follow hedge accounting, even for derivatives employed as economic hedges. Generally, the fund accounts for its derivatives on a gross basis. It does not offset the fair value of derivative liabilities against the fair value of derivative assets on its financial statements, nor does it offset the fair value of derivative instruments against the right to reclaim or obligation to return collateral.
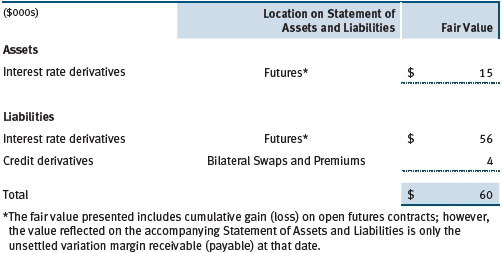
The following table summarizes the fair value of the fund’s derivative instruments held as of May 31, 2015, and the related location on the accompanying Statement of Assets and Liabilities, presented by primary underlying risk exposure:
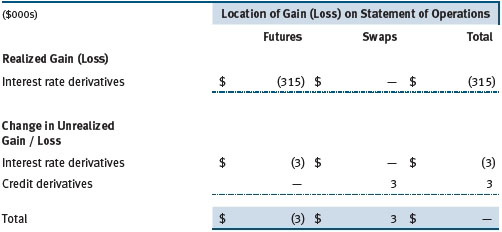
Additionally, the amount of gains and losses on derivative instruments recognized in fund earnings during the year ended May 31, 2015, and the related location on the accompanying Statement of Operations is summarized in the following table by primary underlying risk exposure:
Counterparty Risk and Collateral The fund invests in derivatives in various markets, which expose it to differing levels of counterparty risk. Counterparty risk on exchange-traded and centrally cleared derivative contracts, such as futures, exchange-traded options, and centrally cleared swaps, is minimal because the clearinghouse provides protection against counterparty defaults. For futures and centrally cleared swaps, the fund is required to deposit collateral in an amount equal to a certain percentage of the contract value (margin requirement) and the margin requirement must be maintained over the life of the contract. Each clearing broker, in its sole discretion, may adjust the margin requirements applicable to the fund.
Derivatives, such as bilateral swaps, forward currency exchange contracts, and OTC options, that are transacted and settle directly with a counterparty (bilateral derivatives) expose the fund to greater counterparty risk. To mitigate this risk, the fund has entered into master netting arrangements (MNAs) with certain counterparties that permit net settlement under specified conditions and, for certain counterparties, also provide collateral agreements. MNAs may be in the form of International Swaps and Derivatives Association master agreements (ISDAs) or foreign exchange letter agreements (FX letters).
MNAs govern the ability to offset amounts the fund owes a counterparty against amounts the counterparty owes the fund (net settlement). Both ISDAs and FX letters generally allow net settlement in the event of contract termination and permit termination by either party prior to maturity upon the occurrence of certain stated events, such as failure to pay or bankruptcy. In addition, ISDAs specify other events, the occurrence of which would allow one of the parties to terminate. For example, a downgrade in credit rating of a counterparty would allow the fund to terminate while a decline in the fund’s net assets of more than a certain percentage would allow the counterparty to terminate. Upon termination, all bilateral derivatives with that counterparty would be liquidated and a net amount settled. ISDAs typically include collateral agreements whereas FX letters do not. Collateral requirements are determined based on the net aggregate unrealized gain or loss on all bilateral derivatives with each counterparty, subject to minimum transfer amounts that typically range from $100,000 to $250,000. Any additional collateral required due to changes in security values is transferred the next business day.
Collateral may be in the form of cash or debt securities issued by the U.S. government or related agencies. Cash and currencies posted by the fund are reflected as cash deposits in the accompanying financial statements and generally are restricted from withdrawal by the fund; securities posted by the fund are so noted in the accompanying Portfolio of Investments; both remain in the fund’s assets. Collateral pledged by counterparties is not included in the fund’s assets because the fund does not obtain effective control over those assets. For bilateral derivatives, collateral posted or received by the fund is held in a segregated account by the fund’s custodian. As of May 31, 2015, no collateral was pledged by either the fund or counterparties for bilateral derivatives. As of May 31, 2015, securities valued at $166,000 had been posted by the fund for exchange-traded and/or centrally cleared derivatives.
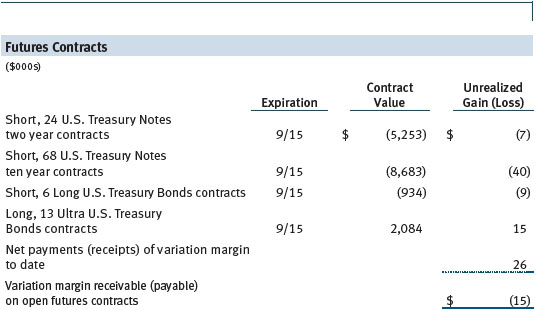
Futures Contracts The fund is subject to interest rate risk in the normal course of pursuing its investment objectives and uses futures contracts to help manage such risk. The fund may enter into futures contracts to manage exposure to interest rates, security prices, foreign currencies, and credit quality; as an efficient means of adjusting exposure to all or part of a target market; to enhance income; as a cash management tool; or to adjust credit exposure. A futures contract provides for the future sale by one party and purchase by another of a specified amount of a specific underlying financial instrument at an agreed-upon price, date, time, and place. The fund currently invests only in exchange-traded futures, which generally are standardized as to maturity date, underlying financial instrument, and other contract terms. Payments are made or received by the fund each day to settle daily fluctuations in the value of the contract (variation margin), which reflect changes in the value of the underlying financial instrument. Variation margin is recorded as unrealized gain or loss until the contract is closed. The value of a futures contract included in net assets is the amount of unsettled variation margin; net variation margin receivable is reflected as an asset and net variation margin payable is reflected as a liability on the accompanying Statement of Assets and Liabilities. Risks related to the use of futures contracts include possible illiquidity of the futures markets, contract prices that can be highly volatile and imperfectly correlated to movements in hedged security values and/or interest rates, and potential losses in excess of the fund’s initial investment. During the year ended May 31, 2015, the volume of the fund’s activity in futures, based on underlying notional amounts, was generally less than 1% of net assets.
Swaps The fund is subject to credit risk in the normal course of pursuing its investment objectives and uses swap contracts to help manage such risk. The fund may use swaps in an effort to manage exposure to changes in interest rates, inflation rates, and credit quality; to adjust overall exposure to certain markets; to enhance total return or protect the value of portfolio securities; to serve as a cash management tool; or to adjust credit exposure. Swap agreements can be settled either directly with the counterparty (bilateral swap) or through a central clearinghouse (centrally cleared swap). Fluctuations in the fair value of a contract are reflected in unrealized gain or loss and are reclassified to realized gain or loss upon contract termination or cash settlement. Net periodic receipts or payments required by a contract increase or decrease, respectively, the value of the contract until the contractual payment date, at which time such amounts are reclassified from unrealized to realized gain or loss. For bilateral swaps, cash payments are made or received by the fund on a periodic basis in accordance with contract terms; unrealized gain on contracts and premiums paid are reflected as assets, and unrealized loss on contracts and premiums received are reflected as liabilities on the accompanying Statement of Assets and Liabilities. For centrally cleared swaps, payments are made or received by the fund each day to settle the daily fluctuation in the value of the contract (variation margin). Accordingly, the value of a centrally cleared swap included in net assets is the unsettled variation margin; net variation margin receivable is reflected as an asset and net variation margin payable is reflected as a liability on the accompanying Statement of Assets and Liabilities.
Credit default swaps are agreements where one party (the protection buyer) agrees to make periodic payments to another party (the protection seller) in exchange for protection against specified credit events, such as certain defaults and bankruptcies related to an underlying credit instrument, or issuer or index of such instruments. Upon occurrence of a specified credit event, the protection seller is required to pay the buyer the difference between the notional amount of the swap and the value of the underlying credit, either in the form of a net cash settlement or by paying the gross notional amount and accepting delivery of the relevant underlying credit. For credit default swaps where the underlying credit is an index, a specified credit event may affect all or individual underlying securities included in the index and will be settled based upon the relative weighting of the affected underlying security(s) within the index. Generally, the payment risk for the seller of protection is inversely related to the current market price or credit rating of the underlying credit or the market value of the contract relative to the notional amount, which are indicators of the markets’ valuation of credit quality. As of May 31, 2015, the notional amount of protection sold by the fund totaled $534,000 (0.0% of net assets), which reflects the maximum potential amount the fund could be required to pay under such contracts. Risks related to the use of credit default swaps include the possible inability of the fund to accurately assess the current and future creditworthiness of underlying issuers, the possible failure of a counterparty to perform in accordance with the terms of the swap agreements, potential government regulation that could adversely affect the fund’s swap investments, and potential losses in excess of the fund’s initial investment.
During the year ended May 31, 2015, the volume of the fund’s activity in swaps, based on underlying notional amounts, was generally less than 1% of net assets.
NOTE 4 - OTHER INVESTMENT TRANSACTIONS
Consistent with its investment objective, the fund engages in the following practices to manage exposure to certain risks and/or to enhance performance. The investment objective, policies, program, and risk factors of the fund are described more fully in the fund’s prospectus and Statement of Additional Information.
Emerging and Frontier Markets The fund may invest, either directly or through investments in T. Rowe Price institutional funds, in securities of companies located in, issued by governments of, or denominated in or linked to the currencies of emerging and frontier market countries; at period-end, approximately 10% of the fund’s net assets were invested in emerging markets and 1% in frontier markets. Frontier markets generally have economic structures that are less diverse and mature, and political systems that are less stable, than developed countries and emerging markets. These markets may be subject to greater political, economic, and social uncertainty and differing regulatory environments that may potentially impact the fund’s ability to buy or sell certain securities or repatriate proceeds to U.S. dollars. Such securities are often subject to greater price volatility, less liquidity, and higher rates of inflation than U.S. securities. Investing in frontier markets is significantly riskier than investing in other countries, including emerging markets.
Restricted Securities The fund may invest in securities that are subject to legal or contractual restrictions on resale. Prompt sale of such securities at an acceptable price may be difficult and may involve substantial delays and additional costs.
TBA Purchase and Sale Commitments The fund may enter into to-be-announced (TBA) purchase or sale commitments, pursuant to which it agrees to purchase or sell, respectively, mortgage-backed securities for a fixed unit price, with payment and delivery at a scheduled future date beyond the customary settlement period for such securities. With TBA transactions, the particular securities to be delivered are not identified at the trade date; however, delivered securities must meet specified terms, including issuer, rate, and mortgage term, and be within industry-accepted “good delivery” standards. The fund may enter into TBA purchase transactions with the intention of taking possession of the underlying securities, may elect to extend the settlement by “rolling” the transaction, and/or may use TBAs to gain interim exposure to underlying securities. Until settlement, the fund maintains liquid assets sufficient to settle its TBA commitments.
To mitigate counterparty risk, the fund has entered into agreements with TBA counterparties that provide for collateral and the right to offset amounts due to or from those counterparties under specified conditions. Subject to minimum transfer amounts, collateral requirements are determined and transfers made based on the net aggregate unrealized gain or loss on all TBA commitments with a particular counterparty. At any time, the fund’s risk of loss from a particular counterparty related to its TBA commitments is the aggregate unrealized gain on appreciated TBAs in excess of unrealized loss on depreciated TBAs and collateral received, if any, from such counterparty. As of May 31, 2015, no collateral was pledged by the fund or counterparties for TBAs.
Securities Lending The fund may lend its securities to approved brokers to earn additional income. Its securities lending activities are administered by a lending agent in accordance with a securities lending agreement. Security loans generally do not have stated maturity dates and the fund may recall a security at any time. The fund receives collateral in the form of cash or U.S. government securities, valued at 102% to 105% of the value of the securities on loan. Collateral is maintained over the life of the loan in an amount not less than the value of loaned securities; any additional collateral required due to changes in security values is delivered to the fund the next business day. Cash collateral is invested by the lending agent(s) in accordance with investment guidelines approved by fund management. Additionally, the lending agent indemnifies the fund against losses resulting from borrower default. Although risk is mitigated by the collateral and indemnification, the fund could experience a delay in recovering its securities and a possible loss of income or value if the borrower fails to return the securities, collateral investments decline in value and the lending agent fails to perform. Securities lending revenue consists of earnings on invested collateral and borrowing fees, net of any rebates to the borrower, compensation to the lending agent, and other administrative costs. In accordance with GAAP, investments made with cash collateral are reflected in the accompanying financial statements, but collateral received in the form of securities is not. At May 31, 2015, the value of loaned securities was $8,748,000; the value of cash collateral and related investments was $9,371,000.
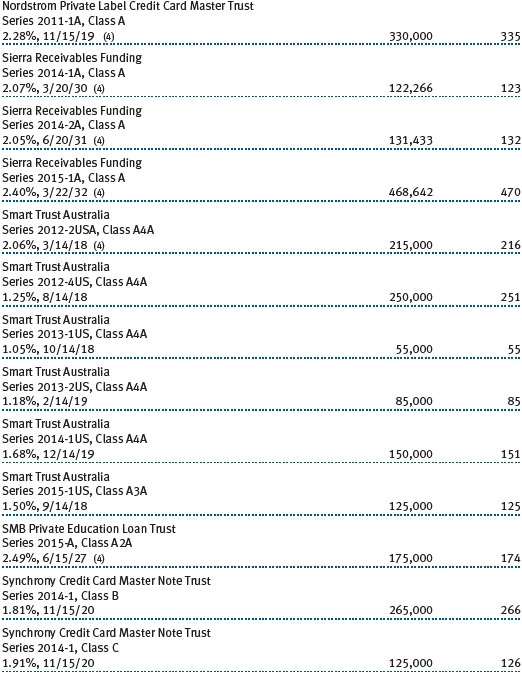
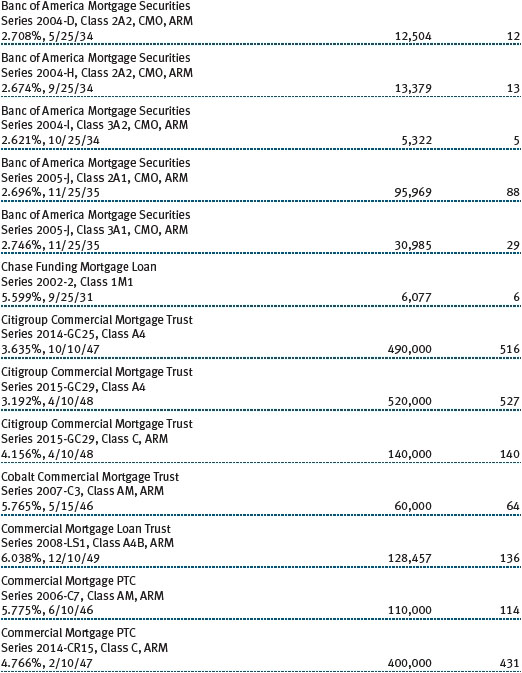
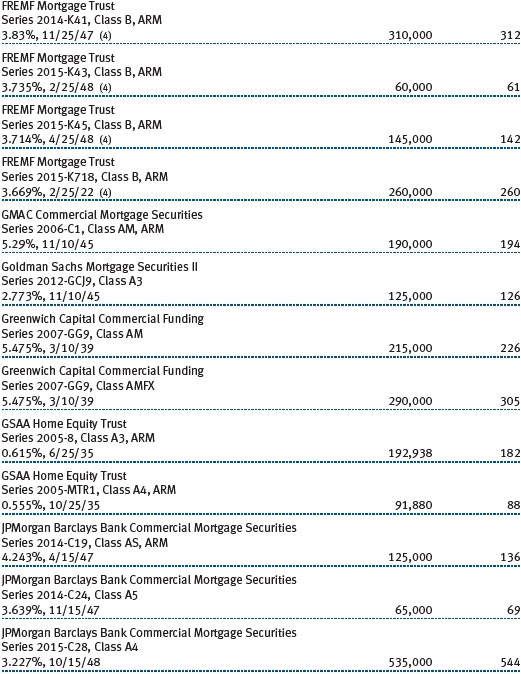
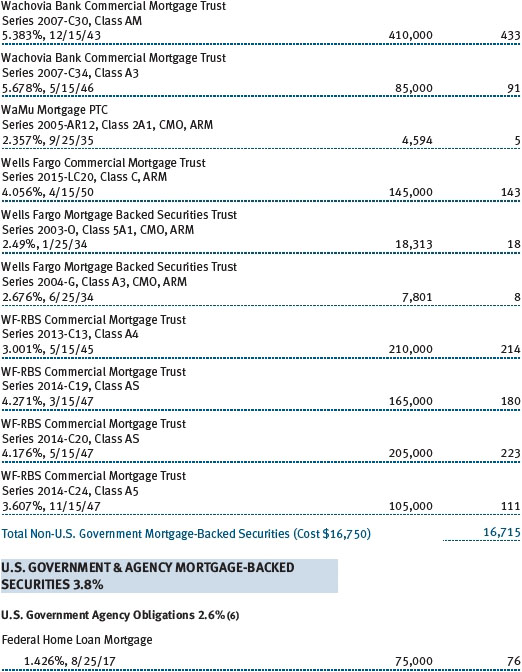
Mortgage-Backed Securities The fund may invest in mortgage-backed securities (MBS or pass-through certificates) that represent an interest in a pool of specific underlying mortgage loans and entitle the fund to the periodic payments of principal and interest from those mortgages. MBS may be issued by government agencies or corporations, or private issuers. Most MBS issued by government agencies are guaranteed; however, the degree of protection differs based on the issuer. The fund also may invest in stripped MBS, created when a traditional MBS is split into an interest-only (IO) and a principal-only (PO) strip. MBS, including IOs and POs, are sensitive to changes in economic conditions that affect the rate of prepayments and defaults on the underlying mortgages; accordingly, the value, income, and related cash flows from MBS may be more volatile than other debt instruments. IOs also risk loss of invested principal from faster-than-anticipated prepayments.
Other Purchases and sales of portfolio securities other than short-term and U.S. government securities aggregated $603,945,000 and $516,034,000, respectively, for the year ended May 31, 2015. Purchases and sales of U.S. government securities aggregated $324,244,000 and $299,839,000, respectively, for the year ended May 31, 2015.
NOTE 5 - FEDERAL INCOME TAXES
No provision for federal income taxes is required since the fund intends to continue to qualify as a regulated investment company under Subchapter M of the Internal Revenue Code and distribute to shareholders all of its taxable income and gains. Distributions determined in accordance with federal income tax regulations may differ in amount or character from net investment income and realized gains for financial reporting purposes. Financial reporting records are adjusted for permanent book/tax differences to reflect tax character but are not adjusted for temporary differences.
The fund files U.S. federal, state, and local tax returns as required. The fund’s tax returns are subject to examination by the relevant tax authorities until expiration of the applicable statute of limitations, which is generally three years after the filing of the tax return but which can be extended to six years in certain circumstances. Tax returns for open years have incorporated no uncertain tax positions that require a provision for income taxes.
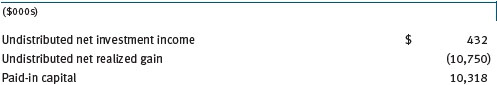
Reclassifications to paid-in capital relate primarily to tax practice that treats a portion of the proceeds from each redemption of capital shares as a distribution of taxable net investment income or realized capital gain. Reclassifications between income and gain relate primarily to the character of paydown gains and losses on asset-backed securities. For the year ended May 31, 2015, the following reclassifications were recorded to reflect tax character (there was no impact on results of operations or net assets):
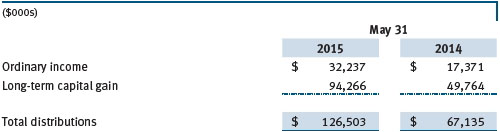
Distributions during the years ended May 31, 2015 and May 31, 2014, were characterized for tax purposes as follows:
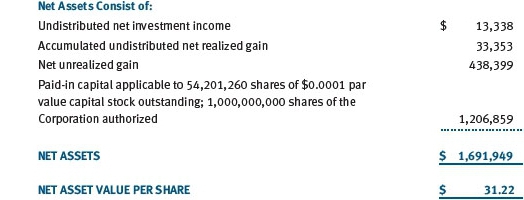
At May 31, 2015, the tax-basis cost of investments and components of net assets were as follows:
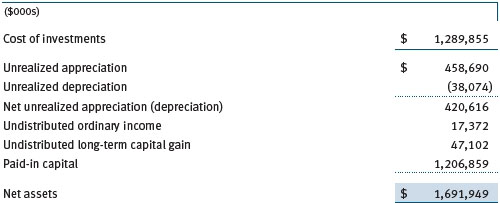
The difference between book-basis and tax-basis net unrealized appreciation (depreciation) is attributable to the deferral of losses from wash sales for tax purposes.
NOTE 6 - RELATED PARTY TRANSACTIONS
The fund is managed by T. Rowe Price Associates, Inc. (Price Associates), a wholly owned subsidiary of T. Rowe Price Group, Inc. (Price Group). The investment management agreement between the fund and Price Associates provides for an annual investment management fee, which is computed daily and paid monthly. The fee consists of an individual fund fee, equal to 0.30% of the fund’s average daily net assets, and a group fee. The group fee rate is calculated based on the combined net assets of certain mutual funds sponsored by Price Associates (the group) applied to a graduated fee schedule, with rates ranging from 0.48% for the first $1 billion of assets to 0.275% for assets in excess of $400 billion. The fund’s group fee is determined by applying the group fee rate to the fund’s average daily net assets. At May 31, 2015, the effective annual group fee rate was 0.29%.
In addition, the fund has entered into service agreements with Price Associates and two wholly owned subsidiaries of Price Associates (collectively, Price). Price Associates computes the daily share price and provides certain other administrative services to the fund. T. Rowe Price Services, Inc., provides shareholder and administrative services in its capacity as the fund’s transfer and dividend-disbursing agent. T. Rowe Price Retirement Plan Services, Inc., provides subaccounting and recordkeeping services for certain retirement accounts invested in the fund. For the year ended May 31, 2015, expenses incurred pursuant to these service agreements were $185,000 for Price Associates; $696,000 for T. Rowe Price Services, Inc.; and $534,000 for T. Rowe Price Retirement Plan Services, Inc. The total amount payable at period-end pursuant to these service agreements is reflected as Due to Affiliates in the accompanying financial statements.
The fund may invest in the T. Rowe Price Reserve Investment Fund, the T. Rowe Price Government Reserve Investment Fund, or the T. Rowe Price Short-Term Reserve Fund (collectively, the Price Reserve Investment Funds), open-end management investment companies managed by Price Associates and considered affiliates of the fund. The Price Reserve Investment Funds are offered as short-term investment options to mutual funds, trusts, and other accounts managed by Price Associates or its affiliates and are not available for direct purchase by members of the public. The Price Reserve Investment Funds pay no investment management fees.
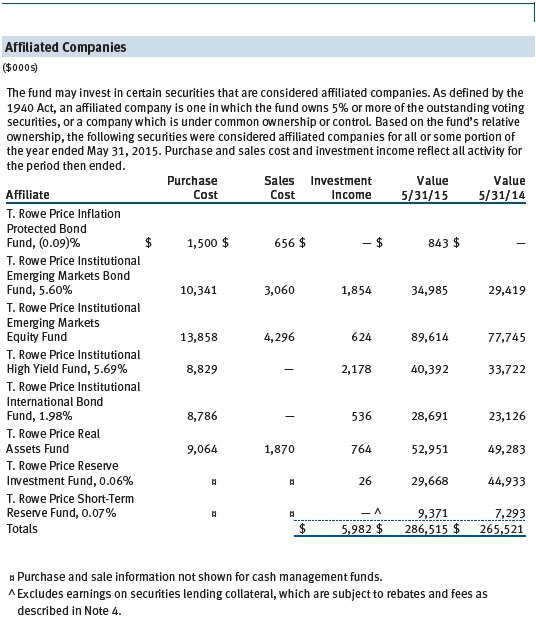
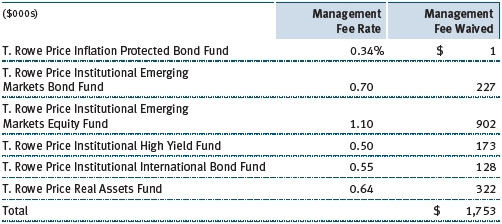
The fund may also invest in certain other T. Rowe Price funds as a means of gaining efficient and cost-effective exposure to certain markets. The fund does not invest for the purpose of exercising management or control; however, investments by the fund may represent a significant portion of an underlying T. Rowe Price fund’s net assets. Each underlying T. Rowe Price fund is an open-end management investment company managed by Price Associates and is considered an affiliate of the fund. To ensure that the fund does not incur duplicate management fees (paid by the underlying T. Rowe Price fund(s) and the fund), Price Associates has agreed to permanently waive a portion of its management fee charged to the fund in an amount sufficient to fully offset that portion of management fees paid by each underlying T. Rowe Price fund related to the fund’s investment therein. The accompanying Statement of Operations reflects management fees permanently waived pursuant to this agreement. Annual fee rates and management fees waived related to investments in the underlying T. Rowe Price fund(s) for the year ended May 31, 2015, are as follows:
| Report of Independent Registered Public Accounting Firm |
To the Board of Directors of T. Rowe Price Personal Strategy Funds, Inc. and
Shareholders of T. Rowe Price Personal Strategy Growth Fund
In our opinion, the accompanying statement of assets and liabilities, including the portfolio of investments, and the related statements of operations and of changes in net assets and the financial highlights present fairly, in all material respects, the financial position of the T. Rowe Price Personal Strategy Growth Fund (one of the portfolios comprising T. Rowe Price Personal Strategy Funds, Inc., hereafter referred to as the “Fund”) at May 31, 2015, the results of its operations, the changes in its net assets and the financial highlights for each of the periods indicated therein, in conformity with accounting principles generally accepted in the United States of America. These financial statements and financial highlights (hereafter referred to as “financial statements”) are the responsibility of the Fund’s management. Our responsibility is to express an opinion on these financial statements based on our audits. We conducted our audits of these financial statements in accordance with the standards of the Public Company Accounting Oversight Board (United States). Those standards require that we plan and perform the audit to obtain reasonable assurance about whether the financial statements are free of material misstatement. An audit includes examining, on a test basis, evidence supporting the amounts and disclosures in the financial statements, assessing the accounting principles used and significant estimates made by management, and evaluating the overall financial statement presentation. We believe that our audits, which included confirmation of securities at May 31, 2015 by correspondence with the custodian and brokers, and confirmation of the underlying funds by correspondence with the transfer agent, provide a reasonable basis for our opinion.
PricewaterhouseCoopers LLP
Baltimore, Maryland
July 16, 2015
| Tax Information (Unaudited) for the Tax Year Ended 5/31/15 |
We are providing this information as required by the Internal Revenue Code. The amounts shown may differ from those elsewhere in this report because of differences between tax and financial reporting requirements.
The fund’s distributions to shareholders included:
| ● | $12,426,000 from short-term capital gains, |
| ● | $101,928,000 from long-term capital gains, subject to a long-term capital gains tax rate of not greater than 20%. |
For taxable non-corporate shareholders, $22,143,000 of the fund’s income represents qualified dividend income subject to a long-term capital gains tax rate of not greater than 20%.
For corporate shareholders, $13,346,000 of the fund’s income qualifies for the dividends-received deduction.
| Information on Proxy Voting Policies, Procedures, and Records |
A description of the policies and procedures used by T. Rowe Price funds and portfolios to determine how to vote proxies relating to portfolio securities is available in each fund’s Statement of Additional Information. You may request this document by calling 1-800-225-5132 or by accessing the SEC’s website, sec.gov.
The description of our proxy voting policies and procedures is also available on our website, troweprice.com. To access it, click on the words “Social Responsibility” at the top of our corporate homepage. Next, click on the words “Conducting Business Responsibly” on the left side of the page that appears. Finally, click on the words “Proxy Voting Policies” on the left side of the page that appears.
Each fund’s most recent annual proxy voting record is available on our website and through the SEC’s website. To access it through our website, follow the above directions to reach the “Conducting Business Responsibly” page. Click on the words “Proxy Voting Records” on the left side of that page, and then click on the “View Proxy Voting Records” link at the bottom of the page that appears.
| How to Obtain Quarterly Portfolio Holdings |
The fund files a complete schedule of portfolio holdings with the Securities and Exchange Commission for the first and third quarters of each fiscal year on Form N-Q. The fund’s Form N-Q is available electronically on the SEC’s website (sec.gov); hard copies may be reviewed and copied at the SEC’s Public Reference Room, 100 F St. N.E., Washington, DC 20549. For more information on the Public Reference Room, call 1-800-SEC-0330.
| Approval of Investment Management Agreement |
On March 13, 2015, the fund’s Board of Directors (Board), including a majority of the fund’s independent directors, approved the continuation of the investment management agreement (Advisory Contract) between the fund and its investment advisor, T. Rowe Price Associates, Inc. (Advisor). In connection with its deliberations, the Board requested, and the Advisor provided, such information as the Board (with advice from independent legal counsel) deemed reasonably necessary. The Board considered a variety of factors in connection with its review of the Advisory Contract, also taking into account information provided by the Advisor during the course of the year, as discussed below:
Services Provided by the Advisor
The Board considered the nature, quality, and extent of the services provided to the fund by the Advisor. These services included, but were not limited to, directing the fund’s investments in accordance with its investment program and the overall management of the fund’s portfolio, as well as a variety of related activities such as financial, investment operations, and administrative services; compliance; maintaining the fund’s records and registrations; and shareholder communications. The Board also reviewed the background and experience of the Advisor’s senior management team and investment personnel involved in the management of the fund, as well as the Advisor’s compliance record. The Board concluded that it was satisfied with the nature, quality, and extent of the services provided by the Advisor.
Investment Performance of the Fund
The Board reviewed the fund’s three-month, one-year, and year-by-year returns, as well as the fund’s average annualized total returns over the 3-, 5-, and 10-year periods, and compared these returns with a wide variety of previously agreed-upon comparable performance measures and market data, including those supplied by Lipper and Morningstar, which are independent providers of mutual fund data.
On the basis of this evaluation and the Board’s ongoing review of investment results, and factoring in the relative market conditions during certain of the performance periods, the Board concluded that the fund’s performance was satisfactory.
Costs, Benefits, Profits, and Economies of Scale
The Board reviewed detailed information regarding the revenues received by the Advisor under the Advisory Contract and other benefits that the Advisor (and its affiliates) may have realized from its relationship with the fund, including any research received under “soft dollar” agreements and commission-sharing arrangements with broker-dealers. The Board considered that the Advisor may receive some benefit from soft-dollar arrangements pursuant to which research is received from broker-dealers that execute the applicable fund’s portfolio transactions. The Board received information on the estimated costs incurred and profits realized by the Advisor from managing T. Rowe Price mutual funds. The Board also reviewed estimates of the profits realized from managing the fund in particular, and the Board concluded that the Advisor’s profits were reasonable in light of the services provided to the fund.
The Board also considered whether the fund benefits under the fee levels set forth in the Advisory Contract from any economies of scale realized by the Advisor. Under the Advisory Contract, the fund pays a fee to the Advisor for investment management services composed of two components—a group fee rate based on the combined average net assets of most of the T. Rowe Price mutual funds (including the fund) that declines at certain asset levels and an individual fund fee rate based on the fund’s average daily net assets—and the fund pays its own expenses of operations. At the March 13, 2015, meeting, the Board approved an additional 0.005% breakpoint to the group fee schedule, effective May 1, 2015. With the new breakpoint, the group fee rate will decline to 0.270% when the combined average net assets of the applicable T. Rowe Price funds exceed $500 billion. The Board concluded that the advisory fee structure for the fund continued to provide for a reasonable sharing of benefits from any economies of scale with the fund’s investors.
Fees
The Board was provided with information regarding industry trends in management fees and expenses, and the Board reviewed the fund’s management fee rate, operating expenses, and total expense ratio in comparison with fees and expenses of other comparable funds based on information and data supplied by Lipper. After including reductions of the management fee that resulted from the fund’s investments in other T. Rowe Price funds, the information provided to the Board indicated that the fund’s management fee rate and total expense ratio were at or below the median for comparable funds.
The Board also reviewed the fee schedules for institutional accounts and private accounts with similar mandates that are advised or subadvised by the Advisor and its affiliates. Management provided the Board with information about the Advisor’s responsibilities and services provided to institutional account clients, including information about how the requirements and economics of the institutional business are fundamentally different from those of the mutual fund business. The Board considered information showing that the mutual fund business is generally more complex from a business and compliance perspective than the institutional business and that the Advisor generally performs significant additional services and assumes greater risk in managing the fund and other T. Rowe Price mutual funds than it does for institutional account clients.
On the basis of the information provided and the factors considered, the Board concluded that the fees paid by the fund under the Advisory Contract are reasonable.
Approval of the Advisory Contract
As noted, the Board approved the continuation of the Advisory Contract. No single factor was considered in isolation or to be determinative to the decision. Rather, the Board concluded, in light of a weighting and balancing of all factors considered, that it was in the best interests of the fund and its shareholders for the Board to approve the continuation of the Advisory Contract (including the fees to be charged for services thereunder). The independent directors were advised throughout the process by independent legal counsel.
| About the Fund’s Directors and Officers |
Your fund is overseen by a Board of Directors (Board) that meets regularly to review a wide variety of matters affecting or potentially affecting the fund, including performance, investment programs, compliance matters, advisory fees and expenses, service providers, and business and regulatory affairs. The Board elects the fund’s officers, who are listed in the final table. At least 75% of the Board’s members are independent of T. Rowe Price Associates, Inc. (T. Rowe Price), and its affiliates; “inside” or “interested” directors are employees or officers of T. Rowe Price. The business address of each director and officer is 100 East Pratt Street, Baltimore, Maryland 21202. The Statement of Additional Information includes additional information about the fund directors and is available without charge by calling a T. Rowe Price representative at 1-800-638-5660.
| Independent Directors | ||
| Name | ||
| (Year of Birth) | ||
| Year Elected* | ||
| [Number of T. Rowe Price | Principal Occupation(s) and Directorships of Public Companies and | |
| Portfolios Overseen] | Other Investment Companies During the Past Five Years | |
| William R. Brody, M.D., Ph.D. | President and Trustee, Salk Institute for Biological Studies (2009 to | |
| (1944) | present); Director, BioMed Realty Trust (2013 to present); Director, | |
| 2009 | Novartis, Inc. (2009 to 2014); Director, IBM (2007 to present) | |
| [165] | ||
| Anthony W. Deering | Chairman, Exeter Capital, LLC, a private investment firm (2004 to | |
| (1945) | present); Director, Brixmor Real Estate Investment Trust (2012 to | |
| 2001 | present); Director and Advisory Board Member, Deutsche Bank North | |
| [165] | America (2004 to present); Director, Under Armour (2008 to present); | |
| Director, Vornado Real Estate Investment Trust (2004 to 2012) | ||
| Donald W. Dick, Jr. | Principal, EuroCapital Partners, LLC, an acquisition and management | |
| (1943) | advisory firm (1995 to present) | |
| 1994 | ||
| [165] | ||
| Bruce W. Duncan | President, Chief Executive Officer, and Director, First Industrial | |
| (1951) | Realty Trust, an owner and operator of industrial properties (2009 | |
| 2013 | to present); Chairman of the Board (2005 to present) and Director | |
| [165] | (1999 to present), Starwood Hotels & Resorts, a hotel and | |
| leisure company | ||
| Robert J. Gerrard, Jr. | Chairman of Compensation Committee and Director, Syniverse | |
| (1952) | Holdings, Inc., a provider of wireless voice and data services for | |
| 2012 | telecommunications companies (2008 to 2011); Advisory Board | |
| [165] | Member, Pipeline Crisis/Winning Strategies, a collaborative working | |
| to improve opportunities for young African Americans (1997 | ||
| to present) | ||
| Karen N. Horn | Limited Partner and Senior Managing Director, Brock Capital Group, | |
| (1943) | an advisory and investment banking firm (2004 to present); Director, | |
| 2003 | Eli Lilly and Company (1987 to present); Director, Simon Property | |
| [165] | Group (2004 to present); Director, Norfolk Southern (2008 to present) | |
| Paul F. McBride | Former Company Officer and Senior Vice President, Human | |
| (1956) | Resources and Corporate Initiatives, Black & Decker Corporation | |
| 2013 | (2004 to 2010) | |
| [165] | ||
| Cecilia E. Rouse, Ph.D. | Dean, Woodrow Wilson School (2012 to present); Professor and | |
| (1963) | Researcher, Princeton University (1992 to present); Director, MDRC, | |
| 2012 | a nonprofit education and social policy research organization | |
| [165] | (2011 to present); Member, National Academy of Education (2010 | |
| to present); Research Associate, National Bureau of Economic | ||
| Research’s Labor Studies Program (2011 to present); Member, | ||
| President’s Council of Economic Advisers (2009 to 2011); Chair | ||
| of Committee on the Status of Minority Groups in the Economic | ||
| Profession, American Economic Association (2012 to present) | ||
| John G. Schreiber | Owner/President, Centaur Capital Partners, Inc., a real estate | |
| (1946) | investment company (1991 to present); Cofounder and Partner, | |
| 2001 | Blackstone Real Estate Advisors, L.P. (1992 to present); Director, | |
| [165] | General Growth Properties, Inc. (2010 to 2013); Director, Blackstone | |
| Mortgage Trust, a real estate financial company (2012 to present); | ||
| Director and Chairman of the Board, Brixmor Property Group, Inc. | ||
| (2013 to present); Director, Hilton Worldwide (2013 to present); | ||
| Director, Hudson Pacific Properties (2014 to present) | ||
| Mark R. Tercek | President and Chief Executive Officer, The Nature Conservancy (2008 | |
| (1957) | to present) | |
| 2009 | ||
| [165] | ||
| *Each independent director serves until retirement, resignation, or election of a successor. | ||
| Inside Directors | ||
| Name | ||
| (Year of Birth) | ||
| Year Elected* | ||
| [Number of T. Rowe Price | Principal Occupation(s) and Directorships of Public Companies and | |
| Portfolios Overseen] | Other Investment Companies During the Past Five Years | |
| Edward C. Bernard | Director and Vice President, T. Rowe Price; Vice Chairman of the | |
| (1956) | Board, Director, and Vice President, T. Rowe Price Group, Inc.; | |
| 2006 | Chairman of the Board, Director, and President, T. Rowe Price | |
| [165] | Investment Services, Inc.; Chairman of the Board and Director, | |
| T. Rowe Price Retirement Plan Services, Inc., and T. Rowe Price | ||
| Services, Inc.; Chairman of the Board, Chief Executive Officer, | ||
| Director, and President, T. Rowe Price International and T. Rowe | ||
| Price Trust Company; Chairman of the Board, all funds | ||
| Brian C. Rogers, CFA, CIC | Chief Investment Officer, Director, and Vice President, T. Rowe Price; | |
| (1955) | Chairman of the Board, Chief Investment Officer, Director, and Vice | |
| 2006 | President, T. Rowe Price Group, Inc.; Vice President, T. Rowe Price | |
| [111] | Trust Company; Vice President, Personal Strategy Funds | |
| *Each inside director serves until retirement, resignation, or election of a successor. | ||
| Officers | ||
| Name (Year of Birth) | ||
| Position Held With Personal Strategy Funds | Principal Occupation(s) | |
| Christopher D. Alderson (1962) | Company’s Representative, Director and Vice | |
| Vice President | President, Price Hong Kong; Director and Vice | |
| President, Price Singapore and T. Rowe Price | ||
| International; Vice President, T. Rowe Price | ||
| Group, Inc. | ||
| E. Frederick Bair, CFA, CPA (1969) | Vice President, T. Rowe Price, T. Rowe Price | |
| Vice President | Group, Inc., and T. Rowe Price Trust Company | |
| Brian W.H. Berghuis, CFA (1958) | Vice President, T. Rowe Price, T. Rowe Price | |
| Vice President | Group, Inc., and T. Rowe Price Trust Company | |
| Darrell N. Braman (1963) | Vice President, Price Hong Kong, Price | |
| Vice President | Singapore, T. Rowe Price, T. Rowe Price Group, | |
| Inc., T. Rowe Price International, T. Rowe Price | ||
| Investment Services, Inc., and T. Rowe Price | ||
| Services, Inc. | ||
| Jerome A. Clark, CFA (1961) | Vice President, T. Rowe Price, T. Rowe Price | |
| Vice President | Group, Inc., T. Rowe Price Investment Services, | |
| Inc., and T. Rowe Price Trust Company | ||
| Kimberly E. DeDominicis (1976) | Vice President, T. Rowe Price, T. Rowe Price | |
| Vice President | Group, Inc., and T. Rowe Price International | |
| Mark S. Finn, CFA, CPA (1963) | Vice President, T. Rowe Price, T. Rowe Price | |
| Vice President | Group, Inc., and T. Rowe Price Trust Company | |
| John R. Gilner (1961) | Chief Compliance Officer and Vice President, | |
| Chief Compliance Officer | T. Rowe Price; Vice President, T. Rowe Price | |
| Group, Inc., and T. Rowe Price Investment | ||
| Services, Inc. | ||
| David R. Giroux, CFA (1975) | Vice President, T. Rowe Price, T. Rowe Price | |
| Vice President | Group, Inc., and T. Rowe Price Trust Company | |
| Gregory K. Hinkle, CPA (1958) | Vice President, T. Rowe Price, T. Rowe Price | |
| Treasurer | Group, Inc., and T. Rowe Price Trust Company | |
| Ian D. Kelson (1956) | Director and Vice President, T. Rowe Price | |
| Vice President | International; Vice President, T. Rowe Price | |
| Group, Inc. | ||
| Wyatt A. Lee, CFA (1971) | Vice President, T. Rowe Price, T. Rowe Price | |
| Vice President | Group, Inc., and T. Rowe Price Trust Company | |
| Patricia B. Lippert (1953) | Assistant Vice President, T. Rowe Price and | |
| Secretary | T. Rowe Price Investment Services, Inc. | |
| Raymond A. Mills, Ph.D., CFA (1960) | Vice President, T. Rowe Price, T. Rowe Price | |
| Vice President | Group, Inc., T. Rowe Price International, and | |
| T. Rowe Price Trust Company | ||
| David Oestreicher (1967) | Director, Vice President, and Secretary, T. Rowe | |
| Vice President | Price Investment Services, Inc., T. Rowe Price | |
| Retirement Plan Services, Inc., T. Rowe | ||
| Price Services, Inc., and T. Rowe Price Trust | ||
| Company; Chief Legal Officer, Vice President, | ||
| and Secretary, T. Rowe Price Group, Inc.; Vice | ||
| President and Secretary, T. Rowe Price and | ||
| T. Rowe Price International; Vice President, | ||
| Price Hong Kong and Price Singapore | ||
| Larry J. Puglia, CFA, CPA (1960) | Vice President, T. Rowe Price, T. Rowe Price | |
| Vice President | Group, Inc., and T. Rowe Price Trust Company | |
| John W. Ratzesberger (1975) | Vice President, T. Rowe Price, T. Rowe Price | |
| Vice President | Group, Inc., and T. Rowe Price Trust Company; | |
| formerly, North American Head of Listed | ||
| Derivatives Operation, Morgan Stanley | ||
| (to 2013) | ||
| Deborah D. Seidel (1962) | Vice President, T. Rowe Price, T. Rowe Price | |
| Vice President | Group, Inc., T. Rowe Price Investment Services, | |
| Inc., and T. Rowe Price Services, Inc. | ||
| Daniel O. Shackelford, CFA (1958) | Vice President, T. Rowe Price, T. Rowe Price | |
| Vice President | Group, Inc., and T. Rowe Price Trust Company | |
| Charles M. Shriver, CFA (1967) | Vice President, T. Rowe Price, T. Rowe Price | |
| President | Group, Inc., and T. Rowe Price Trust Company | |
| Robert W. Smith (1961) | Vice President, T. Rowe Price, T. Rowe Price | |
| Vice President | Group, Inc., and T. Rowe Price Trust Company | |
| Guido F. Stubenrauch (1970) | Vice President, T. Rowe Price and T. Rowe Price | |
| Vice President | Group, Inc. | |
| Toby M. Thompson, CFA, CAIA (1971) | Vice President, T. Rowe Price and T. Rowe Price | |
| Vice President | Group, Inc.; formerly, Director of Investments, | |
| I.A.M. National Pension Fund (to 2012) | ||
| Mark J. Vaselkiv (1958) | Vice President, T. Rowe Price, T. Rowe Price | |
| Vice President | Group, Inc., and T. Rowe Price Trust Company | |
| Richard T. Whitney, CFA (1958) | Vice President, T. Rowe Price, T. Rowe Price | |
| Vice President | Group, Inc., T. Rowe Price International, and | |
| T. Rowe Price Trust Company | ||
| Jeffrey T. Zoller (1970) | Vice President, T. Rowe Price and T. Rowe Price | |
| Vice President | Trust Company | |
| Unless otherwise noted, officers have been employees of T. Rowe Price or T. Rowe Price International for at least 5 years. | ||
Item 2. Code of Ethics.
The registrant has adopted a code of ethics, as defined in Item 2 of Form N-CSR, applicable to its principal executive officer, principal financial officer, principal accounting officer or controller, or persons performing similar functions. A copy of this code of ethics is filed as an exhibit to this Form N-CSR. No substantive amendments were approved or waivers were granted to this code of ethics during the period covered by this report.
Item 3. Audit Committee Financial Expert.
The registrant’s Board of Directors/Trustees has determined that Mr. Bruce W. Duncan qualifies as an audit committee financial expert, as defined in Item 3 of Form N-CSR. Mr. Duncan is considered independent for purposes of Item 3 of Form N-CSR.
Item 4. Principal Accountant Fees and Services.
(a) – (d) Aggregate fees billed for the last two fiscal years for professional services rendered to, or on behalf of, the registrant by the registrant’s principal accountant were as follows:
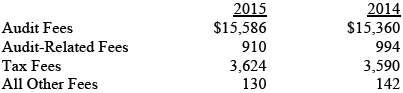
Audit fees include amounts related to the audit of the registrant’s annual financial statements and services normally provided by the accountant in connection with statutory and regulatory filings. Audit-related fees include amounts reasonably related to the performance of the audit of the registrant’s financial statements and specifically include the issuance of a report on internal controls and, if applicable, agreed-upon procedures related to fund acquisitions. Tax fees include amounts related to services for tax compliance, tax planning, and tax advice. The nature of these services specifically includes the review of distribution calculations and the preparation of Federal, state, and excise tax returns. All other fees include the registrant’s pro-rata share of amounts for agreed-upon procedures in conjunction with service contract approvals by the registrant’s Board of Directors/Trustees.
(e)(1) The registrant’s audit committee has adopted a policy whereby audit and non-audit services performed by the registrant’s principal accountant for the registrant, its investment adviser, and any entity controlling, controlled by, or under common control with the investment adviser that provides ongoing services to the registrant require pre-approval in advance at regularly scheduled audit committee meetings. If such a service is required between regularly scheduled audit committee meetings, pre-approval may be authorized by one audit committee member with ratification at the next scheduled audit committee meeting. Waiver of pre-approval for audit or non-audit services requiring fees of a de minimis amount is not permitted.
(2) No services included in (b) – (d) above were approved pursuant to paragraph (c)(7)(i)(C) of Rule 2-01 of Regulation S-X.
(f) Less than 50 percent of the hours expended on the principal accountant’s engagement to audit the registrant’s financial statements for the most recent fiscal year were attributed to work performed by persons other than the principal accountant’s full-time, permanent employees.
(g) The aggregate fees billed for the most recent fiscal year and the preceding fiscal year by the registrant’s principal accountant for non-audit services rendered to the registrant, its investment adviser, and any entity controlling, controlled by, or under common control with the investment adviser that provides ongoing services to the registrant were $2,677,000 and $1,759,000, respectively.
(h) All non-audit services rendered in (g) above were pre-approved by the registrant’s audit committee. Accordingly, these services were considered by the registrant’s audit committee in maintaining the principal accountant’s independence.
Item 5. Audit Committee of Listed Registrants.
Not applicable.
Item 6. Investments.
(a) Not applicable. The complete schedule of investments is included in Item 1 of this Form N-CSR.
(b) Not applicable.
Item 7. Disclosure of Proxy Voting Policies and Procedures for Closed-End Management Investment Companies.
Not applicable.
Item 8. Portfolio Managers of Closed-End Management Investment Companies.
Not applicable.
Item 9. Purchases of Equity Securities by Closed-End Management Investment Company and Affiliated Purchasers.
Not applicable.
Item 10. Submission of Matters to a Vote of Security Holders.
Not applicable.
Item 11. Controls and Procedures.
(a) The registrant’s principal executive officer and principal financial officer have evaluated the registrant’s disclosure controls and procedures within 90 days of this filing and have concluded that the registrant’s disclosure controls and procedures were effective, as of that date, in ensuring that information required to be disclosed by the registrant in this Form N-CSR was recorded, processed, summarized, and reported timely.
(b) The registrant’s principal executive officer and principal financial officer are aware of no change in the registrant’s internal control over financial reporting that occurred during the registrant’s second fiscal quarter covered by this report that has materially affected, or is reasonably likely to materially affect, the registrant’s internal control over financial reporting.
Item 12. Exhibits.
(a)(1) The registrant’s code of ethics pursuant to Item 2 of Form N-CSR is attached.
(b) A certification by the registrant's principal executive officer and principal financial officer, pursuant to Section 906 of the Sarbanes-Oxley Act of 2002 and required by Rule 30a-2(b) under the Investment Company Act of 1940, is attached.
SIGNATURES
Pursuant to the requirements of the Securities Exchange Act of 1934 and the Investment Company Act of 1940, the registrant has duly caused this report to be signed on its behalf by the undersigned, thereunto duly authorized.
T. Rowe Price Personal Strategy Funds, Inc.
| By | /s/ Edward C. Bernard | |
| Edward C. Bernard | ||
| Principal Executive Officer | ||
| Date July 16, 2015 | ||
Pursuant to the requirements of the Securities Exchange Act of 1934 and the Investment Company Act of 1940, this report has been signed below by the following persons on behalf of the registrant and in the capacities and on the dates indicated.
| By | /s/ Edward C. Bernard | |
| Edward C. Bernard | ||
| Principal Executive Officer | ||
| Date July 16, 2015 | ||
| By | /s/ Gregory K. Hinkle | |
| Gregory K. Hinkle | ||
| Principal Financial Officer | ||
| Date July 16, 2015 | ||