UNITED STATES
SECURITIES AND EXCHANGE COMMISSION
Washington, D.C. 20549
FORM N-CSR
CERTIFIED SHAREHOLDER REPORT OF REGISTERED
MANAGEMENT INVESTMENT COMPANIES
Investment Company Act File Number: 811-07173
| T. Rowe Price Personal Strategy Funds, Inc. |
|
| (Exact name of registrant as specified in charter) |
| |
| 100 East Pratt Street, Baltimore, MD 21202 |
|
| (Address of principal executive offices) |
| |
| David Oestreicher |
| 100 East Pratt Street, Baltimore, MD 21202 |
|
| (Name and address of agent for service) |
Registrant’s telephone number, including area code: (410) 345-2000
Date of fiscal year end: May 31
Date of reporting period: November 30, 2017
Item 1. Report to Shareholders
| Personal Strategy Growth Fund | November 30, 2017 |
The views and opinions in this report were current as of November 30, 2017. They are not guarantees of performance or investment results and should not be taken as investment advice. Investment decisions reflect a variety of factors, and the managers reserve the right to change their views about individual stocks, sectors, and the markets at any time. As a result, the views expressed should not be relied upon as a forecast of the fund’s future investment intent. The report is certified under the Sarbanes-Oxley Act, which requires mutual funds and other public companies to affirm that, to the best of their knowledge, the information in their financial reports is fairly and accurately stated in all material respects.
REPORTS ON THE WEB
Sign up for our Email Program, and you can begin to receive updated fund reports and prospectuses online rather than through the mail. Log in to your account at troweprice.com for more information.
Manager’s Letter
Fellow Shareholders
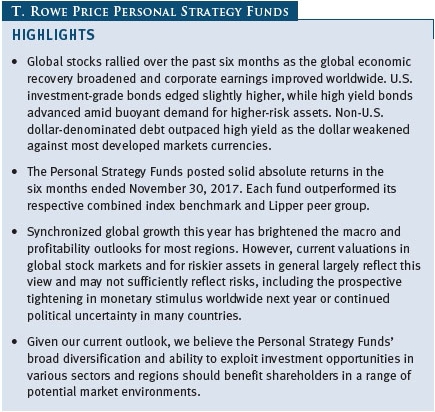
Stocks and bonds worldwide strengthened over the past six months as the global economic upswing that began at the end of 2016 continued to gain momentum in 2017. The major U.S. stock market indexes repeatedly hit record highs as corporate earnings rose and investors anticipated that corporate tax cuts would boost profits even further. Stocks in international developed and emerging markets posted strong returns as growth in Europe and Japan accelerated and global demand lifted commodity exporters in the developing world. In fixed income, U.S. investment-grade bonds edged higher, while high yield bonds gained on rising oil prices and steady demand for higher-yielding assets. Non-U.S. dollar-denominated debt advanced as the dollar fell against most developed markets currencies. Against this positive backdrop, the Personal Strategy Funds generated modest absolute returns over the six months ended November 30, 2017, and outperformed their respective combined index benchmarks.
MARKET ENVIRONMENT
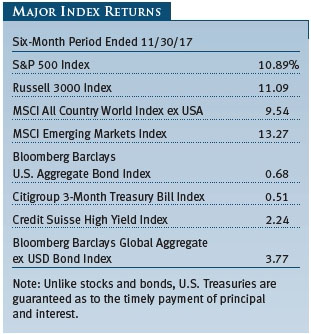
Signs of a global economic recovery grew more plentiful over the past six months, pointing to “the broadest synchronized upswing the world economy has experienced in the last decade,” as the International Monetary Fund stated in July. The S&P 500 Index and other U.S. stock market indexes hit record levels amid better-than-expected earnings and optimism about tax changes and other pro-business policies under President Donald Trump. Small-cap stocks outperformed their large-and mid-cap counterparts. The U.S. economy expanded at an upwardly revised 3.2% annual rate in the third quarter of 2017, its strongest growth pace in three years, raising hopes that the economy may be emerging from the modest growth trend seen since the recession ended in 2009. The Federal Reserve raised short-term interest rates by 25 basis points in March and June as the central bank continued to unwind its accommodative monetary policy in place since the 2008 financial crisis. (The Fed raised rates for the third time this year on December 13, 2017, after our reporting period ended.)
Stocks in developed European markets rose as corporate earnings and economic growth picked up across the Continent. The eurozone economy grew 2.6% year-over-year in the third quarter of 2017, marking the currency area’s highest growth rate since the start of 2011. The strengthening recovery led the European Central Bank to announce that it would reduce the size of its monthly bond purchases starting in January 2018 and extend the program until September and possibly longer, despite inflation remaining well below the bank’s target. Japanese stocks rallied as the country’s economy gained steam. Japan’s gross domestic product expanded an upwardly revised 2.5% annual pace in the third quarter, marking the country’s seventh straight quarter of growth and longest expansion in 16 years. However, inflation in Japan is still far from its official target, and years of ultra-loose monetary policy have so far failed to boost weak household spending. Emerging markets stocks were bolstered by signs of improving global demand, rising corporate earnings, and strong growth in China.
U.S. investment-grade bonds generated slightly positive returns. Treasury yields decreased in the first half of our reporting period but retraced their declines in subsequent months as investors anticipated that the Fed would gradually tighten policy and that inflation would slowly pick up. Most Treasury yields ended the period at higher levels than at the start, with the yield on the benchmark 10-year note increasing to 2.42% at the end of November from 2.21% at the end of May. High yield bonds outperformed their investment-grade peers as rising oil prices brightened the outlook for the energy companies that compose a large part of the high yield market. Low yields on sovereign bonds in most developed markets outside the U.S. also fueled demand for credit, including high yield bonds.

Non-U.S. dollar-denominated bonds in developed markets gained as the dollar fell against most developed markets currencies over the period, continuing a depreciation trend that began in January. Over the past six months, the euro and British pound strengthened roughly 6% and 5% against the dollar, respectively, while the Japanese yen slightly declined. The gains in most global currencies versus the dollar helped offset declining prices of government bonds in local currency terms as yields increased in many developed markets. Dollar-denominated emerging markets bonds advanced as relatively higher interest rates in developing countries drew yield-seeking investors.
PORTFOLIO REVIEW AND POSITIONING
Asset Allocation
The Personal Strategy Funds have the ability to overweight or underweight allocations to asset classes or sub-asset classes based on the views of the T. Rowe Price Asset Allocation Committee. The committee meets every month to evaluate economic, market, and earnings trends and to look for opportunities over a 6- to 18-month investment horizon. We typically seek to overweight segments of the market that we believe are undervalued and underweight areas that appear fully valued. Several years of strong performance have left valuations at or above fair value in many asset classes, which has decreased the number of compelling investment opportunities. However, we continue to find opportunities in select areas where valuations appear more attractive and have reduced allocations where we see potential risks.
As of November 30, 2017, we are underweight stocks relative to bonds. We maintained this allocation over the reporting period given our view of extended stock valuations, especially in the U.S., and elevated earnings expectations in an environment of modest economic growth. On the other hand, we believe that bonds offer downside protection despite low yields and extended duration. Though interest rates globally are on track to gradually rise in the coming months, inflation remains tame in most markets.
Stocks
We ended the period overweight to international stocks relative to U.S. stocks. We increased our overweight allocation over the past six months given our view that valuations in the U.S. appear extended relative to stocks in overseas markets, which are benefiting from stronger economic growth, positive earnings trends, and greater exposure to improving global trade. Over the summer, we gradually moved our allocation to emerging markets stocks relative to developed markets stocks from underweight to neutral. Our positioning shift reflected a lower risk of protectionist trade policies being implemented by the Trump administration, as well as supportive economic and earnings growth trends in emerging markets. While the runup in emerging markets stocks has pushed valuations slightly above their historical averages, they are still attractively valued versus their developed markets peers.
We maintained an underweight to real assets equities over the period. This stance reflects our continued caution regarding long-term imbalances between global energy supply and demand and our expectations for a slowdown in China, whose government has prioritized slower but more sustainable economic growth in the coming years. As for real estate investment trusts, we believe that they are fairly valued and vulnerable to rising interest rates.
We gradually increased our overweight to U.S. small-cap stocks and associated underweight to large-cap stocks as small-cap stocks lagged large-caps for much of this year, making their relative valuations more attractive as a result. Moreover, despite the strong outperformance of large-cap stocks, market leadership has been driven by a few technology and consumer-related companies. We ended the period neutral between U.S. growth and value stocks after reducing our overweight to growth stocks over the summer following a period of significant outperformance. We eliminated our underweight to value, as value-focused sectors such as financials and energy could benefit from increased spending, tax cuts, and deregulation—though we believe that low economic growth could restrain the impact of such measures.
Bonds
We moved to an underweight allocation to high yield bonds relative to U.S. investment-grade bonds in August, departing from a previously neutral stance as valuations became less compelling following a period of strong performance in the high yield sector. Despite the yield advantage that high yield debt has over investment-grade bonds, we believed that high yield bonds offered limited upside potential, particularly if energy prices were to fall or other risks materialized. Our neutral positioning between emerging markets bonds and U.S. investment-grade bonds stayed constant as strong performance for emerging markets bonds in 2017 made their valuations less appealing. While developing economies are broadly in better fiscal shape than they were just a few years ago, individual countries differ widely in their fiscal positions, political stability, and reform progress.
We stayed underweight to nondollar bonds relative to U.S. investment-grade bonds and increased the size of our underweight in the fall. Developed markets bonds outside the U.S. have a less attractive outlook due to their low yields and long duration, and European bonds are at risk for capital losses as the European Central Bank draws closer to scaling back its quantitative easing program. Moreover, yields on U.S. investment-grade bonds are the highest among developed markets, and the Fed is expected to continue gradually tightening policy in the coming years.
Recent Changes to Underlying Investment Strategies
At the end of 2017, we introduced three new investment strategies to the Personal Strategy Funds: the Floating Rate Fund, the U.S. Treasury Long-Term Fund, and the International Bond Fund (USD hedged). These changes are being implemented within the fixed income allocation across the three Personal Strategy Funds, and the process of fully integrating these changes is expected to occur over an extended period of time.
The Floating Rate Fund seeks to generate high current income with a lesser focus on capital appreciation by investing in floating rate bank loans and bonds. The U.S. Treasury Long-Term Fund aims to generate a high level of income through investments in long-term U.S. Treasury securities. This fund’s weighted average maturity typically ranges from 15 to 20 years but may range from 10 to 30 years. Finally, the International Bond Fund (USD hedged) invests in investment-grade, nondollar-denominated bonds, most of which are hedged to the U.S. dollar. This fund is intended to give U.S. investors exposure to potentially higher yields or favorable changes in interest rates in overseas bond markets, which often move independently of each other and U.S. markets.
The new underlying strategies are intended to increase the diversification benefits within the fixed income allocation for each of the Personal Strategy Funds. By incorporating a broader opportunity set within fixed income, the changes are designed to increase the funds’ ability to perform well in a variety of market conditions. However, the addition of these strategies will not change the overall strategic, or “neutral,” allocations assigned to the broad asset classes for each fund or its respective benchmark.
PERFORMANCE COMPARISON
Personal Strategy Income Fund
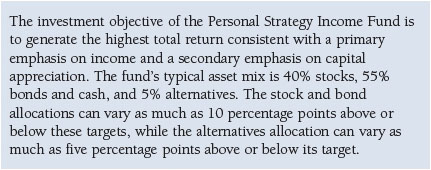
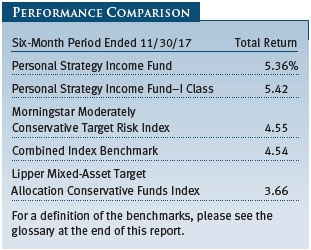
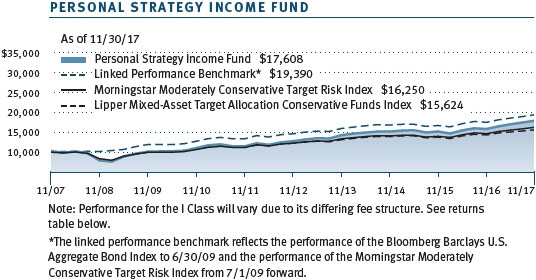
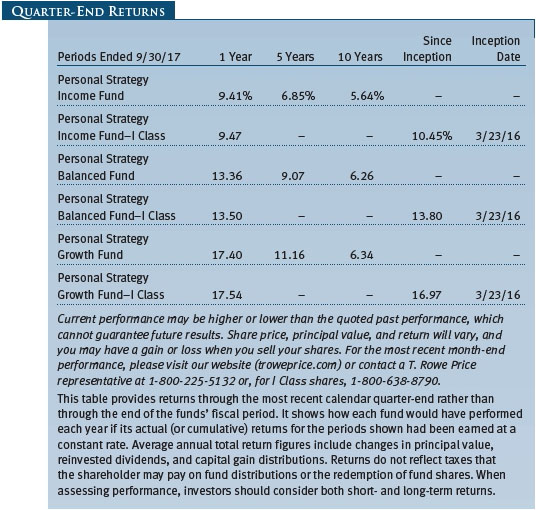
As shown in the Performance Comparison table, the Personal Strategy Income Fund returned 5.36% for the six months ended November 30, 2017, outperforming its combined index benchmark and Lipper peer group index. The Personal Strategy Income Fund’s performance versus its peers over longer time periods remained solid: The fund is in the top decile of its Lipper peer group for the trailing 1-, 3-, 5-, and 10-year periods. Based on cumulative total return, Lipper ranked the fund 7 of 353, 16 of 314, 9 of 287, and 12 of 214 mixed-asset target allocation conservative funds for the 1-, 3-, 5-, and 10-year periods, respectively, ended November 30, 2017. (Past performance cannot guarantee future results.)
Security selection in the fund’s underlying investments contributed the most to relative performance. Favorable security selection among the fund’s U.S. large-cap value and U.S. large-cap growth stocks added the most to relative returns, as these underlying strategies outpaced their respective benchmarks. Selection within the fund’s international and emerging markets equity strategies was also positive. A modest allocation to alternative investments through a hedge fund-of-funds also helped relative performance. On the other hand, selection in emerging markets bonds and small-cap stocks detracted from relative returns, as both underlying strategies trailed their respective benchmarks over the period.
The inclusion of diversifying sectors, especially those within fixed income, also helped relative performance. Our exposure to nondollar-denominated bonds in overseas markets lifted relative returns as most global currencies strengthened against the dollar. Additionally, our exposure to emerging markets and high yield bonds contributed to relative performance amid strong risk appetite and rising oil prices, which benefited the energy companies that dominate the high yield market. Conversely, an allocation to real assets weighed on relative returns, as this asset class lagged broader equity markets over the period.
Tactical decisions to overweight and underweight asset classes detracted from relative returns. Our underweight to stocks relative to bonds held back our performance versus the benchmark as stronger economic and corporate earnings growth worldwide drove a rally in global stock markets, while bonds produced more muted returns.
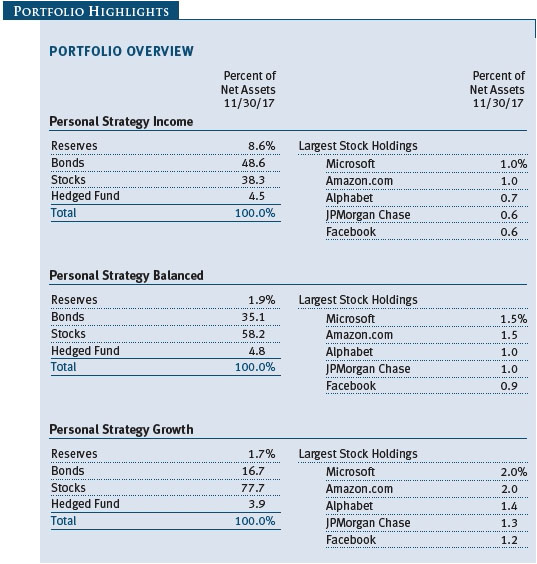
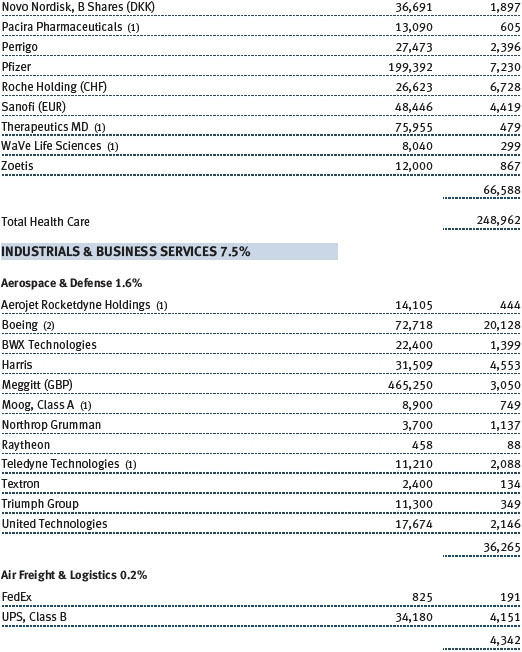
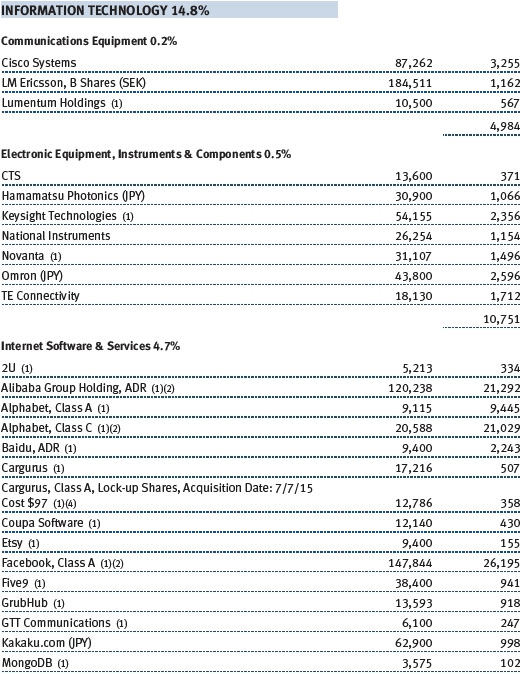
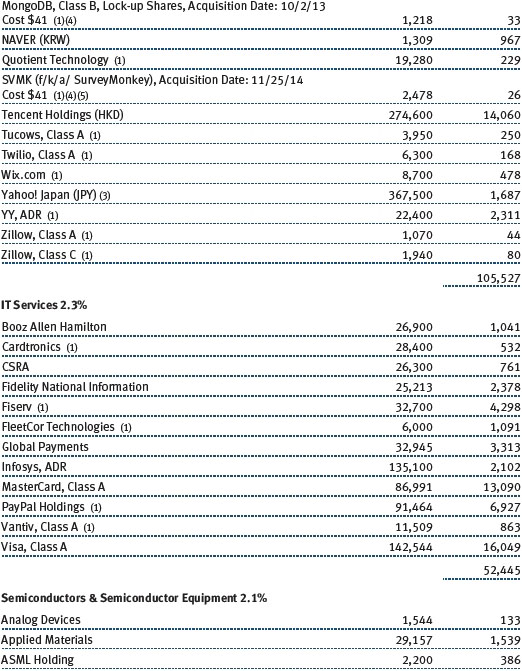
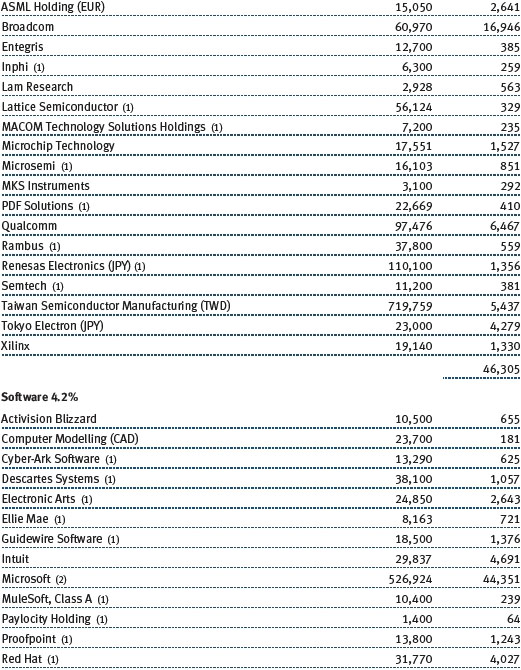
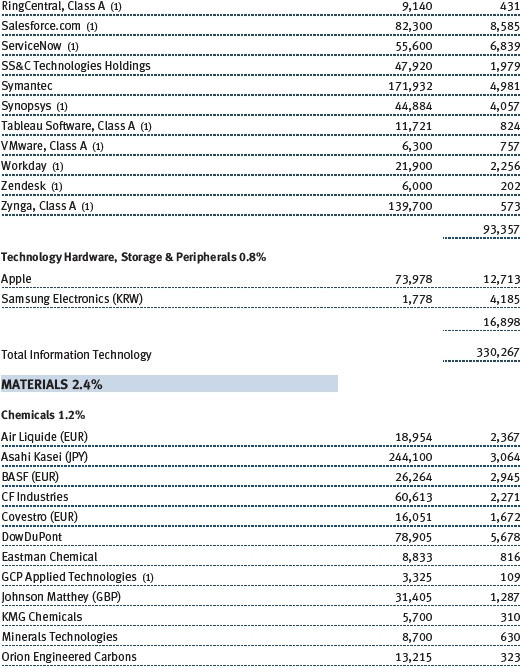
Microsoft, Amazon.com, and Facebook ranked among the fund’s top contributors to absolute returns as investors piled into fast-growing technology companies. Banks and industrial companies such as JPMorgan Chase, Morgan Stanley, and Boeing also performed well as investors bet that they would benefit from anticipated tax cuts, looser regulations, and infrastructure spending. Among non-U.S. stocks, Chinese Internet companies Alibaba and Tencent produced outsized gains as both solidified their dominance in China’s online economy. Large detractors included tobacco company Philip Morris International and drugmaker Merck, whose respective shares slumped after each reported disappointing third-quarter earnings, and utility PG&E, whose shares fell amid concerns about its potential liability in deadly wildfires that struck Northern California in October. (Please refer to the fund’s portfolio of investments for a complete list of holdings and the amount each represents in the portfolio.)
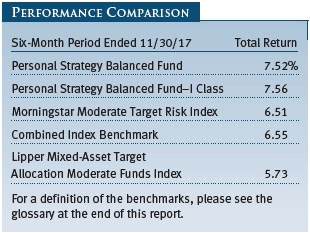
Personal Strategy Balanced Fund
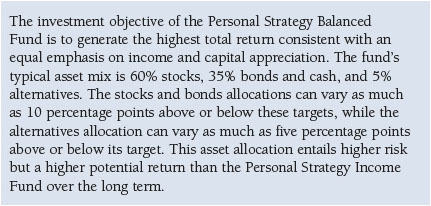
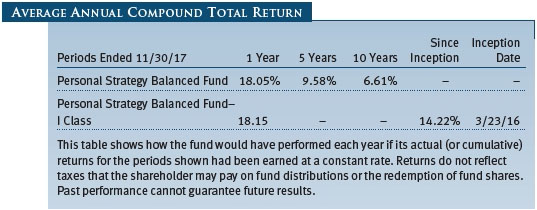
As shown in the Performance Comparison table, the Personal Strategy Balanced Fund returned 7.52% for the six months ended November 30, 2017, outperforming its combined index benchmark and Lipper peer group index. The Personal Strategy Balanced Fund’s performance versus its peers over longer time periods remained solid: The fund is in the top decile of its Lipper peer group for the trailing 1-, 3-, 5-, and 10-year periods. Based on cumulative total return, Lipper ranked the fund 19 of 549, 6 of 499, 40 of 452, and 12 of 343 mixed-asset target allocation moderate funds for the 1-, 3-, 5-, and 10-year periods, respectively, ended November 30, 2017. (Past performance cannot guarantee future results.)
Security selection in the fund’s underlying investments contributed the most to relative performance. Favorable security selection among the fund’s U.S. large-cap value and U.S. large-cap growth stocks added the most to relative returns, as these underlying strategies outpaced their respective benchmarks. Selection within the fund’s international and emerging markets equity strategies was also positive.
A modest allocation to alternative investments through a hedge fund-of-funds also helped relative performance. On the other hand, selection in emerging markets bonds and small-cap stocks detracted from relative returns, as both underlying strategies trailed their respective benchmarks over the period.
The inclusion of diversifying sectors, especially those within fixed income, also helped relative performance. Our exposure to nondollar-denominated bonds in overseas markets lifted relative returns as most global currencies strengthened against the dollar. Additionally, our exposure to emerging markets and high yield bonds contributed to relative performance amid strong risk appetite and rising oil prices, which benefited the energy companies that dominate the high yield market. An allocation to alternative investments through a hedge fund-of-funds also helped relative returns. Conversely, an allocation to real assets weighed on relative returns as this asset class lagged broader equity markets over the period.
Tactical decisions to overweight and underweight asset classes detracted from relative returns. Our underweight to stocks relative to bonds held back our performance versus the benchmark as stronger economic and corporate earnings growth worldwide drove a rally in global stock markets, while bonds produced more muted returns.
Microsoft, Amazon.com, and Facebook ranked among the fund’s top contributors to absolute returns as investors piled into fast-growing technology companies. Banks and industrial companies such as JPMorgan Chase, Morgan Stanley, and Boeing also performed well as investors bet that they would benefit from anticipated tax cuts, looser regulations, and infrastructure spending. Among non-U.S. stocks, Chinese Internet companies Alibaba and Tencent produced outsized gains as both solidified their dominance in China’s online economy. Large detractors included tobacco company Philip Morris International and drugmaker Merck, whose respective shares slumped after each reported disappointing third-quarter earnings, and utility PG&E, whose shares fell amid concerns about its potential liability in deadly wildfires that struck Northern California in October. (Please refer to the fund’s portfolio of investments for a complete list of holdings and the amount each represents in the portfolio.)
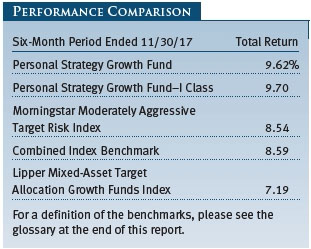
Personal Strategy Growth Fund
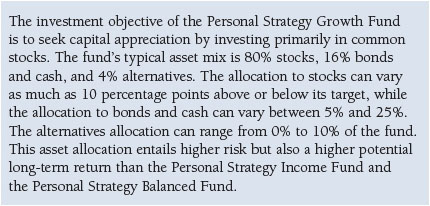
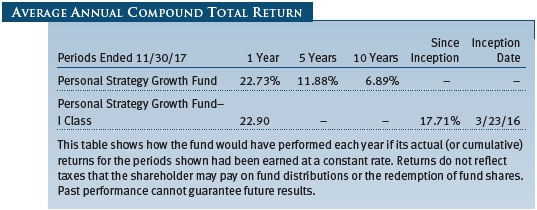
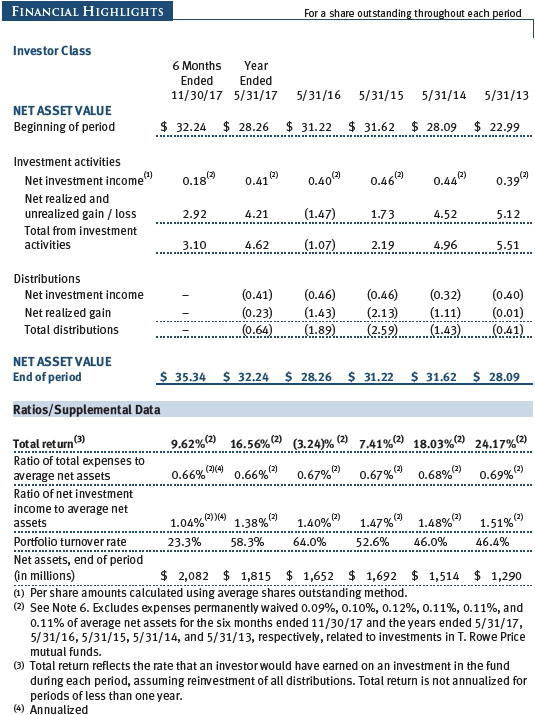
As shown in the Performance Comparison table, the Personal Strategy Growth Fund returned 9.62% for the six months ended November 30, 2017, outperforming its combined index benchmark and Lipper peer group index. The Personal Strategy Growth Fund’s performance versus its peers over longer time periods remained solid: The fund is in the top decile of its Lipper peer group for the trailing 1-, 3-, 5-, and 10-year periods. Based on cumulative total return, Lipper ranked the fund 3 of 503, 12 of 452, 13 of 424, and 26 of 316 mixed-asset target allocation growth funds for the 1-, 3-, 5-, and 10-year periods, respectively, ended November 30, 2017. (Past performance cannot guarantee future results.)
Security selection in the fund’s underlying investments contributed the most to relative performance. Favorable security selection among the fund’s U.S. large-cap value and U.S. large-cap growth stocks added the most to relative returns, as these underlying strategies outpaced their respective benchmarks. Selection within the fund’s international and emerging markets equity strategies was also positive. A modest allocation to alternative investments through a hedge fund-of-funds also helped relative performance. On the other hand, selection in emerging markets bonds and small-cap stocks detracted from relative returns, as both underlying strategies trailed their respective benchmarks over the period.
Tactical decisions to overweight and underweight asset classes detracted from relative returns. Our underweight to stocks relative to bonds held back our performance versus the benchmark as stronger economic and corporate earnings growth worldwide drove a rally in global stock markets, while bonds produced more muted returns.
The inclusion of diversifying sectors—especially those within equity—modestly detracted from relative performance. Allocations to real assets and an equity index option strategy weighed on relative returns. Conversely, our exposure to nondollar-denominated bonds in overseas markets lifted relative returns as most global currencies strengthened against the dollar, which extended its declines since January.
Microsoft, Amazon.com, and Facebook ranked among the fund’s top contributors to absolute returns as investors piled into fast-growing technology companies. Banks and industrial companies such as JPMorgan Chase, Morgan Stanley, and Boeing also performed well as investors bet that they would benefit from anticipated tax cuts, looser regulations, and infrastructure spending. Among non-U.S. stocks, Chinese Internet companies Alibaba and Tencent produced outsized gains as both solidified their dominance in China’s online economy. Large detractors included tobacco company Philip Morris International and drugmaker Merck, whose respective shares slumped after each reported disappointing third-quarter earnings, and utility PG&E, whose shares fell amid concerns about its potential liability in deadly wildfires that struck Northern California in October. (Please refer to the fund’s portfolio of investments for a complete list of holdings and the amount each represents in the portfolio.)
OUTLOOK
The broadening global economic recovery should be supportive for risk assets in 2018. However, relatively high stock valuations and low bond yields in many major markets provide little buffer against unexpected market events. Given elevated valuations, we believe that continued strong earnings growth will be required to sustain further stock market gains in the coming year. Regarding fixed income, we expect that low yields, tight credit spreads, and less accommodative central bank policies will leave little room for upside across most fixed income sectors. Despite this environment, bonds offer beneficial attributes within portfolios to counter potential periods of heightened stock market volatility.
Positive factors include the potential for U.S. corporate tax cuts to generate further earnings upside and for domestic demand-driven recoveries underway in Europe and Japan to underpin growth prospects in their respective markets. On the other hand, risks to our outlook include a rise in geopolitical or trade tensions or the possibility of a central bank policy misstep. We are encouraged by the supportive factors underpinning our current outlook but are mindful of the geopolitical and policy risks that could derail the current recovery. In light of the many crosscurrents that have the potential to impact global financial markets, we believe that the Personal Strategy Funds’ broad diversification and T. Rowe Price’s strengths in fundamental research will allow us to continue generating solid returns for our shareholders over the long run.
Thank you for investing with T. Rowe Price.
Respectfully submitted,

Charles Shriver
Portfolio manager and chairman of the funds’ Investment Advisory Committee
December 15, 2017
The committee chairman has day-to-day responsibility for managing the portfolios and works with committee members in developing and executing the funds’ investment programs.
RISKS OF INVESTING
As with all stock and bond mutual funds, each fund’s share price can fall because of weakness in the stock or bond markets, a particular industry, or specific holdings. Stock markets can decline for many reasons, including adverse political or economic developments, changes in investor psychology, or heavy institutional selling. The prospects for an industry or company may deteriorate because of a variety of factors, including disappointing earnings or changes in the competitive environment. In addition, the investment manager’s assessment of companies held in a fund may prove incorrect, resulting in losses or poor performance even in rising markets.
Bonds are subject to interest rate risk, the decline in bond prices that usually accompanies a rise in interest rates, and credit risk, the chance that any fund holding could have its credit rating downgraded or that a bond issuer will default (fail to make timely payments of interest or principal), potentially reducing the fund’s income level and share price. High yield corporate bonds could have greater price declines than funds that invest primarily in high-quality bonds. Companies issuing high yield bonds are not as strong financially as those with higher credit ratings, so the bonds are usually considered speculative investments.
Funds that invest overseas may carry more risk than funds that invest strictly in U.S. assets. Risks can result from varying stages of economic and political development; differing regulatory environments, trading days, and accounting standards; and higher transaction costs of non-U.S. markets. Non-U.S. investments are also subject to currency risk, or a decline in the value of a foreign currency versus the U.S. dollar, which reduces the dollar value of securities denominated in that currency.
GLOSSARY
Bloomberg Barclays U.S. Aggregate Bond Index: An unmanaged index that tracks investment-grade bonds, including corporate, government, and mortgage-backed securities.
Bloomberg Barclays Global Aggregate ex U.S. Dollar Bond Index: Tracks the performance of government, corporate, agency, and mortgage-related bonds in Europe, the Asia-Pacific region, and Canada.
Citigroup 3-Month Treasury Bill Index: An unmanaged index that tracks short-term U.S. government debt instruments.
Combined index benchmarks: Unmanaged portfolios composed of the following underlying indexes as of November 30, 2017:
| ● | Personal Strategy Income—40% stocks (28% Russell 3000 Index, 12% MSCI All-Country World Index ex USA), 40% bonds (Bloomberg Barclays U.S. Aggregate Bond Index), and 20% money market securities (Citigroup 3-Month Treasury Bill Index).
|
| ● | Personal Strategy Balanced—60% stocks (42% Russell 3000 Index, 18% MSCI All-Country World Index ex USA), 30% bonds (Bloomberg Barclays U.S. Aggregate Bond Index), and 10% money market securities (Citigroup 3-Month Treasury Bill Index).
|
| ● | Personal Strategy Growth—80% stocks (56% Russell 3000 Index, 24% MSCI All-Country World Index ex USA) and 20% bonds (Bloomberg Barclays U.S. Aggregate Bond Index). |
Credit Suisse High Yield Index: Tracks the performance of domestic noninvestment-grade corporate bonds.
Federal funds rate (or target rate): The interest rate charged on overnight loans of reserves by one financial institution to another in the United States. The Federal Reserve sets a target federal funds rate to affect the direction of interest rates.
Gross domestic product: The total market value of all goods and services produced in a country in a given year.
Lipper Mixed-Asset Target Allocation Conservative Funds Index: A peer group benchmark that measures the performance of similar funds with a mix of between 20% and 40% equities, with the remainder invested in bonds and short-term investments.
Lipper Mixed-Asset Target Allocation Growth Funds Index: A peer group benchmark that measures the performance of similar funds with a mix of between 60% and 80% equities, with the remainder invested in bonds and short-term investments.
Lipper Mixed-Asset Target Allocation Moderate Funds Index: A peer group benchmark that measures the performance of similar funds with a mix of between 40% and 60% equities, with the remainder invested in bonds and short-term investments.
Morningstar Moderate Target Risk Index: Represents a portfolio of global equities (fixed at 60%), bonds, and other asset classes.
Morningstar Moderately Aggressive Target Risk Index: Represents a portfolio of global equities (fixed at 80%), bonds, and other asset classes.
Morningstar Moderately Conservative Target Risk Index: Represents a portfolio of global equities (fixed at 40%), bonds, and other asset classes.
MSCI All Country World Index ex USA: An index that measures equity market performance of developed and emerging countries, excluding the U.S.
MSCI Emerging Markets Index: A capitalization-weighted index of stocks from emerging market countries that only includes securities that may be traded by foreign investors.
Russell 3000 Index: An index that tracks the performance of the 3,000 largest U.S. companies, representing approximately 98% of the investable U.S. equity market.
S&P 500 Index: An index that tracks the stocks of 500 primarily large-cap U.S. companies.
Note: Bloomberg Index Services Ltd. Copyright 2017, Bloomberg Index Services Ltd. Used with permission.
Note: MSCI makes no express or implied warranties or representations and shall have no liability whatsoever with respect to any MSCI data contained herein. The MSCI data may not be further redistributed or used as a basis for other indices or any securities or financial products. This report is not approved, reviewed, or produced by MSCI.
Note: Russell Investment Group is the source and owner of the trademarks, service marks, and copyrights related to the Russell indexes. Russell® is a trademark of Russell Investment Group.
Performance and Expenses
This chart shows the value of a hypothetical $10,000 investment in the fund over the past 10 fiscal year periods or since inception (for funds lacking 10-year records). The result is compared with benchmarks, which may include a broad-based market index and a peer group average or index. Market indexes do not include expenses, which are deducted from fund returns as well as mutual fund averages and indexes.

This chart shows the value of a hypothetical $10,000 investment in the fund over the past 10 fiscal year periods or since inception (for funds lacking 10-year records). The result is compared with benchmarks, which may include a broad-based market index and a peer group average or index. Market indexes do not include expenses, which are deducted from fund returns as well as mutual fund averages and indexes.

This chart shows the value of a hypothetical $10,000 investment in the fund over the past 10 fiscal year periods or since inception (for funds lacking 10-year records). The result is compared with benchmarks, which may include a broad-based market index and a peer group average or index. Market indexes do not include expenses, which are deducted from fund returns as well as mutual fund averages and indexes.

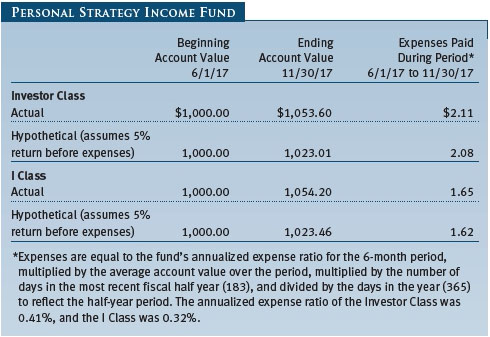
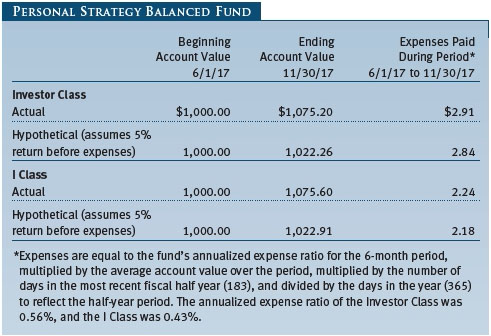
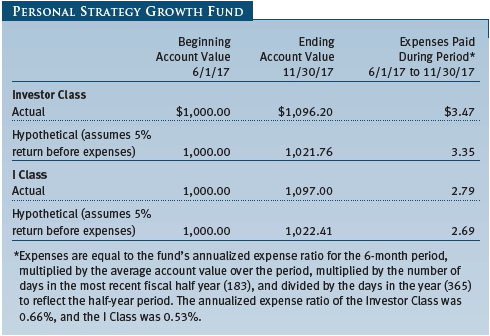
As a mutual fund shareholder, you may incur two types of costs: (1) transaction costs, such as redemption fees or sales loads, and (2) ongoing costs, including management fees, distribution and service (12b-1) fees, and other fund expenses. The following example is intended to help you understand your ongoing costs (in dollars) of investing in the fund and to compare these costs with the ongoing costs of investing in other mutual funds. The example is based on an investment of $1,000 invested at the beginning of the most recent six-month period and held for the entire period.
Please note that the fund has two share classes: The original share class (Investor Class) charges no distribution and service (12b-1) fee, and the I Class shares are also available to institutionally oriented clients and impose no 12b-1 or administrative fee payment. Each share class is presented separately in the table.
Actual Expenses
The first line of the following table (Actual) provides information about actual account values and expenses based on the fund’s actual returns. You may use the information on this line, together with your account balance, to estimate the expenses that you paid over the period. Simply divide your account value by $1,000 (for example, an $8,600 account value divided by $1,000 = 8.6), then multiply the result by the number on the first line under the heading “Expenses Paid During Period” to estimate the expenses you paid on your account during this period.
Hypothetical Example for Comparison Purposes
The information on the second line of the table (Hypothetical) is based on hypothetical account values and expenses derived from the fund’s actual expense ratio and an assumed 5% per year rate of return before expenses (not the fund’s actual return). You may compare the ongoing costs of investing in the fund with other funds by contrasting this 5% hypothetical example and the 5% hypothetical examples that appear in the shareholder reports of the other funds. The hypothetical account values and expenses may not be used to estimate the actual ending account balance or expenses you paid for the period.
Note: T. Rowe Price charges an annual account service fee of $20, generally for accounts with less than $10,000. The fee is waived for any investor whose T. Rowe Price mutual fund accounts total $50,000 or more; accounts electing to receive electronic delivery of account statements, transaction confirmations, prospectuses, and shareholder reports; or accounts of an investor who is a T. Rowe Price Personal Services or Enhanced Personal Services client (enrollment in these programs generally requires T. Rowe Price assets of at least $250,000). This fee is not included in the accompanying table. If you are subject to the fee, keep it in mind when you are estimating the ongoing expenses of investing in the fund and when comparing the expenses of this fund with other funds.
You should also be aware that the expenses shown in the table highlight only your ongoing costs and do not reflect any transaction costs, such as redemption fees or sales loads. Therefore, the second line of the table is useful in comparing ongoing costs only and will not help you determine the relative total costs of owning different funds. To the extent a fund charges transaction costs, however, the total cost of owning that fund is higher.
Unaudited
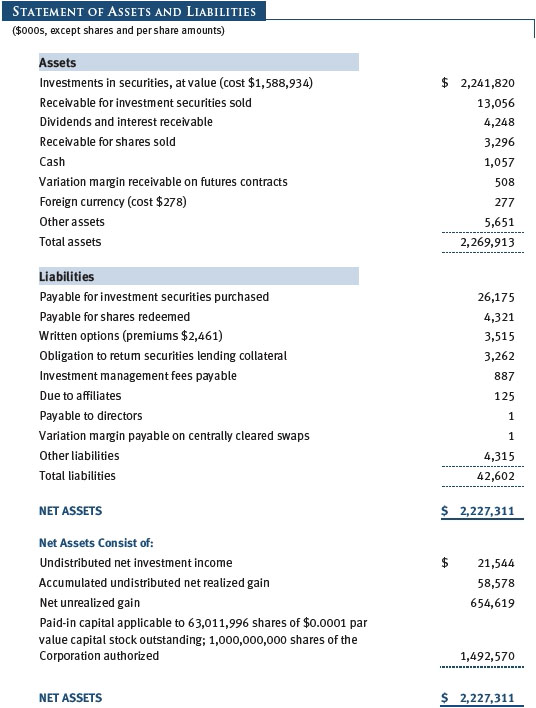
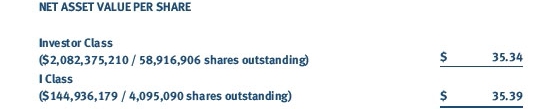
The accompanying notes are an integral part of these financial statements.
Unaudited
The accompanying notes are an integral part of these financial statements.
Unaudited


The accompanying notes are an integral part of these financial statements.
Unaudited
The accompanying notes are an integral part of these financial statements.
Unaudited

The accompanying notes are an integral part of these financial statements.
Unaudited
The accompanying notes are an integral part of these financial statements.
Unaudited
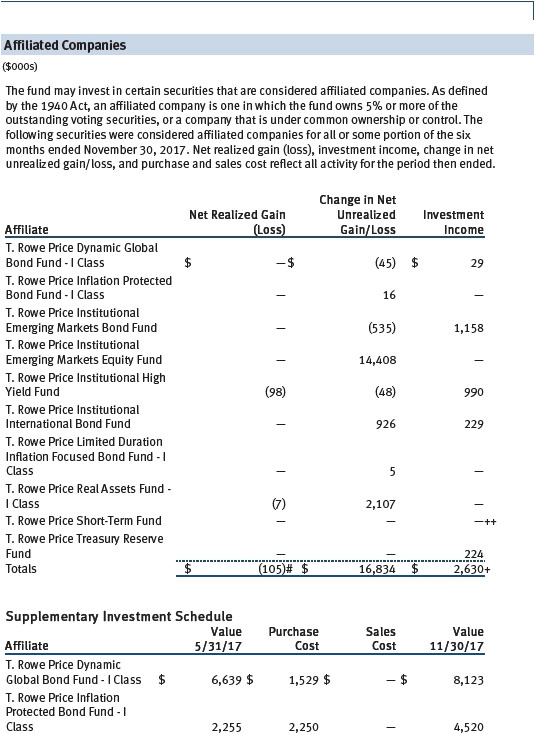
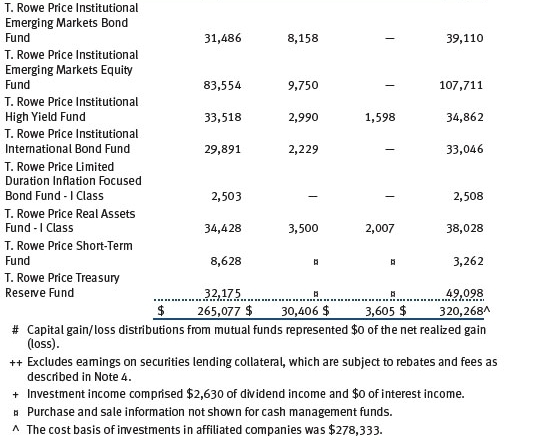
| Notes to Financial Statements |
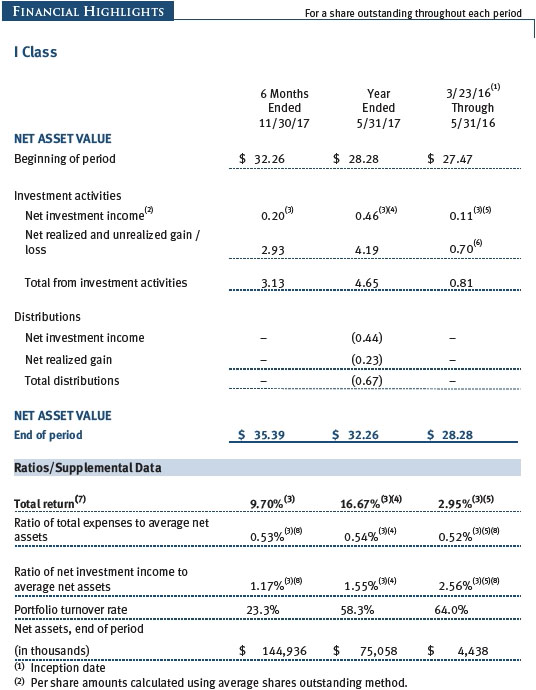
T. Rowe Price Personal Strategy Funds, Inc. (the corporation) is registered under the Investment Company Act of 1940 (the 1940 Act). The Personal Strategy Growth Fund (the fund) is a diversified, open-end management investment company established by the corporation. The fund seeks the highest total return over time consistent with a primary emphasis on capital growth and a secondary emphasis on income. The fund pursues its objective by investing in a diversified portfolio typically consisting of approximately 80% stocks; 16% bonds, money market securities, and cash reserves; and 4% alternative investments, including through hedge funds. The fund has two classes of shares: the Personal Strategy Growth Fund (Investor Class) and the Personal Strategy Growth Fund–I Class (I Class). I Class shares generally are available only to investors meeting a $1,000,000 minimum investment or certain other criteria. Each class has exclusive voting rights on matters related solely to that class; separate voting rights on matters that relate to both classes; and, in all other respects, the same rights and obligations as the other class.
NOTE 1 - SIGNIFICANT ACCOUNTING POLICIES
Basis of Preparation The fund is an investment company and follows accounting and reporting guidance in the Financial Accounting Standards Board (FASB) Accounting Standards Codification Topic 946 (ASC 946). The accompanying financial statements were prepared in accordance with accounting principles generally accepted in the United States of America (GAAP), including, but not limited to, ASC 946. GAAP requires the use of estimates made by management. Management believes that estimates and valuations are appropriate; however, actual results may differ from those estimates, and the valuations reflected in the accompanying financial statements may differ from the value ultimately realized upon sale or maturity.
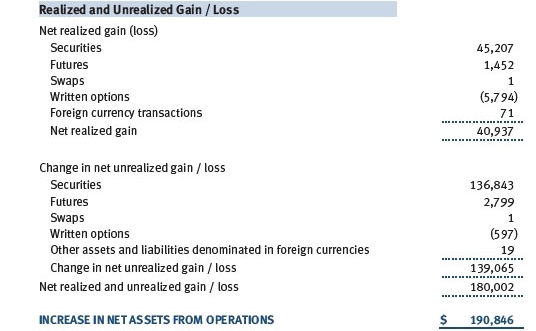
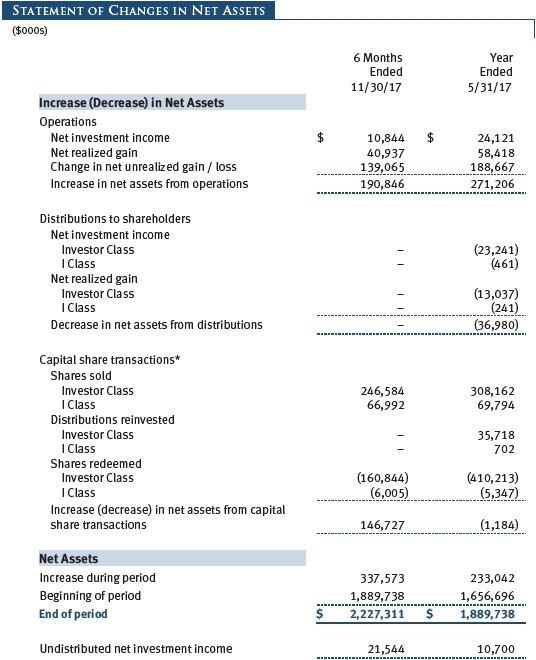
Investment Transactions, Investment Income, and Distributions Investment transactions are accounted for on the trade date basis. Income and expenses are recorded on the accrual basis. Realized gains and losses are reported on the identified cost basis. Premiums and discounts on debt securities are amortized for financial reporting purposes. Paydown gains and losses are recorded as an adjustment to interest income. Inflation adjustments to the principal amount of inflation-indexed bonds are reflected as interest income. Dividends received from mutual fund investments are reflected as dividend income; capital gain distributions are reflected as realized gain/loss. Earnings on investments recognized as partnerships for federal income tax purposes reflect the tax character of such earnings. Dividend income and capital gain distributions are recorded on the ex-dividend date. Income tax-related interest and penalties, if incurred, are recorded as income tax expense. Distributions from REITs are initially recorded as dividend income and, to the extent such represent a return of capital or capital gain for tax purposes, are reclassified when such information becomes available. Income distributions are declared and paid by each class annually. Distributions to shareholders are recorded on the ex-dividend date. A capital gain distribution may also be declared and paid by the fund annually.
Currency Translation Assets, including investments, and liabilities denominated in foreign currencies are translated into U.S. dollar values each day at the prevailing exchange rate, using the mean of the bid and asked prices of such currencies against U.S. dollars as quoted by a major bank. Purchases and sales of securities, income, and expenses are translated into U.S. dollars at the prevailing exchange rate on the respective date of such transaction. The portion of the results of operations attributable to changes in foreign exchange rates on investments is not bifurcated from the portion attributable to changes in market prices. The effect of changes in foreign currency exchange rates on realized and unrealized security gains and losses is reflected as a component of security gains and losses.
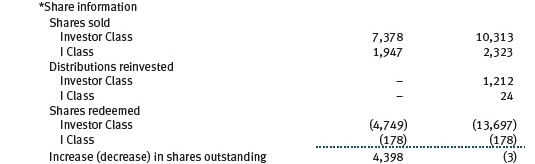
Class Accounting Shareholder servicing, prospectus, and shareholder report expenses incurred by each class are charged directly to the class to which they relate. Expenses common to both classes, investment income, and realized and unrealized gains and losses are allocated to the classes based upon the relative daily net assets of each class. To the extent any expenses are waived or reimbursed in accordance with an expense limitation (see Note 6), the waiver or reimbursement is charged to the applicable class or allocated across the classes in the same manner as the related expense.
Rebates Subject to best execution, the fund may direct certain security trades to brokers who have agreed to rebate a portion of the related brokerage commission to the fund in cash. Commission rebates are reflected as realized gain on securities in the accompanying financial statements and totaled $7,000 for the six months ended November 30, 2017.
New Accounting Guidance In March 2017, the FASB issued amended guidance to shorten the amortization period for certain callable debt securities, held at a premium. The guidance is effective for fiscal years and interim periods beginning after December 15, 2018. Adoption will have no effect on the fund’s net assets or results of operations.
On August 1, 2017, the fund implemented amendments to Regulation S-X, issued by the Securities and Exchange Commission, which require standardized, enhanced disclosures, particularly related to derivatives, in investment company financial statements. Adoption had no effect on the fund’s net assets or results of operations.
Indemnification In the normal course of business, the fund may provide indemnification in connection with its officers and directors, service providers, and/or private company investments. The fund’s maximum exposure under these arrangements is unknown; however, the risk of material loss is currently considered to be remote.
NOTE 2 - VALUATION
The fund’s financial instruments are valued and each class’s net asset value (NAV) per share is computed at the close of the New York Stock Exchange (NYSE), normally 4 p.m. ET, each day the NYSE is open for business. However, the NAV per share may be calculated at a time other than the normal close of the NYSE if trading on the NYSE is restricted, if the NYSE closes earlier, or as may be permitted by the SEC.
Fair Value The fund’s financial instruments are reported at fair value, which GAAP defines as the price that would be received to sell an asset or paid to transfer a liability in an orderly transaction between market participants at the measurement date. The T. Rowe Price Valuation Committee (the Valuation Committee) is an internal committee that has been delegated certain responsibilities by the fund’s Board of Directors (the Board) to ensure that financial instruments are appropriately priced at fair value in accordance with GAAP and the 1940 Act. Subject to oversight by the Board, the Valuation Committee develops and oversees pricing-related policies and procedures and approves all fair value determinations. Specifically, the Valuation Committee establishes procedures to value securities; determines pricing techniques, sources, and persons eligible to effect fair value pricing actions; oversees the selection, services, and performance of pricing vendors; oversees valuation-related business continuity practices; and provides guidance on internal controls and valuation-related matters. The Valuation Committee reports to the Board and has representation from legal, portfolio management and trading, operations, risk management, and the fund’s treasurer.
Various valuation techniques and inputs are used to determine the fair value of financial instruments. GAAP establishes the following fair value hierarchy that categorizes the inputs used to measure fair value:
Level 1 – quoted prices (unadjusted) in active markets for identical financial instruments that the fund can access at the reporting date
Level 2 – inputs other than Level 1 quoted prices that are observable, either directly or indirectly (including, but not limited to, quoted prices for similar financial instruments in active markets, quoted prices for identical or similar financial instruments in inactive markets, interest rates and yield curves, implied volatilities, and credit spreads)
Level 3 – unobservable inputs
Observable inputs are developed using market data, such as publicly available information about actual events or transactions, and reflect the assumptions that market participants would use to price the financial instrument. Unobservable inputs are those for which market data are not available and are developed using the best information available about the assumptions that market participants would use to price the financial instrument. GAAP requires valuation techniques to maximize the use of relevant observable inputs and minimize the use of unobservable inputs. When multiple inputs are used to derive fair value, the financial instrument is assigned to the level within the fair value hierarchy based on the lowest-level input that is significant to the fair value of the financial instrument. Input levels are not necessarily an indication of the risk or liquidity associated with financial instruments at that level but rather the degree of judgment used in determining those values.
Valuation Techniques Equity securities listed or regularly traded on a securities exchange or in the over-the-counter (OTC) market are valued at the last quoted sale price or, for certain markets, the official closing price at the time the valuations are made. OTC Bulletin Board securities are valued at the mean of the closing bid and asked prices. A security that is listed or traded on more than one exchange is valued at the quotation on the exchange determined to be the primary market for such security. Listed securities not traded on a particular day are valued at the mean of the closing bid and asked prices for domestic securities and the last quoted sale or closing price for international securities.
For valuation purposes, the last quoted prices of non-U.S. equity securities may be adjusted to reflect the fair value of such securities at the close of the NYSE. If the fund determines that developments between the close of a foreign market and the close of the NYSE will affect the value of some or all of its portfolio securities, the fund will adjust the previous quoted prices to reflect what it believes to be the fair value of the securities as of the close of the NYSE. In deciding whether it is necessary to adjust quoted prices to reflect fair value, the fund reviews a variety of factors, including developments in foreign markets, the performance of U.S. securities markets, and the performance of instruments trading in U.S. markets that represent foreign securities and baskets of foreign securities. The fund may also fair value securities in other situations, such as when a particular foreign market is closed but the fund is open. The fund uses outside pricing services to provide it with quoted prices and information to evaluate or adjust those prices. The fund cannot predict how often it will use quoted prices and how often it will determine it necessary to adjust those prices to reflect fair value. As a means of evaluating its security valuation process, the fund routinely compares quoted prices, the next day’s opening prices in the same markets, and adjusted prices.
Actively traded equity securities listed on a domestic exchange generally are categorized in Level 1 of the fair value hierarchy. Non-U.S. equity securities generally are categorized in Level 2 of the fair value hierarchy despite the availability of quoted prices because, as described above, the fund evaluates and determines whether those quoted prices reflect fair value at the close of the NYSE or require adjustment. OTC Bulletin Board securities, certain preferred securities, and equity securities traded in inactive markets generally are categorized in Level 2 of the fair value hierarchy.
Debt securities generally are traded in the OTC market. Securities with remaining maturities of one year or more at the time of acquisition are valued at prices furnished by dealers who make markets in such securities or by an independent pricing service, which considers the yield or price of bonds of comparable quality, coupon, maturity, and type, as well as prices quoted by dealers who make markets in such securities. Debt securities with remaining maturities of less than one year at the time of acquisition generally use amortized cost in local currency to approximate fair value. However, if amortized cost is deemed not to reflect fair value or the fund holds a significant amount of such securities with remaining maturities of more than 60 days, the securities are valued at prices furnished by dealers who make markets in such securities or by an independent pricing service. Generally, debt securities are categorized in Level 2 of the fair value hierarchy.
Investments in mutual funds are valued at the mutual fund’s closing NAV per share on the day of valuation and are categorized in Level 1 of the fair value hierarchy. Investments in private investment companies are valued at the investee’s NAV per share as of the valuation date, if available. If the investee’s NAV is not available as of the valuation date or is not calculated in accordance with GAAP, the Valuation Committee may adjust the investee’s NAV to reflect fair value at the valuation date. Investments in private investment companies generally are categorized either in Level 2 or 3, depending on the significance of unobservable inputs. Listed options, and OTC options with a listed equivalent, are valued at the mean of the closing bid and asked prices and generally are categorized in Level 2 of the fair value hierarchy. Financial futures contracts are valued at closing settlement prices and are categorized in Level 1 of the fair value hierarchy. Swaps are valued at prices furnished by an independent pricing service or independent swap dealers and generally are categorized in Level 2 of the fair value hierarchy; however, if unobservable inputs are significant to the valuation, the swap would be categorized in Level 3. Assets and liabilities other than financial instruments, including short-term receivables and payables, are carried at cost, or estimated realizable value, if less, which approximates fair value.
Thinly traded financial instruments and those for which the above valuation procedures are inappropriate or are deemed not to reflect fair value are stated at fair value as determined in good faith by the Valuation Committee. The objective of any fair value pricing determination is to arrive at a price that could reasonably be expected from a current sale. Financial instruments fair valued by the Valuation Committee are primarily private placements, restricted securities, warrants, rights, and other securities that are not publicly traded.
Subject to oversight by the Board, the Valuation Committee regularly makes good faith judgments to establish and adjust the fair valuations of certain securities as events occur and circumstances warrant. For instance, in determining the fair value of an equity investment with limited market activity, such as a private placement or a thinly traded public company stock, the Valuation Committee considers a variety of factors, which may include, but are not limited to, the issuer’s business prospects, its financial standing and performance, recent investment transactions in the issuer, new rounds of financing, negotiated transactions of significant size between other investors in the company, relevant market valuations of peer companies, strategic events affecting the company, market liquidity for the issuer, and general economic conditions and events. In consultation with the investment and pricing teams, the Valuation Committee will determine an appropriate valuation technique based on available information, which may include both observable and unobservable inputs. The Valuation Committee typically will afford greatest weight to actual prices in arm’s length transactions, to the extent they represent orderly transactions between market participants, transaction information can be reliably obtained, and prices are deemed representative of fair value. However, the Valuation Committee may also consider other valuation methods such as market-based valuation multiples; a discount or premium from market value of a similar, freely traded security of the same issuer; or some combination. Fair value determinations are reviewed on a regular basis and updated as information becomes available, including actual purchase and sale transactions of the issue. Because any fair value determination involves a significant amount of judgment, there is a degree of subjectivity inherent in such pricing decisions, and fair value prices determined by the Valuation Committee could differ from those of other market participants. Depending on the relative significance of unobservable inputs, including the valuation technique(s) used, fair valued securities may be categorized in Level 2 or 3 of the fair value hierarchy.
Valuation Inputs The following table summarizes the fund’s financial instruments, based on the inputs used to determine their fair values on November 30, 2017:
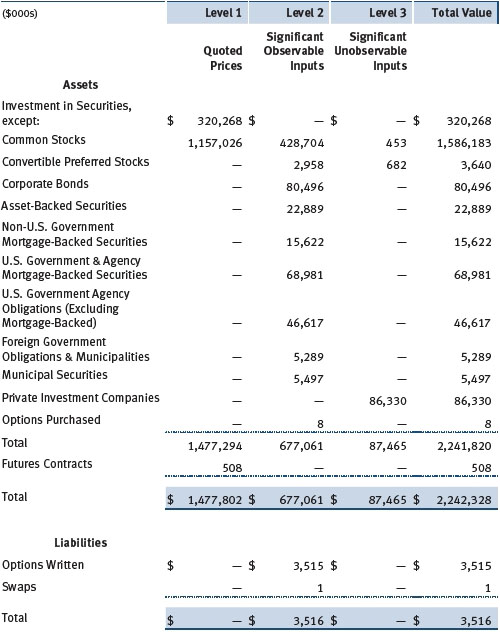
There were no material transfers between Levels 1 and 2 during the six months ended November 30, 2017.
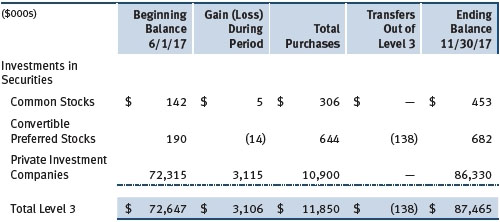
Following is a reconciliation of the fund’s Level 3 holdings for the six months ended November 30, 2017. Gain (loss) reflects both realized and change in unrealized gain/loss on Level 3 holdings during the period, if any, and is included on the accompanying Statement of Operations. The change in unrealized gain/loss on Level 3 instruments held at November 30, 2017, totaled $3,106,000 for the six months ended November 30, 2017. Transfers into and out of Level 3 are reflected at the value of the financial instrument at the beginning of the period. During the six months transfers out of Level 3 were because observable market data became available for the security.
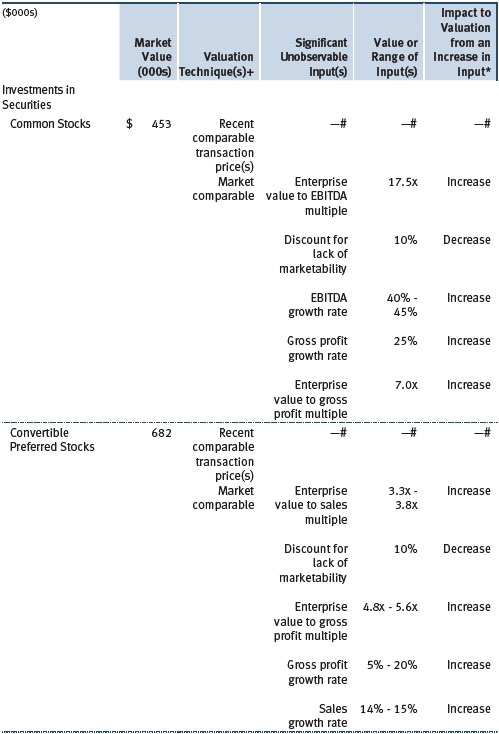
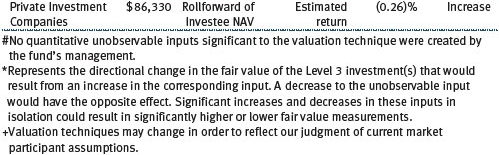
In accordance with GAAP, the following table provides quantitative information about significant unobservable inputs used to determine the fair valuations of the fund’s Level 3 assets, by class of financial instrument; it also indicates the sensitivity of the Level 3 valuations to changes in those significant unobservable inputs. Because the Valuation Committee considers a wide variety of factors and inputs, both observable and unobservable, in determining fair values, the unobservable inputs presented do not reflect all inputs significant to the fair value determination.
NOTE 3 - DERIVATIVE INSTRUMENTS
During the six months ended November 30, 2017, the fund invested in derivative instruments. As defined by GAAP, a derivative is a financial instrument whose value is derived from an underlying security price, foreign exchange rate, interest rate, index of prices or rates, or other variable; it requires little or no initial investment and permits or requires net settlement. The fund invests in derivatives only if the expected risks and rewards are consistent with its investment objectives, policies, and overall risk profile, as described in its prospectus and Statement of Additional Information. The fund may use derivatives for a variety of purposes, such as seeking to hedge against declines in principal value, increase yield, invest in an asset with greater efficiency and at a lower cost than is possible through direct investment, or to adjust credit exposure. The risks associated with the use of derivatives are different from, and potentially much greater than, the risks associated with investing directly in the instruments on which the derivatives are based. The fund at all times maintains sufficient cash reserves, liquid assets, or other SEC-permitted asset types to cover its settlement obligations under open derivative contracts.
The fund values its derivatives at fair value and recognizes changes in fair value currently in its results of operations. Accordingly, the fund does not follow hedge accounting, even for derivatives employed as economic hedges. Generally, the fund accounts for its derivatives on a gross basis. It does not offset the fair value of derivative liabilities against the fair value of derivative assets on its financial statements, nor does it offset the fair value of derivative instruments against the right to reclaim or obligation to return collateral.
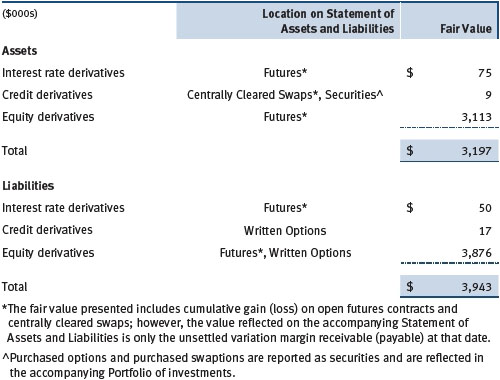
The following table summarizes the fair value of the fund’s derivative instruments held as of November 30, 2017, and the related location on the accompanying Statement of Assets and Liabilities, presented by primary underlying risk exposure:
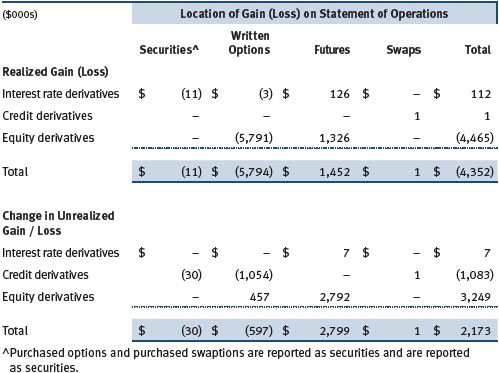
Additionally, the amount of gains and losses on derivative instruments recognized in fund earnings during the six months ended November 30, 2017, and the related location on the accompanying Statement of Operations is summarized in the following table by primary underlying risk exposure:
Counterparty Risk and Collateral The fund invests in derivatives in various markets, which expose it to differing levels of counterparty risk. Counterparty risk on exchange-traded and centrally cleared derivative contracts, such as futures, exchange-traded options, and centrally cleared swaps, is minimal because the clearinghouse provides protection against counterparty defaults. For futures and centrally cleared swaps, the fund is required to deposit collateral in an amount specified by the clearinghouse and the clearing firm (margin requirement), and the margin requirement must be maintained over the life of the contract. Each clearinghouse and clearing firm, in its sole discretion, may adjust the margin requirements applicable to the fund.
Derivatives, such as bilateral swaps, forward currency exchange contracts, and OTC options, that are transacted and settle directly with a counterparty (bilateral derivatives) expose the fund to greater counterparty risk. To mitigate this risk, the fund has entered into master netting arrangements (MNAs) with certain counterparties that permit net settlement under specified conditions and, for certain counterparties, also require the exchange of collateral to cover mark-to-market exposure. MNAs may be in the form of International Swaps and Derivatives Association master agreements (ISDAs) or foreign exchange letter agreements (FX letters).
MNAs provide the ability to offset amounts the fund owes a counterparty against amounts the counterparty owes the fund (net settlement). Both ISDAs and FX letters generally allow termination of transactions and net settlement upon the occurrence of contractually specified events, such as failure to pay or bankruptcy. In addition, ISDAs specify other events, the occurrence of which would allow one of the parties to terminate. For example, a downgrade in credit rating of a counterparty would allow the fund to terminate, while a decline in the fund’s net assets of more than a specified percentage would allow the counterparty to terminate. Upon termination, all transactions with that counterparty would be liquidated and a net termination amount settled. ISDAs include collateral agreements whereas FX letters do not. Collateral requirements are determined daily based on the net aggregate unrealized gain or loss on all bilateral derivatives with a counterparty, subject to minimum transfer amounts that typically range from $100,000 to $250,000. Any additional collateral required due to changes in security values is typically transferred the same business day.
Collateral may be in the form of cash or debt securities issued by the U.S. government or related agencies. Cash posted by the fund is reflected as cash deposits in the accompanying financial statements and generally is restricted from withdrawal by the fund; securities posted by the fund are so noted in the accompanying Portfolio of Investments; both remain in the fund’s assets. Collateral pledged by counterparties is not included in the fund’s assets because the fund does not obtain effective control over those assets. For bilateral derivatives, collateral posted or received by the fund is held in a segregated account at the fund’s custodian. While typically not sold similar to equity or fixed income securities, exchange-traded or centrally cleared derivatives may be closed out only on the exchange or clearinghouse where the contracts were traded, and OTC and bilateral derivatives may be unwound with counterparties or transactions assigned to other counterparties to allow the fund to exit the transaction. This ability is subject to the liquidity of underlying positions. As of November 30, 2017, no collateral was pledged by either the fund or counterparties for bilateral derivatives. As of November 30, 2017, securities valued at $3,355,000 had been posted by the fund for exchange-traded and/or centrally cleared derivatives.
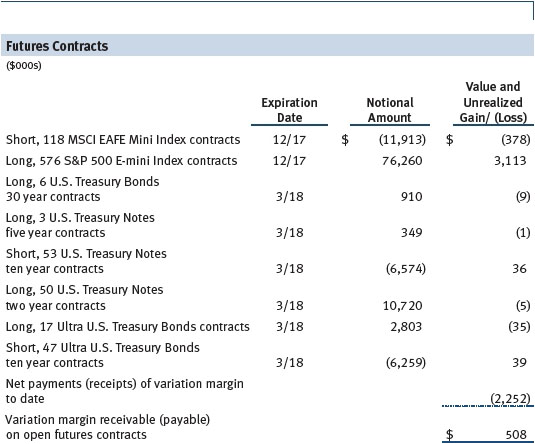
Futures Contracts The fund is subject to interest rate risk equity price risk in the normal course of pursuing its investment objectives and uses futures contracts to help manage such risks. The fund may enter into futures contracts to manage exposure to interest rates, security prices, foreign currencies, and credit quality; as an efficient means of adjusting exposure to all or part of a target market; to enhance income; as a cash management tool; or to adjust credit exposure. A futures contract provides for the future sale by one party and purchase by another of a specified amount of a specific underlying financial instrument at an agreed-upon price, date, time, and place. The fund currently invests only in exchange-traded futures, which generally are standardized as to maturity date, underlying financial instrument, and other contract terms. Payments are made or received by the fund each day to settle daily fluctuations in the value of the contract (variation margin), which reflect changes in the value of the underlying financial instrument. Variation margin is recorded as unrealized gain or loss until the contract is closed. The value of a futures contract included in net assets is the amount of unsettled variation margin; net variation margin receivable is reflected as an asset and net variation margin payable is reflected as a liability on the accompanying Statement of Assets and Liabilities. Risks related to the use of futures contracts include possible illiquidity of the futures markets, contract prices that can be highly volatile and imperfectly correlated to movements in hedged security values and/or interest rates, and potential losses in excess of the fund’s initial investment. During the six month ended November 30, 2017, the volume of the fund’s activity in futures, based on underlying notional amounts, was generally between 4% and 7% of net assets.
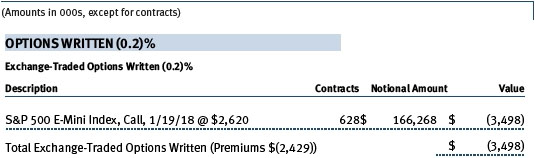
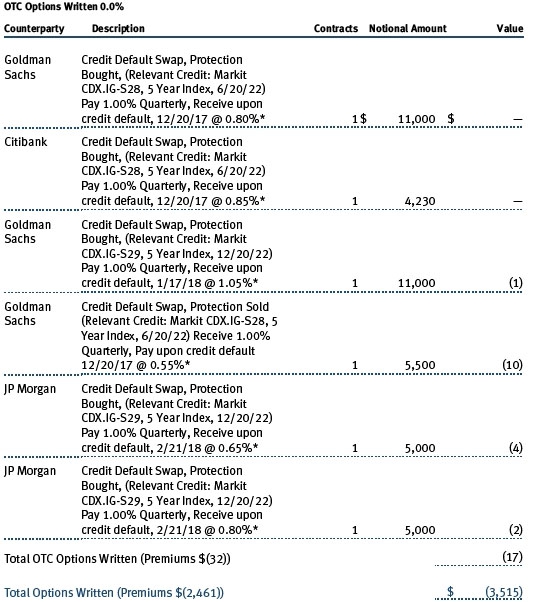
Options The fund is subject to interest rate risk, credit risk and equity price risk in the normal course of pursuing its investment objectives and uses options to help manage such risks. The fund may use options to manage exposure to security prices, interest rates, foreign currencies, and credit quality; as an efficient means of adjusting exposure to all or a part of a target market; to enhance income; as a cash management tool; or to adjust credit exposure. Options are included in net assets at fair value, purchased options are included in Investments in Securities, and written options are separately reflected as a liability on the accompanying Statement of Assets and Liabilities. Premiums on unexercised, expired options are recorded as realized gains or losses; premiums on exercised options are recorded as an adjustment to the proceeds from the sale or cost of the purchase. The difference between the premium and the amount received or paid in a closing transaction is also treated as realized gain or loss. In return for a premium paid, call and put options on futures give the holder the right, but not the obligation, to purchase or sell, respectively, a position in a particular futures contract at a specified exercise price. In return for a premium paid, call and put index options give the holder the right, but not the obligation, to receive cash equal to the difference between the value of the reference index on the exercise date and the exercise price of the option. In return for a premium paid, options on swaps give the holder the right, but not the obligation, to enter a specified swap contract on predefined terms. The exercise price of an option on a credit default swap is stated in terms of a specified spread that represents the cost of credit protection on the reference asset, including both the upfront premium to open the position and future periodic payments. The exercise price of an interest rate swap is stated in terms of a fixed interest rate; generally, there is no upfront payment to open the position. Risks related to the use of options include possible illiquidity of the options markets; trading restrictions imposed by an exchange or counterparty; movements in the underlying asset values and interest rates; and, for written options, potential losses in excess of the fund’s initial investment. During the six months ended November 30, 2017, the volume of the fund’s activity in options, based on underlying notional amounts, was generally between 2% and 9% of net assets.
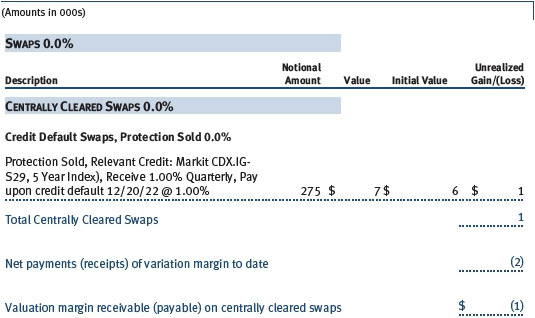
Swaps The fund is subject to credit risk in the normal course of pursuing its investment objectives and uses swap contracts to help manage such risk. The fund may use swaps in an effort to manage exposure to changes in interest rates, inflation rates, and credit quality; to adjust overall exposure to certain markets; to enhance total return or protect the value of portfolio securities; to serve as a cash management tool; or to adjust portfolio duration and credit exposure. Swap agreements can be settled either directly with the counterparty (bilateral swap) or through a central clearinghouse (centrally cleared swap). Fluctuations in the fair value of a contract are reflected in unrealized gain or loss and are reclassified to realized gain or loss upon contract termination or cash settlement. Net periodic receipts or payments required by a contract increase or decrease, respectively, the value of the contract until the contractual payment date, at which time such amounts are reclassified from unrealized to realized gain or loss. For bilateral swaps, cash payments are made or received by the fund on a periodic basis in accordance with contract terms; unrealized gain on contracts and premiums paid are reflected as assets and unrealized loss on contracts and premiums received are reflected as liabilities on the accompanying Statement of Assets and Liabilities. For bilateral swaps, premiums paid or received are amortized over the life of the swap and are recognized as realized gain or loss in the Statement of Operations. For centrally cleared swaps, payments are made or received by the fund each day to settle the daily fluctuation in the value of the contract (variation margin). Accordingly, the value of a centrally cleared swap included in net assets is the unsettled variation margin; net variation margin receivable is reflected as an asset and net variation margin payable is reflected as a liability on the accompanying Statement of Assets and Liabilities.
Credit default swaps are agreements where one party (the protection buyer) agrees to make periodic payments to another party (the protection seller) in exchange for protection against specified credit events, such as certain defaults and bankruptcies related to an underlying credit instrument, or issuer or index of such instruments. Upon occurrence of a specified credit event, the protection seller is required to pay the buyer the difference between the notional amount of the swap and the value of the underlying credit, either in the form of a net cash settlement or by paying the gross notional amount and accepting delivery of the relevant underlying credit. For credit default swaps where the underlying credit is an index, a specified credit event may affect all or individual underlying securities included in the index and will be settled based upon the relative weighting of the affected underlying security(ies) within the index. Generally, the payment risk for the seller of protection is inversely related to the current market price or credit rating of the underlying credit or the market value of the contract relative to the notional amount, which are indicators of the markets’ valuation of credit quality. As of November 30, 2017, the notional amount of protection sold by the fund totaled $275,000 (0.0% of net assets), which reflects the maximum potential amount the fund could be required to pay under such contracts. Risks related to the use of credit default swaps include the possible inability of the fund to accurately assess the current and future creditworthiness of underlying issuers, the possible failure of a counterparty to perform in accordance with the terms of the swap agreements, potential government regulation that could adversely affect the fund’s swap investments, and potential losses in excess of the fund’s initial investment.
During the six months ended November 30, 2017, the volume of the fund’s activity in swaps, based on underlying notional amounts, was generally less than 1% of net assets.
NOTE 4 - OTHER INVESTMENT TRANSACTIONS
Consistent with its investment objective, the fund engages in the following practices to manage exposure to certain risks and/or to enhance performance. The investment objective, policies, program, and risk factors of the fund are described more fully in the fund’s prospectus and Statement of Additional Information.
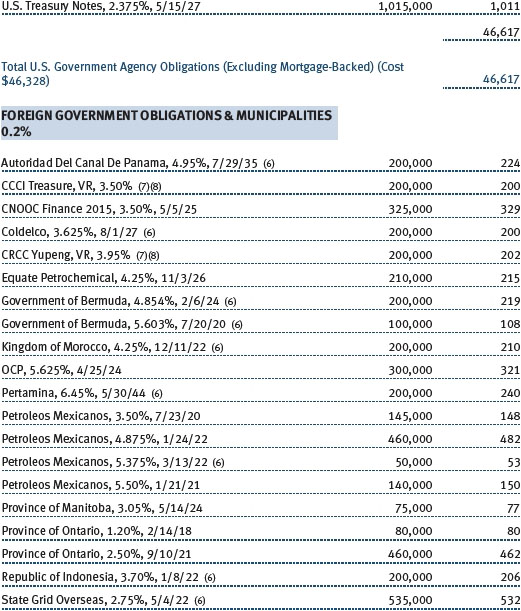
Emerging and Frontier Markets The fund may invest, either directly or through investments in T. Rowe Price institutional funds, in securities of companies located in, issued by governments of, or denominated in or linked to the currencies of emerging and frontier market countries; at period-end, approximately 9% of the fund’s net assets were invested in emerging markets and 1% in frontier markets. Emerging markets, and to a greater extent frontier markets, generally have economic structures that are less diverse and mature, and political systems that are less stable, than developed countries. These markets may be subject to greater political, economic, and social uncertainty and differing regulatory environments that may potentially impact the fund’s ability to buy or sell certain securities or repatriate proceeds to U.S. dollars. Such securities are often subject to greater price volatility, less liquidity, and higher rates of inflation than U.S. securities. Investing in frontier markets is significantly riskier than investing in other countries, including emerging markets.
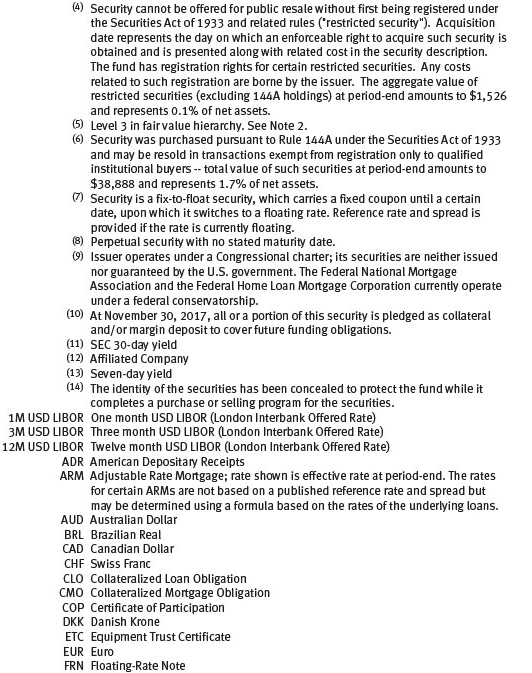
Restricted Securities The fund may invest in securities that are subject to legal or contractual restrictions on resale. Prompt sale of such securities at an acceptable price may be difficult and may involve substantial delays and additional costs.
Collateralized Loan Obligations The fund may invest in collateralized loan obligations (CLOs) which are entities backed by a diversified pool of syndicated bank loans. The cash flows of the CLO can be split into multiple segments, called “tranches” or “classes”, which will vary in risk profile and yield. The riskiest segments, which are the subordinate or “equity” tranches, bear the greatest risk of loss from defaults in the underlying assets of the CLO and serve to protect the other, more senior, tranches. Senior tranches will typically have higher credit ratings and lower yields than the securities underlying the CLO. Despite the protection from the more junior tranches, senior tranches can experience substantial losses.
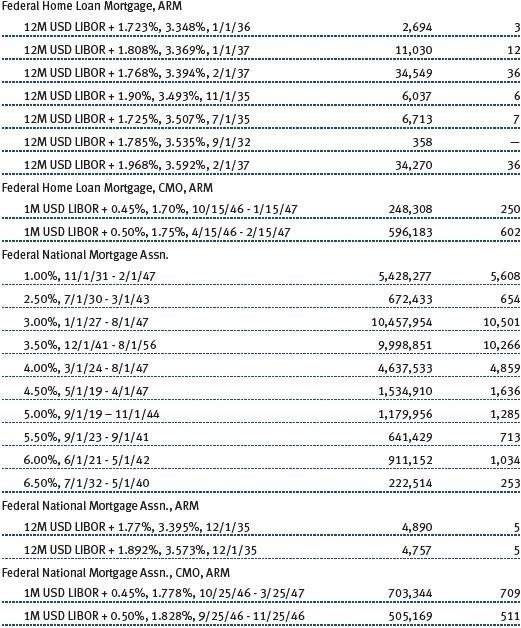
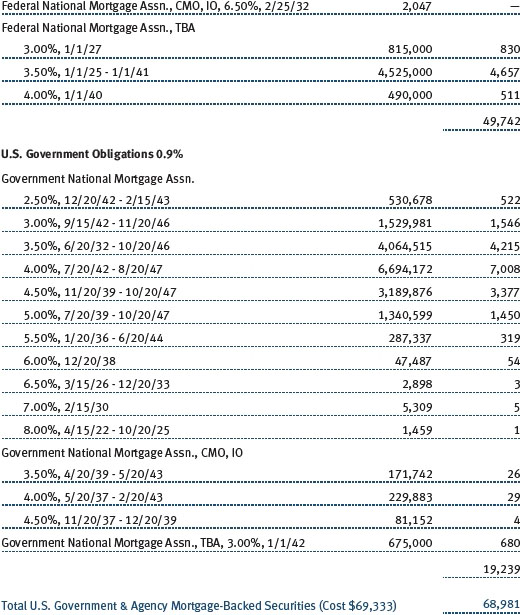
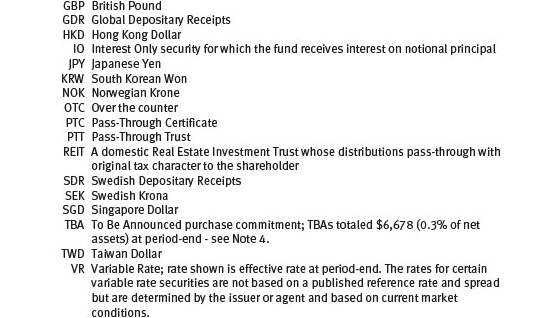
TBA Purchase and Sale Commitments The fund may enter into to-be-announced (TBA) purchase or sale commitments (collectively, TBA transactions), pursuant to which it agrees to purchase or sell, respectively, mortgage-backed securities for a fixed unit price, with payment and delivery at a scheduled future date beyond the customary settlement period for such securities. With TBA transactions, the particular securities to be received or delivered by the fund are not identified at the trade date; however, the securities must meet specified terms, including issuer, rate, and mortgage term, and be within industry-accepted “good delivery” standards. The fund may enter into TBA transactions with the intention of taking possession of or relinquishing the underlying securities, may elect to extend the settlement by “rolling” the transaction, and/or may use TBA transactions to gain or reduce interim exposure to underlying securities. Until settlement, the fund maintains liquid assets sufficient to settle its commitment to purchase a TBA or, in the case of a sale commitment, the fund maintains an entitlement to the security to be sold.
To mitigate counterparty risk, the fund has entered into agreements with TBA counterparties that provide for collateral and the right to offset amounts due to or from those counterparties under specified conditions. Subject to minimum transfer amounts, collateral requirements are determined and transfers made based on the net aggregate unrealized gain or loss on all TBA commitments with a particular counterparty. At any time, the fund’s risk of loss from a particular counterparty related to its TBA commitments is the aggregate unrealized gain on appreciated TBAs in excess of unrealized loss on depreciated TBAs and collateral received, if any, from such counterparty. As of November 30, 2017, no collateral was pledged by the fund or counterparties for TBAs.
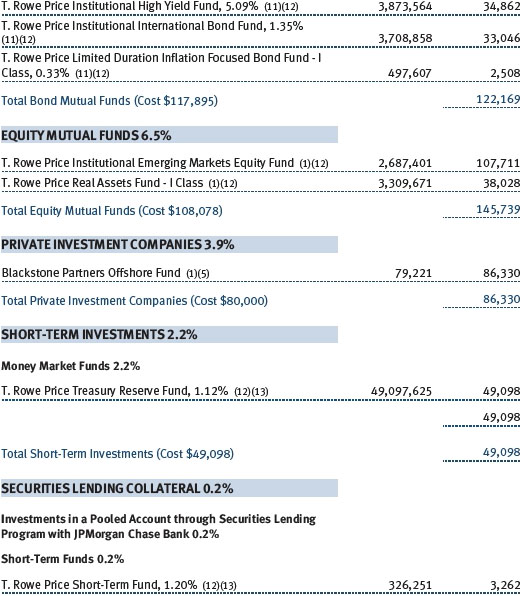
Securities Lending The fund may lend its securities to approved borrowers to earn additional income. Its securities lending activities are administered by a lending agent in accordance with a securities lending agreement. Security loans generally do not have stated maturity dates, and the fund may recall a security at any time. The fund receives collateral in the form of cash or U.S. government securities, valued at 102% to 105% of the value of the securities on loan. Collateral is maintained over the life of the loan in an amount not less than the value of loaned securities; any additional collateral required due to changes in security values is delivered to the fund the next business day. Cash collateral is invested in accordance with investment guidelines approved by fund management. Additionally, the lending agent indemnifies the fund against losses resulting from borrower default. Although risk is mitigated by the collateral and indemnification, the fund could experience a delay in recovering its securities and a possible loss of income or value if the borrower fails to return the securities, collateral investments decline in value, and the lending agent fails to perform. Securities lending revenue consists of earnings on invested collateral and borrowing fees, net of any rebates to the borrower, compensation to the lending agent, and other administrative costs. In accordance with GAAP, investments made with cash collateral are reflected in the accompanying financial statements, but collateral received in the form of securities is not. At November 30, 2017, the value of loaned securities was $3,107,000; the value of cash collateral and related investments was $3,262,000.
Mortgage-Backed Securities The fund may invest in mortgage-backed securities (MBS or pass-through certificates) that represent an interest in a pool of specific underlying mortgage loans and entitle the fund to the periodic payments of principal and interest from those mortgages. MBS may be issued by government agencies or corporations, or private issuers. Most MBS issued by government agencies are guaranteed; however, the degree of protection differs based on the issuer. The fund also may invest in stripped MBS, created when a traditional MBS is split into an interest-only (IO) and a principal-only (PO) strip. MBS, including IOs and POs, are sensitive to changes in economic conditions that affect the rate of prepayments and defaults on the underlying mortgages; accordingly, the value, income, and related cash flows from MBS may be more volatile than other debt instruments. IOs also risk loss of invested principal from faster-than-anticipated prepayments.
Investment in Blackstone Partners Offshore Fund The fund invested in Blackstone Partners Offshore Fund Ltd. (Blackstone Partners), a multi-strategy hedge fund-of-funds offered by Blackstone Alternative Asset Management (BAAM), a unit of Blackstone Group L.P. (Blackstone). Blackstone Partners provides the fund exposure to alternative investments primarily through Blackstone Partners’ investments in underlying private investment funds, and the underlying funds are mostly managed by investment managers unaffiliated with BAAM or Blackstone. Blackstone Partners and the underlying funds may use leverage, engage in short-selling, and invest in commodities or other speculative investments, which may increase the risk of investment loss. Blackstone Partners and the underlying funds are not subject to the same regulatory requirements as open-end mutual funds, and, therefore, their investments and related valuations may not be as transparent. Ownership interests in Blackstone Partners are not transferable and are subject to various redemption restrictions, such as advance notice requirements, limited redemption dates, and possible suspension of redemption rights. In addition, Blackstone Partners’ ownership in the underlying funds may also be subject to transfer and redemption restrictions, such as advance notice requirements, limited redemption dates, and possible suspension of redemption rights. All of these restrictions are subject to change at the sole discretion of Blackstone Partners or an underlying fund’s management. As of November 30, 2017, the fund’s investment in Blackstone Partners is subject to semi-annual redemption with 95 days’ prior written notice and is considered an illiquid asset.
Other Purchases and sales of portfolio securities other than short-term and U.S. government securities aggregated $481,490,000 and $360,322,000, respectively, for the six months ended November 30, 2017. Purchases and sales of U.S. government securities aggregated $134,261,000 and $112,383,000, respectively, for the six months ended November 30, 2017.
NOTE 5 - FEDERAL INCOME TAXES
No provision for federal income taxes is required since the fund intends to continue to qualify as a regulated investment company under Subchapter M of the Internal Revenue Code and distribute to shareholders all of its taxable income and gains. Distributions determined in accordance with federal income tax regulations may differ in amount or character from net investment income and realized gains for financial reporting purposes. Financial reporting records are adjusted for permanent book/tax differences to reflect tax character but are not adjusted for temporary differences. The amount and character of tax-basis distributions and composition of net assets are finalized at fiscal year-end; accordingly, tax-basis balances have not been determined as of the date of this report.
At November 30, 2017, the cost of investments for federal income tax purposes was $1,606,792,000. Net unrealized gain aggregated $634,306,000 at period-end, of which $668,158,000 related to appreciated investments and $33,852,000 related to depreciated investments.
NOTE 6 - RELATED PARTY TRANSACTIONS
The fund is managed by T. Rowe Price Associates, Inc. (Price Associates), a wholly owned subsidiary of T. Rowe Price Group, Inc. (Price Group). The investment management agreement between the fund and Price Associates provides for an annual investment management fee, which is computed daily and paid monthly. The fee consists of an individual fund fee, equal to 0.30% of the fund’s average daily net assets, and a group fee. The group fee rate is calculated based on the combined net assets of certain mutual funds sponsored by Price Associates (the group) applied to a graduated fee schedule, with rates ranging from 0.48% for the first $1 billion of assets to 0.265% for assets in excess of $650 billion. The fund’s group fee is determined by applying the group fee rate to the fund’s average daily net assets. At November 30, 2017, the effective annual group fee rate was 0.29%.
The I Class is subject to an operating expense limitation (I Class limit) pursuant to which Price Associates is contractually required to pay all operating expenses of the I Class, excluding management fees, interest, expenses related to borrowings, taxes, brokerage, and other non-recurring expenses permitted by the investment management agreement, to the extent such operating expenses, on an annualized basis, exceed 0.05% of average net assets. This agreement will continue until September 30, 2018, and may be renewed, revised, or revoked only with approval of the fund’s Board. The I Class is required to repay Price Associates for expenses previously paid to the extent the class’s net assets grow or expenses decline sufficiently to allow repayment without causing the class’s operating expenses (after the repayment is taken into account) to exceed both: (1) the expense limitation in place at the time such amounts were paid; and (2) the class’s current expense limitation. However, no repayment will be made more than three years after the date of a payment or waiver.
Pursuant to this agreement, less than $1,000 of expenses were repaid to Price Associates during the six months ended November 30, 2017. At November 30, 2017, there were no amounts subject to repayment by the fund.
In addition, the fund has entered into service agreements with Price Associates and two wholly owned subsidiaries of Price Associates (collectively, Price). Price Associates provides certain accounting and administrative services to the fund. T. Rowe Price Services, Inc. provides shareholder and administrative services in its capacity as the fund’s transfer and dividend-disbursing agent. T. Rowe Price Retirement Plan Services, Inc. provides subaccounting and recordkeeping services for certain retirement accounts invested in the Investor Class and I Class. For the six months ended November 30, 2017, expenses incurred pursuant to these service agreements were $44,000 for Price Associates; $349,000 for T. Rowe Price Services, Inc.; $147,000 for T. Rowe Price Retirement Plan Services, Inc. The total amount payable at period-end pursuant to these service agreements is reflected as Due to Affiliates in the accompanying financial statements.
The fund may invest in certain open-end management investment companies managed by Price Associates and considered affiliates of the fund: the T. Rowe Price Government Reserve Fund or the T. Rowe Price Treasury Reserve Fund, organized as money market funds, or the T. Rowe Price Short-Term Fund, a short-term bond fund (collectively, the Price Reserve Funds). The Price Reserve Funds are offered as short-term investment options to mutual funds, trusts, and other accounts managed by Price Associates or its affiliates and are not available for direct purchase by members of the public. The Price Reserve Funds pay no investment management fees.
The fund may also invest in certain other T. Rowe Price funds (Price Funds) as a means of gaining efficient and cost-effective exposure to certain markets. The fund does not invest for the purpose of exercising management or control; however, investments by the fund may represent a significant portion of an underlying Price Fund’s net assets. Each underlying Price Fund is an open-end management investment company managed by Price Associates and is considered an affiliate of the fund. To ensure that the fund does not incur duplicate management fees (paid by the underlying Price Fund(s) and the fund), Price Associates has agreed to permanently waive a portion of its management fee charged to the fund in an amount sufficient to fully offset that portion of management fees paid by each underlying Price Fund related to the fund’s investment therein. Annual management fee rates and amounts waived related to investments in the underlying Price Fund(s) for the six months ended November 30, 2017, are as follows:
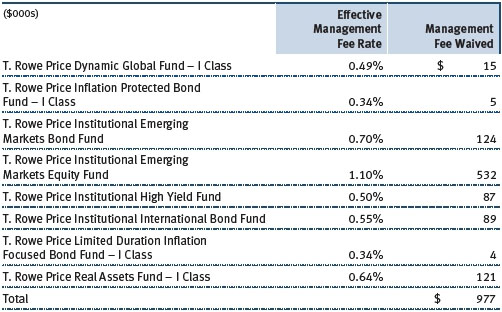
The fund may participate in securities purchase and sale transactions with other funds or accounts advised by Price Associates (cross trades), in accordance with procedures adopted by the fund’s Board and Securities and Exchange Commission rules, which require, among other things, that such purchase and sale cross trades be effected at the independent current market price of the security. Purchases and sales cross trades aggregated $484,000 and $448,000, respectively, with net realized loss of $56,000 for the six months ended November 30, 2017. Generally, cross trades were executed due to the limited supply of high-quality municipal securities available in the market and the adviser’s decision to continue owning certain investments in funds or accounts advised by Price Associates.
| Information on Proxy Voting Policies, Procedures, and Records |
A description of the policies and procedures used by T. Rowe Price funds and portfolios to determine how to vote proxies relating to portfolio securities is available in each fund’s Statement of Additional Information. You may request this document by calling 1-800-225-5132 or by accessing the SEC’s website, sec.gov.
The description of our proxy voting policies and procedures is also available on our corporate website. To access it, please visit the following Web page:
https://www3.troweprice.com/usis/corporate/en/utility/policies.html
Scroll down to the section near the bottom of the page that says, “Proxy Voting Policies.” Click on the Proxy Voting Policies link in the shaded box.
Each fund’s most recent annual proxy voting record is available on our website and through the SEC’s website. To access it through T. Rowe Price, visit the website location shown above, and scroll down to the section near the bottom of the page that says, “Proxy Voting Records.” Click on the Proxy Voting Records link in the shaded box.
| How to Obtain Quarterly Portfolio Holdings |
The fund files a complete schedule of portfolio holdings with the Securities and Exchange Commission for the first and third quarters of each fiscal year on Form N-Q. The fund’s Form N-Q is available electronically on the SEC’s website (sec.gov); hard copies may be reviewed and copied at the SEC’s Public Reference Room, 100 F St. N.E., Washington, DC 20549. For more information on the Public Reference Room, call 1-800-SEC-0330.
Item 2. Code of Ethics.
A code of ethics, as defined in Item 2 of Form N-CSR, applicable to its principal executive officer, principal financial officer, principal accounting officer or controller, or persons performing similar functions is filed as an exhibit to the registrant’s annual Form N-CSR. No substantive amendments were approved or waivers were granted to this code of ethics during the registrant’s most recent fiscal half-year.
Item 3. Audit Committee Financial Expert.
Disclosure required in registrant’s annual Form N-CSR.
Item 4. Principal Accountant Fees and Services.
Disclosure required in registrant’s annual Form N-CSR.
Item 5. Audit Committee of Listed Registrants.
Not applicable.
Item 6. Investments.
(a) Not applicable. The complete schedule of investments is included in Item 1 of this Form N-CSR.
(b) Not applicable.
Item 7. Disclosure of Proxy Voting Policies and Procedures for Closed-End Management Investment Companies.
Not applicable.
Item 8. Portfolio Managers of Closed-End Management Investment Companies.
Not applicable.
Item 9. Purchases of Equity Securities by Closed-End Management Investment Company and Affiliated Purchasers.
Not applicable.
Item 10. Submission of Matters to a Vote of Security Holders.
Not applicable.
Item 11. Controls and Procedures.
(a) The registrant’s principal executive officer and principal financial officer have evaluated the registrant’s disclosure controls and procedures within 90 days of this filing and have concluded that the registrant’s disclosure controls and procedures were effective, as of that date, in ensuring that information required to be disclosed by the registrant in this Form N-CSR was recorded, processed, summarized, and reported timely.
(b) The registrant’s principal executive officer and principal financial officer are aware of no change in the registrant’s internal control over financial reporting that occurred during the registrant’s second fiscal quarter covered by this report that has materially affected, or is reasonably likely to materially affect, the registrant’s internal control over financial reporting.
Item 12. Exhibits.
(a)(1) The registrant’s code of ethics pursuant to Item 2 of Form N-CSR is filed with the registrant’s annual Form N-CSR.
(2) Separate certifications by the registrant's principal executive officer and principal financial officer, pursuant to Section 302 of the Sarbanes-Oxley Act of 2002 and required by Rule 30a-2(a) under the Investment Company Act of 1940, are attached.
(3) Written solicitation to repurchase securities issued by closed-end companies: not applicable.
(b) A certification by the registrant's principal executive officer and principal financial officer, pursuant to Section 906 of the Sarbanes-Oxley Act of 2002 and required by Rule 30a-2(b) under the Investment Company Act of 1940, is attached.
SIGNATURES
Pursuant to the requirements of the Securities Exchange Act of 1934 and the Investment Company Act of 1940, the registrant has duly caused this report to be signed on its behalf by the undersigned, thereunto duly authorized.
T. Rowe Price Personal Strategy Funds, Inc.
| By | | /s/ Edward C. Bernard |
| | | Edward C. Bernard |
| | | Principal Executive Officer |
| |
| Date | | January 19, 2018 | | | | |
Pursuant to the requirements of the Securities Exchange Act of 1934 and the Investment Company Act of 1940, this report has been signed below by the following persons on behalf of the registrant and in the capacities and on the dates indicated.
| By | | /s/ Edward C. Bernard |
| | | Edward C. Bernard |
| | | Principal Executive Officer |
| |
| Date | | January 19, 2018 | | | | |
| |
| |
| By | | /s/ Catherine D. Mathews |
| | | Catherine D. Mathews |
| | | Principal Financial Officer |
| |
| Date | | January 19, 2018 | | | | |