UNITED STATES
SECURITIES AND EXCHANGE COMMISSION
Washington, D.C. 20549
FORM N-CSR
CERTIFIED SHAREHOLDER REPORT OF REGISTERED
MANAGEMENT INVESTMENT COMPANIES
Investment Company Act File Number: 811-07173
| T. Rowe Price Spectrum Funds II, Inc. |
|
| (Exact name of registrant as specified in charter) |
| |
| 100 East Pratt Street, Baltimore, MD 21202 |
|
| (Address of principal executive offices) |
| |
| David Oestreicher |
| 100 East Pratt Street, Baltimore, MD 21202 |
|
| (Name and address of agent for service) |
Registrant’s telephone number, including area code: (410) 345-2000
Date of fiscal year end: May 31
Date of reporting period: November 30, 2020
Item 1. Reports to Shareholders
(a) Report pursuant to Rule 30e-1.
| Spectrum Conservative Allocation Fund | November 30, 2020 |
| PRSIX | Investor Class |
| PPIPX | I Class |
| T. ROWE PRICE SPECTRUM ALLOCATION FUNDS |
|
HIGHLIGHTS
| ■ | The Spectrum Allocation Funds delivered strong absolute and relative returns over the six months ended November 30, 2020, as each fund outperformed its respective combined index benchmark and Lipper peer group index. |
| |
| ■ | Although the coronavirus has continued to weigh on global economies and has contributed to a period of sustained volatility for risk assets, investor sentiment has recently been bolstered by positive news about the development of vaccines and therapeutics. Markets have also celebrated the prospects of a divided U.S. government, but the rally may falter should control of the Senate tip in favor of Democrats, as this could increase the likelihood of more progressive policies that are mostly viewed as anti-business. |
| |
| ■ | We pared our exposure to equities during the period and are now neutral between stocks and bonds, as we seek to balance extended valuations and market risk against an improving outlook for global growth. Over the period, we tilted to an overweight to international stocks relative to U.S. stocks and shifted to a modest overweight in U.S. value-oriented equities. |
| |
| ■ | We believe that the funds’ diversification and flexibility to identify investment opportunities across sectors and regions should allow us to generate solid long-term returns in a variety of market environments. |

Log in to your account at troweprice.com for more information.
*Certain mutual fund accounts that are assessed an annual account service fee can also save money by switching to e-delivery.
CIO Market Commentary
Dear Shareholder
Nearly all major stock and bond indexes produced positive results during the first half of your fund’s fiscal year, the six-month period ended November 30, 2020, as markets recovered from the steep sell-off in February and March. Extraordinary fiscal and monetary support from global governments and central banks helped spur the rebound, although the pandemic continued to pose significant public health and economic challenges.
In the U.S., the large-cap Dow Jones Industrial Average and S&P 500 Index reached record highs, as did the technology-heavy Nasdaq Composite Index—a result that few would have predicted in late March after the benchmarks tumbled more than 30% in response to the initial spread of the coronavirus. Large-cap information technology and internet-related firms that benefited from the work-from-home environment led the rebound. However, a series of announcements in November about successful vaccine trials raised hopes for a broader recovery in 2021 and boosted some sectors that had been beaten down in the initial phases of the pandemic. Meanwhile, former Vice President Joe Biden’s victory in the presidential election led to a reduction in political uncertainty.
In the S&P 500, industrials and materials were the top performers, and the consumer discretionary and technology sectors also recorded very strong results. Energy companies rallied late in the period as oil prices rose, but the sector still finished with negative results. Growth stocks outperformed their value counterparts, and a late surge helped smaller-cap shares finish the period with stronger results than larger companies.
Most equity markets outside the U.S. also performed well. Emerging markets outpaced developed markets, and Asian shares were among the top performers as China and other countries in the region proved successful in controlling the coronavirus. A weaker U.S. dollar generally supported returns for U.S. investors in foreign securities.
Within the fixed income universe, intermediate- and longer-term Treasury yields ticked higher during the period but remained very low by historical standards, a factor that encouraged investors to seek out riskier securities with higher return potential. High yield bonds were especially strong as investors grew less risk averse, allowing the market to absorb heavy new issuance and the arrival of numerous “fallen angels,” or issuers that lost their investment-grade credit rating. Emerging markets bonds and investment-grade corporate debt also performed well amid the search for yield, while Treasuries recorded modest losses. (Bond prices and yields move in opposite directions.)
The firm response by governments and central banks around the world was a key factor in supporting the economic and market recovery. In the U.S., the federal government’s relief package totaled $2.4 trillion, or over 11% of gross domestic product (GDP), while the Federal Reserve cut interest rates close to zero in March and purchased massive amounts of government, mortgage-backed, and corporate bonds during the period to stimulate the economy and increase liquidity in the fixed income market.
Boosted by the stimulus, GDP increased 33.1% in the third quarter, according to the latest estimates, erasing much of the steep decline suffered in the first half of the year. However, there were signs that the recovery was slowing as the fiscal impact of the pandemic relief programs began to fade and coronavirus cases surged again in the U.S. and Europe in the fall. By October, retail sales and payroll growth had slowed to their lowest levels since the rebound began in the spring. Negotiations for a renewed stimulus effort in the U.S. continued at the end of the period.
We are hopeful that the distribution of vaccines will bring about an eventual return to normalcy in the coming year, but many uncertainties remain. The economic effects of the pandemic are likely to echo for some time, and the recovery could be markedly uneven across countries, industries, and individual companies. In this environment, we believe strong fundamental analysis and skilled active security selection will remain critical components of investment success.
Thank you for your continued confidence in T. Rowe Price.
Sincerely,

Robert Sharps
Group Chief Investment Officer
Management’s Discussion of Fund Performance
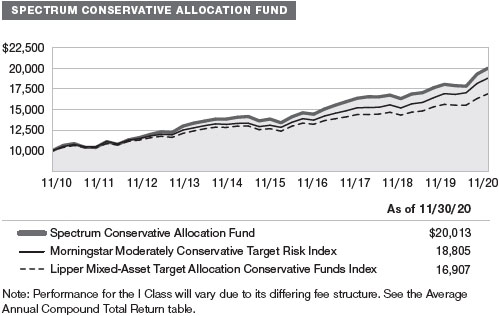
INVESTMENT OBJECTIVE FOR THE SPECTRUM CONSERVATIVE ALLOCATION FUND
The fund seeks the highest total return over time consistent with a primary emphasis on income and a secondary emphasis on capital growth.
How did the fund perform in the past six months?
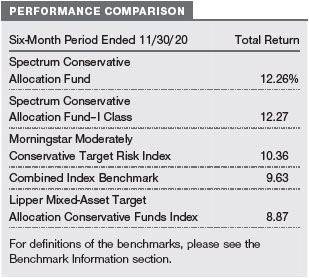
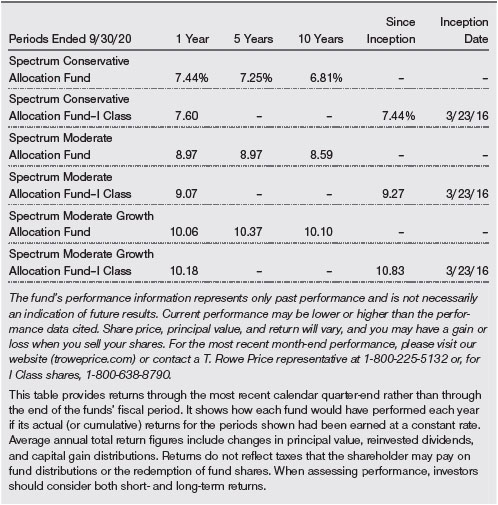
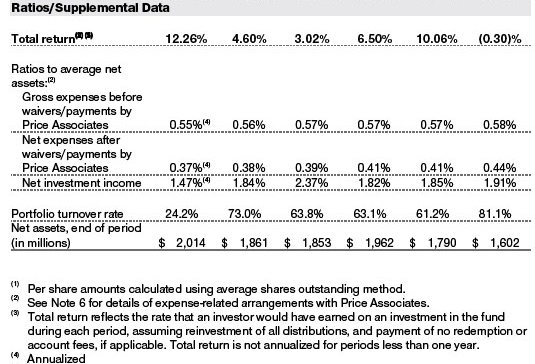
The Spectrum Conservative Allocation Fund returned 12.26% for the six months ended November 30, 2020. The fund outperformed its combined index benchmark and the Lipper Mixed-Asset Target Allocation Conservative Funds Index. (The return for I Class shares reflects a different fee structure. Past performance cannot guarantee future results.)
What factors influenced the fund’s performance?
Strong security selection within the fund’s underlying investments was the leading contributor to relative performance, while diversification and tactical asset allocation also added value. With respect to security selection, the allocation to U.S. large-cap value stocks was a notable contributor, driven by holdings in the information technology and health care sectors. Security selection within the allocation to international developed equities also added value, while selection among U.S. large-cap growth and small-cap equities detracted. Within fixed income, strong selection among U.S. investment-grade bonds contributed, as the allocation solidly outpaced the Bloomberg Barclays U.S. Aggregate Bond Index. Returns were further bolstered by selection within the emerging markets debt, U.S. dollar-hedged international bonds, and absolute-return-oriented bond strategies.
Exposure to fixed income sectors not included in the fund’s benchmark—emerging markets and high yield bonds—lifted relative performance. While these sectors sold off sharply early in 2020 amid the pandemic-induced downturn, both rallied on the back of increased risk appetite and demand for yield amid a pervasive low interest rate environment. Conversely, the inclusion of real assets stocks detracted, although this impact was partly offset by a favorable underweight allocation to the sector.
Tactical decisions to overweight and underweight various asset classes helped performance. An overweight allocation to emerging markets stocks contributed, as emerging markets equities outpaced stocks in developed markets outside the U.S. We held a favorable overweight to U.S. growth stocks early in the period, which benefited from a market recovery that was heavily concentrated in growth-oriented sectors. This runup led to extended valuations for growth names and comparatively attractive valuations within value, and we shifted our exposure to a modest overweight to value. This well-timed overweight was beneficial late in the period, as an improved economic outlook provided a boost for the more cyclically oriented value sectors. Also beneficial was our overweight to U.S. small-cap stocks, which outperformed large-cap equities. An underweight to long-term U.S. Treasuries, which lagged investment-grade issues, also contributed.
The fund’s allocation to alternative investments through a conservative, diversified hedge fund of funds contributed to relative returns. The Blackstone Hedge Fund Solutions strategy outpaced its style-specific, conservative hedge fund of funds index, as well as cash and the fixed income index.
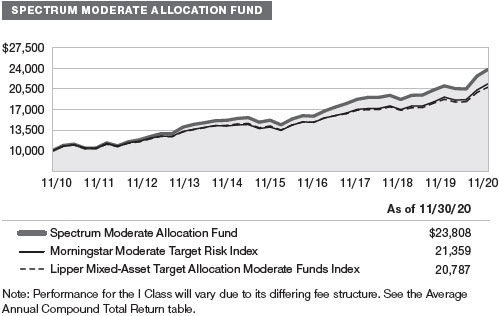
INVESTMENT OBJECTIVE FOR THE SPECTRUM MODERATE ALLOCATION FUND
The fund seeks the highest total return over time consistent with an emphasis on both capital growth and income.
How did the fund perform in the past six months?
The Spectrum Moderate Allocation Fund returned 16.19% for the six months ended November 30, 2020. The fund outperformed its combined index benchmark and the Lipper Mixed-Asset Target Allocation Moderate Funds Index. (The return for I Class shares reflects a different fee structure. Past performance cannot guarantee future results.)

What factors influenced the fund’s performance?
Strong security selection within the fund’s underlying investments was the leading contributor to relative performance, while diversification and tactical asset allocation also added value. With respect to security selection, the allocation to U.S. large-cap value stocks was a notable contributor, driven by holdings in the information technology and health care sectors. Security selection within the allocation to international developed equities also added value, while selection among U.S. large-cap growth and small-cap equities detracted. Within fixed income, strong selection among U.S. investment-grade bonds contributed, as the allocation solidly outpaced the Bloomberg Barclays U.S. Aggregate Bond Index. Returns were further bolstered by selection within the U.S. dollar-hedged international bonds, emerging markets debt, and absolute-return-oriented bond strategies.
Exposure to fixed income sectors not included in the fund’s benchmark—emerging markets and high yield bonds—lifted relative performance. While these sectors sold off sharply early in 2020 amid the pandemic-induced downturn, both rallied on the back of increased risk appetite and demand for yield amid a pervasive low interest rate environment. Conversely, the inclusion of real assets stocks detracted, although this impact was partly offset by a favorable underweight allocation to the sector. Exposure to long-term U.S. Treasuries, which lagged the broad fixed income benchmark, detracted from relative performance, though the impact was largely mitigated by a favorable underweight allocation.
Tactical decisions to overweight and underweight various asset classes helped performance. An overweight allocation to emerging markets stocks contributed, as emerging markets equities outpaced stocks in developed markets outside the U.S. We held a favorable overweight to U.S. growth stocks early in the period, which benefited from a market recovery that was heavily concentrated in growth-oriented sectors. This runup led to extended valuations for growth names and comparatively attractive valuations within value, and we shifted our exposure to a modest overweight to value. This well-timed overweight was beneficial late in the period, as an improved economic outlook provided a boost for the more cyclically oriented value sectors. Also beneficial was our overweight to U.S. small-cap stocks, which outperformed large-cap equities. An underweight to long-term U.S. Treasuries, which lagged investment-grade issues, also contributed.

The fund’s allocation to alternative investments through a conservative, diversified hedge fund of funds contributed to relative returns. The Blackstone Hedge Fund Solutions strategy outpaced its style-specific, conservative hedge fund of funds index, as well as cash and the fixed income index.
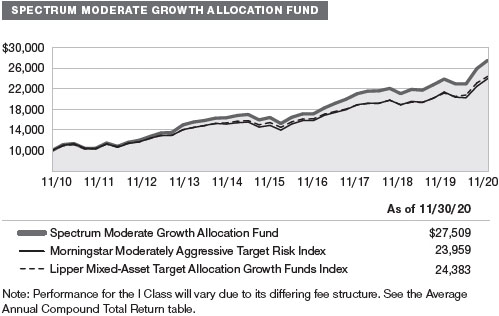
INVESTMENT OBJECTIVE FOR THE SPECTRUM MODERATE GROWTH ALLOCATION FUND
The fund seeks the highest total return over time consistent with a primary emphasis on capital growth and a secondary emphasis on income.
How did the fund perform in the past six months?
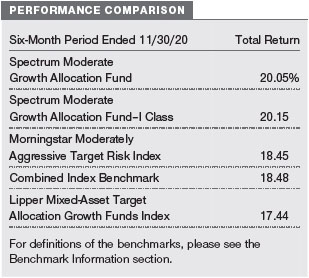
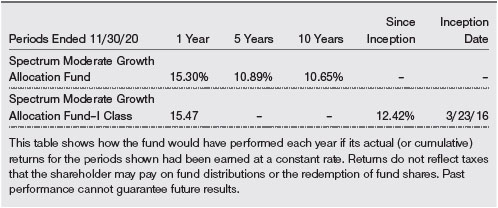
The Spectrum Moderate Growth Allocation Fund returned 20.05% for the six months ended November 30, 2020. The fund outperformed its combined index benchmark and the Lipper Mixed-Asset Target Allocation Growth Funds Index. (The return for I Class shares reflects a different fee structure. Past performance cannot guarantee future results.)
What factors influenced the fund’s performance?
Strong security selection within the fund’s underlying investments and tactical asset allocation decisions contributed to relative performance, while the inclusion of certain diversifying sectors detracted. With respect to security selection, the allocation to U.S. large-cap value stocks was a notable contributor, driven by holdings in the information technology and health care sectors. Security selection within the allocation to international developed equities also added value, while selection among U.S. large-cap growth and small-cap equities detracted. Within fixed income, strong selection among U.S. investment-grade bonds contributed, as the allocation solidly outpaced the Bloomberg Barclays U.S. Aggregate Bond Index.
Tactical decisions to overweight and underweight various asset classes helped performance. An overweight allocation to emerging markets stocks contributed, as emerging markets equities outpaced stocks in developed markets outside the U.S. We held a favorable overweight to U.S. growth stocks early in the period, which benefited from a market recovery that was heavily concentrated in growth-oriented sectors. This runup led to extended valuations for growth names and comparatively attractive valuations within value, and we shifted our exposure to a modest overweight to value. This well-timed overweight was beneficial late in the period, as an improved economic outlook provided a boost for the more cyclically oriented value sectors. Also beneficial was our overweight to U.S. small-cap stocks, which outperformed large-cap equities. We entered the period with an overweight to equities, but as markets rallied and valuations appeared less compelling, we pared our exposure and allocated proceeds to cash and bonds. While our cash position provided liquidity, it was also a modest drag on performance during a period of strong returns for equity and fixed income assets.
The inclusion of real assets stocks detracted, as real assets underperformed global equities despite delivering positive absolute returns. This negative impact was partly offset by a favorable underweight allocation to the sector. Exposure to fixed income sectors not included in the fund’s benchmark—emerging markets and high yield bonds—lifted relative performance. While these sectors sold off sharply early in 2020 amid the pandemic-induced downturn, both rallied on the back of increased risk appetite and demand for yield amid a pervasive low interest rate environment. This positive impact was less pronounced relative to the other Spectrum Allocation Funds, due to the Spectrum Moderate Growth Allocation Fund’s structural tilt toward equities.

The fund’s allocation to alternative investments through a conservative, diversified hedge fund of funds contributed to relative returns. The Blackstone Hedge Fund Solutions strategy outpaced its style-specific, conservative hedge fund of funds index, as well as cash and the fixed income index.
How are the Spectrum Allocation Funds positioned?
As of November 30, 2020, we are neutral between stocks and bonds. We pared our exposure to equities during the period, as we sought to balance extended valuations in both markets, downside risks from surging coronavirus cases, and the aftermath of U.S. elections against supportive monetary policy, upside potential from fiscal policy, and the prospects for a coronavirus vaccine distribution by early next year.
Stocks
On a regional basis, we tilted to an overweight to international stocks relative to U.S. stocks. International equities offer relatively attractive valuations, and their more cyclical profile could be beneficial as the outlook for global growth in 2021 has improved. Aggressive stimulus measures and stable Chinese demand could also provide tailwinds for international stocks. Conversely, the U.S.’s more defensive sector profile now appears relatively less supportive, as does the expectation for potential weakness in the U.S. dollar. Outside the U.S., we are overweight to emerging markets, favoring cyclical sectors—such as financials and industrials and business services—and the Latin America and emerging Europe and Asia regions. Exposure to global trade and favorable currency trends offer strong tailwinds for emerging markets stocks.
In the U.S., we shifted to a modest overweight in value-oriented equities, as they may benefit from the gradual recovery in economic growth and have attractive valuations versus growth stocks. Although earnings trends remain supportive, the recovery in equities has been narrowly concentrated among secular growth names, which has resulted in extended valuations. We are overweight to U.S. small-cap equities as they offer upside potential and could outpace larger companies in an economic recovery. Fiscal stimulus, positive vaccine news, and consumer confidence have, thus far, tempered bankruptcy risks among small-caps.
We are underweight to inflation-sensitive real assets equities, as we balance expectations for modestly higher inflation against structural headwinds facing the real estate and energy sectors. Inflation expectations have risen on an improving outlook for growth and the perception that central banks will be more tolerant of inflation as they prioritize growth and employment. However, commercial real estate remains under pressure from structural headwinds that have been exacerbated by the pandemic, including work-from-home and online retail trends. Despite the expected recovery in demand, the energy sector still faces longer-term supply/demand imbalances and a growing emphasis on renewable energy.
Bonds
Yields for U.S. investment-grade bonds remain near record lows. We are overweight to high yield bonds as credit spreads remain at attractive levels relative to investment-grade bonds. However, the pandemic could weigh on consumer-related and energy sectors—which make up a significant portion of the high yield sector—and we are cautious of downgrade and default risks. Within the noninvestment-grade sector, we are overweight to floating rate bank loans, which sold off earlier this year, leaving spreads at historically attractive levels. Floating rate loans also have less exposure to the energy sector and have a higher standing in the capital structure.
We are overweight to U.S. dollar-hedged international bonds, which offer yield curve diversification relative to U.S. bonds, where we may see a steepening of the U.S. yield curve in the context of economic recovery. We are neutral to emerging markets bonds, which are expensive after their recent rally. Although the sector offers attractive yields, limited fiscal support from local governments is a concern.
What is portfolio management’s outlook for the Spectrum Allocation Funds?
Aggressive monetary and fiscal stimulus measures in the U.S. and other countries have helped fuel a rally that saw major indexes bounce back from March lows to new highs late in the reporting period. Financial markets have become increasingly dependent on stimulus measures, but this tailwind may be fading. Meanwhile, the coronavirus pandemic has proven difficult to contain in the U.S., and expectations for further fiscal stimulus have been met with disappointment as heightened political tensions have impeded significant legislative action. Although the virus has continued to weigh on the global economy and has contributed to a period of sustained volatility for risk assets, investor sentiment has been bolstered by positive news about the development of vaccines and therapeutics.
While we await the full results from the U.S. elections, with the balance of power in the Senate hinging on two very close runoff elections in Georgia in early January, markets have seemingly celebrated the prospects of a divided government—a Democrat-controlled House of Representatives with a Joe Biden presidency, and Republicans maintaining control of the Senate. If the divided government holds, a more balanced political environment—which would temper the chances of more extreme policies by either party and hopefully lead to an environment of more compromise—could lead to reduced market volatility and a more supportive backdrop for risk assets. However, should Democrats also win control of the Senate, markets may begin to factor in the likelihood of more progressive policies on taxes and tighter regulation, which could result in a negative market shock.
Elevated volatility and uncertainty in global markets underscores the value of our thoughtful strategic investing approach. Given the uncertain impact of positive and negative forces on the horizon that can drive global financial markets, we believe that the broad diversification of the Spectrum Allocation Funds and T. Rowe Price’s strengths in fundamental research will help us deliver solid returns in a variety of market environments over the long term.
The views expressed reflect the opinions of T. Rowe Price as of the date of this report and are subject to change based on changes in market, economic, or other conditions. These views are not intended to be a forecast of future events and are no guarantee of future results.
RISKS OF INVESTING
Stocks generally fluctuate in value more than bonds and may decline significantly over short time periods. There is a chance that stock prices overall will decline because stock markets tend to move in cycles, with periods of rising and falling prices. The value of stocks held by the fund may decline due to general weakness or volatility in the stock markets in which the fund invests or because of factors that affect a particular company or industry.
Economic and other market developments can adversely affect the fixed income securities markets. At times, participants in these markets may develop concerns about the ability of certain issuers of debt instruments to make timely principal and interest payments, or they may develop concerns about the ability of financial institutions that make markets in certain debt instruments to facilitate an orderly market. Those concerns could cause increased volatility and reduced liquidity in particular securities or in the overall fixed income markets and the related derivatives markets. A lack of liquidity or other adverse credit market conditions may hamper the fund’s ability to sell the debt instruments in which it invests or to find and purchase suitable debt instruments.
The prices of, and the income generated by, debt instruments held by the fund may be affected by changes in interest rates. A rise in interest rates typically causes the price of a fixed rate debt instrument to fall and its yield to rise. Conversely, a decline in interest rates typically causes the price of a fixed rate debt instrument to rise and the yield to fall. Generally, funds with longer weighted average maturities and durations carry greater interest rate risk. Changes in monetary policy made by central banks and/or governments such as the discontinuation and replacement of benchmark rates are likely to affect the level of interest rates.
Investing in the securities of non-U.S. issuers involves special risks not typically associated with investing in U.S. issuers. Non-U.S. securities tend to be more volatile and have lower overall liquidity than investments in U.S. securities and may lose value because of adverse local, political, social, or economic developments overseas or due to changes in the exchange rates between foreign currencies and the U.S. dollar. In addition, investments outside the U.S. are subject to settlement practices and regulatory and financial reporting standards that differ from those of the U.S. The risks of investing outside the U.S. are heightened for any investments in emerging markets, which are susceptible to greater volatility than investments in developed markets.
These are some of the principal risks of investing in the Spectrum Allocation Funds. For a more thorough discussion of risks, please see the prospectus.
BENCHMARK INFORMATION
Combined index benchmarks: Unmanaged blended index benchmarks composed of the following underlying indexes as of November 30, 2020:
| ■ | Spectrum Conservative Allocation—40% stocks (28% Russell 3000 Index, 12% MSCI All Country World Index ex USA), 40% bonds (Bloomberg Barclays U.S. Aggregate Bond Index), and 20% money market securities (FTSE 3-Month Treasury Bill Index). |
| |
| ■ | Spectrum Moderate Allocation—60% stocks (42% Russell 3000 Index, 18% MSCI All Country World Index ex USA), 30% bonds (Bloomberg Barclays U.S. Aggregate Bond Index), and 10% money market securities (FTSE 3-Month Treasury Bill Index). |
| |
| ■ | Spectrum Moderate Growth Allocation—80% stocks (56% Russell 3000 Index, 24% MSCI All Country World Index ex USA) and 20% bonds (Bloomberg Barclays U.S. Aggregate Bond Index). |
Note: Bloomberg Index Services Ltd. Copyright © 2020, Bloomberg Index Services Ltd. Used with permission.
Note: FTSE is a trademark of the LSE Group and is used by FTSE International Limited (“FTSE”) under license. “NAREIT” is a trademark of the Nareit. All rights in the FTSE 3-Month Treasury Bill Index (the “Index”) vest in FTSE and Nareit. Neither FTSE, nor the LSE Group, nor Nareit accept any liability for any errors or omissions in the indexes or data and no party may rely on any indexes or data contained in this communication. No further distribution of data from the FTSE or Nareit is permitted without the relevant FTSE’s express written consent. FTSE, the LSE Group, and Nareit do not promote, sponsor or endorse the content of this communication.
Note: MSCI makes no express or implied warranties or representations and shall have no liability whatsoever with respect to any MSCI data contained herein. The MSCI data may not be further redistributed or used as a basis for other indices or any securities or financial products. This report is not approved, reviewed, or produced by MSCI.
Note: Frank Russell Company (Russell) is the source and owner of the Russell index data contained or reflected in these materials and all trademarks and copyrights related thereto. Russell® is a registered trademark of Russell. Russell is not responsible for the formatting or configuration of these materials or for any inaccuracy in T. Rowe Price Associates’ presentation thereof.
GROWTH OF $10,000
This chart shows the value of a hypothetical $10,000 investment in the fund over the past 10 fiscal year periods or since inception (for funds lacking 10-year records). The result is compared with benchmarks, which include a broad-based market index and may also include a peer group average or index. Market indexes do not include expenses, which are deducted from fund returns as well as mutual fund averages and indexes.
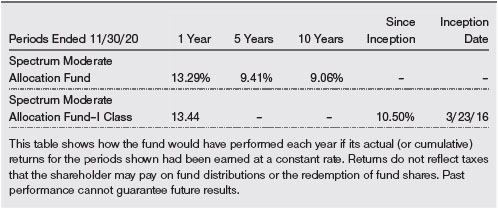
AVERAGE ANNUAL COMPOUND TOTAL RETURN

GROWTH OF $10,000
This chart shows the value of a hypothetical $10,000 investment in the fund over the past 10 fiscal year periods or since inception (for funds lacking 10-year records). The result is compared with benchmarks, which include a broad-based market index and may also include a peer group average or index. Market indexes do not include expenses, which are deducted from fund returns as well as mutual fund averages and indexes.
AVERAGE ANNUAL COMPOUND TOTAL RETURN
EXPENSE RATIO

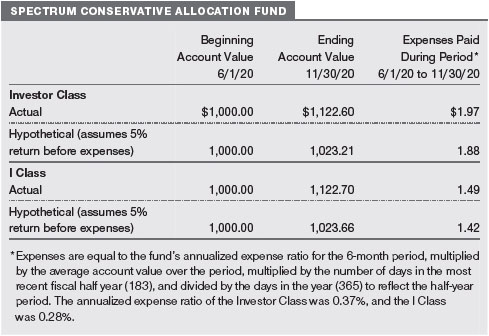
FUND EXPENSE EXAMPLE
As a mutual fund shareholder, you may incur two types of costs: (1) transaction costs, such as redemption fees or sales loads, and (2) ongoing costs, including management fees, distribution and service (12b-1) fees, and other fund expenses. The following example is intended to help you understand your ongoing costs (in dollars) of investing in the fund and to compare these costs with the ongoing costs of investing in other mutual funds. The example is based on an investment of $1,000 invested at the beginning of the most recent six-month period and held for the entire period.
Please note that the fund has two share classes: The original share class (Investor Class) charges no distribution and service (12b-1) fee, and the I Class shares are also available to institutionally oriented clients and impose no 12b-1 or administrative fee payment. Each share class is presented separately in the table.
Actual Expenses
The first line of the following table (Actual) provides information about actual account values and expenses based on the fund’s actual returns. You may use the information on this line, together with your account balance, to estimate the expenses that you paid over the period. Simply divide your account value by $1,000 (for example, an $8,600 account value divided by $1,000 = 8.6), then multiply the result by the number on the first line under the heading “Expenses Paid During Period” to estimate the expenses you paid on your account during this period.
Hypothetical Example for Comparison Purposes
The information on the second line of the table (Hypothetical) is based on hypothetical account values and expenses derived from the fund’s actual expense ratio and an assumed 5% per year rate of return before expenses (not the fund’s actual return). You may compare the ongoing costs of investing in the fund with other funds by contrasting this 5% hypothetical example and the 5% hypothetical examples that appear in the shareholder reports of the other funds. The hypothetical account values and expenses may not be used to estimate the actual ending account balance or expenses you paid for the period.
Note: T. Rowe Price charges an annual account service fee of $20, generally for accounts with less than $10,000. The fee is waived for any investor whose T. Rowe Price mutual fund accounts total $50,000 or more; accounts electing to receive electronic delivery of account statements, transaction confirmations, prospectuses, and shareholder reports; or accounts of an investor who is a T. Rowe Price Personal Services or Enhanced Personal Services client (enrollment in these programs generally requires T. Rowe Price assets of at least $250,000). This fee is not included in the accompanying table. If you are subject to the fee, keep it in mind when you are estimating the ongoing expenses of investing in the fund and when comparing the expenses of this fund with other funds.
You should also be aware that the expenses shown in the table highlight only your ongoing costs and do not reflect any transaction costs, such as redemption fees or sales loads. Therefore, the second line of the table is useful in comparing ongoing costs only and will not help you determine the relative total costs of owning different funds. To the extent a fund charges transaction costs, however, the total cost of owning that fund is higher.


QUARTER-END RETURNS
Unaudited

The accompanying notes are an integral part of these financial statements.
Unaudited


The accompanying notes are an integral part of these financial statements.
November 30, 2020 (Unaudited)


The accompanying notes are an integral part of these financial statements.
November 30, 2020 (Unaudited)

The accompanying notes are an integral part of these financial statements.
Unaudited

The accompanying notes are an integral part of these financial statements.
Unaudited

The accompanying notes are an integral part of these financial statements.
Unaudited
| NOTES TO FINANCIAL STATEMENTS |
T. Rowe Price Spectrum Funds II, Inc. (the corporation) is registered under the Investment Company Act of 1940 (the 1940 Act). The Spectrum Conservative Allocation Fund (the fund) is a diversified, open-end management investment company established by the corporation. The fund seeks the highest total return over time consistent with a primary emphasis on income and a secondary emphasis on capital growth. The fund has two classes of shares: the Spectrum Conservative Allocation Fund (Investor Class) and the Spectrum Conservative Allocation Fund–I Class (I Class). I Class shares require a $1 million initial investment minimum, although the minimum generally is waived for retirement plans, financial intermediaries, and certain other accounts. Each class has exclusive voting rights on matters related solely to that class; separate voting rights on matters that relate to both classes; and, in all other respects, the same rights and obligations as the other class.
NOTE 1 - SIGNIFICANT ACCOUNTING POLICIES
Basis of Preparation The fund is an investment company and follows accounting and reporting guidance in the Financial Accounting Standards Board (FASB) Accounting Standards Codification Topic 946 (ASC 946). The accompanying financial statements were prepared in accordance with accounting principles generally accepted in the United States of America (GAAP), including, but not limited to, ASC 946. GAAP requires the use of estimates made by management. Management believes that estimates and valuations are appropriate; however, actual results may differ from those estimates, and the valuations reflected in the accompanying financial statements may differ from the value ultimately realized upon sale or maturity.
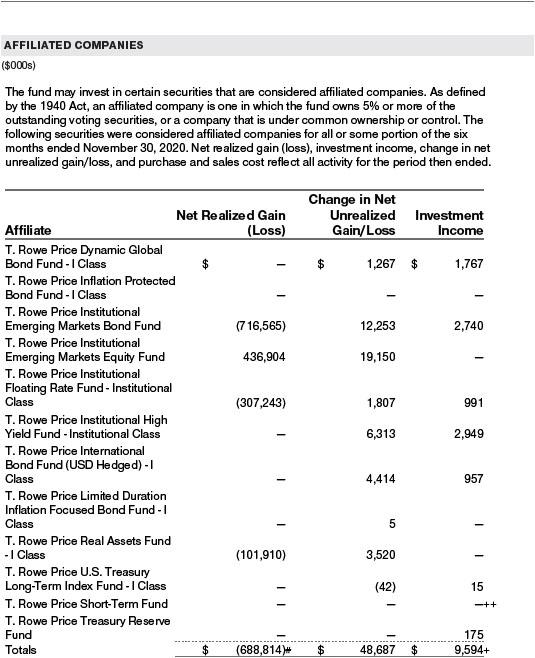
Investment Transactions, Investment Income, and Distributions Investment transactions are accounted for on the trade date basis. Income and expenses are recorded on the accrual basis. Realized gains and losses are reported on the identified cost basis. Premiums and discounts on debt securities are amortized for financial reporting purposes. Paydown gains and losses are recorded as an adjustment to interest income. Income tax-related interest and penalties, if incurred, are recorded as income tax expense. Dividends received from mutual fund investments are reflected as dividend income; capital gain distributions are reflected as realized gain/loss. Dividend income and capital gain distributions are recorded on the ex-dividend date. Earnings on investments recognized as partnerships for federal income tax purposes reflect the tax character of such earnings. Distributions from REITs are initially recorded as dividend income and, to the extent such represent a return of capital or capital gain for tax purposes, are reclassified when such information becomes available. Non-cash dividends, if any, are recorded at the fair market value of the asset received. Distributions to shareholders are recorded on the ex-dividend date. Income distributions, if any, are declared and paid by each class quarterly. A capital gain distribution may also be declared and paid by the fund annually.
Currency Translation Assets, including investments, and liabilities denominated in foreign currencies are translated into U.S. dollar values each day at the prevailing exchange rate, using the mean of the bid and asked prices of such currencies against U.S. dollars as quoted by a major bank. Purchases and sales of securities, income, and expenses are translated into U.S. dollars at the prevailing exchange rate on the respective date of such transaction. The effect of changes in foreign currency exchange rates on realized and unrealized security gains and losses is not bifurcated from the portion attributable to changes in market prices.
Class Accounting Shareholder servicing, prospectus, and shareholder report expenses incurred by each class are charged directly to the class to which they relate. Expenses common to both classes, investment income, and realized and unrealized gains and losses are allocated to the classes based upon the relative daily net assets of each class.
Capital Transactions Each investor’s interest in the net assets of the fund is represented by fund shares. The fund’s net asset value (NAV) per share is computed at the close of the New York Stock Exchange (NYSE), normally 4 p.m. ET, each day the NYSE is open for business. However, the NAV per share may be calculated at a time other than the normal close of the NYSE if trading on the NYSE is restricted, if the NYSE closes earlier, or as may be permitted by the SEC. Purchases and redemptions of fund shares are transacted at the next-computed NAV per share, after receipt of the transaction order by T. Rowe Price Associates, Inc., or its agents.
New Accounting Guidance In March 2020, the FASB issued Accounting Standards Update (ASU), ASU 2020-04, Reference Rate Reform (Topic 848) – Facilitation of the Effects of Reference Rate Reform on Financial Reporting, which provides optional, temporary relief with respect to the financial reporting of contracts subject to certain types of modifications due to the planned discontinuation of the London Interbank Offered Rate (LIBOR) and other interbank-offered based reference rates as of the end of 2021. The guidance is effective for certain reference rate-related contract modifications that occur during the period March 12, 2020 through December 31, 2022. Management expects that the adoption of the guidance will not have a material impact on the fund’s financial statements.
Indemnification In the normal course of business, the fund may provide indemnification in connection with its officers and directors, service providers, and/or private company investments. The fund’s maximum exposure under these arrangements is unknown; however, the risk of material loss is currently considered to be remote.
NOTE 2 - VALUATION
Fair Value The fund’s financial instruments are valued at the close of the NYSE and are reported at fair value, which GAAP defines as the price that would be received to sell an asset or paid to transfer a liability in an orderly transaction between market participants at the measurement date. The T. Rowe Price Valuation Committee (the Valuation Committee) is an internal committee that has been delegated certain responsibilities by the fund’s Board of Directors (the Board) to ensure that financial instruments are appropriately priced at fair value in accordance with GAAP and the 1940 Act. Subject to oversight by the Board, the Valuation Committee develops and oversees pricing-related policies and procedures and approves all fair value determinations. Specifically, the Valuation Committee establishes policies and procedures used in valuing financial instruments, including those which cannot be valued in accordance with normal procedures or using pricing vendors; determines pricing techniques, sources, and persons eligible to effect fair value pricing actions; evaluates the services and performance of the pricing vendors; oversees the pricing process to ensure policies and procedures are being followed; and provides guidance on internal controls and valuation-related matters. The Valuation Committee provides periodic reporting to the Board on valuation matters.
Various valuation techniques and inputs are used to determine the fair value of financial instruments. GAAP establishes the following fair value hierarchy that categorizes the inputs used to measure fair value:
Level 1 – quoted prices (unadjusted) in active markets for identical financial instruments that the fund can access at the reporting date
Level 2 – inputs other than Level 1 quoted prices that are observable, either directly or indirectly (including, but not limited to, quoted prices for similar financial instruments in active markets, quoted prices for identical or similar financial instruments in inactive markets, interest rates and yield curves, implied volatilities, and credit spreads)
Level 3 – unobservable inputs (including the fund’s own assumptions in determining fair value)
Observable inputs are developed using market data, such as publicly available information about actual events or transactions, and reflect the assumptions that market participants would use to price the financial instrument. Unobservable inputs are those for which market data are not available and are developed using the best information available about the assumptions that market participants would use to price the financial instrument. GAAP requires valuation techniques to maximize the use of relevant observable inputs and minimize the use of unobservable inputs. When multiple inputs are used to derive fair value, the financial instrument is assigned to the level within the fair value hierarchy based on the lowest-level input that is significant to the fair value of the financial instrument. Input levels are not necessarily an indication of the risk or liquidity associated with financial instruments at that level but rather the degree of judgment used in determining those values.
Valuation Techniques Equity securities, including exchange-traded funds, listed or regularly traded on a securities exchange or in the over-the-counter (OTC) market are valued at the last quoted sale price or, for certain markets, the official closing price at the time the valuations are made. OTC Bulletin Board securities are valued at the mean of the closing bid and asked prices. A security that is listed or traded on more than one exchange is valued at the quotation on the exchange determined to be the primary market for such security. Listed securities not traded on a particular day are valued at the mean of the closing bid and asked prices for domestic securities and the last quoted sale or closing price for international securities.
The last quoted prices of non-U.S. equity securities may be adjusted to reflect the fair value of such securities at the close of the NYSE, if the fund determines that developments between the close of a foreign market and the close of the NYSE will affect the value of some or all of its portfolio securities. Each business day, the fund uses information from outside pricing services to evaluate and, if appropriate, decide whether it is necessary to adjust quoted prices to reflect fair value by reviewing a variety of factors, including developments in foreign markets, the performance of U.S. securities markets, and the performance of instruments trading in U.S. markets that represent foreign securities and baskets of foreign securities. The fund uses outside pricing services to provide it with quoted prices and information to evaluate or adjust those prices. The fund cannot predict how often it will use quoted prices and how often it will determine it necessary to adjust those prices to reflect fair value.
Debt securities generally are traded in the OTC market and are valued at prices furnished by independent pricing services or by broker dealers who make markets in such securities. When valuing securities, the independent pricing services consider the yield or price of bonds of comparable quality, coupon, maturity, and type, as well as prices quoted by dealers who make markets in such securities.
Investments in mutual funds are valued at the mutual fund’s closing NAV per share on the day of valuation. Investments in private investment companies are valued at the investee’s NAV per share as of the valuation date, if available. If the investee’s NAV is not available as of the valuation date or is not calculated in accordance with GAAP, the Valuation Committee may adjust the investee’s NAV to reflect fair value at the valuation date. Listed options, and OTC options with a listed equivalent, are valued at the mean of the closing bid and asked prices and exchange-traded options on futures contracts are valued at closing settlement prices. Futures contracts are valued at closing settlement prices. Forward currency exchange contracts are valued using the prevailing forward exchange rate. Swaps are valued at prices furnished by an independent pricing service or independent swap dealers. Assets and liabilities other than financial instruments, including short-term receivables and payables, are carried at cost, or estimated realizable value, if less, which approximates fair value.
Investments for which market quotations or market-based valuations are not readily available or deemed unreliable are valued at fair value as determined in good faith by the Valuation Committee, in accordance with fair valuation policies and procedures. The objective of any fair value pricing determination is to arrive at a price that could reasonably be expected from a current sale. Financial instruments fair valued by the Valuation Committee are primarily private placements, restricted securities, warrants, rights, and other securities that are not publicly traded. Factors used in determining fair value vary by type of investment and may include market or investment specific considerations. The Valuation Committee typically will afford greatest weight to actual prices in arm’s length transactions, to the extent they represent orderly transactions between market participants, transaction information can be reliably obtained, and prices are deemed representative of fair value. However, the Valuation Committee may also consider other valuation methods such as market-based valuation multiples; a discount or premium from market value of a similar, freely traded security of the same issuer; discounted cash flows; yield to maturity; or some combination. Fair value determinations are reviewed on a regular basis and updated as information becomes available, including actual purchase and sale transactions of the investment. Because any fair value determination involves a significant amount of judgment, there is a degree of subjectivity inherent in such pricing decisions, and fair value prices determined by the Valuation Committee could differ from those of other market participants.
Valuation Inputs The following table summarizes the fund’s financial instruments, based on the inputs used to determine their fair values on November 30, 2020 (for further detail by category, please refer to the accompanying Portfolio of Investments):

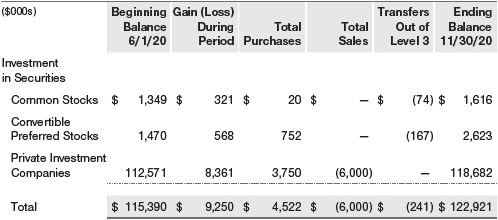
Following is a reconciliation of the fund’s Level 3 holdings for the six months ended November 30, 2020. Gain (loss) reflects both realized and change in unrealized gain/loss on Level 3 holdings during the period, if any, and is included on the accompanying Statement of Operations. The change in unrealized gain/loss on Level 3 instruments held at November 30, 2020, totaled $9,285,000 for the six months ended November 30, 2020. During the six months, transfers out of Level 3 were because observable market data became available for the security.
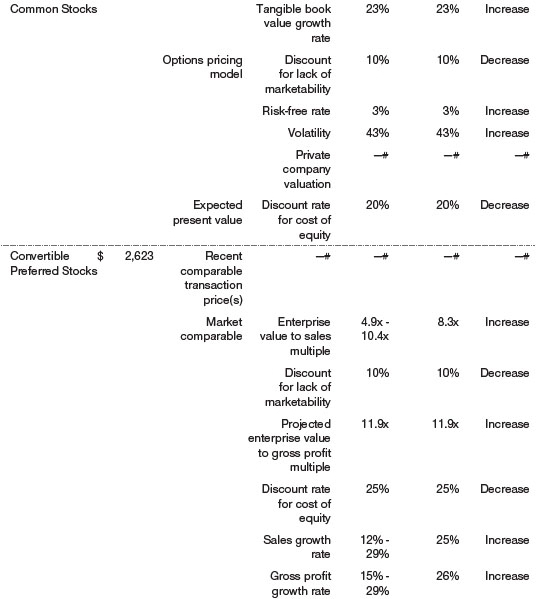
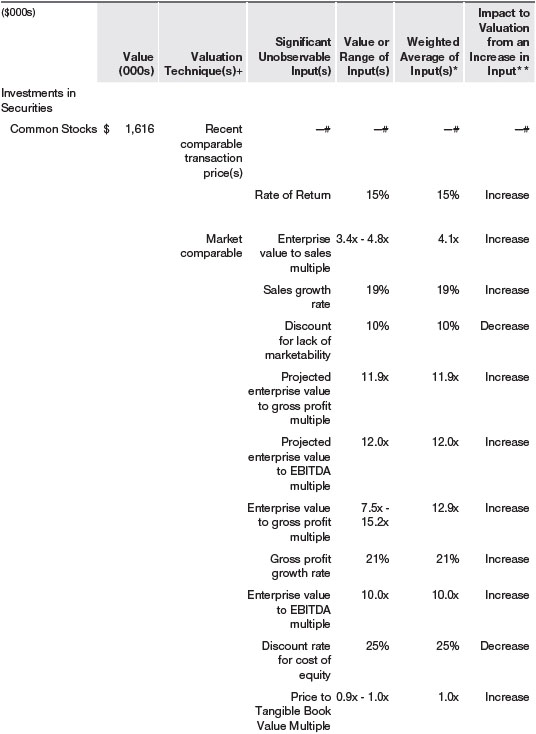
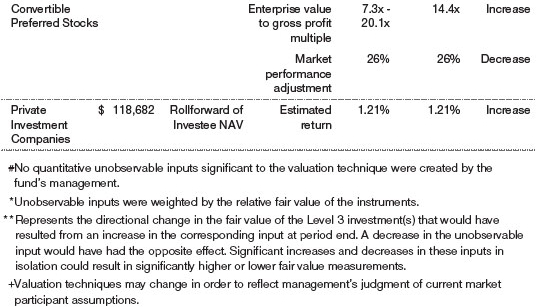
In accordance with GAAP, the following table provides quantitative information about significant unobservable inputs used to determine the fair valuations of the fund’s Level 3 assets, by class of financial instrument. Because the Valuation Committee considers a wide variety of factors and inputs, both observable and unobservable, in determining fair values, the unobservable inputs presented do not reflect all inputs significant to the fair value determination.
NOTE 3 - DERIVATIVE INSTRUMENTS
During the six months ended November 30, 2020, the fund invested in derivative instruments. As defined by GAAP, a derivative is a financial instrument whose value is derived from an underlying security price, foreign exchange rate, interest rate, index of prices or rates, or other variable; it requires little or no initial investment and permits or requires net settlement. The fund invests in derivatives only if the expected risks and rewards are consistent with its investment objectives, policies, and overall risk profile, as described in its prospectus and Statement of Additional Information. The fund may use derivatives for a variety of purposes, such as seeking to hedge against declines in principal value, increase yield, invest in an asset with greater efficiency and at a lower cost than is possible through direct investment, to enhance return, or to adjust credit exposure. The risks associated with the use of derivatives are different from, and potentially much greater than, the risks associated with investing directly in the instruments on which the derivatives are based. The fund at all times maintains sufficient cash reserves, liquid assets, or other SEC-permitted asset types to cover its settlement obligations under open derivative contracts.
The fund values its derivatives at fair value and recognizes changes in fair value currently in its results of operations. Accordingly, the fund does not follow hedge accounting, even for derivatives employed as economic hedges. Generally, the fund accounts for its derivatives on a gross basis. It does not offset the fair value of derivative liabilities against the fair value of derivative assets on its financial statements, nor does it offset the fair value of derivative instruments against the right to reclaim or obligation to return collateral.
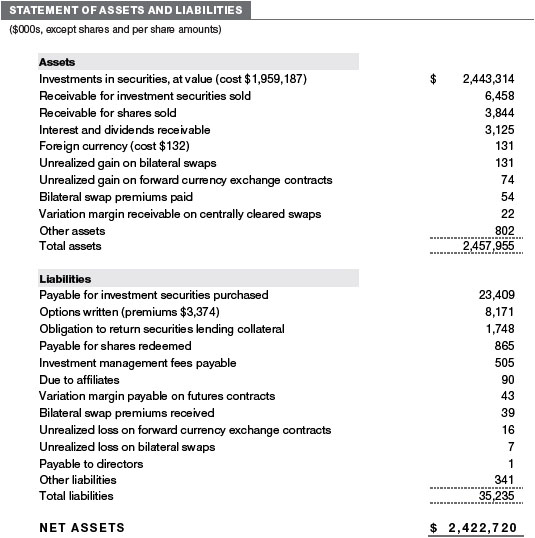
The following table summarizes the fair value of the fund’s derivative instruments held as of November 30, 2020, and the related location on the accompanying Statement of Assets and Liabilities, presented by primary underlying risk exposure:

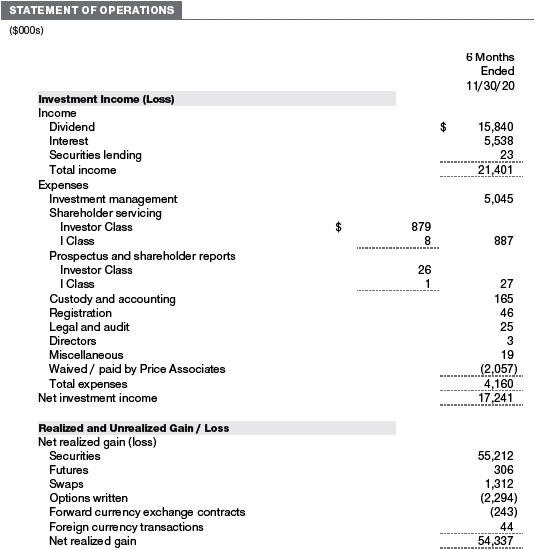
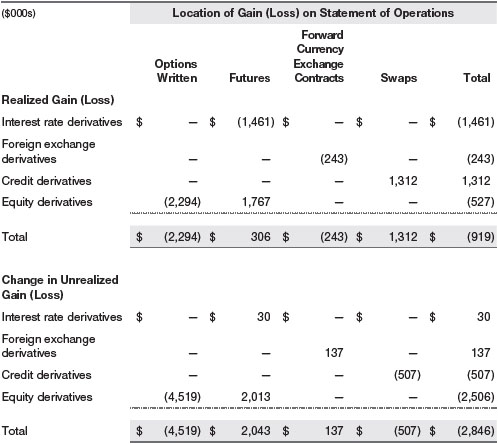
Additionally, the amount of gains and losses on derivative instruments recognized in fund earnings during the six months ended November 30, 2020, and the related location on the accompanying Statement of Operations is summarized in the following table by primary underlying risk exposure:
Counterparty Risk and Collateral The fund invests in derivatives in various markets, which expose it to differing levels of counterparty risk. Counterparty risk on exchange-traded and centrally cleared derivative contracts, such as futures, exchange-traded options, and centrally cleared swaps, is minimal because the clearinghouse provides protection against counterparty defaults. For futures and centrally cleared swaps, the fund is required to deposit collateral in an amount specified by the clearinghouse and the clearing firm (margin requirement), and the margin requirement must be maintained over the life of the contract. Each clearinghouse and clearing firm, in its sole discretion, may adjust the margin requirements applicable to the fund.
Derivatives, such as bilateral swaps, forward currency exchange contracts, and OTC options, that are transacted and settle directly with a counterparty (bilateral derivatives) may expose the fund to greater counterparty risk. To mitigate this risk, the fund has entered into master netting arrangements (MNAs) with certain counterparties that permit net settlement under specified conditions and, for certain counterparties, also require the exchange of collateral to cover mark-to-market exposure. MNAs may be in the form of International Swaps and Derivatives Association master agreements (ISDAs) or foreign exchange letter agreements (FX letters).
MNAs provide the ability to offset amounts the fund owes a counterparty against amounts the counterparty owes the fund (net settlement). Both ISDAs and FX letters generally allow termination of transactions and net settlement upon the occurrence of contractually specified events, such as failure to pay or bankruptcy. In addition, ISDAs specify other events, the occurrence of which would allow one of the parties to terminate. For example, a downgrade in credit rating of a counterparty below a specified rating would allow the fund to terminate, while a decline in the fund’s net assets of more than a specified percentage would allow the counterparty to terminate. Upon termination, all transactions with that counterparty would be liquidated and a net termination amount settled. ISDAs include collateral agreements whereas FX letters do not. Collateral requirements are determined daily based on the net aggregate unrealized gain or loss on all bilateral derivatives with a counterparty, subject to minimum transfer amounts that typically range from $100,000 to $250,000. Any additional collateral required due to changes in security values is typically transferred the next business day.
Collateral may be in the form of cash or debt securities issued by the U.S. government or related agencies. Cash posted by the fund is reflected as cash deposits in the accompanying financial statements and generally is restricted from withdrawal by the fund; securities posted by the fund are so noted in the accompanying Portfolio of Investments; both remain in the fund’s assets. Collateral pledged by counterparties is not included in the fund’s assets because the fund does not obtain effective control over those assets. For bilateral derivatives, collateral posted or received by the fund is held in a segregated account at the fund’s custodian. While typically not sold in the same manner as equity or fixed income securities, exchange-traded or centrally cleared derivatives may be closed out only on the exchange or clearinghouse where the contracts were traded, and OTC and bilateral derivatives may be unwound with counterparties or transactions assigned to other counterparties to allow the fund to exit the transaction. This ability is subject to the liquidity of underlying positions. As of November 30, 2020, no collateral was pledged by either the fund or counterparties for bilateral derivatives. As of November 30, 2020, securities valued at $5,144,000 had been posted by the fund for exchange-traded and/or centrally cleared derivatives.
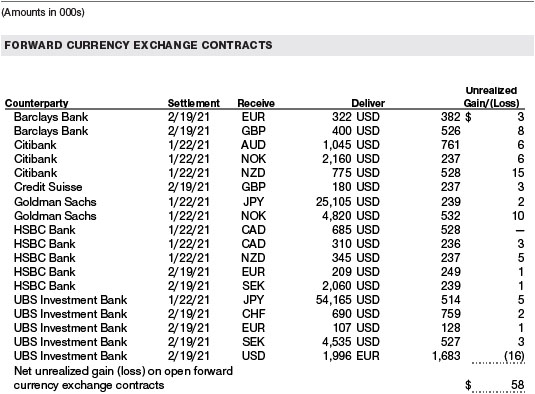
Forward Currency Exchange Contracts The fund is subject to foreign currency exchange rate risk in the normal course of pursuing its investment objectives. It uses forward currency exchange contracts (forwards) primarily to protect its non-U.S. dollar-denominated securities from adverse currency movements. A forward involves an obligation to purchase or sell a fixed amount of a specific currency on a future date at a price set at the time of the contract. Although certain forwards may be settled by exchanging only the net gain or loss on the contract, most forwards are settled with the exchange of the underlying currencies in accordance with the specified terms. Forwards are valued at the unrealized gain or loss on the contract, which reflects the net amount the fund either is entitled to receive or obligated to deliver, as measured by the difference between the forward exchange rates at the date of entry into the contract and the forward rates at the reporting date. Appreciated forwards are reflected as assets and depreciated forwards are reflected as liabilities on the accompanying Statement of Assets and Liabilities. Risks related to the use of forwards include the possible failure of counterparties to meet the terms of the agreements; that anticipated currency movements will not occur, thereby reducing the fund’s total return; and the potential for losses in excess of the fund’s initial investment. During the six months ended November 30, 2020, the volume of the fund’s activity in forwards, based on underlying notional amounts, was generally less than 1% of net assets.
Futures Contracts The fund is subject to interest rate risk and equity price risk in the normal course of pursuing its investment objectives and uses futures contracts to help manage such risks. The fund may enter into futures contracts to manage exposure to interest rates, security prices, foreign currencies, and credit quality; as an efficient means of adjusting exposure to all or part of a target market; to enhance income; as a cash management tool; or to adjust credit exposure. A futures contract provides for the future sale by one party and purchase by another of a specified amount of a specific underlying financial instrument at an agreed-upon price, date, time, and place. The fund currently invests only in exchange-traded futures, which generally are standardized as to maturity date, underlying financial instrument, and other contract terms. Payments are made or received by the fund each day to settle daily fluctuations in the value of the contract (variation margin), which reflect changes in the value of the underlying financial instrument. Variation margin is recorded as unrealized gain or loss until the contract is closed. The value of a futures contract included in net assets is the amount of unsettled variation margin; net variation margin receivable is reflected as an asset and net variation margin payable is reflected as a liability on the accompanying Statement of Assets and Liabilities. Risks related to the use of futures contracts include possible illiquidity of the futures markets, contract prices that can be highly volatile and imperfectly correlated to movements in hedged security values and/or interest rates, and potential losses in excess of the fund’s initial investment. During the six months ended November 30, 2020, the volume of the fund’s activity in futures, based on underlying notional amounts, was generally between 3% and 6% of net assets.
Options The fund is subject to equity price risk in the normal course of pursuing its investment objectives and uses options to help manage such risk. The fund may use options to manage exposure to security prices, interest rates, foreign currencies, and credit quality; as an efficient means of adjusting exposure to all or a part of a target market; to enhance income; as a cash management tool; or to adjust credit exposure. Options are included in net assets at fair value, options purchased are included in Investments in Securities, and Options written are separately reflected as a liability on the accompanying Statement of Assets and Liabilities. Premiums on unexercised, expired options are recorded as realized gains or losses; premiums on exercised options are recorded as an adjustment to the proceeds from the sale or cost of the purchase. The difference between the premium and the amount received or paid in a closing transaction is also treated as realized gain or loss. In return for a premium paid, call and put index options give the holder the right, but not the obligation, to receive cash equal to the difference between the value of the reference index on the exercise date and the exercise price of the option. Risks related to the use of options include possible illiquidity of the options markets; trading restrictions imposed by an exchange or counterparty; movements in the underlying asset values; and, for options written, potential losses in excess of the fund’s initial investment. During the six months ended November 30, 2020, the volume of the fund’s activity in options, based on underlying notional amounts, was generally between 2% and 4% of net assets.
Swaps The fund is subject to credit risk in the normal course of pursuing its investment objectives and uses swap contracts to help manage such risk. The fund may use swaps in an effort to manage both long and short exposure to changes in interest rates, inflation rates, and credit quality; to adjust overall exposure to certain markets; to enhance total return or protect the value of portfolio securities; to serve as a cash management tool; or to adjust credit exposure. Swap agreements can be settled either directly with the counterparty (bilateral swap) or through a central clearinghouse (centrally cleared swap). Fluctuations in the fair value of a contract are reflected in unrealized gain or loss and are reclassified to realized gain or loss upon contract termination or cash settlement. Net periodic receipts or payments required by a contract increase or decrease, respectively, the value of the contract until the contractual payment date, at which time such amounts are reclassified from unrealized to realized gain or loss. For bilateral swaps, cash payments are made or received by the fund on a periodic basis in accordance with contract terms; unrealized gain on contracts and premiums paid are reflected as assets and unrealized loss on contracts and premiums received are reflected as liabilities on the accompanying Statement of Assets and Liabilities. For bilateral swaps, premiums paid or received are amortized over the life of the swap and are recognized as realized gain or loss in the Statement of Operations. For centrally cleared swaps, payments are made or received by the fund each day to settle the daily fluctuation in the value of the contract (variation margin). Accordingly, the value of a centrally cleared swap included in net assets is the unsettled variation margin; net variation margin receivable is reflected as an asset and net variation margin payable is reflected as a liability on the accompanying Statement of Assets and Liabilities.
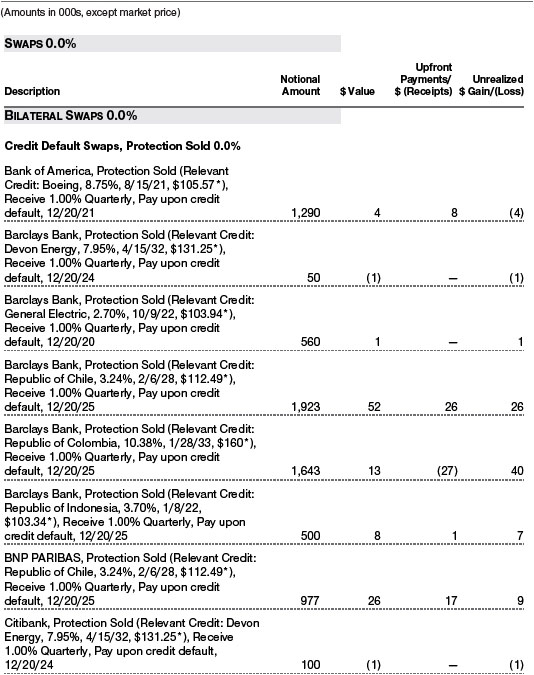
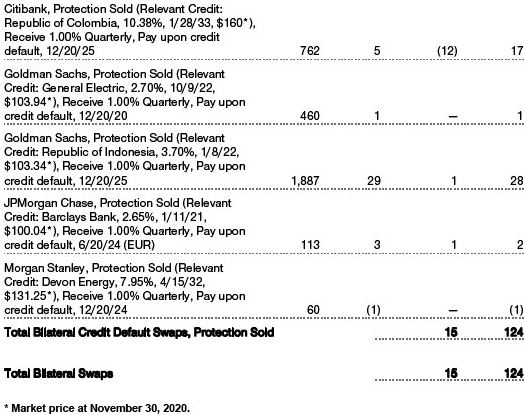
Credit default swaps are agreements where one party (the protection buyer) agrees to make periodic payments to another party (the protection seller) in exchange for protection against specified credit events, such as certain defaults and bankruptcies related to an underlying credit instrument, or issuer or index of such instruments. Upon occurrence of a specified credit event, the protection seller is required to pay the buyer the difference between the notional amount of the swap and the value of the underlying credit, either in the form of a net cash settlement or by paying the gross notional amount and accepting delivery of the relevant underlying credit. For credit default swaps where the underlying credit is an index, a specified credit event may affect all or individual underlying securities included in the index and will be settled based upon the relative weighting of the affected underlying security(ies) within the index. Generally, the payment risk for the seller of protection is inversely related to the current market price or credit rating of the underlying credit or the market value of the contract relative to the notional amount, which are indicators of the markets’ valuation of credit quality. As of November 30, 2020, the notional amount of protection sold by the fund totaled $46,301,000 (1.9% of net assets), which reflects the maximum potential amount the fund could be required to pay under such contracts. Risks related to the use of credit default swaps include the possible inability of the fund to accurately assess the current and future creditworthiness of underlying issuers, the possible failure of a counterparty to perform in accordance with the terms of the swap agreements, potential government regulation that could adversely affect the fund’s swap investments, and potential losses in excess of the fund’s initial investment.
During the six months ended November 30, 2020, the volume of the fund’s activity in swaps, based on underlying notional amounts, was generally between 1% and 3% of net assets.
NOTE 4 - OTHER INVESTMENT TRANSACTIONS
Consistent with its investment objective, the fund engages in the following practices to manage exposure to certain risks and/or to enhance performance. The investment objective, policies, program, and risk factors of the fund are described more fully in the fund’s prospectus and Statement of Additional Information.
Emerging and Frontier Markets The fund invests, either directly or through investments in other T. Rowe Price funds, in securities of companies located in, issued by governments of, or denominated in or linked to the currencies of emerging and frontier market countries. Emerging markets, and to a greater extent frontier markets, generally have economic structures that are less diverse and mature, and political systems that are less stable, than developed countries. These markets may be subject to greater political, economic, and social uncertainty and differing regulatory environments that may potentially impact the fund’s ability to buy or sell certain securities or repatriate proceeds to U.S. dollars. Such securities are often subject to greater price volatility, less liquidity, and higher rates of inflation than U.S. securities. Investing in frontier markets is significantly riskier than investing in other countries, including emerging markets.
Noninvestment-Grade Debt The fund invests, either directly or through its investment in other T. Rowe Price funds, in noninvestment-grade debt, including “high yield” or “junk” bonds or leveraged loans. Noninvestment-grade debt issuers are more likely to suffer an adverse change in financial condition that would result in the inability to meet a financial obligation. The noninvestment-grade debt market may experience sudden and sharp price swings due to a variety of factors that may decrease the ability of issuers to make principal and interest payments and adversely affect the liquidity or value, or both, of such securities. Accordingly, securities issued by such companies carry a higher risk of default and should be considered speculative.
Restricted Securities The fund invests in securities that are subject to legal or contractual restrictions on resale. Prompt sale of such securities at an acceptable price may be difficult and may involve substantial delays and additional costs.
Collateralized Loan Obligations The fund invests in collateralized loan obligations (CLOs) which are entities backed by a diversified pool of syndicated bank loans. The cash flows of the CLO can be split into multiple segments, called “tranches” or “classes”, which will vary in risk profile and yield. The riskiest segments, which are the subordinate or “equity” tranches, bear the greatest risk of loss from defaults in the underlying assets of the CLO and serve to protect the other, more senior, tranches. Senior tranches will typically have higher credit ratings and lower yields than the securities underlying the CLO. Despite the protection from the more junior tranches, senior tranches can experience substantial losses.
TBA Purchase, Sale Commitments and Forward Settling Mortgage Obligations The fund enters into to-be-announced (TBA) purchase or sale commitments (collectively, TBA transactions), pursuant to which it agrees to purchase or sell, respectively, mortgage-backed securities for a fixed unit price, with payment and delivery at a scheduled future date beyond the customary settlement period for such securities. With TBA transactions, the particular securities to be received or delivered by the fund are not identified at the trade date; however, the securities must meet specified terms, including rate and mortgage term, and be within industry-accepted “good delivery” standards. The fund may enter into TBA transactions with the intention of taking possession of or relinquishing the underlying securities, may elect to extend the settlement by “rolling” the transaction, and/or may use TBA transactions to gain or reduce interim exposure to underlying securities. Until settlement, the fund maintains liquid assets sufficient to settle its commitment to purchase a TBA or, in the case of a sale commitment, the fund maintains an entitlement to the security to be sold.
To mitigate counterparty risk, the fund has entered into Master Securities Forward Transaction Agreements (MSFTA) with counterparties that provide for collateral and the right to offset amounts due to or from those counterparties under specified conditions. Subject to minimum transfer amounts, collateral requirements are determined and transfers made based on the net aggregate unrealized gain or loss on all TBA commitments and other forward settling mortgage obligations with a particular counterparty (collectively, MSFTA Transactions). At any time, the fund’s risk of loss from a particular counterparty related to its MSFTA Transactions is the aggregate unrealized gain on appreciated MSFTA Transactions in excess of unrealized loss on depreciated MSFTA Transactions and collateral received, if any, from such counterparty. As of November 30, 2020, no collateral was pledged by the fund or counterparties for MSFTA Transactions.
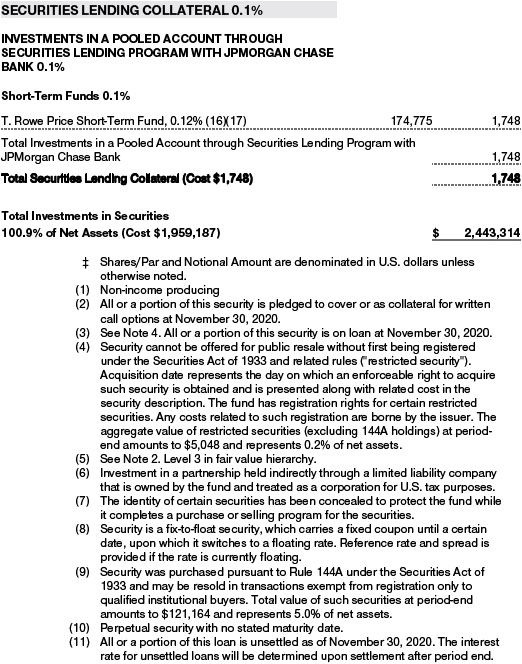
Securities Lending The fund may lend its securities to approved borrowers to earn additional income. Its securities lending activities are administered by a lending agent in accordance with a securities lending agreement. Security loans generally do not have stated maturity dates, and the fund may recall a security at any time. The fund receives collateral in the form of cash or U.S. government securities. Collateral is maintained over the life of the loan in an amount not less than the value of loaned securities; any additional collateral required due to changes in security values is delivered to the fund the next business day. Cash collateral is invested in accordance with investment guidelines approved by fund management. Additionally, the lending agent indemnifies the fund against losses resulting from borrower default. Although risk is mitigated by the collateral and indemnification, the fund could experience a delay in recovering its securities and a possible loss of income or value if the borrower fails to return the securities, collateral investments decline in value, and the lending agent fails to perform. Securities lending revenue consists of earnings on invested collateral and borrowing fees, net of any rebates to the borrower, compensation to the lending agent, and other administrative costs. In accordance with GAAP, investments made with cash collateral are reflected in the accompanying financial statements, but collateral received in the form of securities is not. At November 30, 2020, the value of loaned securities was $1,675,000; the value of cash collateral and related investments was $1,748,000.
Mortgage-Backed Securities The fund invests in mortgage-backed securities (MBS or pass-through certificates) that represent an interest in a pool of specific underlying mortgage loans and entitle the fund to the periodic payments of principal and interest from those mortgages. MBS may be issued by government agencies or corporations, or private issuers. Most MBS issued by government agencies are guaranteed; however, the degree of protection differs based on the issuer. The fund also invests in stripped MBS, created when a traditional MBS is split into an interest-only (IO) and a principal-only (PO) strip. MBS, including IOs and POs, are sensitive to changes in economic conditions that affect the rate of prepayments and defaults on the underlying mortgages; accordingly, the value, income, and related cash flows from MBS may be more volatile than other debt instruments. IOs also risk loss of invested principal from faster-than-anticipated prepayments.
Investment in Blackstone Partners Offshore Fund The fund invested in Blackstone Partners Offshore Fund Ltd. (Blackstone Partners), a multi-strategy hedge fund-of-funds offered by Blackstone Alternative Asset Management (BAAM), a unit of Blackstone Group L.P. (Blackstone). Blackstone Partners provides the fund exposure to alternative investments primarily through Blackstone Partners’ investments in underlying private investment funds, and the underlying funds are mostly managed by investment managers unaffiliated with BAAM or Blackstone. Blackstone Partners and the underlying funds may use leverage, engage in short-selling, and invest in commodities or other speculative investments, which may increase the risk of investment loss. Blackstone Partners and the underlying funds are not subject to the same regulatory requirements as open-end mutual funds, and, therefore, their investments and related valuations may not be as transparent. Ownership interests in Blackstone Partners are not transferable and are subject to various redemption restrictions, such as advance notice requirements, limited redemption dates, and possible suspension of redemption rights. In addition, Blackstone Partners’ ownership in the underlying funds may also be subject to transfer and redemption restrictions, such as advance notice requirements, limited redemption dates, and possible suspension of redemption rights. All of these restrictions are subject to change at the sole discretion of Blackstone Partners or an underlying fund’s management. As of November 30, 2020, the fund’s investment in Blackstone Partners is subject to semi-annual redemption with 95 days prior written notice and is considered an illiquid asset.
LIBOR The fund may invest in instruments that are tied to reference rates, including LIBOR. On July 27, 2017, the United Kingdom’s Financial Conduct Authority announced a decision to transition away from LIBOR by the end of 2021. There remains uncertainty regarding the future utilization of LIBOR and the nature of any replacement rate. Any potential effects of the transition away from LIBOR on the fund, or on certain instruments in which the fund invests, are not known. The transition process may result in, among other things, an increase in volatility or illiquidity of markets for instruments that currently rely on LIBOR, a reduction in the value of certain instruments held by a fund, or a reduction in the effectiveness of related fund transactions such as hedges. Any such effects could have an adverse impact on the fund’s performance.
Other Purchases and sales of portfolio securities other than short-term and U.S. government securities aggregated $321,622,000 and $436,438,000, respectively, for the six months ended November 30, 2020. Purchases and sales of U.S. government securities aggregated $180,060,000 and $164,878,000, respectively, for the six months ended November 30, 2020.
NOTE 5 - FEDERAL INCOME TAXES
No provision for federal income taxes is required since the fund intends to continue to qualify as a regulated investment company under Subchapter M of the Internal Revenue Code and distribute to shareholders all of its taxable income and gains. Distributions determined in accordance with federal income tax regulations may differ in amount or character from net investment income and realized gains for financial reporting purposes. Financial reporting records are adjusted for permanent book/tax differences to reflect tax character but are not adjusted for temporary differences. The amount and character of tax-basis distributions and composition of net assets are finalized at fiscal year-end; accordingly, tax-basis balances have not been determined as of the date of this report.
At November 30, 2020, the cost of investments for federal income tax purposes was $1,977,176,000. Net unrealized gain aggregated $461,037,000 at period-end, of which $497,147,000 related to appreciated investments and $36,110,000 related to depreciated investments.
NOTE 6 - RELATED PARTY TRANSACTIONS
The fund is managed by T. Rowe Price Associates, Inc. (Price Associates), a wholly owned subsidiary of T. Rowe Price Group, Inc. (Price Group). The investment management agreement between the fund and Price Associates provides for an annual investment management fee, which is computed daily and paid monthly. The fee consists of an individual fund fee, equal to 0.15% of the fund’s average daily net assets, and a group fee. The group fee rate is calculated based on the combined net assets of certain mutual funds sponsored by Price Associates (the group) applied to a graduated fee schedule, with rates ranging from 0.48% for the first $1 billion of assets to 0.260% for assets in excess of $845 billion. The fund’s group fee is determined by applying the group fee rate to the fund’s average daily net assets. The fee is computed daily and paid monthly. At November 30, 2020, the effective annual group fee rate was 0.28%.
The I Class is subject to an operating expense limitation (I Class Limit) pursuant to which Price Associates is contractually required to pay all operating expenses of the I Class, excluding management fees; interest; expenses related to borrowings, taxes, and brokerage; and other non-recurring expenses permitted by the investment management agreement, to the extent such operating expenses, on an annualized basis, exceed the I Class Limit. This agreement will continue through the expense limitation date indicated in the table below, and may be renewed, revised, or revoked only with approval of the fund’s Board. The I Class is required to repay Price Associates for expenses previously paid to the extent the class’s net assets grow or expenses decline sufficiently to allow repayment without causing the class’s operating expenses (after the repayment is taken into account) to exceed the lesser of: (1) the I Class Limit in place at the time such amounts were paid; or (2) the current I Class Limit. However, no repayment will be made more than three years after the date of a payment or waiver.

In addition, the fund has entered into service agreements with Price Associates and two wholly owned subsidiaries of Price Associates, each an affiliate of the fund (collectively, Price). Price Associates provides certain accounting and administrative services to the fund. T. Rowe Price Services, Inc. provides shareholder and administrative services in its capacity as the fund’s transfer and dividend-disbursing agent. T. Rowe Price Retirement Plan Services, Inc. provides subaccounting and recordkeeping services for certain retirement accounts invested in the Investor Class. For the six months ended November 30, 2020, expenses incurred pursuant to these service agreements were $34,000 for Price Associates; $288,000 for T. Rowe Price Services, Inc.; and $67,000 for T. Rowe Price Retirement Plan Services, Inc. All amounts due to and due from Price, exclusive of investment management fees payable, are presented net on the accompanying Statement of Assets and Liabilities.
The fund may invest its cash reserves in certain open-end management investment companies managed by Price Associates and considered affiliates of the fund: the T. Rowe Price Government Reserve Fund or the T. Rowe Price Treasury Reserve Fund, organized as money market funds, or the T. Rowe Price Short-Term Fund, a short-term bond fund (collectively, the Price Reserve Funds). The Price Reserve Funds are offered as short-term investment options to mutual funds, trusts, and other accounts managed by Price Associates or its affiliates and are not available for direct purchase by members of the public. Cash collateral from securities lending is invested in the T. Rowe Price Short-Term Fund. The Price Reserve Funds pay no investment management fees.
The fund may also invest in certain other T. Rowe Price funds (Price Funds) as a means of gaining efficient and cost-effective exposure to certain markets. The fund does not invest for the purpose of exercising management or control; however, investments by the fund may represent a significant portion of an underlying Price Fund’s net assets. Each underlying Price Fund is an open-end management investment company managed by Price Associates and is considered an affiliate of the fund. To ensure that the fund does not incur duplicate management fees (paid by the underlying Price Fund(s) and the fund) Price Associates has agreed to permanently waive a portion of its management fee charged to the fund in an amount sufficient to fully offset that portion of management fees paid by each underlying Price Fund related to the fund’s investment therein. Annual management fee rates and amounts waived related to investments in the underlying Price Fund(s) for the six months ended November 30, 2020, are as follows:
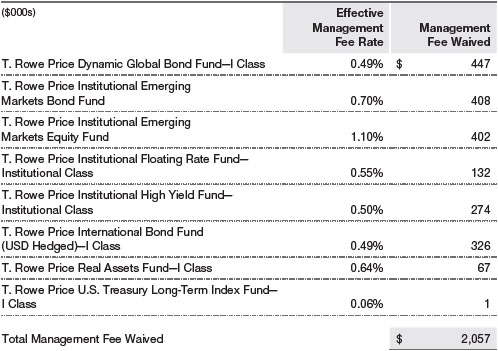
Total management fee waived was allocated ratably in the amounts of $1,719,000 and $338,000 for the Investor Class and I Class, respectively, for the six months ended November 30, 2020.
The fund may participate in securities purchase and sale transactions with other funds or accounts advised by Price Associates (cross trades), in accordance with procedures adopted by the fund’s Board and Securities and Exchange Commission rules, which require, among other things, that such purchase and sale cross trades be effected at the independent current market price of the security. During the six months ended November 30, 2020, the fund had no purchases or sales cross trades with other funds or accounts advised by Price Associates.
Effective January 1, 2020, Price Associates has voluntarily agreed to reimburse the fund from its own resources on a monthly basis for the cost of investment research embedded in the cost of the fund’s securities trades. This agreement may be rescinded at any time. For the six months ended November 30, 2020, this reimbursement amounted to $16,000, which is included in Net realized gain (loss) on Securities in the Statement of Operations.
NOTE 7 - OTHER MATTERS
Unpredictable events such as environmental or natural disasters, war, terrorism, pandemics, outbreaks of infectious diseases, and similar public health threats may significantly affect the economy and the markets and issuers in which a fund invests. Certain events may cause instability across global markets, including reduced liquidity and disruptions in trading markets, while some events may affect certain geographic regions, countries, sectors, and industries more significantly than others, and exacerbate other pre-existing political, social, and economic risks.
These types of events may also cause widespread fear and uncertainty, and result in, among other things: quarantines and travel restrictions, including border closings; disruptions to business operations and supply chains; exchange trading suspensions and closures, and overall reduced liquidity of securities, derivatives, and commodities trading markets; reductions in consumer demand and economic output; and significant challenges in healthcare service preparation and delivery. The funds could be negatively impacted if the value of a portfolio holding were harmed by such political or economic conditions or events. In addition, the operations of the funds, their investment advisers, and the funds’ service providers may be significantly impacted, or even temporarily halted, as a result of extensive employee illnesses or unavailability, government quarantine measures, and restrictions on travel or meetings and other factors related to public emergencies. Recently, a novel strain of coronavirus (COVID-19) has resulted in disruptions to global business activity and caused significant volatility and declines in global financial markets.
Governmental and quasi-governmental authorities and regulators have in the past responded to major economic disruptions with a variety of significant fiscal and monetary policy changes, including but not limited to, direct capital infusions into companies, new monetary programs, and dramatically lower interest rates. An unexpected or quick reversal of these policies, or the ineffectiveness of these policies, could negatively impact overall investor sentiment and further increase volatility in securities markets.
INFORMATION ON PROXY VOTING POLICIES, PROCEDURES, AND RECORDS
A description of the policies and procedures used by T. Rowe Price funds and portfolios to determine how to vote proxies relating to portfolio securities is available in each fund’s Statement of Additional Information. You may request this document by calling 1-800-225-5132 or by accessing the SEC’s website, sec.gov.
The description of our proxy voting policies and procedures is also available on our corporate website. To access it, please visit the following Web page:
https://www.troweprice.com/corporate/en/utility/policies.html
Scroll down to the section near the bottom of the page that says, “Proxy Voting Policies.” Click on the Proxy Voting Policies link in the shaded box.
Each fund’s most recent annual proxy voting record is available on our website and through the SEC’s website. To access it through T. Rowe Price, visit the website location shown above, and scroll down to the section near the bottom of the page that says, “Proxy Voting Records.” Click on the Proxy Voting Records link in the shaded box.
HOW TO OBTAIN QUARTERLY PORTFOLIO HOLDINGS
Effective for reporting periods on or after March 1, 2019, a fund, except a money market fund, files a complete schedule of portfolio holdings with the Securities and Exchange Commission (SEC) for the first and third quarters of each fiscal year as an exhibit to its reports on Form N-PORT. Prior to March 1, 2019, a fund, including a money market fund, filed a complete schedule of portfolio holdings with the SEC for the first and third quarters of each fiscal year on Form N-Q. A money market fund files detailed month-end portfolio holdings information on Form N-MFP with the SEC each month and posts a complete schedule of portfolio holdings on its website (troweprice.com) as of each month-end for the previous six months. A fund’s Forms N-PORT, N-MFP, and N-Q are available electronically on the SEC’s website (sec.gov).
Item 1. (b) Notice pursuant to Rule 30e-3.
Not applicable.
Item 2. Code of Ethics.
A code of ethics, as defined in Item 2 of Form N-CSR, applicable to its principal executive officer, principal financial officer, principal accounting officer or controller, or persons performing similar functions is filed as an exhibit to the registrant’s annual Form N-CSR. No substantive amendments were approved or waivers were granted to this code of ethics during the registrant’s most recent fiscal half-year.
Item 3. Audit Committee Financial Expert.
Disclosure required in registrant’s annual Form N-CSR.
Item 4. Principal Accountant Fees and Services.
Disclosure required in registrant’s annual Form N-CSR.
Item 5. Audit Committee of Listed Registrants.
Not applicable.
Item 6. Investments.
(a) Not applicable. The complete schedule of investments is included in Item 1 of this Form N-CSR.
(b) Not applicable.
Item 7. Disclosure of Proxy Voting Policies and Procedures for Closed-End Management Investment Companies.
Not applicable.
Item 8. Portfolio Managers of Closed-End Management Investment Companies.
Not applicable.
Item 9. Purchases of Equity Securities by Closed-End Management Investment Company and Affiliated Purchasers.
Not applicable.
Item 10. Submission of Matters to a Vote of Security Holders.
There has been no change to the procedures by which shareholders may recommend nominees to the registrant’s board of directors.
Item 11. Controls and Procedures.
(a) The registrant’s principal executive officer and principal financial officer have evaluated the registrant’s disclosure controls and procedures within 90 days of this filing and have concluded that the registrant’s disclosure controls and procedures were effective, as of that date, in ensuring that information required to be disclosed by the registrant in this Form N-CSR was recorded, processed, summarized, and reported timely.
(b) The registrant’s principal executive officer and principal financial officer are aware of no change in the registrant’s internal control over financial reporting that occurred during the period covered by this report that has materially affected, or is reasonably likely to materially affect, the registrant’s internal control over financial reporting.
Item 12. Disclosure of Securities Lending Activities for Closed-End Management Investment Companies.
Not applicable.
Item 13. Exhibits.
(a)(1) The registrant’s code of ethics pursuant to Item 2 of Form N-CSR is filed with the registrant’s annual Form N-CSR.
(2) Separate certifications by the registrant's principal executive officer and principal financial officer, pursuant to Section 302 of the Sarbanes-Oxley Act of 2002 and required by Rule 30a-2(a) under the Investment Company Act of 1940, are attached.
(3) Written solicitation to repurchase securities issued by closed-end companies: not applicable.
(b) A certification by the registrant's principal executive officer and principal financial officer, pursuant to Section 906 of the Sarbanes-Oxley Act of 2002 and required by Rule 30a-2(b) under the Investment Company Act of 1940, is attached.
SIGNATURES
Pursuant to the requirements of the Securities Exchange Act of 1934 and the Investment Company Act of 1940, the registrant has duly caused this report to be signed on its behalf by the undersigned, thereunto duly authorized.
T. Rowe Price Spectrum Funds II, Inc.
| By | | /s/ David Oestreicher |
| | | David Oestreicher |
| | | Principal Executive Officer |
| |
| Date | | January 19, 2021 | | | | |
Pursuant to the requirements of the Securities Exchange Act of 1934 and the Investment Company Act of 1940, this report has been signed below by the following persons on behalf of the registrant and in the capacities and on the dates indicated.
| By | | /s/ David Oestreicher |
| | | David Oestreicher |
| | | Principal Executive Officer |
| |
| Date | | January 19, 2021 | | | | |
| |
| |
| By | | /s/ Alan S. Dupski |
| | | Alan S. Dupski |
| | | Principal Financial Officer |
| |
| Date | | January 19, 2021 | | | | |