HOME PROPERTIES, INC.
Home Properties Reports Second Quarter 2012 Results
FFO Per Share Exceeds Wall Street's Mean Estimate by 1 Cent
ROCHESTER, N.Y., August 2, 2012 – Home Properties, Inc. (NYSE: HME) today released financial results for the second quarter ended June 30, 2012. All results are reported on a diluted basis.
“Home Properties continued to post excellent results in the second quarter of 2012, with same-store net operating income growth of 8.0% compared to the same quarter last year, which is the largest year-over-year second quarter increase in the last six years,” said Edward J. Pettinella, Home Properties President and CEO. “Home Properties, like the entire multifamily sector, is currently enjoying the positive fundamentals in our business. Based on performance in the first half of 2012 and the favorable operating environment, we have increased our expectations for Funds From Operations results for the balance of the year.”
Earnings per share ("EPS") for the quarter ended June 30, 2012 was $0.28, compared to $0.20 for the quarter ended June 30, 2011. The $0.08 increase in EPS is primarily attributable to a $6.2 million increase in income from operations from both the properties owned throughout 2011 and 2012 (the “Core” properties) and those acquired, developed, or redeveloped subsequent to January 1, 2011 (the “Non-Core” properties).
For the quarter ended June 30, 2012, Funds From Operations ("FFO") was $57.6 million, or $0.96 per share, compared to $44.6 million, or $0.87 per share, for the quarter ended June 30, 2011, which equates to a 10.2% increase on a per-share basis. Second quarter 2012 FFO of $0.96 per share was $0.01 above the midpoint of the guidance range provided by management and the analysts' mean estimate, as reported by Thomson. Operating FFO (“OFFO”), which excludes acquisition costs of $0.045 per share, was a record high in the second quarter 2012 of $1.00 per share, four cents above the midpoint of the OFFO guidance range provided by management. A reconciliation of GAAP net income to FFO and OFFO is included in the financial data accompanying this news release.
Second Quarter Operating Results
For the second quarter of 2012, same-property comparisons (for 113 Core properties containing 37,811 apartment units owned since January 1, 2011) reflected an increase in rental income of 5.0% and a 4.8% increase in total revenues compared to the same quarter a year ago. Net operating income (“NOI”) increased by 8.0% from the second quarter of 2011. Property level operating expenses decreased by 0.3% compared to the prior year quarter, primarily due to decreases in electricity and natural gas heating costs, which were partially offset by increases in property insurance and real estate taxes.
Home Properties Reports Second Quarter 2012 Results
For Immediate Release: August 2, 2012
Page 2 of 8
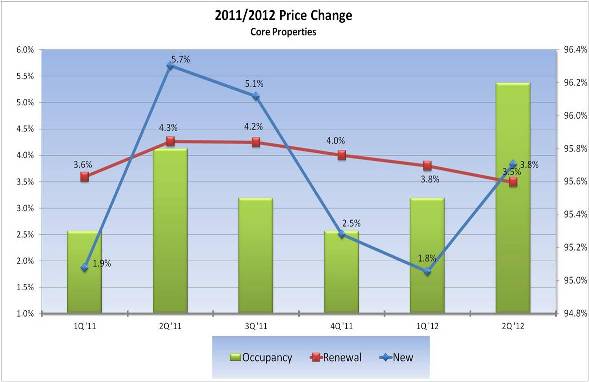
Average physical occupancy for the Core properties was 96.2% during the second quarter of 2012, up from 95.8% during the second quarter of 2011. Average monthly rental rates of $1,218 represent a 4.5% increase compared to the year-ago period.
On a sequential basis, compared to the 2012 first quarter results for Core properties, rental income (excluding utility recovery) increased 1.8% in the second quarter of 2012, total revenues decreased 0.4%, expenses decreased 6.1% and NOI increased 3.1%. Average physical occupancy increased 0.7% to 96.2%. The total revenue decrease in the second quarter compared to the first quarter was due to the typical seasonality from lower heating cost reimbursements. The expense decrease between the first and second quarters represented seasonality from lower natural gas heating costs.
Physical occupancy for the 6,107 apartment units acquired/developed/redeveloped between January 1, 2011 and June 30, 2012 averaged 92.2% during the second quarter of 2012, at average monthly rents of $1,435.
Year-to-Date Operating Results
For the six months ended June 30, 2012, same-property comparisons for the Core properties reflected an increase in total revenues of 4.7% and a decrease in total expense of 1.6% resulting in an 8.9% increase in NOI compared to the first six months of 2011. Property level operating expenses decreased, primarily due to lower natural gas heating costs and snow removal costs. These decreases were partially offset by increases in property insurance and real estate taxes.
Average physical occupancy for the Core properties was 95.8% during the first six months of 2012, up from 95.6% a year ago, with average monthly rental rates of $1,213, an increase of 4.6% over the prior year period.
Acquisitions/Dispositions
As previously reported, during the second quarter of 2012, the Company acquired two apartment communities with a total of 668 units in the Washington, D.C. region and one community with 1,350 units in the Baltimore, Maryland region, for a combined purchase price of $298.2 million. In connection with these acquisitions, closing costs of approximately $2.7 million were incurred and are included in other expenses in the second quarter of 2012.
There were no dispositions of apartment communities in the second quarter of 2012. The Company previously announced it is marketing for sale 10 properties, with a total of 2,478 units in several regions, which are in various stages of the selling process. While closings are expected in the third and fourth quarters, every property listed for sale ultimately may not be sold.
Development
With construction finished on all the apartment units, the Company is nearing completion of The Apartments at Cobblestone Square, located in Fredericksburg, Virginia. Currently, 88% of the 314 units are leased.
The Company started construction in the fourth quarter of 2011 on Eleven55 Ripley, which will consist of 379 units located in downtown Silver Spring, Maryland. Initial occupancy is projected to occur in the third quarter of 2013, with completion of the entire project anticipated in 2014.
Home Properties Reports Second Quarter 2012 Results
For Immediate Release: August 2, 2012
Page 3 of 8
The Company started construction in the second quarter of 2012 on The Courts at Spring Mill Station in Conshohocken, Pennsylvania, a 385-apartment development. Initial occupancy is projected in the fourth quarter of 2013, and the entire project is expected to be completed in 2014.
Capital Markets Activities
As of June 30, 2012, the Company’s ratio of debt-to-total market capitalization was 44.2% (based on a June 30, 2012 stock price of $61.36 used to determine equity value), with $175 million outstanding on its $275 million revolving credit facility and $10.5 million of unrestricted cash on hand. Total debt of $2.9 billion was outstanding, at interest rates averaging 4.4% and with staggered maturities averaging five years. Approximately 75% of total indebtedness is at fixed rates. Interest coverage for the quarter was 2.9 times and the fixed charge ratio was 2.8 times.
As previously reported, a portion of the Howard Crossing acquisition was funded using the proceeds from the issuance of $50 million of unsecured senior guaranteed notes, which are due June 27, 2019 and bear interest at 4.16%. The balance of the purchase was funded through the line of credit and a $100 million unsecured bank demand loan, with the same terms and interest rate as the line of credit, which on June 30, 2012 was 1.55%.
On July 19, 2012, the Company entered into two interest rate swap agreements that effectively convert a $250 million unsecured term loan with a variable interest rate equal to the one-month LIBOR plus 1.3%, due on December 9, 2016, to a fixed rate of 1.99%. This will increase the amount of fixed rate indebtedness from 75% to 84%.
On September 17, 2010, the Company initiated an At-The-Market (ATM) equity offering program, with authorization to sell up to 3.6 million common shares. At the end of the first quarter 2012, the Company had 207,500 shares remaining. As previously reported, on May 14, 2012, the Company filed with the Securities and Exchange Commission to initiate a new ATM equity offering program through which it may sell up to 4.4 million common shares. During the second quarter, 928,299 shares were sold (including 22,200 shares with a settlement date in early July) at an average price of $61.52 generating gross proceeds of $57.1 million and net proceeds of $55.9 million. There are approximately 3.7 million common shares remaining under this program.
Outlook
Based on higher second quarter results than expected and higher results anticipated for the balance of the year, the Company has increased the midpoint of its prior FFO guidance by seven cents to $4.00 and the range of FFO per share to $3.96 to $4.04 from $3.87 to $3.99. This guidance range reflects management’s current assessment of economic and market conditions. Likewise, Operating FFO has been increased by nine cents to $4.05 at the midpoint with a range of $4.01 to $4.09. The difference between FFO and OFFO is solely due to expensed acquisition costs. Because projected acquisition costs are minimal, the quarterly breakdown for the balance of 2012 guidance on FFO and OFFO per share results is identical: third quarter $1.03 to $1.07; fourth quarter $1.00 to $1.04.
Dividend Declared
The Company announced a regular cash dividend on the Company’s common shares of $0.66 per share for the quarter ended June 30, 2012. The dividend is payable on August 24, 2012 to shareholders of record on August 14, 2012 and is equivalent to an annualized rate of $2.64 per
Home Properties Reports Second Quarter 2012 Results
For Immediate Release: August 2, 2012
Page 4 of 8
share. The current annual dividend represents a 4.0% yield based on the July 31, 2012 closing price of $65.61. Home Properties’ common stock will begin trading ex-dividend on August 10, 2012.
Supplemental Information
The Company produces supplemental information that includes details regarding property operations, other income, acquisitions, sales, geographic market breakdown, debt and new development. The supplemental information is available via the Company's website through the "Investors" section or e-mail upon request.
Second Quarter 2012 Earnings Conference Call
The Company will conduct a conference call and simultaneous webcast tomorrow at 11:00 AM ET to review and comment on the information reported in this release. The webcast, which includes audio and a slide presentation, will be available, live at 11:00 AM and archived by 1:00 PM, through the "Investors" section home page of the website www.homeproperties.com. For live audio-only participation, please dial 800-913-1647 (International 212-231-2900).
Third Quarter 2012 Earnings Release and Conference Call
The Company’s third quarter 2012 financial results are scheduled to be released after the stock market closes on Thursday, November 1, 2012. A conference call, which will be simultaneously webcast, is scheduled for Friday, November 2, 2012 at 11:00 AM ET and will be accessible following the instructions for the current quarter's conference call.
Third Quarter 2012 Conference/Event Schedule
Home Properties is scheduled to participate in the BMO Capital Markets 7th Annual North American Real Estate Conference in Chicago on September 5-6, the Bank of America Merrill Lynch 2012 Global Real Estate Conference in New York City on September 12, and the Zelman & Associates 2012 Housing Summit in McLean, Virginia on September 27-28. Any audio presentation and related materials will be available in the “Investors” section of www.homeproperties.com.
This release contains forward-looking statements. Although the Company believes expectations reflected in such forward-looking statements are based on reasonable assumptions, it can give no assurance that its expectations will be achieved. Factors that may cause actual results to differ include general economic and local real estate conditions, weather and other conditions that might affect operating expenses, the timely completion of repositioning and new development activities within anticipated budgets, the actual pace of future acquisitions and dispositions, and continued access to capital to fund growth.
Home Properties is a publicly traded multifamily real estate investment trust (REIT) that owns, operates, develops, acquires and rehabilitates apartment communities primarily in selected Northeast and Mid-Atlantic markets. An S&P 400 Company, Home Properties owns and operates 127 communities containing 44,232 apartment units. For more information, visit Home Properties’ website at www.homeproperties.com.
Home Properties Reports Second Quarter 2012 Results
For Immediate Release: August 2, 2012
Page 5 of 8
HOME PROPERTIES, INC.
SUMMARY OF OCCUPANCY AND PROPERTY OPERATING RESULTS
| | | Avg. Physical | | | | | | | |
| Second Quarter Results: | | Occupancy(a) | | | | 2Q 2012 | | | 2Q 2012 vs. 2Q 2011 % Growth | |
| | | | | | | | | Average | | | | | | | | | | | | | |
| | | | | | | | | Monthly | | | Base | | | | | | | | | | |
| | | | | | | | | Rent/ | | | Rental | | | Total | | | Total | | | | |
| | | | 2Q 2012 | | | | 2Q 2011 | | | Occ Unit | | | Rates | | | Revenue | | | Expense | | | NOI | |
Core Properties(b) | | | 96.2 | % | | | 95.8 | % | | $ | 1,218 | | | | 4.5 | % | | | 4.8 | % | | | (0.3 | %) | | | 8.0 | % |
Non-Core Properties(c) | | | 92.2 | % | | NA | | | $ | 1,435 | | | NA | | | NA | | | NA | | | NA | |
| TOTAL PORTFOLIO | | | 95.7 | % | | NA | | | $ | 1,241 | | | NA | | | NA | | | NA | | | NA | |
| | | | | | | | | | | | | | | | | | | | | | | | |
| | | Avg. Physical | | | | | | | | | | | | | | | | | | | | | |
| Year-To-Date Results: | | Occupancy(a) | | | YTD 2012 | | | YTD 2012 vs. YTD 2011 % Growth | |
| | | | | | | | | | | Average | | | | | | | | | | | | | | | | | |
| | | | | | | | | | | Monthly | | | Base | | | | | | | | | | | | | |
| | | YTD | | | YTD | | | Rent / | | | Rental | | | Total | | | Total | | | | | |
| | | | 2012 | | | | 2011 | | | Occ Unit | | | Rates | | | Revenue | | | Expense | | | NOI | |
Core Properties(b) | | | 95.8 | % | | | 95.6 | % | | $ | 1,213 | | | | 4.6 | % | | | 4.7 | % | | | (1.6 | %) | | | 8.9 | % |
Non-Core Properties(c) | | | 90.3 | % | | NA | | | $ | 1,442 | | | NA | | | NA | | | NA | | | NA | |
| TOTAL PORTFOLIO | | | 95.2 | % | | NA | | | $ | 1,236 | | | NA | | | NA | | | NA | | | NA | |
| (a) | Average physical occupancy is defined as total possible rental income, net of vacancy expense, as a percentage of total possible rental income. Total possible rental income is determined by valuing occupied units at contract rates and vacant units at market rents. |
| (b) | Core Properties consist of 113 properties with 37,811 apartment units owned throughout 2011 and 2012. |
| (c) | Non-Core Properties consist of 13 properties with 6,107 apartment units acquired, developed, or redeveloped subsequent to January 1, 2011, such that full year comparable operating results are not available. Non-Core Properties excludes properties still under development where construction is not 100% complete. |
Home Properties Reports Second Quarter 2012 Results
For Immediate Release: August 2, 2012
Page 6 of 8
HOME PROPERTIES, INC.
SUMMARY CONSOLIDATED STATEMENTS OF OPERATIONS
(in thousands, except per share data – Unaudited)
| | | Three Months Ended | | | Six Months Ended | |
| | | June 30 | | | June 30 | |
| | | 2012 | | | 2011 | | | 2012 | | | 2011 | |
| Rental income | | $ | 150,026 | | | $ | 129,764 | | | $ | 295,220 | | | $ | 257,185 | |
| Property other income | | | 12,313 | | | | 10,906 | | | | 27,427 | | | | 24,830 | |
| Other income | | | 21 | | | | 17 | | | | 31 | | | | 70 | |
Total revenues | | | 162,360 | | | | 140,687 | | | | 322,678 | | | | 282,085 | |
| Operating and maintenance | | | 58,727 | | | | 53,721 | | | | 119,999 | | | | 112,000 | |
| General and administrative | | | 11,037 | | | | 8,826 | | | | 19,350 | | | | 15,062 | |
| Interest | | | 31,528 | | | | 32,800 | | | | 63,054 | | | | 65,831 | |
| Depreciation and amortization | | | 41,671 | | | | 34,735 | | | | 82,075 | | | | 69,214 | |
| Other expenses | | | 2,693 | | | | 99 | | | | 2,710 | | | | 109 | |
Total expenses | | | 145,656 | | | | 130,181 | | | | 287,188 | | | | 262,216 | |
| Net income | | | 16,704 | | | | 10,506 | | | | 35,490 | | | | 19,869 | |
| Net income attributable to noncontrolling interest | | | (2,977 | ) | | | (2,311 | ) | | | (6,375 | ) | | | (4,450 | ) |
| Net income attributable to common stockholders | | $ | 13,727 | | | $ | 8,195 | | | $ | 29,115 | | | $ | 15,419 | |
Reconciliation from net income attributable to common stockholders to Funds From Operations: | | | | | | | | | | | | | | | | |
| Net income available to common stockholders | | $ | 13,727 | | | $ | 8,195 | | | $ | 29,115 | | | $ | 15,419 | |
| Real property depreciation and amortization | | | 40,920 | | | | 34,053 | | | | 80,579 | | | | 67,867 | |
| Noncontrolling interest | | | 2,977 | | | | 2,311 | | | | 6,375 | | | | 4,450 | |
FFO - basic and diluted (1) | | $ | 57,624 | | | $ | 44,559 | | | $ | 116,069 | | | $ | 87,736 | |
| (1) | Pursuant to the updated guidance for Funds From Operations provided by the Board of Governors of the National Association of Real Estate Investment Trusts ("NAREIT"), FFO is defined as net income (computed in accordance with accounting principles generally accepted in the United States of America ("GAAP")) excluding gains or losses from disposition of property, impairment write-downs of depreciable real estate, noncontrolling interest and extraordinary items plus depreciation from real property. The Company believes all adjustments not specifically provided for are consistent with the definition. Other similarly titled measures may not be calculated in the same manner. |
Home Properties Reports Second Quarter 2012 Results
For Immediate Release: August 2, 2012
Page 7 of 8
HOME PROPERTIES, INC.
SUMMARY CONSOLIDATED STATEMENTS OF OPERATIONS
(in thousands, except per share data – Unaudited)
| | | Three Months Ended | | | Six Months Ended | |
| | | June 30 | | | June 30 | |
| | | 2012 | | | 2011 | | | 2012 | | | 2011 | |
| FFO – basic and diluted | | $ | 57,624 | | | $ | 44,559 | | | $ | 116,069 | | | $ | 87,736 | |
| FFO – basic and diluted | | $ | 57,624 | | | $ | 44,559 | | | $ | 116,069 | | | $ | 87,736 | |
| Acquisition costs of closed deals included in other expenses | | | 2,693 | | | | 99 | | | | 2,710 | | | | 109 | |
Operating FFO (2) | | $ | 60,317 | | | $ | 44,658 | | | $ | 118,779 | | | $ | 87,845 | |
| FFO – basic and diluted | | $ | 57,624 | | | $ | 44,559 | | | $ | 116,069 | | | $ | 87,736 | |
| Recurring non-revenue generating capital expenses | | | (9,013 | ) | | | (7,803 | ) | | | (17,912 | ) | | | (15,576 | ) |
| Addback of non-cash interest expense | | | - | | | | 548 | | | | - | | | | 1,086 | |
AFFO (3) | | $ | 48,611 | | | $ | 37,304 | | | $ | 98,157 | | | $ | 73,246 | |
| Operating FFO | | $ | 60,317 | | | $ | 44,658 | | | $ | 118,779 | | | $ | 87,845 | |
| Recurring non-revenue generating capital expenses | | | (9,013 | ) | | | (7,803 | ) | | | (17,912 | ) | | | (15,576 | ) |
| Addback of non-cash interest expense | | | - | | | | 548 | | | | - | | | | 1,086 | |
Operating AFFO (2) (3) | | $ | 51,304 | | | $ | 37,403 | | | $ | 100,867 | | | $ | 73,355 | |
| Weighted average shares/units outstanding: | | | | | | | | | | | | | | | | |
Shares – basic | | | 49,026.4 | | | | 39,479.2 | | | | 48,694.4 | | | | 38,742.9 | |
Shares – diluted | | | 49,678.7 | | | | 40,230.4 | | | | 49,327.9 | | | | 39,407.5 | |
Shares/units – basic (4) | | | 59,676.5 | | | | 50,635.5 | | | | 59,371.0 | | | | 49,964.9 | |
Shares/units – diluted (4) | | | 60,328.8 | | | | 51,386.7 | | | | 60,004.4 | | | | 50,629.5 | |
| Per share/unit: | | | | | | | | | | | | | | | | |
Net income – basic | | $ | 0.28 | | | $ | 0.21 | | | $ | 0.60 | | | $ | 0.40 | |
Net income – diluted | | $ | 0.28 | | | $ | 0.20 | | | $ | 0.59 | | | $ | 0.39 | |
| FFO – basic | | $ | 0.97 | | | $ | 0.88 | | | $ | 1.95 | | | $ | 1.76 | |
FFO – diluted | | $ | 0.96 | | | $ | 0.87 | | | $ | 1.93 | | | $ | 1.73 | |
Operating FFO (2) | | $ | 1.00 | | | $ | 0.87 | | | $ | 1.98 | | | $ | 1.74 | |
AFFO (3) | | $ | 0.81 | | | $ | 0.73 | | | $ | 1.64 | | | $ | 1.45 | |
Operating AFFO (2) (3) | | $ | 0.85 | | | $ | 0.73 | | | $ | 1.68 | | | $ | 1.45 | |
Common Dividend paid | | $ | 0.66 | | | $ | 0.62 | | | $ | 1.32 | | | $ | 1.24 | |
| (2) | Operating FFO is defined as FFO as computed in accordance with NAREIT definition, adjusted for the add back of acquisition costs on closed deals. |
| (3) | Adjusted Funds From Operations ("AFFO") is defined as gross FFO less an annual reserve for anticipated recurring, non-revenue generating capitalized costs of $848 and $800 per apartment unit in 2012 and 2011, respectively. Non-cash interest expense of the exchangeable senior notes in accordance with ASC 470-20 (formerly APB14-1) has been added back for 2011. The resulting sum is divided by the weighted average shares/units on a diluted basis to arrive at AFFO per share/unit. |
| (4) | Basic includes common stock outstanding plus operating partnership units in Home Properties, L.P., which can be converted into shares of common stock. Diluted includes additional common stock equivalents. |
Home Properties Reports Second Quarter 2012 Results
For Immediate Release: August 2, 2012
Page 8 of 8
HOME PROPERTIES, INC.
SUMMARY CONSOLIDATED BALANCE SHEETS
(in thousands - Unaudited)
| | | June 30, 2012 | | | December 31, 2011 | |
| Land | | $ | 790,008 | | | $ | 721,542 | |
| Construction in progress | | | 77,864 | | | | 64,201 | |
| Buildings, improvements and equipment | | | 4,575,953 | | | | 4,256,581 | |
| | | | 5,443,825 | | | | 5,042,324 | |
| Accumulated depreciation | | | (1,064,446 | ) | | | (983,759 | ) |
| Real estate, net | | | 4,379,379 | | | | 4,058,565 | |
| | | | | | | | | |
| Cash and cash equivalents | | | 10,499 | | | | 8,297 | |
| Cash in escrows | | | 36,014 | | | | 32,604 | |
| Accounts receivable | | | 11,871 | | | | 12,142 | |
| Prepaid expenses | | | 13,138 | | | | 15,994 | |
| Deferred charges | | | 14,964 | | | | 16,322 | |
| Other assets | | | 11,182 | | | | 9,282 | |
| Total assets | | $ | 4,477,047 | | | $ | 4,153,206 | |
| Mortgage notes payable | | $ | 2,217,361 | | | $ | 2,260,836 | |
| Unsecured notes payable | | | 550,000 | | | | 400,000 | |
| Unsecured line of credit | | | 175,000 | | | | 2,500 | |
| Accounts payable | | | 24,615 | | | | 20,953 | |
| Accrued interest payable | | | 9,951 | | | | 10,286 | |
| Accrued expenses and other liabilities | | | 31,720 | | | | 29,474 | |
| Security deposits | | | 20,176 | | | | 19,513 | |
| Total liabilities | | | 3,028,823 | | | | 2,743,562 | |
| | | | | | | | | |
| Common stockholders’ equity | | | 1,194,093 | | | | 1,153,668 | |
| Noncontrolling interest | | | 254,131 | | | | 255,976 | |
| Total equity | | | 1,448,224 | | | | 1,409,644 | |
| Total liabilities and equity | | $ | 4,477,047 | | | $ | 4,153,206 | |
| | | | | | | | | |
| Total shares/units outstanding: | | | | | | | | |
| Common stock | | | 49,819.5 | | | | 48,321.3 | |
| Operating partnership units | | | 10,638.4 | | | | 10,739.8 | |
| | | | 60,457.9 | | | | 59,061.1 | |
For further information:
David P. Gardner, Executive Vice President and Chief Financial Officer, (585) 246-4113
Charis W. Warshof, Vice President, Investor Relations, (585) 295-4237
###