Home Properties Reports Fourth Quarter and Full Year 2012 Results FFO Per Share Exceeds Wall Street's Mean Estimate by 4 Cents
ROCHESTER, N.Y., February 7, 2013 – Home Properties, Inc. (NYSE: HME) today released financial results for the fourth quarter ended December 31, 2012. All results are reported on a diluted basis.
“Home Properties’ earnings growth in 2012 was the highest in the Company’s history, despite the weak macroeconomic environment,” said Edward J. Pettinella, Home Properties President and CEO. “Apartment sector fundamentals, results from property operations, and the acquisition environment were strong – all contributing factors to our outperformance in 2012.”
Earnings per share ("EPS") for the quarter ended December 31, 2012 was $1.34, compared to $0.29 for the quarter ended December 31, 2011. The $1.05 increase in EPS is primarily attributable to a $60.9 million gain on disposition of property combined with an $8.6 million increase in income from continuing operations. EPS for the year ended December 31, 2012 was $2.69, compared to $0.89 for the year ended December 31, 2011. The $1.80 increase in EPS is primarily attributable to an $80.5 million gain on disposition of property combined with a $37.2 million increase in income from continuing operations. Increased income from continuing operations is attributed to the results of both properties owned throughout 2011 and 2012 (the “Core” properties) and those acquired, developed or redeveloped subsequent to January 1, 2011 (the “Non-Core” properties).
For the quarter ended December 31, 2012, Funds From Operations ("FFO") was $68.3 million, or $1.09 per share, compared to $55.6 million, or $0.93 per share, for the quarter ended December 31 2011, which equates to a 17.1% increase on a per-share basis. Operating FFO per share for the 2012 fourth quarter, which excludes acquisition costs, also was $1.09. Fourth quarter 2012 FFO per share was $0.05 above the midpoint of the guidance range provided by management and $0.04 above the analysts' mean estimate, as reported by Thomson. FFO per share for the year ended December 31, 2012 was $4.13, compared to $3.54 in the year-ago period, a 16.6% increase. Operating FFO per share for 2012 was $4.17, a 15.9% increase from Operating FFO per share of $3.60 in 2011 and a record high for annual growth since the Company went public in 1994. A reconciliation of GAAP net income to FFO is included in the financial data accompanying this news release.
Fourth Quarter Operating Results
For the fourth quarter of 2012, same-property comparisons (for 107 Core properties containing 36,214 apartment units owned since January 1, 2011) reflected an increase in rental income of 4.0% and a 4.3% increase in total revenues compared to the same quarter a year ago. Net operating income (“NOI”) increased by 6.4% from the fourth quarter of 2011. Property level operating expenses increased by 0.7% compared to the prior year quarter, primarily due to
Home Properties Reports Fourth Quarter and Full Year 2012 Results
For Immediate Release: February 7, 2013
Page 2 of 8
increases in water & sewer, personnel costs and property insurance, which were partially offset by decreases in repairs and maintenance and real estate taxes.
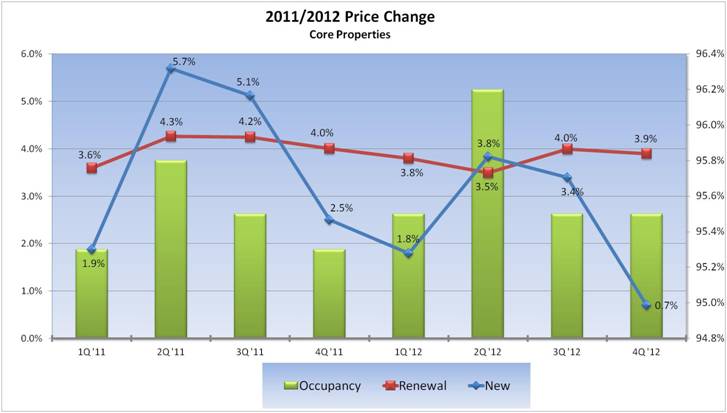
Average physical occupancy for the Core properties was 95.5% during the fourth quarter of 2012, up from 95.2% during the fourth quarter 2011. Average monthly rental rates of $1,257 in the 2012 fourth quarter represent a 3.6% increase compared to the year-ago period.
On a sequential basis, compared to the 2012 third quarter results for Core properties, rental income (excluding utility recovery) was up 0.7% in the fourth quarter of 2012, total revenues increased 1.3%, expenses were up 2.2% and NOI increased 0.9%. Average physical occupancy remained unchanged at 95.5% quarter over quarter.
Physical occupancy for the 6,421 Non-Core apartment units averaged 91.2% during the fourth quarter of 2012, at average monthly rents of $1,384.
On October 29, 2012, Hurricane Sandy hit the Mid-Atlantic and Northeast regions of the United States causing wide-spread flooding and wind damage. Numerous communities owned by the Company were directly affected by this storm. The most severe damage occurred at properties in New Jersey and on Long Island. Property losses, estimated to be $2.2 million, are covered under various property and flood insurance policies. The Company’s estimated net expense included in the fourth quarter results, after insurance reimbursement, is less than $0.1 million.
Full Year Operating Results
For the year ended December 31, 2012, same-property comparisons for the Core properties reflected an increase in total revenues of 4.5% and a decrease in total expense of 1.1% resulting in an 8.1% increase in NOI compared to 2011. Property level operating expenses in 2012 decreased, primarily due to lower electricity, natural gas heating costs, repairs & maintenance, personnel and snow removal costs. These decreases were partially offset by increases in property insurance and real estate taxes.
Average physical occupancy for the Core properties was 95.6% during 2012, up from 95.5% a year ago, with average monthly rental rates of $1,239, an increase of 4.2% over the prior year period.
Acquisitions/Dispositions
There were no acquisitions of apartment communities in the fourth quarter of 2012.
During 2012, the Company acquired three communities with a total of 2,018 units for a combined purchase price of $298.2 million.
During the fourth quarter of 2012, the Company completed four separate sale transactions, totaling 1,172 units, for $118.5 million, producing approximately $82.7 million in net proceeds after closing costs. A gain on sale of approximately $60.9 million was recorded in the fourth quarter related to these sales. The four apartment communities sold were located in the Philadelphia and Baltimore regions. During 2012, the Company closed on six separate sale transactions, with a total of 1,596 units, for a total of $159.6 million.Home Properties Reports Fourth Quarter and Full Year 2012 Results
For Immediate Release: February 7, 2013
Page 3 of 8
Capital Markets Activities
As of December 31, 2012, the Company’s ratio of debt-to-total market capitalization was 42.2% (based on a December 31, 2012 stock price of $61.31 used to determine equity value), with $162.5 million outstanding on its $275 million revolving credit facility and $21.1 million of unrestricted cash on hand. Total debt of $2.8 billion was outstanding, at interest rates averaging 4.5% and with staggered maturities averaging five years. Approximately 87% of total indebtedness was at fixed rates. Interest coverage for the quarter was 3.1 times and the fixed charge ratio was 3.0 times. For the full year, interest coverage was 3.0 times and the fixed charge ratio was 2.9 times.
During the fourth quarter, the Company did not issue any new shares through its At-The-Market (ATM) equity offering program. Year to date, the Company issued 2,366,717 shares at an average price of $62.47 generating gross proceeds of $147.8 million and net proceeds of $144.8 million. There are approximately 2.4 million common shares remaining under this program.
During the fourth quarter, the Company repaid a $100 million unsecured bank demand loan from property disposition proceeds.
Outlook
For 2013, the Company expects FFO between $4.28 and $4.44 per share, which will produce FFO per share growth of 3.8% to 7.6% when compared to 2012 results. “FFO growth in 2013 is muted by the timing effect of property dispositions, which are expected to occur earlier in the year than acquisitions,” said David P. Gardner, Executive Vice President and Chief Financial Officer. “Sale proceeds will be used to reduce short-term, low-interest rate debt without the offsetting benefit of reinvestment in properties until later in the year.”
The guidance range on FFO per share results for the first quarter of 2013 is $1.01 to $1.05. This guidance range reflects management’s current assessment of economic and market conditions. The assumptions for the 2013 projections are included with the published supplemental information.
Supplemental Information
The Company produces supplemental information that includes details regarding property operations, other income, acquisitions, sales, geographic market breakdown, debt and new development. The supplemental information is available via the Company's website through the "Investors" section or e-mail upon request.
Fourth Quarter 2012 Earnings Conference Call and Webcast
The Company will conduct a conference call and simultaneous webcast tomorrow at 11:00 AM ET to review and comment on the information reported in this release. The webcast, which includes audio and a slide presentation, will be available, live at 11:00 AM and archived by 1:00 PM, through the "Investors" section home page of the website www.homeproperties.com. For live audio-only participation, please dial 800-913-1647 (International 212-231-2900).
Home Properties Reports Fourth Quarter and Full Year 2012 Results
For Immediate Release: February 7, 2013
Page 4 of 8
First Quarter 2013 Earnings Release and Conference Call
The Company’s first quarter 2013 financial results are scheduled to be released after the stock market closes on Thursday, May 2, 2013. A conference call, which will be simultaneously webcast, is scheduled for Friday, May 3, 2013 at 11:00 AM ET and will be accessible following the instructions above for the current quarter's conference call.
First Quarter 2013 Conference/Event Schedule
Home Properties’ President and CEO, Edward J. Pettinella, is scheduled to participate in the Wells Fargo Securities’ 16th Annual Real Estate Securities Conference in New York City on February 26 and 27, 2013, and in Barclays Select Series: 2013 Housing Symposium in New York City on February 27, 2013. In addition, he will participate in a roundtable presentation and question and answer session during Citi’s 18th Annual Global Property CEO Conference in Hollywood, Florida to be held from March 3-6, 2013. Any presentation and related materials will be available in the “Investors” section of www.homeproperties.com.
This release contains forward-looking statements. Although the Company believes expectations reflected in such forward-looking statements are based on reasonable assumptions, it can give no assurance that its expectations will be achieved. Factors that may cause actual results to differ include general economic and local real estate conditions, weather and other conditions that might affect operating expenses, the timely completion of repositioning and new development activities within anticipated budgets, the actual pace of future acquisitions and dispositions, and continued access to capital to fund growth.
Home Properties is a publicly traded multifamily real estate investment trust (REIT) that owns, operates, develops, acquires and rehabilitates apartment communities primarily in selected Northeast and Mid-Atlantic markets. An S&P 400 Company, Home Properties owns and operates 121 communities containing 42,635 apartment units. For more information, visit Home Properties’ website at www.homeproperties.com.
Home Properties Reports Fourth Quarter and Full Year 2012 Results
For Immediate Release: February 7, 2013
Page 5 of 8
HOME PROPERTIES, INC.
SUMMARY OF OCCUPANCY AND PROPERTY OPERATING RESULTS
| | | Avg. Physical | | | | | | | |
| Fourth Quarter Results: | | Occupancy(a) | | | | 4Q 2012 | | | 4Q 2012 vs. 4Q 2011 % Growth | |
| | | | | | | | | Average | | | | | | | | | | | | | |
| | | | | | | | | Monthly | | | Base | | | | | | | | | | |
| | | | | | | | | Rent/ | | | Rental | | | Total | | | Total | | | | |
| | | | 4Q 2012 | | | | 4Q 2011 | | | Occ Unit | | | Rates | | | Revenue | | | Expense | | | NOI | |
Core Properties(b) | | | 95.5 | % | | | 95.2 | % | | $ | 1,257 | | | | 3.6 | % | | | 4.3 | % | | | 0.7 | % | | | 6.4 | % |
Non-Core Properties(c) | | | 91.2 | % | | NA | | | $ | 1,384 | | | NA | | | NA | | | NA | | | NA | |
| TOTAL PORTFOLIO | | | 94.7 | % | | NA | | | $ | 1,276 | | | NA | | | NA | | | NA | | | NA | |
| | | | | | | | | | | | | | | | | | | | | | | | |
| | | | | | | | | | | | | | | | | | | | | | | | |
| | | Avg. Physical | | | | | | | | | | | | | | | | | | | | | |
| Year-To-Date Results: | | Occupancy(a) | | | YTD 2012 | | | YTD 2012 vs. YTD 2011 % Growth | |
| | | | | | | | | | | Average | | | | | | | | | | | | | | | | | |
| | | | | | | | | | | Monthly | | | Base | | | | | | | | | | | | | |
| | | YTD | | | YTD | | | Rent / | | | Rental | | | Total | | | Total | | | | | |
| | | | 2012 | | | | 2011 | | | Occ Unit | | | Rates | | | Revenue | | | Expense | | | NOI | |
Core Properties(b) | | | 95.6 | % | | | 95.5 | % | | $ | 1,239 | | | | 4.2 | % | | | 4.5 | % | | | (1.1 | %) | | | 8.1 | % |
Non-Core Properties(c) | | | 90.6 | % | | NA | | | $ | 1,395 | | | NA | | | NA | | | NA | | | NA | |
| TOTAL PORTFOLIO | | | 94.9 | % | | NA | | | $ | 1,259 | | | NA | | | NA | | | NA | | | NA | |
| (a) | Average physical occupancy is defined as total possible rental income, net of vacancy expense, as a percentage of total possible rental income. Total possible rental income is determined by valuing occupied units at contract rates and vacant units at market rents. |
| (b) | Core Properties consist of 107 properties with 36,214 apartment units owned throughout 2011 and 2012. |
| (c) | Non-Core Properties consist of 14 properties with 6,421 apartment units acquired, developed, or redeveloped subsequent to January 1, 2011, such that full year comparable operating results are not available. |
Home Properties Reports Fourth Quarter and Full Year 2012 Results
For Immediate Release: February 7, 2013
Page 6 of 8
HOME PROPERTIES, INC.
SUMMARY CONSOLIDATED STATEMENTS OF OPERATIONS
(in thousands, except per share data – Unaudited)
| | | Three Months Ended | | | Year Ended | |
| | | December 31 | | | December 31 | |
| | | 2012 | | | 2011 | | | 2012 | | | 2011 | |
| Rental income | | $ | 153,166 | | | $ | 136,982 | | | $ | 591,933 | | | $ | 515,780 | |
| Property other income | | | 13,245 | | | | 11,552 | | | | 52,105 | | | | 45,621 | |
| Other income | | | 248 | | | | 60 | | | | 310 | | | | 155 | |
Total revenues | | | 166,659 | | | | 148,594 | | | | 644,348 | | | | 561,556 | |
| Operating and maintenance | | | 59,967 | | | | 55,369 | | | | 235,040 | | | | 217,069 | |
| General and administrative | | | 6,807 | | | | 6,280 | | | | 34,174 | | | | 29,145 | |
| Interest | | | 32,055 | | | | 31,255 | | | | 125,809 | | | | 127,618 | |
| Depreciation and amortization | | | 43,234 | | | | 38,239 | | | | 165,642 | | | | 140,713 | |
| Other expenses | | | 15 | | | | 1,486 | | | | 2,741 | | | | 3,225 | |
Total expenses | | | 142,078 | | | | 132,629 | | | | 563,406 | | | | 517,770 | |
| Income from continuing operations | | | 24,581 | | | | 15,965 | | | | 80,942 | | | | 43,786 | |
| Discontinued operations | | | | | | | | | | | | | | | | |
Income (loss) from discontinued operations | | | (1,403 | ) | | | 1,072 | | | | 2,148 | | | | 3,878 | |
Gain on disposition of property | | | 60,865 | | | | - | | | | 80,532 | | | | - | |
| Discontinued operations | | | 59,462 | | | | 1,072 | | | | 82,680 | | | | 3,878 | |
| Net income | | | 84,043 | | | | 17,037 | | | | 163,622 | | | | 47,664 | |
| Net income attributable to noncontrolling interest | | | (14,269 | ) | | | (3,108 | ) | | | (28,320 | ) | | | (9,808 | ) |
| Net income attributable to common stockholders | | $ | 69,774 | | | $ | 13,929 | | | $ | 135,302 | | | $ | 37,856 | |
Reconciliation from net income attributable to common stockholders to Funds From Operations: | | | | | | | | | | | | | | | | |
| Net income available to common stockholders | | $ | 69,774 | | | $ | 13,929 | | | $ | 135,302 | | | $ | 37,856 | |
| Real property depreciation and amortization | | | 42,970 | | | | 38,566 | | | | 166,411 | | | | 142,059 | |
| Noncontrolling interest | | | 14,269 | | | | 3,108 | | | | 28,320 | | | | 9,808 | |
| Gain on disposition of property | | | (60,865 | ) | | | - | | | | (80,532 | ) | | | - | |
| FFO - basic and diluted, as defined by NAREIT | | | 66,148 | | | | 55,603 | | | | 249,501 | | | | 189,723 | |
Loss from early extinguishment of debt in connection with sale of real estate | | | 2,157 | | | | - | | | | 2,157 | | | | - | |
FFO - basic and diluted (1) | | $ | 68,305 | | | $ | 55,603 | | | $ | 251,658 | | | $ | 189,723 | |
| (1) | Pursuant to the updated guidance for Funds From Operations provided by the Board of Governors of the National Association of Real Estate Investment Trusts ("NAREIT"), FFO is defined as net income (computed in accordance with accounting principles generally accepted in the United States of America ("GAAP")) excluding gains or losses from disposition of property, impairment write-downs of depreciable real estate, noncontrolling interest and extraordinary items plus depreciation from real property. The Company added back debt extinguishment costs which were incurred as a result of repaying property specific debt triggered upon sale as a gain or loss on sale of the property. Because of the limitations of the FFO definition as published by NAREIT as set forth above, the Company has made certain interpretations in applying the definition. The Company believes all adjustments not specifically provided for are consistent with the definition. Other similarly titled measures may not be calculated in the same manner. |
Home Properties Reports Fourth Quarter and Full Year 2012 Results
For Immediate Release: February 7, 2013
Page 7 of 8
HOME PROPERTIES, INC.
SUMMARY CONSOLIDATED STATEMENTS OF OPERATIONS
(in thousands, except per share data – Unaudited)
| | | Three Months Ended | | | Year Ended | |
| | | December 31 | | | December 31 | |
| | | 2012 | | | 2011 | | | 2012 | | | 2011 | |
| FFO – basic and diluted | | $ | 68,305 | | | $ | 55,603 | | | $ | 251,658 | | | $ | 189,723 | |
| FFO – basic and diluted | | $ | 68,305 | | | $ | 55,603 | | | $ | 251,658 | | | $ | 189,723 | |
| Acquisition costs of closed deals included in other expenses | | | 15 | | | | 1,486 | | | | 2,741 | | | | 3,225 | |
Operating FFO (2) | | $ | 68,320 | | | $ | 57,089 | | | $ | 254,399 | | | $ | 192,948 | |
| FFO – basic and diluted | | $ | 68,305 | | | $ | 55,603 | | | $ | 251,658 | | | $ | 189,723 | |
| Recurring non-revenue generating capital expenses | | | (9,163 | ) | | | (8,265 | ) | | | (36,457 | ) | | | (31,822 | ) |
| Addback of non-cash interest expense | | | - | | | | 142 | | | | - | | | | 1,781 | |
AFFO (3) | | $ | 59,142 | | | $ | 47,480 | | | $ | 215,201 | | | $ | 159,682 | |
| Operating FFO | | $ | 68,320 | | | $ | 57,089 | | | $ | 254,399 | | | $ | 192,948 | |
| Recurring non-revenue generating capital expenses | | | (9,163 | ) | | | (8,265 | ) | | | (36,457 | ) | | | (31,822 | ) |
| Addback of non-cash interest expense | | | - | | | | 142 | | | | - | | | | 1,781 | |
Operating AFFO (2) (3) | | $ | 59,157 | | | $ | 48,966 | | | $ | 217,942 | | | $ | 162,907 | |
| Weighted average shares/units outstanding: | | | | | | | | | | | | | | | | |
Shares – basic | | | 51,314.0 | | | | 48,135.8 | | | | 49,744.6 | | | | 41,860.1 | |
Shares – diluted | | | 51,920.1 | | | | 48,745.7 | | | | 50,382.6 | | | | 42,545.1 | |
Shares/units – basic (4) | | | 61,829.4 | | | | 58,904.2 | | | | 60,364.7 | | | | 52,927.0 | |
Shares/units – diluted (4) | | | 62,435.6 | | | | 59,514.1 | | | | 61,002.7 | | | | 53,611.9 | |
| Per share/unit: | | | | | | | | | | | | | | | | |
Net income – basic | | $ | 1.36 | | | $ | 0.29 | | | $ | 2.72 | | | $ | 0.90 | |
Net income – diluted | | $ | 1.34 | | | $ | 0.29 | | | $ | 2.69 | | | $ | 0.89 | |
| FFO – basic | | $ | 1.10 | | | $ | 0.94 | | | $ | 4.17 | | | $ | 3.58 | |
FFO – diluted | | $ | 1.09 | | | $ | 0.93 | | | $ | 4.13 | | | $ | 3.54 | |
Operating FFO (2) | | $ | 1.09 | | | $ | 0.96 | | | $ | 4.17 | | | $ | 3.60 | |
AFFO (3) | | $ | 0.95 | | | $ | 0.80 | | | $ | 3.53 | | | $ | 2.98 | |
Operating AFFO (2) (3) | | $ | 0.95 | | | $ | 0.82 | | | $ | 3.57 | | | $ | 3.04 | |
Common Dividend paid | | $ | 0.66 | | | $ | 0.62 | | | $ | 2.64 | | | $ | 2.48 | |
| (2) | Operating FFO is defined as FFO adjusted for the addback of acquisition costs on closed deals. |
| (3) | Adjusted Funds From Operations ("AFFO") is defined as FFO less an annual reserve for anticipated recurring, non-revenue generating capitalized costs of $848 and $800 per apartment unit in 2012 and 2011, respectively. Non-cash interest expense of the exchangeable senior notes in accordance with ASC 470-20 (formerly APB14-1) has been added back for 2011. The resulting sum is divided by the weighted average shares/units on a diluted basis to arrive at AFFO per share/unit. |
| (4) | Basic includes common stock outstanding plus operating partnership units in Home Properties, L.P., which can be converted into shares of common stock. Diluted includes additional common stock equivalents. |
Home Properties Reports Fourth Quarter and Full Year 2012 Results
For Immediate Release: February 7, 2013
Page 8 of 8
HOME PROPERTIES, INC.
SUMMARY CONSOLIDATED BALANCE SHEETS
(in thousands - Unaudited)
| | | December 31, 2012 | | | December 31, 2011 | |
| Land | | $ | 791,604 | | | $ | 721,542 | |
| Construction in progress | | | 83,241 | | | | 64,201 | |
| Buildings, improvements and equipment | | | 4,580,381 | | | | 4,256,581 | |
| | | | 5,455,226 | | | | 5,042,324 | |
| Accumulated depreciation | | | (1,108,840 | ) | | | (983,759 | ) |
| Real estate, net | | | 4,346,386 | | | | 4,058,565 | |
| | | | | | | | | |
| Cash and cash equivalents | | | 21,092 | | | | 8,297 | |
| Cash in escrows | | | 26,971 | | | | 32,604 | |
| Accounts receivable | | | 13,406 | | | | 12,142 | |
| Prepaid expenses | | | 19,504 | | | | 15,994 | |
| Deferred charges | | | 13,429 | | | | 16,322 | |
| Other assets | | | 10,704 | | | | 9,282 | |
| Total assets | | $ | 4,451,492 | | | $ | 4,153,206 | |
| Mortgage notes payable | | $ | 2,165,027 | | | $ | 2,260,836 | |
| Unsecured notes payable | | | 450,000 | | | | 400,000 | |
| Unsecured line of credit | | | 162,500 | | | | 2,500 | |
| Accounts payable | | | 22,691 | | | | 20,953 | |
| Accrued interest payable | | | 9,974 | | | | 10,286 | |
| Accrued expenses and other liabilities | | | 33,887 | | | | 29,474 | |
| Security deposits | | | 19,146 | | | | 19,513 | |
| Total liabilities | | | 2,863,225 | | | | 2,743,562 | |
| | | | | | | | | |
| Common stockholders’ equity | | | 1,320,968 | | | | 1,153,668 | |
| Noncontrolling interest | | | 267,299 | | | | 255,976 | |
| Total equity | | | 1,588,267 | | | | 1,409,644 | |
| Total liabilities and equity | | $ | 4,451,492 | | | $ | 4,153,206 | |
| | | | | | | | | |
| Total shares/units outstanding: | | | | | | | | |
| Common stock | | | 51,508.1 | | | | 48,321.3 | |
| Operating partnership units | | | 10,455.6 | | | | 10,739.8 | |
| | | | 61,963.7 | | | | 59,061.1 | |
For further information:
David P. Gardner, Executive Vice President and Chief Financial Officer, (585) 246-4113
Charis W. Warshof, Vice President, Investor Relations, (585) 295-4237