FOR IMMEDIATE RELEASE
Home Properties Reports First Quarter 2013 Results
ROCHESTER, N.Y., May 2, 2013 – Home Properties, Inc. (NYSE: HME) today released financial results for the first quarter ended March 31, 2013. All results are reported on a diluted basis.
“Positive rent growth and high occupancy contributed to a solid increase in net operating income in the first quarter, supporting our view that 2013 will be another good year for Home Properties,” said Edward J. Pettinella, Home Properties President and CEO. “The business environment for Home and the multifamily sector in 2013 remains favorable, although we do not expect the record level of earnings growth we experienced in 2012, which was a truly great year.”
Earnings per share ("EPS") for the quarter ended March 31, 2013 was $0.99, compared to $0.31 for the quarter ended March 31, 2012. The $0.68 increase in EPS is primarily attributable to a $40.4 million gain on disposition of property combined with a $5.6 million increase in income from continuing operations from both the properties owned throughout 2012 and 2013 (the “Core” properties) and those acquired, developed, or redeveloped subsequent to January 1, 2012 (the “Non-Core” properties).
For the quarter ended March 31, 2013, Funds From Operations ("FFO") were $66.0 million, or $1.05 per share, compared to $58.4 million, or $0.98 per share, for the quarter ended March 31, 2012, which equates to a 7.5% increase on a per-share basis. A reconciliation of GAAP net income to FFO is included in the financial data accompanying this news release.
First Quarter Operating Results
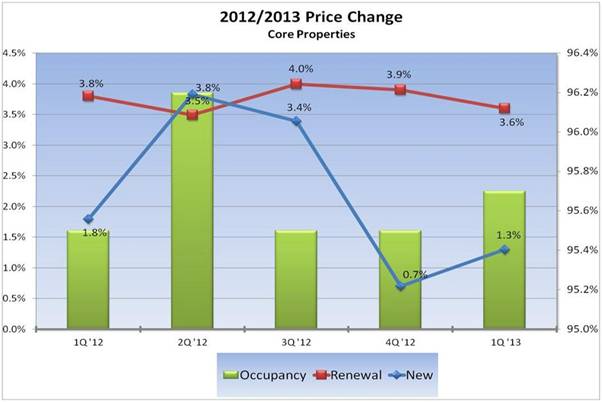
For the first quarter of 2013, same-property comparisons (for 114 Core properties containing 38,941 apartment units owned since January 1, 2012) reflected an increase in rental income of 4.2% and a 3.7% increase in total revenues compared to the same quarter a year ago. Net operating income (“NOI”) increased by 5.4% from the first quarter of 2012. Property level operating expenses increased by 0.9% compared to the prior year quarter, primarily due to increases in natural gas heating costs, personnel expense, real estate taxes, and snow removal costs, which were partially offset by a decrease in legal and professional costs, office and telephone, and property insurance.
Average physical occupancy for the Core properties was 95.7% during the first quarter of 2013, up from 94.9% during the first quarter of 2012. Average monthly rental rates of $1,277 represent a 3.3% increase compared to the year-ago period.
On a sequential basis, compared to the 2012 fourth quarter results for Core properties, rental income (excluding utility recovery) was up 0.8% in the first quarter of 2013, total revenues increased 1.8%, expenses were up 5.1% and NOI was essentially flat. Average physical occupancy increased 0.2% to 95.7%.
Home Properties Reports First Quarter 2013 Results
For Immediate Release: May 2, 2013
Page 2 of 8
Physical occupancy for the 3,183 apartment units acquired/developed/redeveloped between January 1, 2012 and March 31, 2013 averaged 88.1% during the first quarter of 2013, at average monthly rents of $1,296.
Acquisitions/Dispositions
There were no acquisitions of apartment communities during the first quarter of 2013.
As previously reported, during the first quarter of 2013, the Company completed two separate sale transactions, totaling 511 units, for $109.1 million, producing approximately $64 million in net proceeds. A gain on sale of approximately $40.4 million was recorded in the first quarter related to these sales. A gain of approximately $1.3 million was deferred pending certain approvals that management anticipates receiving in the second quarter of 2013. The two apartment communities sold were located in the Long Island and Washington, D.C. regions.
Subsequent to the end of the quarter, the Company sold one apartment community in the Philadelphia region with a total of 158 units, for $15 million. A gain on sale of approximately $3.3 million will be recorded in the second quarter of 2013 related to this sale.
Development
On January 8, 2013, the Company purchased land for development located in Tysons Corner, Virginia for $26.9 million. The Company intends to develop a residential community, in multiple phases, which will contain 694 units for an estimated total cost of $232 million. This development has been previously disclosed as Westpark Tysons in the quarterly supplemental information.
Capital Markets Activities
As of March 31, 2013, the Company’s ratio of debt-to-total market capitalization was 40.3% (based on a March 28, 2013 stock price of $63.42 used to determine equity value), with $169 million outstanding on its $275 million revolving credit facility and $8 million of unrestricted cash on hand. Total debt of $2.7 billion was outstanding, at interest rates averaging 4.6% and with staggered maturities averaging five years. Approximately 87% of total indebtedness was at fixed rates. Interest coverage for the quarter was 3.1 times and the fixed charge ratio was 3.0 times.
The Company repaid maturing debt of approximately $60 million during the first quarter on three properties which had a weighted average interest rate of 5.44%. These properties are now part of the unencumbered asset pool.
The Company has an At-The-Market equity offering program through which it may sell up to 4.4 million common shares. During the first quarter of 2013, 407,296 shares were issued at an average price of $63.48 generating gross proceeds of $25.9 million and net proceeds of $25.3 million. Pending trades at the end of March included an additional 52,113 shares issued at an average price of $63.74 generating net proceeds of $3.3 million. Since the current program’s inception, 2,430,233 shares have been issued at an average price of $62.81 generating gross proceeds of $152.6 million and net proceeds of $149.4 million. There are approximately two million common shares that remain available under this program.
Home Properties Reports First Quarter 2013 Results
For Immediate Release: May 2, 2013
Page 3 of 8
Outlook
Based solely on the actual first quarter results as compared to expectations, the Company has increased the midpoint of its prior guidance by two cents to $4.38 and the range of FFO per share to $4.32 to $4.44. The guidance range of both FFO and Operating FFO per share results for the second quarter of 2013 is $1.07 to $1.11. The Company expects to include additional commentary on projected results for the balance of the year when it announces second quarter 2013 financial results.
Dividend Declared
The Company announced a regular cash dividend on the Company’s common shares of $0.70 per share for the quarter ended March 31, 2013. The dividend is payable on May 24, 2013 to shareholders of record on May 14, 2013 and is equivalent to an annualized rate of $2.80 per share. The current annual dividend represents a 4.3% yield based on the April 29 closing price of $64.48. Home Properties’ common stock will begin trading ex-dividend on May 10, 2013.
Supplemental Information
The Company produces supplemental information that includes details regarding property operations, other income, acquisitions, sales, geographic market breakdown, debt and new development. The supplemental information is available via the Company's website through the "Investors" section or e-mail upon request.
First Quarter 2013 Earnings Conference Call
The Company will conduct a conference call and simultaneous webcast tomorrow at 11:00 AM ET to review and comment on the information reported in this release. The webcast, which includes audio and a slide presentation, will be available, live at 11:00 AM and archived by 1:00 PM, through the "Investors" section home page of the website homeproperties.com. For live audio-only participation, please dial 800-913-1647 (International 212-231-2900).
Second Quarter 2013 Conference/Event Schedule
Home Properties is scheduled to participate in REITWeek 2013:® NAREIT's Investor Forum® from June 5-7, 2013 in Chicago. Management will present information and answer questions about its operations on Wednesday, June 5, from 11:45 AM-12:15 PM CT. The audio presentation and related materials will be available at homeproperties.com in the “Investors” section. Details on how to access any presentation or related materials will be available at homeproperties.com in the “Investors” section.
Second Quarter 2013 Earnings Release and Conference Call
The Company’s second quarter 2013 financial results are scheduled to be released after the stock market closes on Thursday, August 1, 2013. A conference call, which will be simultaneously webcast, is scheduled for Friday, August 2, 2013 at 11:00 AM ET and will be accessible following the instructions for the current quarter's conference call.
Home Properties Reports First Quarter 2013 Results
For Immediate Release: May 2, 2013
Page 4 of 8
This release contains forward-looking statements. Although the Company believes expectations reflected in such forward-looking statements are based on reasonable assumptions, it can give no assurance that its expectations will be achieved. Factors that may cause actual results to differ include general economic and local real estate conditions, weather and other conditions that might affect operating expenses, the timely completion of repositioning and new development activities within anticipated budgets, the actual pace of future acquisitions and dispositions, and continued access to capital to fund growth.
Home Properties is a publicly traded apartment real estate investment trust that owns, operates, develops, acquires and rehabilitates apartment communities primarily in selected Northeast and Mid-Atlantic markets. An S & P 400 Company, Home Properties owns and operates 118 communities containing 41,966 apartment units. For more information, visit Home Properties’ website at www.homeproperties.com.
Home Properties Reports First Quarter 2013 Results
For Immediate Release: May 2, 2013
Page 5 of 8
HOME PROPERTIES, INC.
SUMMARY OF OCCUPANCY AND PROPERTY OPERATING RESULTS
| | | Avg. Physical | | | | | | | |
| First Quarter Results: | | Occupancy(a) | | | 1Q 2013 | | | 1Q 2013 vs. 1Q 2012 % Growth | |
| | | | | | | | | Average | | | | | | | | | | | | | |
| | | | | | | | | Monthly | | | Base | | | | | | | | | | |
| | | | | | | | | Rent/ | | | Rental | | | Total | | | Total | | | | |
| | | 1Q 2013 | | | 1Q 2012 | | | Occ Unit | | | Rates | | | Revenue | | | Expense | | | NOI | |
Core Properties(b) | | | 95.7 | % | | | 94.9 | % | | $ | 1,277 | | | | 3.3 | % | | | 3.7 | % | | | 0.9 | % | | | 5.4 | % |
Non-Core Properties(c) | | | 88.1 | % | | NA | | | $ | 1,296 | | | NA | | | NA | | | NA | | | NA | |
| TOTAL PORTFOLIO | | | 95.1 | % | | NA | | | $ | 1,278 | | | NA | | | NA | | | NA | | | NA | |
| (a) | Average physical occupancy is defined as total possible rental income, net of vacancy expense, as a percentage of total possible rental income. Total possible rental income is determined by valuing occupied units at contract rates and vacant units at market rents. |
| (b) | Core Properties consist of 114 properties with 38,941 apartment units owned throughout 2012 and 2013. |
| (c) | Non-Core Properties consist of 5 properties with 3,183 apartment units acquired, developed, or redeveloped subsequent to January 1, 2012, such that full year comparable operating results are not available. |
Home Properties Reports First Quarter 2013 Results
For Immediate Release: May 2, 2013
Page 6 of 8
HOME PROPERTIES, INC.
SUMMARY CONSOLIDATED STATEMENTS OF OPERATIONS
(in thousands, except per share data – Unaudited)
| | | Three Months Ended | |
| | | March 31 | |
| | | 2013 | | | 2012 | |
| Rental income | | $ | 152,143 | | | $ | 138,762 | |
| Property other income | | | 14,688 | | | | 14,451 | |
| Other income | | | 249 | | | | 10 | |
Total revenues | | | 167,080 | | | | 153,223 | |
| Operating and maintenance | | | 62,010 | | | | 58,727 | |
| General and administrative | | | 9,082 | | | | 8,312 | |
| Interest | | | 30,623 | | | | 30,460 | |
| Depreciation and amortization | | | 42,811 | | | | 38,808 | |
| Other expenses | | | 17 | | | | 18 | |
Total expenses | | | 144,543 | | | | 136,325 | |
| Income from continuing operations | | | 22,537 | | | | 16,898 | |
| Discontinued operations | | | | | | | | |
Income (loss) from discontinued operations | | | (570 | ) | | | 1,888 | |
Gain on disposition of property | | | 40,359 | | | | - | |
| Discontinued operations | | | 39,789 | | | | 1,888 | |
| Net income | | | 62,326 | | | | 18,786 | |
| Net income attributable to noncontrolling interest | | | (10,446 | ) | | | (3,398 | ) |
| Net income attributable to common stockholders | | $ | 51,880 | | | $ | 15,388 | |
Reconciliation from net income attributable to common stockholders to Funds From Operations: | | | | | | | | |
| Net income available to common stockholders | | $ | 51,880 | | | $ | 15,388 | |
| Real property depreciation and amortization | | | 42,665 | | | | 39,658 | |
| Noncontrolling interest | | | 10,446 | | | | 3,398 | |
| Gain on disposition of property | | | (40,359 | ) | | | - | |
| FFO - basic and diluted, as defined by NAREIT | | | 64,632 | | | | 58,444 | |
Loss from early extinguishment of debt in connection with sale of real estate | | | 1,416 | | | | - | |
FFO - basic and diluted (1) | | $ | 66,048 | | | $ | 58,444 | |
| (1) | Pursuant to the updated guidance for Funds From Operations provided by the Board of Governors of the National Association of Real Estate Investment Trusts ("NAREIT"), FFO is defined as net income (computed in accordance with accounting principles generally accepted in the United States of America ("GAAP")) excluding gains or losses from disposition of property, impairment write-downs of depreciable real estate, noncontrolling interest and extraordinary items plus depreciation from real property. The Company adds back debt extinguishment costs and other one-time costs incurred as a result of repaying property specific debt triggered upon sale of a property. Because of the limitations of the FFO definition as published by NAREIT as set forth above, the Company has made certain interpretations in applying the definition. The Company believes all adjustments not specifically provided for are consistent with the definition. Other similarly titled measures may not be calculated in the same manner. |
Home Properties Reports First Quarter 2013 Results
For Immediate Release: May 2, 2013
Page 7 of 8
HOME PROPERTIES, INC.
SUMMARY CONSOLIDATED STATEMENTS OF OPERATIONS
(in thousands, except per share data – Unaudited)
| | | Three Months Ended | |
| | | March 31 | |
| | | 2013 | | | 2012 | |
| FFO – basic and diluted | | $ | 66,048 | | | $ | 58,444 | |
| FFO – basic and diluted | | $ | 66,048 | | | $ | 58,444 | |
| Acquisition costs of closed deals included in other expenses | | | 17 | | | | 18 | |
Operating FFO (2) | | $ | 66,065 | | | $ | 58,462 | |
| FFO – basic and diluted | | $ | 66,048 | | | $ | 58,444 | |
| Recurring non-revenue generating capital expenses | | | (9,034 | ) | | | (8,900 | ) |
AFFO (3) | | $ | 57,014 | | | $ | 49,544 | |
| Operating FFO | | $ | 66,065 | | | $ | 58,462 | |
| Recurring non-revenue generating capital expenses | | | (9,034 | ) | | | (8,900 | ) |
Operating AFFO (2) (3) | | $ | 57,031 | | | $ | 49,562 | |
| Weighted average shares/units outstanding: | | | | | | | | |
Shares – basic | | | 51,618.7 | | | | 48,334.5 | |
Shares – diluted | | | 52,325.4 | | | | 49,013.0 | |
Shares/units – basic (4) | | | 62,045.9 | | | | 59,037.5 | |
Shares/units – diluted (4) | | | 62,752.6 | | | | 59,716.1 | |
| Per share/unit: | | | | | | | | |
Net income – basic | | $ | 1.01 | | | $ | 0.32 | |
Net income – diluted | | $ | 0.99 | | | $ | 0.31 | |
| FFO – basic | | $ | 1.06 | | | $ | 0.99 | |
FFO – diluted | | $ | 1.05 | | | $ | 0.98 | |
Operating FFO (2) | | $ | 1.05 | | | $ | 0.98 | |
AFFO (3) | | $ | 0.91 | | | $ | 0.83 | |
Operating AFFO (2) (3) | | $ | 0.91 | | | $ | 0.83 | |
Common Dividend paid | | $ | 0.70 | | | $ | 0.66 | |
| (2) | Operating FFO is defined as FFO as adjusted for the addback of acquisition costs on closed deals. |
| (3) | Adjusted Funds From Operations ("AFFO") is defined as FFO less an annual reserve for anticipated recurring, non-revenue generating capitalized costs of $848 per apartment unit. The resulting sum is divided by the weighted average shares/units on a diluted basis to arrive at AFFO per share/unit. |
| (4) | Basic includes common stock outstanding plus operating partnership units in Home Properties, L.P., which can be converted into shares of common stock. Diluted includes additional common stock equivalents. |
Home Properties Reports First Quarter 2013 Results
For Immediate Release: May 2, 2013
Page 8 of 8
HOME PROPERTIES, INC.
SUMMARY CONSOLIDATED BALANCE SHEETS
(in thousands - Unaudited)
| | | March 31, 2013 | | | December 31, 2012 | |
| Land | | $ | 781,105 | | | $ | 791,604 | |
| Construction in progress | | | 130,392 | | | | 83,241 | |
| Buildings, improvements and equipment | | | 4,537,478 | | | | 4,580,381 | |
| | | | 5,448,975 | | | | 5,455,226 | |
| Accumulated depreciation | | | (1,133,012 | ) | | | (1,108,840 | ) |
| Real estate, net | | | 4,315,963 | | | | 4,346,386 | |
| | | | | | | | | |
| Cash and cash equivalents | | | 8,090 | | | | 21,092 | |
| Cash in escrows | | | 34,744 | | | | 26,971 | |
| Accounts receivable | | | 15,389 | | | | 13,406 | |
| Prepaid expenses | | | 14,944 | | | | 19,504 | |
| Deferred charges | | | 12,539 | | | | 13,429 | |
| Other assets | | | 4,885 | | | | 10,704 | |
| Total assets | | $ | 4,406,554 | | | $ | 4,451,492 | |
| Mortgage notes payable | | $ | 2,054,926 | | | $ | 2,165,027 | |
| Unsecured notes payable | | | 450,000 | | | | 450,000 | |
| Unsecured line of credit | | | 169,000 | | | | 162,500 | |
| Accounts payable | | | 28,868 | | | | 22,691 | |
| Accrued interest payable | | | 11,828 | | | | 9,974 | |
| Accrued expenses and other liabilities | | | 30,003 | | | | 33,887 | |
| Security deposits | | | 18,805 | | | | 19,146 | |
| Total liabilities | | | 2,763,430 | | | | 2,863,225 | |
| | | | | | | | | |
| Common stockholders’ equity | | | 1,370,426 | | | | 1,320,968 | |
| Noncontrolling interest | | | 272,698 | | | | 267,299 | |
| Total equity | | | 1,643,124 | | | | 1,588,267 | |
| Total liabilities and equity | | $ | 4,406,554 | | | $ | 4,451,492 | |
| | | | | | | | | |
| Total shares/units outstanding: | | | | | | | | |
| Common stock | | | 52,103.1 | | | | 51,508.1 | |
| Operating partnership units | | | 10,411.1 | | | | 10,455.6 | |
| | | | 62,514.2 | | | | 61,963.7 | |
For further information:
David P. Gardner, Executive Vice President and Chief Financial Officer, (585) 246-4113
Charis W. Warshof, Vice President, Investor Relations, (585) 295-4237
###