FOR IMMEDIATE RELEASE
Home Properties Reports Fourth Quarter and Full Year 2013 Results
ROCHESTER, N.Y., February 6, 2014 – Home Properties, Inc. (NYSE: HME) today released financial results for the fourth quarter and year ended December 31, 2013. All results are reported on a diluted basis.
“Home Properties continued its track record of consistent performance in 2013, delivering solid operating results as well as further strengthening its balance sheet to enhance future financial flexibility,” said Edward J. Pettinella, Home Properties President and CEO.
Earnings per share ("EPS") for the quarter ended December 31, 2013 was $0.99 compared to $1.34 for the quarter ended December 31, 2012. The $0.35 reduction in fourth quarter 2013 EPS was primarily attributable to a $24.7 million lower gain on dispositions of property, partially offset by an $8.0 million increase in income from continuing operations from both the properties owned throughout 2012 and 2013 (the “Core” properties) and those acquired, developed or redeveloped subsequent to January 1, 2012 (the “Non-Core” properties). EPS for the year ended December 31, 2013 was $2.93 compared to $2.69 for the year ended December 31, 2012. The $0.24 increase in EPS in 2013 is primarily attributable to a $33.6 million increase in income from continuing operations.
For the quarter ended December 31, 2013, Funds From Operations ("FFO") was $75.2 million, or $1.11 per share, compared to $68.3 million, or $1.09 per share, for the quarter ended December 31, 2012, which equates to a 1.6% increase on a per-share basis. FFO for the year ended December 31, 2013 was $4.37 per share, compared to $4.13 per share in the year-ago period, which equates to a 5.9% increase on a per-share basis. A reconciliation of GAAP net income to FFO is included in the financial data accompanying this news release.
Fourth Quarter Operating Results
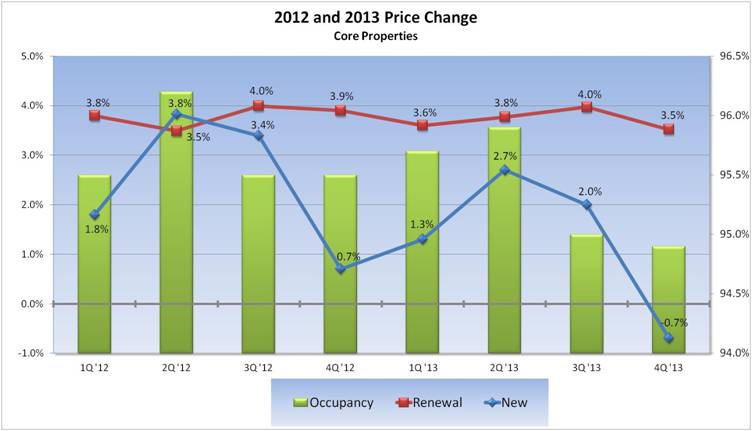
For the fourth quarter of 2013, same-property comparisons (for 112 Core properties containing 38,440 apartment units owned since January 1, 2012) reflected an increase of 2.9% in base rental rates and an increase of 2.7% in total revenues compared to the same quarter a year ago. Net operating income (“NOI”) increased by 3.2% from the fourth quarter of 2012. Property level operating expenses increased by 1.9% compared to the prior year quarter, primarily due to increases in repairs & maintenance, legal & professional expense, and snow removal costs, which were partially offset by a decrease in natural gas heating costs.
Average physical occupancy for the Core properties was 94.9% during the fourth quarter of 2013, compared to 95.4% during the fourth quarter of 2012. Average monthly rental rates of $1,309 represent a 2.9% increase compared to the year-ago period.
Home Properties Reports Fourth Quarter and Full Year 2013 Results
For Immediate Release: February 6, 2014
Page 2 of 8
On a sequential basis, compared to the 2013 third quarter results for Core properties, rental income (excluding utility recovery) increased 0.6% in the fourth quarter of 2013, total revenues increased 1.3%, expenses were up 2.3% and NOI increased 0.7%. Average physical occupancy decreased 0.1% to 94.9%.
Physical occupancy for the 3,640 apartment units acquired/developed/redeveloped between January 1, 2012 and December 31, 2013 averaged 92.0% during the fourth quarter of 2013, at average monthly rents of $1,314.
Full Year Operating Results
For the year ended December 31, 2013, same-property comparisons for the Core properties reflected an increase in total revenues of 3.2% and an increase in total expenses of 1.8%, resulting in a 4.0% increase in NOI compared to 2012. Property level operating expenses increased primarily due to personnel expense, real estate taxes and snow removal costs. These increases were partially offset by decreases in repairs & maintenance, office & telephone and property insurance expense.
Average physical occupancy for the Core properties was 95.3% during 2013, down slightly from 95.4% a year ago, with average monthly rental rates of $1,294, an increase of 3.2% over the prior year period.
Acquisitions/Dispositions
As previously reported, during the fourth quarter of 2013, the Company acquired one apartment community with 205 units in the Philadelphia region and one apartment community with 252 units in the Boston region. The combined purchase price of $55.8 million was paid in cash. In connection with these acquisitions, closing costs of $0.2 million were incurred and are included in other expenses in the fourth quarter of 2013.
During the fourth quarter of 2013, as previously reported, the Company sold a 344-unit apartment community in the Washington, D.C. region for $68 million. A gain on sale of $36.2 million was recorded in the fourth quarter of 2013 related to this sale.
For the year ended December 31, 2013, the Company sold four apartment communities with 1,013 units for a total consideration of $192.1 million. The weighted average historical capitalization rate on these sales was 5.8% after applying a 2.7% management fee and before capital expenditures.
Development
Construction continued as planned on Eleven55 Ripley and Courts at Spring Mill Station.
The Company purchased a land parcel located in Linthicum, Md. in the fourth quarter of 2013 for $13.8 million, which includes the closing costs. A construction start date for the approximately 300 apartment units which will comprise the Concorde Circle community has not been determined, but is not anticipated to occur earlier than late 2014 or into 2015.
Home Properties Reports Fourth Quarter and Full Year 2013 Results
For Immediate Release: February 6, 2014
Page 3 of 8
Capital Markets Activities
On November 11, 2013, Moody’s Investors Services assigned a Baa2 issuer rating to Home Properties.
As of December 31, 2013, the Company’s ratio of debt-to-total market capitalization was 40.5% (based on a December 31, 2013 stock price of $53.62 used to determine equity value), with $193 million outstanding on its $450 million revolving credit facility and $9.9 million of unrestricted cash on hand. Total debt of $2.5 billion was outstanding, at interest rates averaging 4.4% and with staggered maturities averaging four years. Approximately 89% of total indebtedness was at fixed rates. Interest coverage for the quarter was 3.9 times and the fixed charge ratio was 3.6 times. For the full year, interest coverage was 3.5 times and the fixed charge ratio was 3.3 times.
During the quarter, the Company repaid a $27.6 million variable-rate mortgage in connection with a property disposition, which triggered a prepayment penalty of $0.3 million. In addition, the Company repaid two mortgages securing one property totaling $29.1 million. This property is now part of the unencumbered asset pool. As of December 31, 2013, the unencumbered asset pool represented 47.8% of total value, up from 37.5% at December 31, 2012.
During the fourth quarter of 2013, the Company did not issue any new shares through its At-The-Market equity offering program. There are approximately two million common shares that remain available under this program.
Outlook
For 2014, the Company expects FFO between $4.44 and $4.60 per share, which will produce FFO per share growth of 1.6% to 5.3% when compared to 2013 results. “FFO growth in 2014, especially the first half of the year, is impacted by the continued dilution from the Company’s July 2013 public stock offering,” said David P. Gardner, Executive Vice President and Chief Financial Officer.
The guidance range on FFO per share results for the first quarter of 2014 is $1.02 to $1.06. This guidance range reflects management’s current assessment of economic and market conditions. The assumptions for the 2014 projections are included with the published supplemental information.
Supplemental Information
The Company produces supplemental information that includes details regarding property operations, other income, acquisitions, sales, geographic market breakdown, debt and new development. The supplemental information is available via the Company's website through the "Investors" section or e-mail upon request.
Fourth Quarter 2013 Earnings Conference Call
The Company will conduct a conference call and simultaneous webcast on February 7, 2014 at 11:00 AM ET to review and comment on the information reported in this release. The webcast, which includes audio and a slide presentation, will be available, live at 11:00 AM and archived by 1:00 PM, through the "Investors" section home page of the website homeproperties.com. For live audio-only participation, please dial 800-913-1647 (International 212-231-2900).
Home Properties Reports Fourth Quarter and Full Year 2013 Results
For Immediate Release: February 6, 2014
Page 4 of 8
First Quarter 2014 Conference/Event Schedule
Home Properties is scheduled to participate in Wells Fargo Securities’ Real Estate Securities Conference on February 27, 2014 in New York City and in Citi’s 2014 Global Property CEO Conference March 3-5, 2014 in Hollywood, FL. Presentation materials will be available at www.homeproperties.com in the “Investors” section.
First Quarter 2014 Earnings Release and Conference Call
The Company’s first quarter 2014 financial results are scheduled to be released after the stock market closes on Thursday, May 1, 2014. A conference call, which will be simultaneously webcast, is scheduled for Friday, May 2, 2014 at 11:00 AM ET and will be accessible following the instructions above for the current quarter's conference call.
This release contains forward-looking statements. Although the Company believes expectations reflected in such forward-looking statements are based on reasonable assumptions, it can give no assurance that its expectations will be achieved. Factors that may cause actual results to differ include general economic and local real estate conditions, weather and other conditions that might affect operating expenses, the timely completion of repositioning and new development activities within anticipated budgets, the actual pace of future acquisitions and dispositions, and continued access to capital to fund growth.
Home Properties is a publicly traded apartment real estate investment trust that owns, operates, develops, acquires and rehabilitates apartment communities primarily in selected Northeast and Mid-Atlantic markets. An S & P 400 Company, Home Properties owns and operates 120 communities containing 42,297 apartment units. For more information, visit Home Properties’ website at www.homeproperties.com.
Home Properties Reports Fourth Quarter and Full Year 2013 Results
For Immediate Release: February 6, 2014
Page 5 of 8
HOME PROPERTIES, INC.
SUMMARY OF OCCUPANCY AND PROPERTY OPERATING RESULTS
| | | Avg. Physical | | | | | | | |
| Fourth Quarter Results: | | Occupancy(a) | | | | 4Q 2013 | | | 4Q 2013 vs. 4Q 2012 % Growth | |
| | | | | | | | | Average | | | | | | | | | | | | | |
| | | | | | | | | Monthly | | | Base | | | | | | | | | | |
| | | | | | | | | Rent/ | | | Rental | | | Total | | | Total | | | | |
| | | | 4Q 2013 | | | | 4Q 2012 | | | Occ Unit | | | Rates | | | Revenue | | | Expense | | | NOI | |
Core Properties(b) | | | 94.9 | % | | | 95.4 | % | | $ | 1,309 | | | | 2.9 | % | | | 2.7 | % | | | 1.9 | % | | | 3.2 | % |
Non-Core Properties(c) | | | 92.0 | % | | NA | | | $ | 1,314 | | | NA | | | NA | | | NA | | | NA | |
| TOTAL PORTFOLIO | | | 94.7 | % | | NA | | | $ | 1,310 | | | NA | | | NA | | | NA | | | NA | |
| | | | | | | | | | | | | | | | | | | | | | | | |
| | | Avg. Physical | | | | | | | | | | | | | | | | | | | | | |
| Year-To-Date Results: | | Occupancy(a) | | | YTD 2013 | | | YTD 2013 vs. YTD 2012 % Growth | |
| | | | | | | | | | | Average | | | | | | | | | | | | | | | | | |
| | | | | | | | | | | Monthly | | | Base | | | | | | | | | | | | | |
| | | YTD | | | YTD | | | Rent / | | | Rental | | | Total | | | Total | | | | | |
| | | | 2013 | | | | 2012 | | | Occ Unit | | | Rates | | | Revenue | | | Expense | | | NOI | |
Core Properties(b) | | | 95.3 | % | | | 95.4 | % | | $ | 1,294 | | | | 3.2 | % | | | 3.2 | % | | | 1.8 | % | | | 4.0 | % |
Non-Core Properties(c) | | | 91.0 | % | | NA | | | $ | 1,306 | | | NA | | | NA | | | NA | | | NA | |
| TOTAL PORTFOLIO | | | 95.0 | % | | NA | | | $ | 1,295 | | | NA | | | NA | | | NA | | | NA | |
| (a) | Average physical occupancy is defined as total possible rental income, net of vacancy expense, as a percentage of total possible rental income. Total possible rental income is determined by valuing occupied units at contract rates and vacant units at market rents. |
| (b) | Core Properties consist of 112 properties with 38,440 apartment units owned throughout 2012 and 2013. |
| (c) | Non-Core Properties consist of 7 properties with 3,640 apartment units acquired, developed, or redeveloped subsequent to January 1, 2012, such that full year comparable operating results are not available. Non-Core Properties excludes properties still under development where construction is not 100% complete. |
Home Properties Reports Fourth Quarter and Full Year 2013 Results
For Immediate Release: February 6, 2014
Page 6 of 8
HOME PROPERTIES, INC.
SUMMARY CONSOLIDATED STATEMENTS OF OPERATIONS
(in thousands, except per share data – Unaudited)
| | | Three Months Ended | | | Year Ended | |
| | | December 31 | | | December 31 | |
| | | 2013 | | | 2012 | | | 2013 | | | 2012 | |
| Rental income | | $ | 153,793 | | | $ | 149,169 | | | $ | 608,994 | | | $ | 575,969 | |
| Property other income | | | 13,490 | | | | 12,896 | | | | 53,426 | | | | 50,709 | |
| Other income | | | 508 | | | | 247 | | | | 1,180 | | | | 311 | |
Total revenues | | | 167,791 | | | | 162,312 | | | | 663,600 | | | | 626,989 | |
| Operating and maintenance | | | 59,647 | | | | 58,553 | | | | 238,510 | | | | 229,290 | |
| General and administrative | | | 5,935 | | | | 6,807 | | | | 28,507 | | | | 34,174 | |
| Interest | | | 26,334 | | | | 31,597 | | | | 113,911 | | | | 123,874 | |
| Depreciation and amortization | | | 44,335 | | | | 42,074 | | | | 172,903 | | | | 161,047 | |
| Other expenses | | | 264 | | | | 15 | | | | 312 | | | | 2,741 | |
Total expenses | | | 136,515 | | | | 139,046 | | | | 554,143 | | | | 551,126 | |
| Income from continuing operations | | | 31,276 | | | | 23,266 | | | | 109,457 | | | | 75,863 | |
| Discontinued operations | | | | | | | | | | | | | | | | |
Income (loss) from discontinued operations | | | (247 | ) | | | (88 | ) | | | 917 | | | | 7,227 | |
Gain on disposition of property | | | 36,201 | | | | 60,865 | | | | 81,205 | | | | 80,532 | |
| Discontinued operations | | | 35,954 | | | | 60,777 | | | | 82,122 | | | | 87,759 | |
| Net income | | | 67,230 | | | | 84,043 | | | | 191,579 | | | | 163,622 | |
| Net income attributable to noncontrolling interest | | | (10,311 | ) | | | (14,269 | ) | | | (30,706 | ) | | | (28,320 | ) |
| Net income attributable to common stockholders | | $ | 56,919 | | | $ | 69,774 | | | $ | 160,873 | | | $ | 135,302 | |
| Reconciliation from net income attributable to common stockholders to Funds From Operations: | | | | | | | | | | | | | | | | |
| Net income attributable to common stockholders | | $ | 56,919 | | | $ | 69,774 | | | $ | 160,873 | | | $ | 135,302 | |
| Real property depreciation and amortization | | | 43,792 | | | | 42,970 | | | | 172,624 | | | | 166,411 | |
| Noncontrolling interest | | | 10,311 | | | | 14,269 | | | | 30,706 | | | | 28,320 | |
| Gain on disposition of property | | | (36,201 | ) | | | (60,865 | ) | | | (81,205 | ) | | | (80,532 | ) |
| FFO - basic and diluted, as defined by NAREIT | | | 74,821 | | | | 66,148 | | | | 282,998 | | | | 249,501 | |
| Loss from early extinguishment of debt in connection with sale of real estate | | | 366 | | | | 2,157 | | | | 1,782 | | | | 2,157 | |
FFO - basic and diluted (1) | | $ | 75,187 | | | $ | 68,305 | | | $ | 284,780 | | | $ | 251,658 | |
| (1) | Pursuant to the updated guidance for Funds From Operations provided by the Board of Governors of the National Association of Real Estate Investment Trusts ("NAREIT"), FFO is defined as net income (computed in accordance with accounting principles generally accepted in the United States of America ("GAAP")) excluding gains or losses from disposition of property, impairment write-downs of depreciable real estate, noncontrolling interest and extraordinary items plus depreciation from real property. The Company adds back debt extinguishment costs and other one-time costs incurred as a result of repaying property specific debt triggered upon sale of a property. Because of the limitations of the FFO definition as published by NAREIT as set forth above, the Company has made certain interpretations in applying the definition. The Company believes all adjustments not specifically provided for are consistent with the definition. Other similarly titled measures may not be calculated in the same manner. |
Home Properties Reports Fourth Quarter and Full Year 2013 Results
For Immediate Release: February 6, 2014
Page 7 of 8
HOME PROPERTIES, INC.
SUMMARY CONSOLIDATED STATEMENTS OF OPERATIONS
(in thousands, except per share data – Unaudited)
| | | Three Months Ended | | | Year Ended | |
| | | December 31 | | | December 31 | |
| | | 2013 | | | 2012 | | | 2013 | | | 2012 | |
| FFO – basic and diluted | | $ | 75,187 | | | $ | 68,305 | | | $ | 284,780 | | | $ | 251,658 | |
| FFO – basic and diluted | | $ | 75,187 | | | $ | 68,305 | | | $ | 284,780 | | | $ | 251,658 | |
| Acquisition costs of closed deals included in other expenses | | | 264 | | | | 15 | | | | 312 | | | | 2,741 | |
Operating FFO (2) | | $ | 75,451 | | | $ | 68,320 | | | $ | 285,092 | | | $ | 254,399 | |
| FFO – basic and diluted | | $ | 75,187 | | | $ | 68,305 | | | $ | 284,780 | | | $ | 251,658 | |
| Recurring non-revenue generating capital expenses | | | (8,857 | ) | | | (9,163 | ) | | | (35,687 | ) | | | (36,457 | ) |
AFFO (3) | | $ | 66,330 | | | $ | 59,142 | | | $ | 249,093 | | | $ | 215,201 | |
| Operating FFO | | $ | 75,451 | | | $ | 68,320 | | | $ | 285,092 | | | $ | 254,399 | |
| Recurring non-revenue generating capital expenses | | | (8,857 | ) | | | (9,163 | ) | | | (35,687 | ) | | | (36,457 | ) |
Operating AFFO (2) (3) | | $ | 66,594 | | | $ | 59,157 | | | $ | 249,405 | | | $ | 217,942 | |
| Weighted average shares/units outstanding: | | | | | | | | | | | | | | | | |
Shares – basic | | | 56,944.9 | | | | 51,314.0 | | | | 54,328.5 | | | | 49,744.6 | |
Shares – diluted | | | 57,327.9 | | | | 51,920.1 | | | | 54,820.2 | | | | 50,382.6 | |
Shares/units – basic (4) | | | 67,270.3 | | | | 61,829.4 | | | | 64,702.1 | | | | 60,364.7 | |
Shares/units – diluted (4) | | | 67,653.3 | | | | 62,435.6 | | | | 65,193.8 | | | | 61,002.7 | |
| Per share/unit: | | | | | | | | | | | | | | | | |
Net income – basic | | $ | 1.00 | | | $ | 1.36 | | | $ | 2.96 | | | $ | 2.72 | |
Net income – diluted | | $ | 0.99 | | | $ | 1.34 | | | $ | 2.93 | | | $ | 2.69 | |
| FFO – basic | | $ | 1.12 | | | $ | 1.10 | | | $ | 4.40 | | | $ | 4.17 | |
FFO – diluted | | $ | 1.11 | | | $ | 1.09 | | | $ | 4.37 | | | $ | 4.13 | |
Operating FFO (2) | | $ | 1.12 | | | $ | 1.09 | | | $ | 4.37 | | | $ | 4.17 | |
AFFO (3) | | $ | 0.98 | | | $ | 0.95 | | | $ | 3.82 | | | $ | 3.53 | |
Operating AFFO (2) (3) | | $ | 0.98 | | | $ | 0.95 | | | $ | 3.83 | | | $ | 3.57 | |
Common Dividend paid | | $ | 0.70 | | | $ | 0.66 | | | $ | 2.80 | | | $ | 2.64 | |
| (2) | Operating FFO is defined as FFO adjusted for the addback of acquisition costs on closed deals. |
| (3) | Adjusted Funds From Operations ("AFFO") is defined as FFO less an annual reserve for anticipated recurring, non-revenue generating capitalized costs of $848 per apartment unit. The resulting sum is divided by the weighted average shares/units on a diluted basis to arrive at AFFO per share/unit. |
| (4) | Basic includes common stock outstanding plus operating partnership units in Home Properties, L.P., which can be converted into shares of common stock. Diluted includes additional common stock equivalents. |
Home Properties Reports Fourth Quarter and Full Year 2013 Results
For Immediate Release: February 6, 2014
Page 8 of 8
HOME PROPERTIES, INC.
SUMMARY CONSOLIDATED BALANCE SHEETS
(in thousands - Unaudited)
| | | December 31, 2013 | | | December 31, 2012 | |
Land | | $ | 786,868 | | | $ | 791,604 | |
| Construction in progress | | | 187,976 | | | | 83,241 | |
| Buildings, improvements and equipment | | | 4,645,921 | | | | 4,580,381 | |
| | | | 5,620,765 | | | | 5,455,226 | |
| Accumulated depreciation | | | (1,243,243 | ) | | | (1,108,840 | ) |
| Real estate, net | | | 4,377,522 | | | | 4,346,386 | |
| | | | | | | | | |
| Cash and cash equivalents | | | 9,853 | | | | 21,092 | |
| Cash in escrows | | | 23,738 | | | | 26,971 | |
| Accounts receivable | | | 14,937 | | | | 13,406 | |
| Prepaid expenses | | | 22,089 | | | | 19,504 | |
| Deferred charges | | | 11,945 | | | | 13,429 | |
| Other assets | | | 7,793 | | | | 10,704 | |
| Total assets | | $ | 4,467,877 | | | $ | 4,451,492 | |
| Mortgage notes payable | | $ | 1,814,217 | | | $ | 2,165,027 | |
| Unsecured notes payable | | | 450,000 | | | | 450,000 | |
| Unsecured line of credit | | | 193,000 | | | | 162,500 | |
| Accounts payable | | | 27,540 | | | | 22,691 | |
| Accrued interest payable | | | 8,392 | | | | 9,974 | |
| Accrued expenses and other liabilities | | | 33,936 | | | | 33,887 | |
| Security deposits | | | 18,479 | | | | 19,146 | |
| Total liabilities | | | 2,545,564 | | | | 2,863,225 | |
| | | | | | | | | |
| Common stockholders’ equity | | | 1,629,253 | | | | 1,320,968 | |
| Noncontrolling interest | | | 293,060 | | | | 267,299 | |
| Total equity | | | 1,922,313 | | | | 1,588,267 | |
| Total liabilities and equity | | $ | 4,467,877 | | | $ | 4,451,492 | |
| | | | | | | | | |
| Total shares/units outstanding: | | | | | | | | |
| Common stock | | | 56,961.6 | | | | 51,508.1 | |
| Operating partnership units | | | 10,287.2 | | | | 10,455.6 | |
| | | | 67,248.8 | | | | 61,963.7 | |
For further information:
David P. Gardner, Executive Vice President and Chief Financial Officer, (585) 246-4113
Charis W. Warshof, Vice President, Investor Relations, (585) 295-4237
###
For 2013 the Company estimates that the amount of recurring, non-revenue enhancing capital expenditures incurred on an annual basis for a standard garden style apartment will remain unchanged at $848 per apartment unit.
The Company's policy is to capitalize costs related to the acquisition, development, rehabilitation, construction and improvement of properties. Capital improvements are costs that increase the value and extend the useful life of an asset. Ordinary repair and maintenance costs that do not extend the useful life of the asset are expensed as incurred. Costs incurred on a lease turnover due to normal wear and tear by the resident are expensed on the turn. Recurring capital improvements typically include appliances, carpeting and flooring, HVAC equipment, kitchen and bath cabinets, new roofs, site improvements and various exterior building improvements. Non-recurring, revenue generating upgrades include, community centers, new windows, and kitchen and bath apartment upgrades. Revenue generating capital improvements are expected to directly result in increased rental earnings or expense savings. The Company capitalizes interest and certain internal personnel costs related to the communities under rehabilitation and construction.
The table below is a list of the items that management considers recurring, non-revenue enhancing capital and maintenance expenditures for a standard garden style apartment. Included are the per unit replacement cost and the useful life that Management estimates the Company incurs on an annual basis.
| | | | | | | | | | | | Maintenance | | | | |
| | | | | | | | | Capitalized | | | Expense | | | Total | |
| | | Capitalized | | | | | | Expenditure | | | Cost per | | | Cost per | |
| | | Cost per | | | Useful | | | per Unit | | | Unit | | | Unit | |
| Category | | Unit | | | Life(1) | | | per Year(2) | | | per Year(3) | | | per Year | |
| Appliances | | $ | 1,624 | | | | 9 | | | $ | 180 | | | $ | 13 | | | $ | 193 | |
| Blinds, shades | | | 135 | | | | 3 | | | | 45 | | | | 5 | | | | 50 | |
| Carpets, cleaning | | | 760 | | | | 4 | | | | 190 | | | | 142 | | | | 332 | |
Computers, equipment, misc.(4) | | | 120 | | | | 6 | | | | 20 | | | | 2 | | | | 22 | |
| Contract repairs | | | - | | | | - | | | | - | | | | 250 | | | | 250 | |
Exterior painting (5) | | | 84 | | | | 3 | | | | 28 | | | | - | | | | 28 | |
| Flooring | | | 250 | | | | 9 | | | | 28 | | | | 24 | | | | 52 | |
| Furnace, air (HVAC) | | | 854 | | | | 24 | | | | 36 | | | | 24 | | | | 60 | |
| Hot water heater | | | 293 | | | | 7 | | | | 42 | | | | - | | | | 42 | |
| Interior painting | | | - | | | | - | | | | - | | | | 178 | | | | 178 | |
| Kitchen, bath cabinets upgrades | | | 1,200 | | | | 15 | | | | 80 | | | | - | | | | 80 | |
| Landscaping site | | | - | | | | - | | | | - | | | | 120 | | | | 120 | |
| New roof | | | 880 | | | | 24 | | | | 37 | | | | - | | | | 37 | |
| Parking lot site | | | 750 | | | | 15 | | | | 50 | | | | - | | | | 50 | |
| Pool, exercise facility | | | 147 | | | | 15 | | | | 10 | | | | 38 | | | | 48 | |
| Windows major | | | 1,663 | | | | 20 | | | | 83 | | | | - | | | | 83 | |
Miscellaneous (6) | | | 326 | | | | 17 | | | | 19 | | | | - | | | | 19 | |
| Total | | $ | 9,086 | | | | | | | $ | 848 | | | $ | 796 | | | $ | 1,644 | |
| (1) | Estimated weighted average actual physical useful life of the expenditure capitalized. |
| (2) | This amount is not necessarily incurred each and every year. Some years will be higher, or lower depending on the timing of certain longer life expenditures. |
| (3) | These expenses are included in the Operating and Maintenance line item of the Consolidated Statement of Operations. Maintenance labor costs are not included in the $796 per unit estimate. All personnel costs for site supervision, leasing agents, and maintenance staff are combined and disclosed in the Company's Core Properties expense detail schedule. |
| (4) | Includes computers, office equipment, furniture, and maintenance vehicles. |
| (5) | The level of exterior painting may be lower than other similarly titled presentations as the Company's portfolio has a significant amount of brick exteriors. In addition, the other exposed surfaces are most often covered in aluminum or vinyl. |
| (6) | Includes items such as balconies, siding, and concrete sidewalks. |
The breakdown of costs above reflects the Company's unique strategies to improve every property every year regardless of age, and to purchase older properties and rehabilitate and reposition them to enhance internal rates of return. These strategies result in higher costs of capital expenditures and maintenance costs which permit the Company to realize higher revenue growth, higher net operating income growth and a higher rate of property appreciation.
Capital Expenditure Summary
The Company estimates that on an annual basis $848 per unit is spent on recurring capital expenditures in 2013. During the three months ended December 31, 2013 approximately $212 per unit was spent on recurring capital expenditures. For the twelve months ended December 31, 2013 approximately $848 per unit was spent on recurring capital expenditures. The table below summarizes the actual total capital improvements incurred by major categories and an estimate of the breakdown of total capital improvements by major categories between recurring, and non-recurring revenue generating capital improvements for the three and twelve months ended December 31, 2013 as follows:
| For the three months ended December 31, 2013 | |
| ($ in thousands, except per unit data) | |
| | | | | | | | | | | | | | | | | | | |
| | | | | | | | | Non- | | | | | | Total | | | | |
| | | Recurring | | | | | | Recurring | | | | | | Capital | | | | |
| | | Capex | | | Per Unit(a) | | | Capex | | | Per Unit(a) | | | Improvements | | | Per Unit(a) | |
| New buildings | | $ | - | | | $ | - | | | $ | 125 | | | $ | 3 | | | $ | 125 | | | $ | 3 | |
| Major building improvements | | | 1,319 | | | | 33 | | | | 5,458 | | | | 135 | | | | 6,777 | | | | 168 | |
| Roof replacements | | | 375 | | | | 9 | | | | 615 | | | | 15 | | | | 990 | | | | 24 | |
| Site improvements | | | 609 | | | | 15 | | | | 3,359 | | | | 83 | | | | 3,968 | | | | 98 | |
| Apartment upgrades | | | 1,314 | | | | 33 | | | | 10,484 | | | | 258 | | | | 11,798 | | | | 291 | |
| Appliances | | | 1,780 | | | | 44 | | | | - | | | | - | | | | 1,780 | | | | 44 | |
| Carpeting/flooring | | | 2,211 | | | | 54 | | | | 1,729 | | | | 43 | | | | 3,940 | | | | 97 | |
| HVAC/mechanicals | | | 791 | | | | 19 | | | | 4,787 | | | | 118 | | | | 5,578 | | | | 137 | |
| Miscellaneous | | | 203 | | | | 5 | | | | 205 | | | | 5 | | | | 408 | | | | 10 | |
| Total | | $ | 8,602 | | | $ | 212 | | | $ | 26,762 | | | $ | 660 | | | $ | 35,364 | | | $ | 872 | |
| (a) | Calculated using the weighted average number of units owned, including 38,440 core units, 2012 acquisition units of 2,018, and 2013 acquisition units of 119 for the three months ended December 31, 2013. |
| For the twelve months ended December 31, 2013 | |
| ($ in thousands, except per unit data) | |
| | | | | | | | | | | | | | | | | | | |
| | | | | | | | | Non- | | | | | | Total | | | | |
| | | Recurring | | | | | | Recurring | | | | | | Capital | | | | |
| | | Capex | | | Per Unit(a) | | | Capex | | | Per Unit(a) | | | Improvements | | | Per Unit(a) | |
| New Buildings | | $ | - | | | $ | - | | | $ | 404 | | | $ | 10 | | | $ | 404 | | | $ | 10 | |
| Major building improvements | | | 5,263 | | | | 130 | | | | 19,440 | | | | 480 | | | | 24,703 | | | | 610 | |
| Roof replacements | | | 1,498 | | | | 37 | | | | 2,596 | | | | 64 | | | | 4,094 | | | | 101 | |
| Site improvements | | | 2,429 | | | | 60 | | | | 11,640 | | | | 287 | | | | 14,069 | | | | 347 | |
| Apartment upgrades | | | 5,514 | | | | 136 | | | | 37,165 | | | | 918 | | | | 42,679 | | | | 1,054 | |
| Appliances | | | 6,835 | | | | 169 | | | | 37 | | | | 1 | | | | 6,872 | | | | 170 | |
| Carpeting/flooring | | | 8,826 | | | | 218 | | | | 5,482 | | | | 135 | | | | 14,308 | | | | 353 | |
| HVAC/mechanicals | | | 3,158 | | | | 78 | | | | 16,393 | | | | 405 | | | | 19,551 | | | | 483 | |
| Miscellaneous | | | 810 | | | | 20 | | | | 2,517 | | | | 62 | | | | 3,327 | | | | 82 | |
| Total | | $ | 34,333 | | | $ | 848 | | | $ | 95,674 | | | $ | 2,362 | | | $ | 130,007 | | | $ | 3,210 | |
| (a) | Calculated using the weighted average number of units owned, including 38,440 core units, 2012 acquisition units of 2,018, and 2013 acquisition units of 30 for the twelve months ended December 31, 2013. |
Capital Expenditure Summary (continued)
The schedule below summarizes the breakdown of total capital improvements between core and non-core as follows:
| For the three months ended December 31, 2013 | |
| ($ in thousands, except per unit data) | |
| | | | | | | | | | | | | | | | | | | |
| | | | | | | | | Non- | | | | | | Total | | | | |
| | | Recurring | | | | | | Recurring | | | | | | Capital | | | | |
| | | Capex | | | Per Unit(a) | | | Capex | | | Per Unit(a) | | | Improvements | | | Per Unit(a) | |
| Core Communities | | $ | 8,163 | | | $ | 212 | | | $ | 24,139 | | | $ | 628 | | | $ | 32,302 | | | $ | 840 | |
| 2013 Acquisition Communities | | | 11 | | | | 92 | | | | - | | | | - | | | | 11 | | | | 92 | |
| 2012 Acquisition Communities | | | 428 | | | | 212 | | | | 2,623 | | | | 1,300 | | | | 3,051 | | | | 1,512 | |
| Subtotal | | | 8,602 | | | | 212 | | | | 26,762 | | | | 660 | | | | 35,364 | | | | 872 | |
| 2013 Disposed Communities | | | 5 | | | | 87 | | | | 0 | | | | 2 | | | | 5 | | | | 89 | |
| 2012 Disposed Communities | | | - | | | | - | | | | - | | | | - | | | | - | | | | - | |
Corporate office expenditures (b) | | | - | | | | - | | | | - | | | | - | | | | 323 | | | | - | |
| Total | | $ | 8,607 | | | $ | 212 | | | $ | 26,762 | | | $ | 659 | | | $ | 35,692 | | | $ | 870 | |
| (a) | Calculated using the weighted average number of units owned, including 38,440 core units, 2012 acquisition units of 2,018, 2013 acquisition units of 119, and 2013 disposed units of 56 for the three months ended December 31, 2013. |
| (b) | No distinction is made between recurring and non-recurring expenditures for corporate office. Corporate office expenditures includes principally computer hardware, software, office furniture, fixtures and leasehold improvements. Corporate office expenditures are excluded from per unit figures. |
| For the twelve months ended December 31, 2013 | |
| ($ in thousands, except per unit data) | |
| | | | | | | | | | | | | | | | | | | |
| | | | | | | | | Non- | | | | | | Total | | | | |
| | | Recurring | | | | | | Recurring | | | | | | Capital | | | | |
| | | Cap Ex | | | Per Unit(a) | | | Cap Ex | | | Per Unit(a) | | | Improvements | | | Per Unit(a) | |
| Core Communities | | $ | 32,611 | | | $ | 848 | | | $ | 88,533 | | | $ | 2,303 | | | $ | 121,144 | | | $ | 3,151 | |
| 2013 Acquisition Communities | | | 11 | | | | 367 | | | | - | | | | - | | | | 11 | | | | 367 | |
| 2012 Acquisition Communities | | | 1,711 | | | | 848 | | | | 7,141 | | | | 3,539 | | | | 8,852 | | | | 4,387 | |
| Sub-total | | | 34,333 | | | | 848 | | | | 95,674 | | | | 2,362 | | | | 130,007 | | | | 3,210 | |
| 2013 Disposed Communities | | | 369 | | | | 848 | | | | 13 | | | | 29 | | | | 382 | | | | 877 | |
| 2012 Disposed Communities | | | - | | | | - | | | | - | | | | - | | | | - | | | | - | |
Corporate office expenditures (b) | | | - | | | | - | | | | - | | | | - | | | | 2,153 | | | | - | |
| Total | | $ | 34,702 | | | $ | 848 | | | $ | 95,687 | | | $ | 2,338 | | | $ | 132,542 | | | $ | 3,186 | |
| (a) | Calculated using the weighted average number of units owned, including 38,440 core units, 2012 acquisition units of 2,018, 2013 acquisition units of 30, and 2013 disposed units of 435 for the twelve months ended December 31, 2013. |
| (b) | No distinction is made between recurring and non-recurring expenditures for corporate office. Corporate office expenditures includes principally computer hardware, software, office furniture, fixtures and leasehold improvements. Corporate office expenditures are excluded from per unit figures. |
| Adjusted Net Operating Income - Core Properties | |
| ($ in thousands) | | | | | | | | | |
| | | Quarter | | | Quarter | | | | |
| | | 12/31/2013 | | | 12/31/2012 | | | Change | |
| Net Operating Income | | $ | 99,206 | | | $ | 96,148 | | | | 3.2 | % |
| Less: Non-recurring Capex @ 6% | | | (1,448 | ) | | | - | | | | - | |
| Adjusted Net Operating Income | | $ | 97,758 | | | $ | 96,148 | | | | 1.7 | % |
Some of our Core Property NOI reflects incremental investments in the communities above and beyond normal capital replacements. After charging ourselves a 6% cost of debt capital on these additional expenditures, what we refer to as the adjusted NOI for the quarter is recalculated and presented above.
| |
| ($ in thousands) | | | | | | | | | | | | | | | | | | | | | | | | | | | | | | | |
| | | | | | | | | | | | | | | | | | | | | | | | | | | | | | | % | |
| | | | Units | | | | | | Cost | | | Costs | | | | | | | | | | | | % | | | % | | | Physical | |
| | Property | | when | | | Cost | | | Estimate | | | Incurred | | | | | | Initial | | | Date | | | Complete | | | Leased | | | Occup | |
| | Type | | Complete | | | Estimate | | | Per Unit | | | | (1) | | | Start | | | Occup | | | Complete | | | | (2) | | | | (3) | | | | (4) | |
| Under construction: | | | | | | | | | | | | | | | | | | | | | | | | | | | | | | | | | | | |
| Eleven55 Ripley | Mid-Rise and | | | 379 | | | $ | 111,000 | | | $ | 293 | | | $ | 97,171 | | | 4Q 11 | | | 4Q 13 | | | 1H 14 | | | | 57.0 | % | | | 14.8 | % | | | 6.6 | % |
| Silver Spring, MD | High-Rise | | | | | | | | | | | | | | | | | | | | | | | | | | | | | | | | | | | | | |
| | | | | | | | | | | | | | | | | | | | | | | | | | | | | | | | | | | | | | | |
Courts at Spring Mill Station | Donut/Podium | | | 385 | | | | 89,000 | | | | 231 | | | | 42,504 | | | 2Q 12 | | | 2Q 14 | | | 2H 14 | | | | 0.0 | % | | | n/a | | | | n/a | |
| Conshohocken, PA | | | | | | | | | | | | | | | | | | | | | | | | | | | | | | | | | | | | | | |
| | | | | | | | | | | | | | | | | | | | | | | | | | | | | | | | | | | | | | | |
| Pre-construction: | | | | | | | | | | | | | | | | | | | | | | | | | | | | | | | | | | | | | | |
| Concorde Circle | Garden | | �� | 300 | + | | tbd | | | tbd | | | | 14,642 | | | tbd | | | tbd | | | tbd | | | | n/a | | | | n/a | | | | n/a | |
| Linthicum, MD | | | | | | | | | | | | | | | | | | | | | | | | | | | | | | | | | | | | | | |
| | | | | | | | | | | | | | | | | | | | | | | | | | | | | | | | | | | | | | | |
Westpark Tysons (part of Arbor Row | Mid-Rise and | | | 694 | | | | 232,000 | | | | 334 | | | | 33,659 | | | 2014 | | | tbd | | | tbd | | | | n/a | | | | n/a | | | | n/a | |
| final development plan) | High-Rise | | | | | | | | | | | | | | | | | | | | | | | | | | | | | | | | | | | | | |
| Tysons Corner, VA | | | | | | | | | | | | | | | | | | | | | | | | | | | | | | | | | | | | | | |
| | | | | | | | | | | | | | | | | | | | | | | | | | | | | | | | | | | | | | | |
| Total | | | | | | | | | | | | | | | $ | 187,976 | | | | | | | | | | | | | | | | | | | | | | |
| (1) | Classified as Construction in Progress at December 31, 2013. |
| (2) | Represents the percentage of units that have been completed and are available to rent as of February 5, 2014. |
| (3) | Represents the percentage of units that have been leased as of February 5, 2014. |
| (4) | Represents the percentage of units occupied as of February 5, 2014. |
| | | | | | | | | | | | | | | | | | |
| | | | | | First | | | Second | | | Third | | | Fourth | | | | |
| | | | | | Quarter | | | Quarter | | | Quarter | | | Quarter | | | Year | |
| 2014 compared to 2013 | | | | | | | | | | | | | | | | | | |
| | | | | | | | | | | | | | | | | | | |
FFO per share - 2014 guidance | | | | | $ | 1.02 - $1.06 | | | Information for subsequent quarters will be provided in future earnings press releases | | | $ | 4.44 to $4.60 | |
| | | | | | | | | | | | |
| Midpoint of guidance | | | | | $ | 1.04 | | | $ | 4.52 | |
| | | | | | | | | | | | | | | | | | | | | |
FFO per share - 2013 actual | | | | | $ | 1.053 | | | $ | 1.113 | | | $ | 1.086 | | | $ | 1.111 | | | $ | 4.368 | |
| | | | | | | | | | | | | | | | | | | | | | | | |
| Projected improvement | | | | | | -1.2 | % | | | | | | | | | | | | | | | 3.5 | % |
| | | | | | | | | | | | | | | | | | | | | | | | |
| | | | | | | | | | | | | | | | | | | | | | | | |
| 2014 compared to 2013 based on "Operating FFO" - OFFO | | | | | | | | | | | | | | | | | | | | | |
| | | | | | | | | | | | | | | | | | | | | | | | |
OFFO per share - 2014 guidance | | | | | $ | 1.02 - $1.06 | | | Information for subsequent quarters will be provided in future earnings press releases | | | $ | 4.45 to $4.61 | |
| | | | | | | | | | | | |
| Midpoint of guidance | | | | | $ | 1.04 | | | $ | 4.53 | |
| | | | | | | | | | | | | | | | | | | | | | | | |
OFFO per share - 2013 actual | | | | | $ | 1.053 | | | $ | 1.113 | | | $ | 1.087 | | | $ | 1.115 | | | $ | 4.373 | |
| | | | | | | | | | | | | | | | | | | | | | | | |
| Actual/projected improvement | | | | | | -1.2 | % | | | | | | | | | | | | | | | 3.6 | % |
| | | | | | | | | | | | | | | | | | | | | | | | |
| The difference between FFO and OFFO is expensed acquisition costs. | | | | | | | | | | | | | | | | | | | | | |
| 2014 Earnings Guidance | | | | | | | | | | | | | | | | | | | | | | | |
| | | | | | First | | | Second | | | Third | | | Fourth | | | | | |
| | | | | | Quarter | | | Quarter | | | Quarter | | | Quarter | | | Year | |
| | | | | | | | | | | | | | | | | | | | | | | | |
| Core Property Assumptions: | | | | | | | | | | | | | | | | | | | | | | | |
| | | | | | | | | | | | | | | | | | | | | | | | |
| Total revenue growth | | | | | | 2.5 | % | | Information for subsequent quarters will be provided in future earnings press releases | | | 2.6% to 3.6% | |
| | | | | | | | | | | | |
| Expense growth | | | | | | 3.5 | % | | 3.0% to 4.0% | |
| | | | | | | | | | | | | | | | | | | | | | | | |
| NOI growth | | | | | | 1.7 | % | | | | | | | | | | | | | | 2.5% to 3.5% | |
| | | | | | | | | | | | | | | | | | | | | | | | |
In 2013, weighted average rent was up 3.2% and economic occupancy was down 0.1%, producing 3.1% base rental growth. Other income slightly increased, resulting in 3.2% growth in total revenue. | |
| | | | | | | | | | | | | | | | | | | | | | | | |
In 2014, we expect weighted average rent will be up 3.0%, with economic occupancy up 0.2%, producing 3.2% base rental growth, 10 basis points greater than 2013. Other income growth rate is expected to be less than 3.0%, resulting in 3.1% growth in total revenue at the midpoint of guidance. | |
| | | | | | | | | | | | | | | | | | | | | | | | |
| After four consecutive years of negative expense growth (2009 - 2012) , in 2013 we experienced only a slight increase of 1.8%. We expect pressure on certain line items in 2014 resulting in Operating and Maintenance expenses projected to go up 3.0% to 4.0%. Some of the line items where we expect above average increases include: personnel costs (specifically from health care and the effects of new regulations) up 5.2%; real estate taxes up 5.6%; and property insurance up 7%. | |
| | | | | | | | | | | | | | | | | | | | | | | | |
| Core Occupancy Assumptions: | | | | | | | | | | | | | | | | | | | | | | | |
| | | | | | | | | | | | | | | | | | | | | | | | |
2014 physical occupancy | | | | | | 94.9 | % | | Information for subsequent quarters will be provided in future earnings press releases | | | | 95.3 | % |
| | | | | | | | | | | | |
2013 physical occupancy | | | | | | 95.5 | % | | | 95.2 | % |
| | | | | | | | | | | | | | | | | | | | | | | | |
| Change in occupancy | | | | | | -0.6 | % | | | | | | | | | | | | | | | 0.1 | % |
| 2014 Earnings Guidance | | | | | | | | | | | | | | | | | | | | | | | |
| | | | | | | | | | | | | | | | | | | | | | | | |
| Annual growth by region: | | 2013 | | | | 2013 | | | 2014 Same Store Growth Projection | | | | | |
| | | % | | | Total | | | Total | | | | | | | | | | | | | |
| | | of Units | | | Revenue | | | Revenue | | | Expenses | | | NOI | | | | | |
| Boston | | | 8.6 | % | | | 4.4 | % | | | 3.3 | % | | | 2.3 | % | | | 3.9 | % | | | | |
| Florida | | | 2.2 | % | | | 4.9 | % | | | 4.4 | % | | | 5.0 | % | | | 3.8 | % | | | | |
| Philadelphia | | | 12.8 | % | | | 3.3 | % | | | 3.4 | % | | | 2.9 | % | | | 3.8 | % | | | | |
| Washington, DC | | | 27.4 | % | | | 2.5 | % | | | 3.1 | % | | | 2.9 | % | | | 3.2 | % | | | | |
| Baltimore | | | 23.7 | % | | | 2.9 | % | | | 3.2 | % | | | 4.1 | % | | | 2.7 | % | | | | |
| Chicago | | | 6.7 | % | | | 3.9 | % | | | 2.6 | % | | | 2.7 | % | | | 2.5 | % | | | | |
| New Jersey/Long Island | | | 18.6 | % | | | 3.5 | % | | | 2.9 | % | | | 4.8 | % | | | 1.7 | % | | | | |
| Total | | | 100.0 | % | | | 3.2 | % | | | 3.1 | % | | | 3.5 | % | | | 3.0 | % | | | | |
| | | | | | | | | | | | | | | | | | | | | | | | | |
Expense growth rates assumed for the midpoint of guidance for every expense category are as follows: | |
| | | | | | | | | | | | | | | | | | | | | | | | | |
| | | | | | | % of Total | | | | | | | % Increase | | | | | | | | | |
| | | | | | | Expenses | | | | | | | Over 2013 | | | | | | | | | |
| Electricity | | | | | | | 3.4 | % | | | | | | | 1.1 | % | | | | | | | | |
| Natural gas heating costs | | | | | | | 5.6 | % | | | | | | | -3.4 | % | | | | | | | | |
| Water and sewer | | | | | | | 8.1 | % | | | | | | | 3.4 | % | | | | | | | | |
| Repairs and maintenance | | | | | | | 14.2 | % | | | | | | | 4.0 | % | | | | | | | | |
| Total personnel costs | | | | | | | 23.6 | % | | | | | | | 5.2 | % | | | | | | | | |
| Real estate taxes | | | | | | | 27.4 | % | | | | | | | 5.6 | % | | | | | | | | |
| Property insurance | | | | | | | 2.9 | % | | | | | | | 7.0 | % | | | | | | | | |
| Advertising | | | | | | | 2.2 | % | | | | | | | 3.4 | % | | | | | | | | |
| Legal & Professional | | | | | | | 0.5 | % | | | | | | | -38.2 | % | | | | | | | | |
| Office & telephone | | | | | | | 2.8 | % | | | | | | | 4.0 | % | | | | | | | | |
| Snow removal | | | | | | | 0.5 | % | | | | | | | -0.4 | % | | | | | | | | |
| Trash | | | | | | | 1.6 | % | | | | | | | 3.0 | % | | | | | | | | |
| Property management G & A | | | | | | | 7.2 | % | | | | | | | 0.7 | % | | | | | | | | |
| | | | | | | | 100.0 | % | | | | | | | 3.5 | % | | | | | | | | |
| 2014 Earnings Guidance | | | | | | | | | | | | | | | | | | | | | | | | |
| | |
General & Administrative costs are expected to decrease 2.4% at the midpoint and range between $27.4 million and $28.2 million. The first two quarters are when we anticipate normal equity grants, pushing the dollar amount up higher in comparison to the year as a whole as significant amounts of equity grants are immediately expensed, based on retirement eligilibility status, versus written off over the vesting period. We expect the first quarter to range from $9.3 million to $9.5 million, and the second quarter to range from $7.0 million to $7.2 million. The third and fourth quarters settle back down to a range of $5.6 million to $5.8 million and $5.5 million to $5.7 million, respectively. | |
| | | | | | | | | | | | | | | | | | | | | | | | | |
Interest Expense is projected to be $101.9 million to $102.7 million for the year, without significant differences between the quarters. | |
| | | | | | | | | | | | | | | | | | | | | | | | | |
| | | | | | | First | | | Second | | | Third | | | Fourth | | | | | |
| | | | | | | Quarter | | | Quarter | | | Quarter | | | Quarter | | | Year | |
| Development NOI 2014 projected run rate | | | $ | 25K | | | $ | 425K | | | $ | 975K | | | $ | 1,475K | | | $ | 2,900K | |
| (includes both Eleven55 Ripley and Courts at Spring Mill) | | | | | | | | | | | | | | | | | | | | | |
| | | | | | | | | | | | | | | | | | | | | | | | | |
Acquisition range of $150 million to $250 million. | | | $ | 0 | | | $ | 100M | | | $ | 50M | | | $ | 50M | | | $ | 200M | |
| | | | | | | | | | | | | | | | | | | | | | | | | |
Disposition range of $160 million to $260 million | | | $ | 110M | | | $ | 0 | | | $ | 50M | | | $ | 50M | | | $ | 210M | |
| | | | | | | | | | | | | | | | | | | | | | | | | |
Anticipated expense from acquisition costs for 2014 of $0.9 million versus actual of $0.3 million in 2013. | |
| | | | | | | | | | | | | | | | | | | | | | | | | |
Development spend of $60 million. | | | | | | | | | | | | | | | | | | | | | | | | |
| | | | | | | | | | | | | | | | | | | | | | | | | |
| Capital expenditures: | | | | | | | | | | | | | | | | | | | | | | | | |
| Recurring | | | | | | $35 million | | | | | | | | | | | | | | | | | |
| Upgrading and repositioning | | | | | | $100 million | | | | | | | | | | | | | | | | | |
Page 38