
Exhibit 99.1 Fiscal Q2 Summary & Introduction Justin Roberts VP Corporate Finance & Treasurer
Forward Looking Statements & Non-GAAP Financial Measures This presentation and the accompanying oral presentation contain forward-looking statements, including statements that are not purely statements of historical fact. The Greenbrier Companies, Inc. (the “Company,” “we,” “us” or “our”) uses words, and variations of words, such as “assure,” “approach,” “believe,” “create,” “commitment,” “continue,” “dedicate,” “drive,” “expect,” “focus,” “goal,” “invest,” “often,” “opportunity,” “outlook,” “provide,” “position,” “potential,” “reduce,” “require,” “role,” “should,” “strategic,” “strengthen,” “trend,” “will” and similar expressions to identify forward-looking statements. These forward-looking statements include, without limitation, statements about backlog and other orders, railcar deliveries, expectations for operating segments, environmental, social and governance commitments, financing, future liquidity, revenue, cash flow, strategic initiatives, partnerships, tax treatment, and other information regarding future performance and strategies and appear throughout this presentation. These forward-looking statements are not guarantees of future performance and are subject to certain risks, uncertainties and important factors that could cause actual results to differ materially from the results contemplated by the forward-looking statements. Such risks, uncertainties and important factors that might cause such a difference include, but are not limited to, the following: an economic downturn and economic uncertainty; inflation (including rising energy prices, interest rates, wages and other escalators) and policy reactions thereto (including actions by central banks); disruptions in the supply of materials and components used in the production of our products; the war in Ukraine and related events, and the COVID-19 pandemic, variants thereof, governmental reaction thereto, and related economic disruptions (including, among other factors, operations and supply disruptions and labor shortages). Our backlog of railcar units and other orders not included in backlog are not necessarily indicative of future results of operations. Certain orders in backlog are subject to customary documentation which may not occur. There may be other factors that may cause our actual results to differ materially from the forward-looking statements, including the risks, uncertainties and factors described in more detail in the Company’s filings with the SEC, including in the “Risk Factors” and “Management’s Discussion and Analysis of Financial Condition and Results of Operations” sections of the Company’s most recently filed Annual Report on Form 10-K. Except as otherwise required by law, the Company assumes no obligation to update any forward-looking statements or information, which speak as of their respective dates. Readers are cautioned not to place undue reliance on these forward-looking statements, which reflect management’s opinions only as of the date hereof. This presentation includes certain financial measures that were not prepared in accordance with generally accepted accounting principles (GAAP) because we believe they help investors understand our performance. Adjusted EBITDA and Adjusted diluted earnings per share (EPS) are not financial measures under GAAP. These metrics are performance measurement tools used by rail supply companies and Greenbrier. You should not consider these metrics in isolation or as a substitute for other financial statement data determined in accordance with GAAP. In addition, because these metrics are not a measure of financial performance under GAAP and are susceptible to varying calculations, the measures presented may differ from and may not be comparable to similarly titled measures used by other companies. We define Adjusted EBITDA as Net earnings (loss) before Interest and foreign exchange, Income tax benefit (expense), Depreciation and amortization and the impact associated with items we do not believe are indicative of our core business or which affect comparability. We believe the presentation of Adjusted EBITDA provides useful information as it excludes the impact of financing, foreign exchange, income taxes and the accounting effects of capital spending and other items. These items may vary for different companies for reasons unrelated to the overall operating performance of a company’s core business. We believe this assists in comparing our performance across reporting periods. Reconciliations of GAAP financial measures to Non-GAAP financial measures are contained in this presentation and on our website at gbrx.com under “Investors”. 2
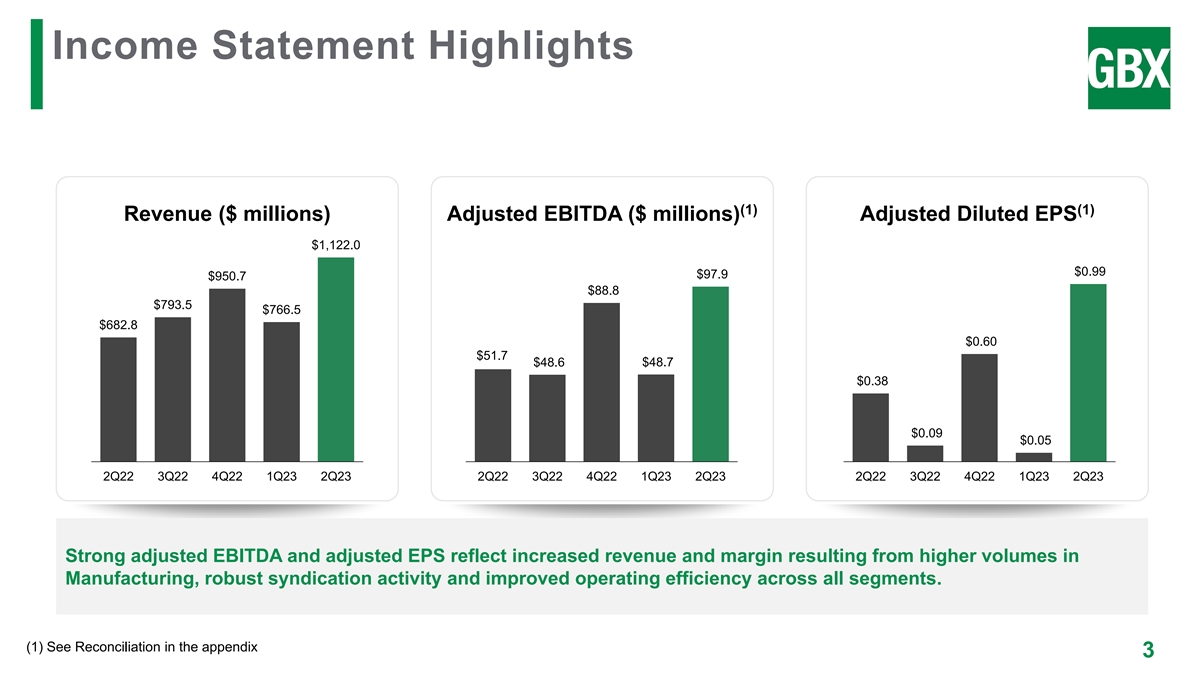
Income Statement Highlights (1) (1) Revenue ($ millions) Adjusted EBITDA ($ millions) Adjusted Diluted EPS $1,122.0 $0.99 $97.9 $950.7 $88.8 $793.5 $766.5 $682.8 $0.60 $51.7 $48.6 $48.7 $0.38 $0.09 $0.05 2Q22 3Q22 4Q22 1Q23 2Q23 2Q22 3Q22 4Q22 1Q23 2Q23 2Q22 3Q22 4Q22 1Q23 2Q23 Strong adjusted EBITDA and adjusted EPS reflect increased revenue and margin resulting from higher volumes in Manufacturing, robust syndication activity and improved operating efficiency across all segments. (1) See Reconciliation in the appendix 3

Key Operational Metrics (1) (1) Backlog Deliveries Syndicated Deliveries 2,200 32,100 7,600 30,900 29,500 28,300 25,900 5,800 5,200 1,400 4,800 4,800 1,300 800 300 2Q22 3Q22 4Q22 1Q23 2Q23 2Q22 3Q22 4Q22 1Q23 2Q23 2Q22 3Q22 4Q22 1Q23 2Q23 Record quarter for deliveries at 7,600 units and orders of 4,500 railcars valued at $580 million received during Q2 FY23 contribute to $3.1 billion backlog. (1) Results include syndicated deliveries and Greenbrier-Maxion, our Brazilian railcar manufacturer, which is accounted for under the equity method 4
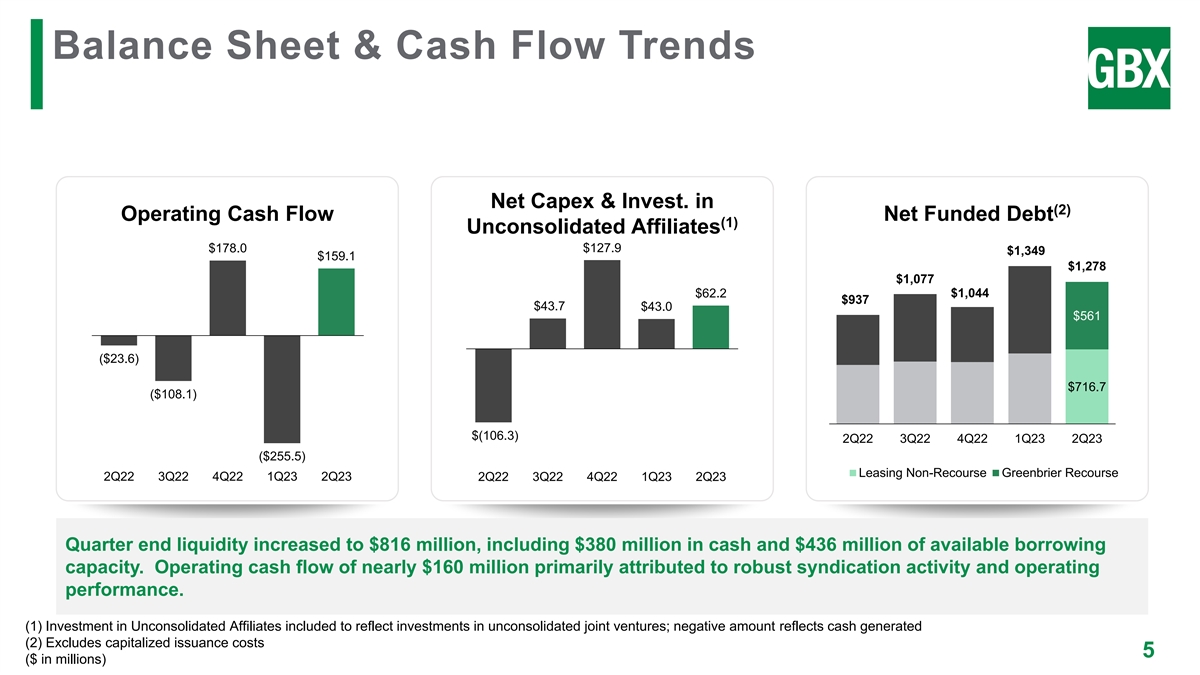
Balance Sheet & Cash Flow Trends Net Capex & Invest. in (2) Operating Cash Flow Net Funded Debt (1) Unconsolidated Affiliates $178.0 $127.9 $1,349 $159.1 $1,278 $1,077 $62.2 $1,044 $937 $43.7 $43.0 $561 ($23.6) $716.7 ($108.1) $(106.3) 2Q22 3Q22 4Q22 1Q23 2Q23 ($255.5) Leasing Non-Recourse Greenbrier Recourse 2Q22 3Q22 4Q22 1Q23 2Q23 2Q22 3Q22 4Q22 1Q23 2Q23 Quarter end liquidity increased to $816 million, including $380 million in cash and $436 million of available borrowing capacity. Operating cash flow of nearly $160 million primarily attributed to robust syndication activity and operating performance. (1) Investment in Unconsolidated Affiliates included to reflect investments in unconsolidated joint ventures; negative amount reflects cash generated (2) Excludes capitalized issuance costs 5 ($ in millions)

Agenda 9:00 Introduction – Justin Roberts, VP Corporate Finance & Treasurer 9:10 Strategic Overview – Lorie Tekorius, CEO & President 9:35 North American Manufacturing – Bill Krueger, President, Greenbrier Manufacturing Operations 9:50 European Manufacturing – William Glenn, Chair of The Management Board – Greenbrier Astra Rail 10:05 Q&A 10:20 Break 10:35 Services – Brian Comstock, Chief Commercial & Leasing Officer 10:55 Q&A 11:15 Financial Overview – Adrian Downes, CFO 11:25 Closing Remarks – Lorie Tekorius 11:30 Q&A 12:00 Conclusion 6

Management at Investor Day Adrian Downes Brian Conn Laurie Dornan Lorie Tekorius Bill Krueger William Glenn Brian Comstock Sr. Managing Director SVP, Chief Human CEO & President President, Greenbrier SVP, Chief EVP, Chief Chair of the Management Structured Financial Resources Officer Manufacturing Financial Officer Commercial & Board, Greenbrier Astra Products Operations Leasing Officer Rail B.V. Jack Isselmann Justin Roberts Rick Galvan Larry Stanley Kari Wagner Dan Weiler SVP, External VP, Corporate SVP, Finance VP, Commercial SVP & Group SVP, Greenbrier Affairs & Finance & Treasurer Strategy Leader, GMS Rail Services Greenbrier Leasing Communications Company 7

Evolving an Established Industry Leader Lorie Tekorius Chief Executive Officer & President
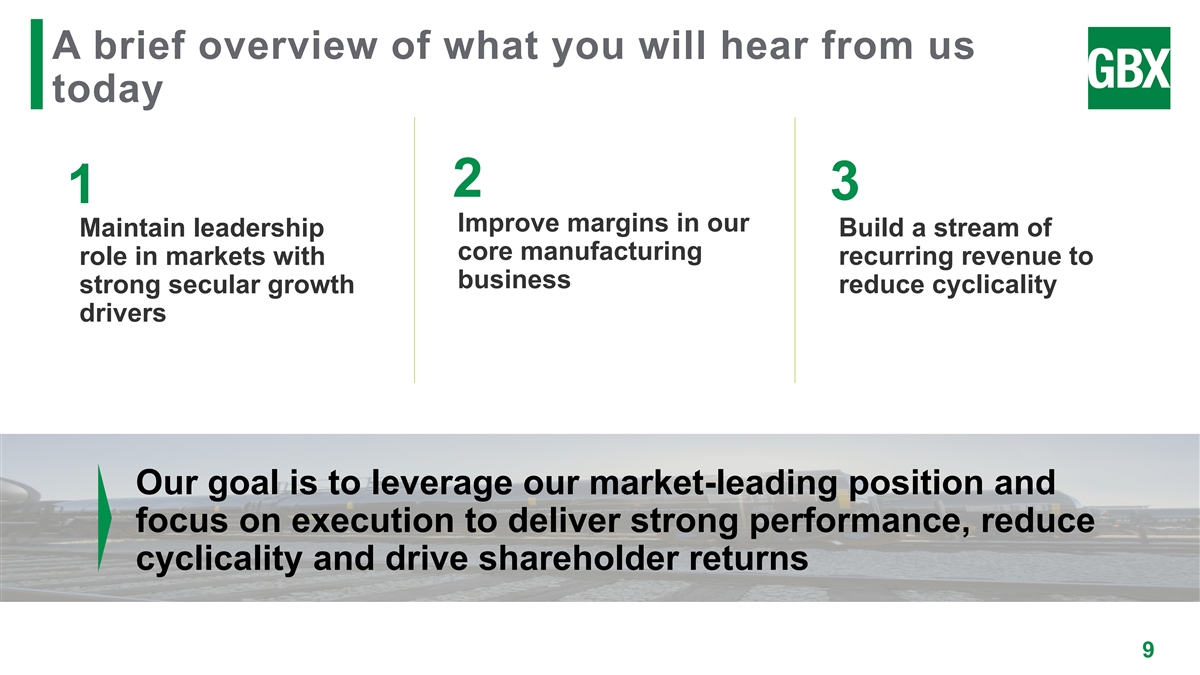
A brief overview of what you will hear from us today 2 3 1 Improve margins in our Maintain leadership Build a stream of core manufacturing role in markets with recurring revenue to business strong secular growth reduce cyclicality drivers Our goal is to leverage our market-leading position and focus on execution to deliver strong performance, reduce cyclicality and drive shareholder returns 9

An Established Industry Leader Distinctive Footprint & Operating Model The Continuing Evolution of Greenbrier

The Greenbrier Companies is a leading railcar manufacturer and lessor Annual railcar Railcars in lease ~33,000 ~12,300 production capacity fleet Revenue visibility Strong financially Recurring revenue available $3.1bn backlog ~$815mn 35% growth liquidity 11 Note: Figures as of February 28, 2023
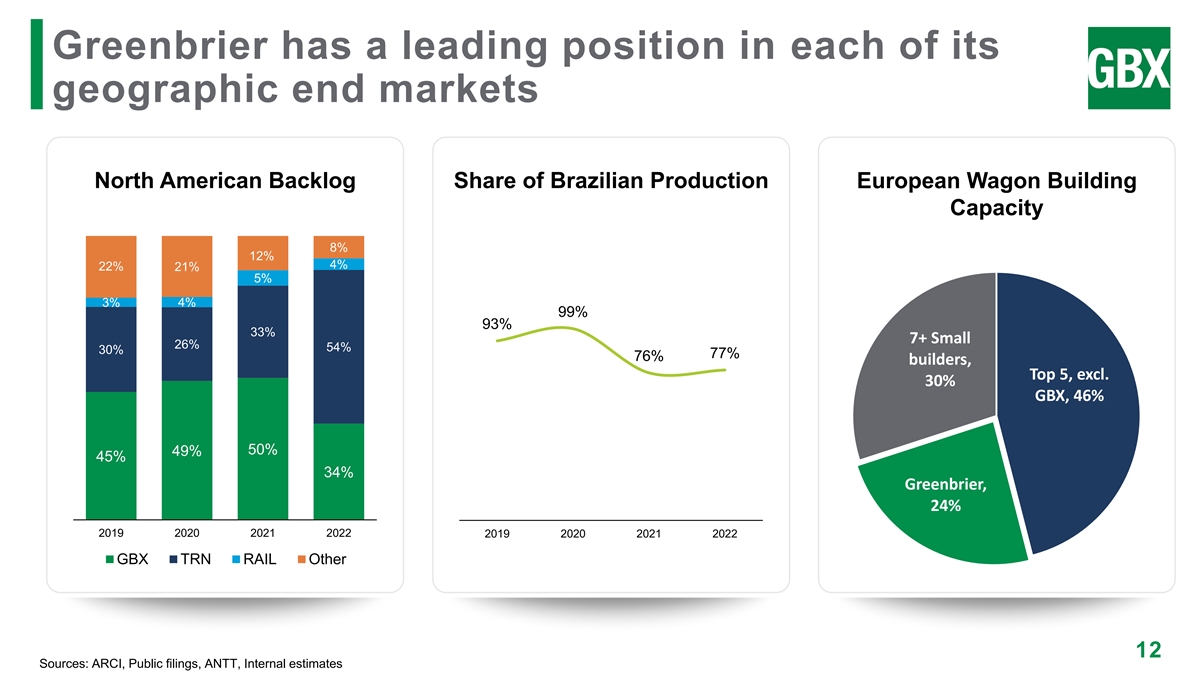
Greenbrier has a leading position in each of its geographic end markets North American Backlog Share of Brazilian Production European Wagon Building Capacity 8% 12% 4% 22% 21% 5% 4% 3% 99% 93% 33% 7+ Small 26% 54% 30% 77% 76% builders, Top 5, excl. 30% GBX, 46% 50% 49% 45% 34% Greenbrier, 24% 2019 2020 2021 2022 2019 2020 2021 2022 GBX TRN RAIL Other 12 Sources: ARCI, Public filings, ANTT, Internal estimates
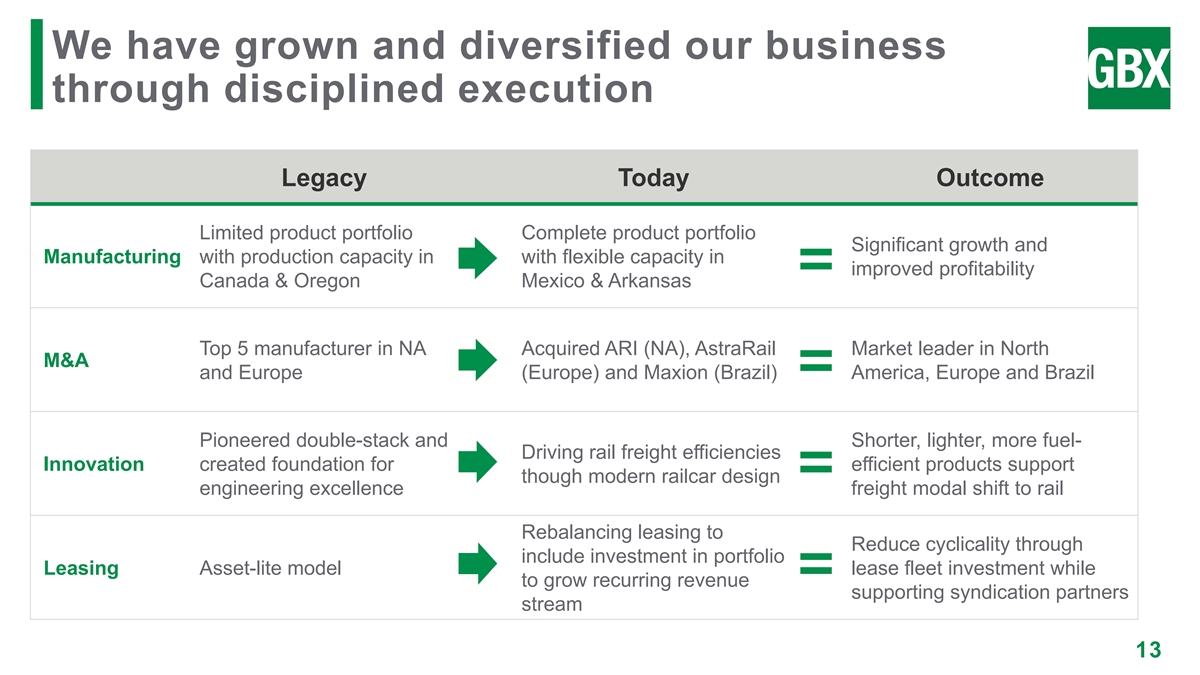
We have grown and diversified our business through disciplined execution Legacy Today Outcome Limited product portfolio Complete product portfolio Significant growth and Manufacturing with production capacity in with flexible capacity in improved profitability Canada & Oregon Mexico & Arkansas Top 5 manufacturer in NA Acquired ARI (NA), AstraRail Market leader in North M&A and Europe (Europe) and Maxion (Brazil) America, Europe and Brazil Pioneered double-stack and Shorter, lighter, more fuel- Driving rail freight efficiencies Innovation created foundation for efficient products support though modern railcar design engineering excellence freight modal shift to rail Rebalancing leasing to Reduce cyclicality through include investment in portfolio Leasing Asset-lite model lease fleet investment while to grow recurring revenue supporting syndication partners stream 13

We have significantly increased our addressable market through M&A and JVs Greenbrier Addressable Market August 2016 October 2016 May 2017 19.5% stake in Amsted- Formation of Increased stake to 60% stake Maxion Hortolandia Greenbrier ASTRA Rail in Greenbrier-Maxion (rebranded Greenbrier- Maxion) +400% August 2018 July 2019 February 2021 68% stake in Rayvag Acquisition of ARI Formed GBX Leasing Legacy Current North America Europe Brazil 14

Our manufacturing capabilities have expanded dramatically over the last decade NA Industry Legacy Today Backlog Conventional Covered Hoppers 26,079 Specialty Conventional Tank Cars 14,207 Specialty Box Cars Railcar Portfolio 8,234 Gondolas 5,916 Flat Cars 4,715 Open-Top Hoppers 547 Hopper Car Outlets Tank Car Valves & Heads Vertical Hatch Covers Components Running Boards Steel, Alloy & Aluminum Casting 15 Note: Backlog figures as of December 31, 2022

ARI sold mainly to operating lessors & leased much of its production to shippers 16

We are an established railcar lessor with scalable presence and potential for significant growth FOUNDATION OF A PREMIER RAILCAR LESSOR 17
An Established Industry Leader Distinctive Footprint & Operating Model The Continuing Evolution of Greenbrier

An industry leader on three continents with a strategic operational footprint ✓ Scaled in our end markets ✓ Close to our customers ✓ Aligned with trend towards onshoring 19

Delivering value to our customers throughout railcar life cycle Produce virtually all Greenbrier has a fleet of (1) types of railcars for the ~12,300 railcars in North American, North America, covering Railcar Railcar European and Brazilian numerous car types Manufacturing Leasing markets. which serve multiple market segments. Decades of delivering One of North America’s seamless services and most comprehensive solutions throughout railcar management the lifecycle of a railcar solutions provider. We Maintenance Railcar (2) to allow owners and manage ~450,000 Services Management shippers to focus on railcars and customers core business activities. include Class I railroads and leading shippers. (1) As of February 28, 2023 20 (2) As of March 31, 2023

We are driven by our values and commitments we have made to our stakeholders 2022 ESG Report highlights: • Advances ESG strategy which is built on a five- pillar foundation based on 2021’s materiality assessment • Focuses on pillars of Safety & Quality, People, Environmental Sustainability, Governance & Ethics and Communities • Outlines new goals and targets and highlights key achievements, showcasing progress from the last fiscal year • Prepared in accordance with the Sustainability Accounting Standards Board (SASB) Industrial Machinery & Goods standard and in partial alignment with Task Force on Climate-Related Financial Disclosures (TCFD) Greenbrier is on track to achieve all established ESG goals, which can be found on page four of the 2022 ESG Report 21

We strive to be the standard setter in the freight transportation industry 22

Force multipliers shaping our business LEASE CAPITAL AFTERMARKET PRODUCT HUMAN CAPITAL POLICY ORIGINATION MARKETS SERVICE INNOVATION MANAGEMENT ADVOCACY One of the Access to Long track record Highly skilled Engaged Broad largest lease premier asset- of delivering workforce at advocate to aftermarket originators in based financial innovative strategically protect and service network the industry investors solutions located facilities promote rail freight 23
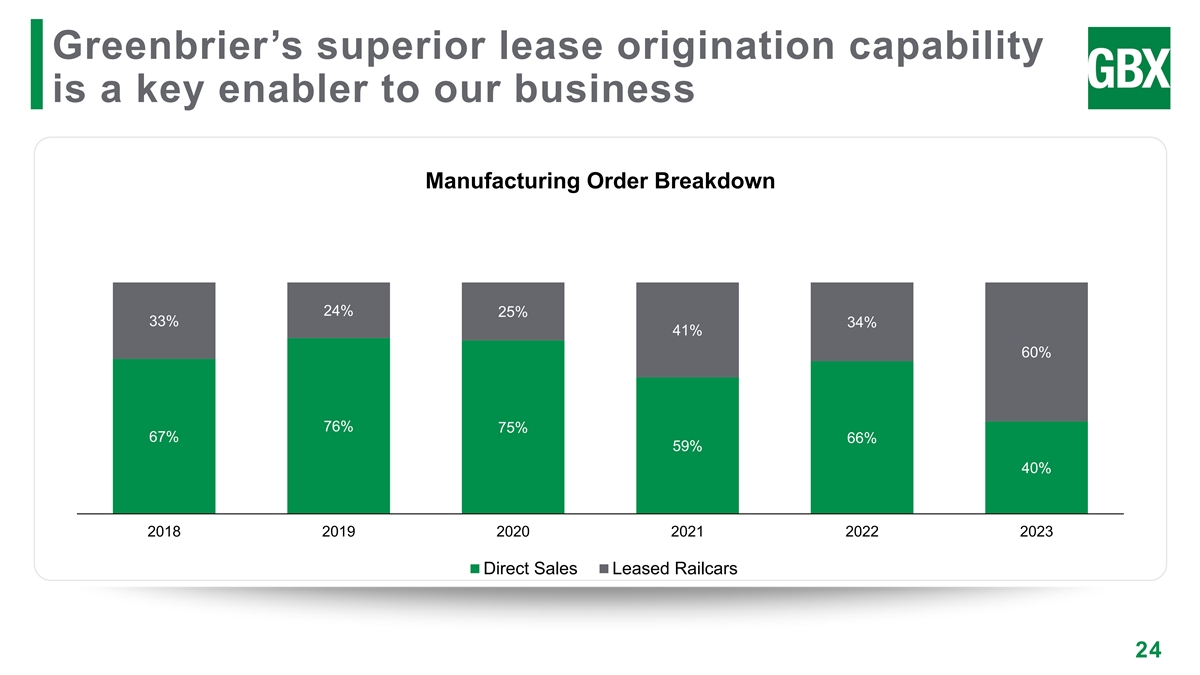
Greenbrier’s superior lease origination capability is a key enabler to our business Manufacturing Order Breakdown 24% 25% 33% 34% 41% 60% 76% 75% 67% 66% 59% 40% 2018 2019 2020 2021 2022 2023 Direct Sales Leased Railcars 24

Since FY18, we have syndicated +18,500 railcars and generated over $2.2 billion in proceeds Syndication Revenue ($ millions) Syndication Benefits • Allows for continuous and enhanced commercial engagement with the rail market’s customer base $617 $580 • Extends the relationship between end user $511 customers (the lessees) within Greenbrier’s global ecosystem $367 – Syndicated railcars are typically managed by $253 Greenbrier Management Services over their $193 useful lives, generating recurring revenue • Diversifies credit and equipment risk 2018 2019 2020 2021 2022 LTM • Generates significant liquidity for Greenbrier 2/28/23 25

Maintenance services network provides strategic services to railcar owners 20 Production Facilities 491,000 maintenance hours annually 310,000 wheelsets and 90,000 axles annually 42,000 parts/units annually 26

Leveraging our expertise for railcar refurbishments & sustainable conversions Promotes conservation and production efficiency Environmentally friendly and reduces waste Cost-savings for owners looking to diversify and optimize their fleets Covered Hopper Auto Carrier Tank Car 27

Long track record of manufacturing innovation to meet our customers’ needs 28

Robust engineering presence supports global manufacturing footprint Europe North America South America 51 engineers 47 engineers 20 engineers Global Industry Oversight Representation on 35+ industry committees governing railroad and rail 586 yrs. of experience 663 yrs. of experience 261 yrs. of experience equipment safety (11.5 yrs. average) (14 yrs. average) (13 yrs. Average) 29

Greenbrier’s Human Capital Management integrates with our broader objectives Safety Incident 1.09 Rate 100% DART Rate .95 Employee Resource Groups 72% 95% Participation Rate of DEI Training at U.S. Employee Engagement Production Sites Survey Completion Rate 7 30 * Source: Association of American Railroads * Source: Association of American Railroads
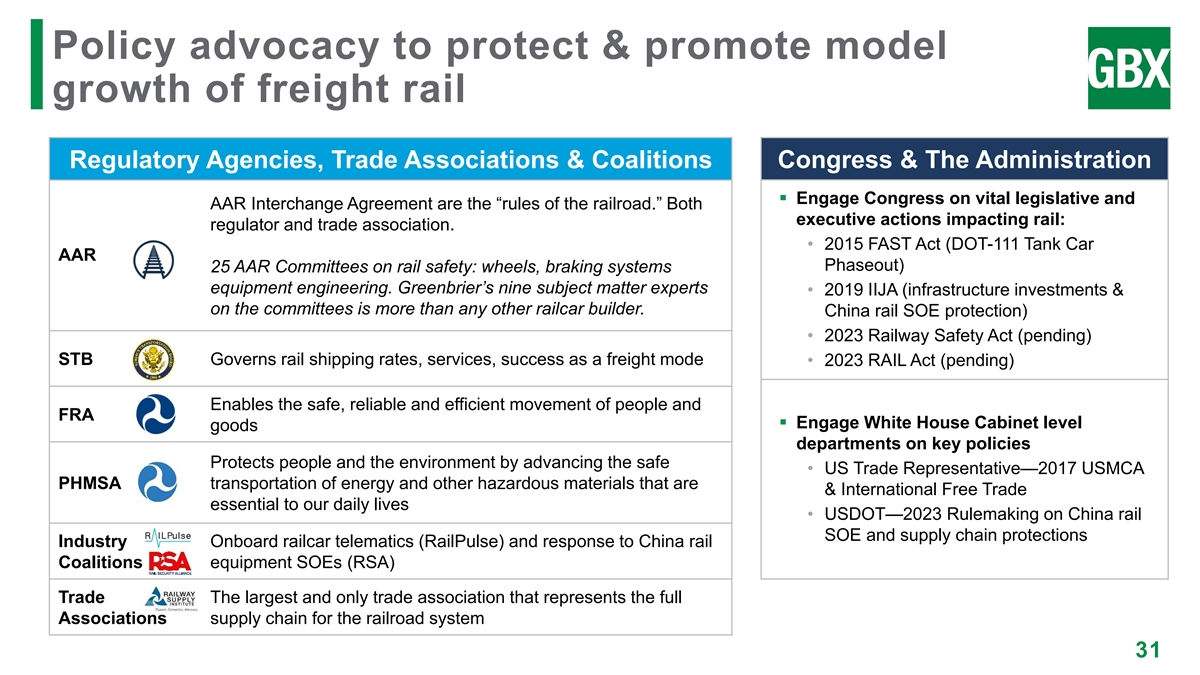
Policy advocacy to protect & promote model growth of freight rail Regulatory Agencies, Trade Associations & Coalitions Congress & The Administration ▪ Engage Congress on vital legislative and AAR Interchange Agreement are the “rules of the railroad.” Both executive actions impacting rail: regulator and trade association. • 2015 FAST Act (DOT-111 Tank Car AAR Phaseout) 25 AAR Committees on rail safety: wheels, braking systems equipment engineering. Greenbrier’s nine subject matter experts • 2019 IIJA (infrastructure investments & on the committees is more than any other railcar builder. China rail SOE protection) • 2023 Railway Safety Act (pending) STB Governs rail shipping rates, services, success as a freight mode • 2023 RAIL Act (pending) Enables the safe, reliable and efficient movement of people and FRA ▪ Engage White House Cabinet level goods departments on key policies Protects people and the environment by advancing the safe • US Trade Representative—2017 USMCA PHMSA transportation of energy and other hazardous materials that are & International Free Trade essential to our daily lives • USDOT—2023 Rulemaking on China rail SOE and supply chain protections Industry Onboard railcar telematics (RailPulse) and response to China rail Coalitions equipment SOEs (RSA) Trade The largest and only trade association that represents the full Associations supply chain for the railroad system 31

An Established Industry Leader Distinctive Footprint & Operating Model The Continuing Evolution of Greenbrier

Our Vision At Greenbrier, we deliver customer value through an integrated portfolio of freight rail transportation products and related services that provide shareholders superior returns across economic cycles. 33
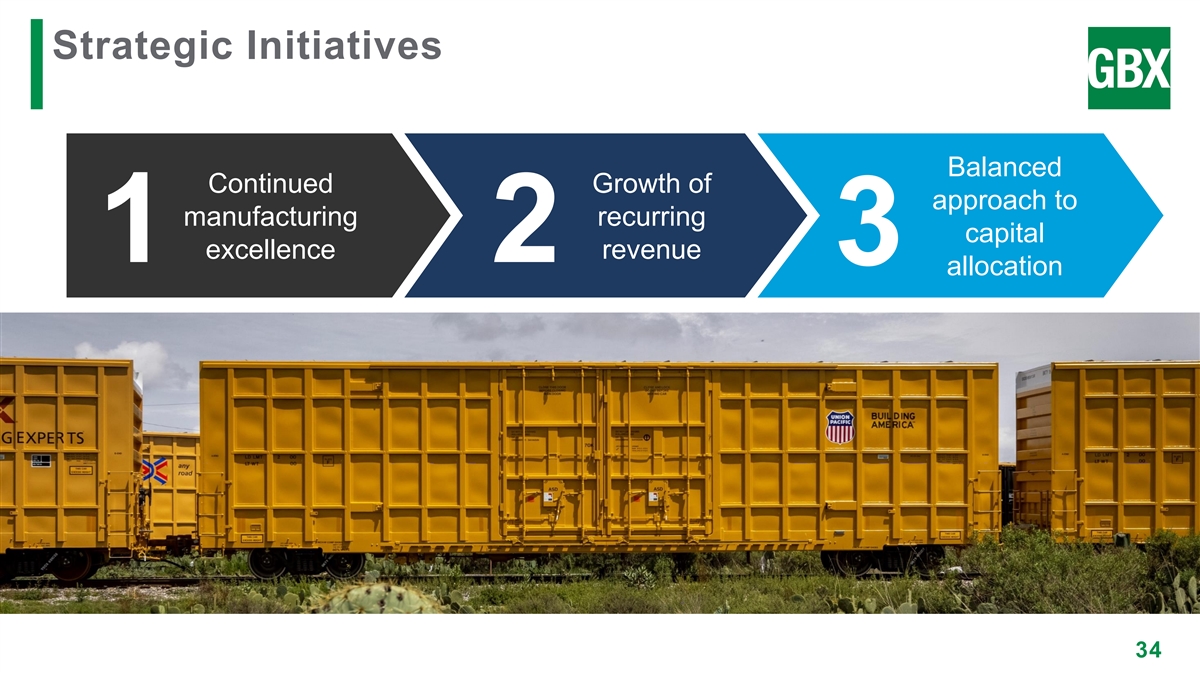
Strategic Initiatives Balanced Continued Growth of approach to manufacturing recurring capital excellence revenue 1 2 3 allocation 34

Clear steps are being taken to improve manufacturing margins in North America and Europe Action North America Europe Capacity rationalization Cost optimization Additional manufacturing efficiencies Leverage purchasing economics Streamline & simplify product range Systems upgrades Transfer best practices 35

We are focused on growth in segments that drive aggregate gross margins Contribution of non-Manufacturing Activities to Consolidated Margin 6.3% 4.4% 4.3% 4.0% 3.9% 3.2% 2018 2019 2020 2021 2022 LTM 2/28/23 36
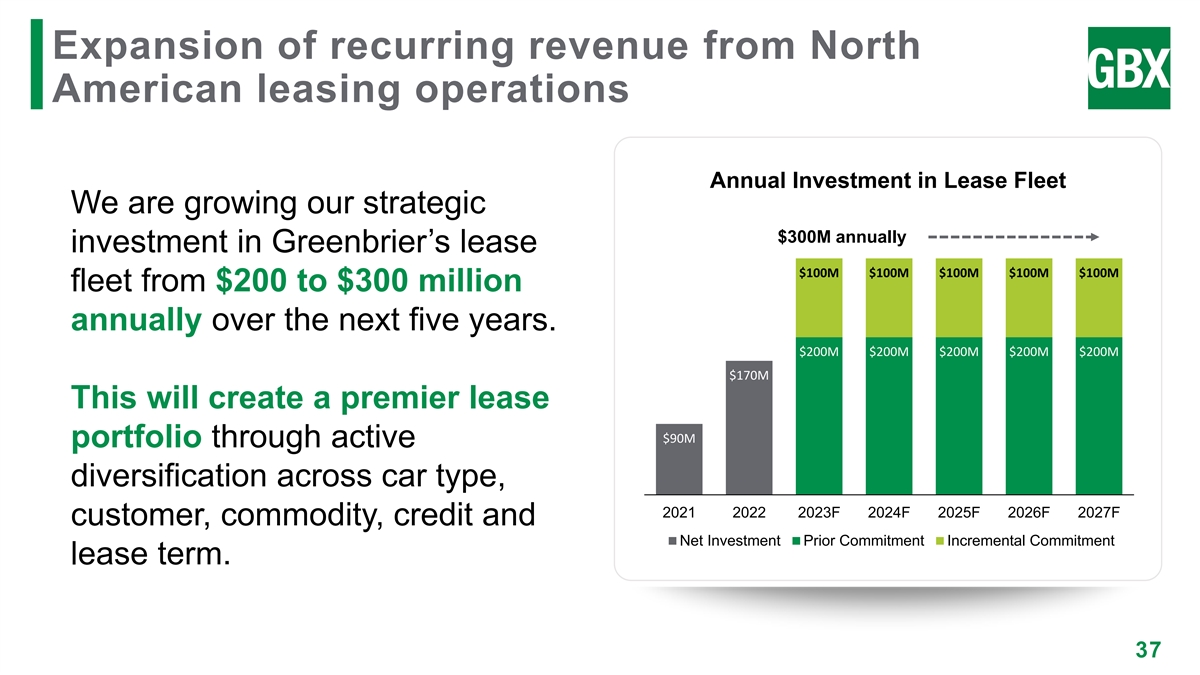
Expansion of recurring revenue from North American leasing operations Annual Investment in Lease Fleet We are growing our strategic $300M annually investment in Greenbrier’s lease $100M $100M $100M $100M $100M fleet from $200 to $300 million annually over the next five years. $200M $200M $200M $200M $200M $170M This will create a premier lease $90M portfolio through active diversification across car type, 2021 2022 2023F 2024F 2025F 2026F 2027F customer, commodity, credit and Net Investment Prior Commitment Incremental Commitment lease term. 37
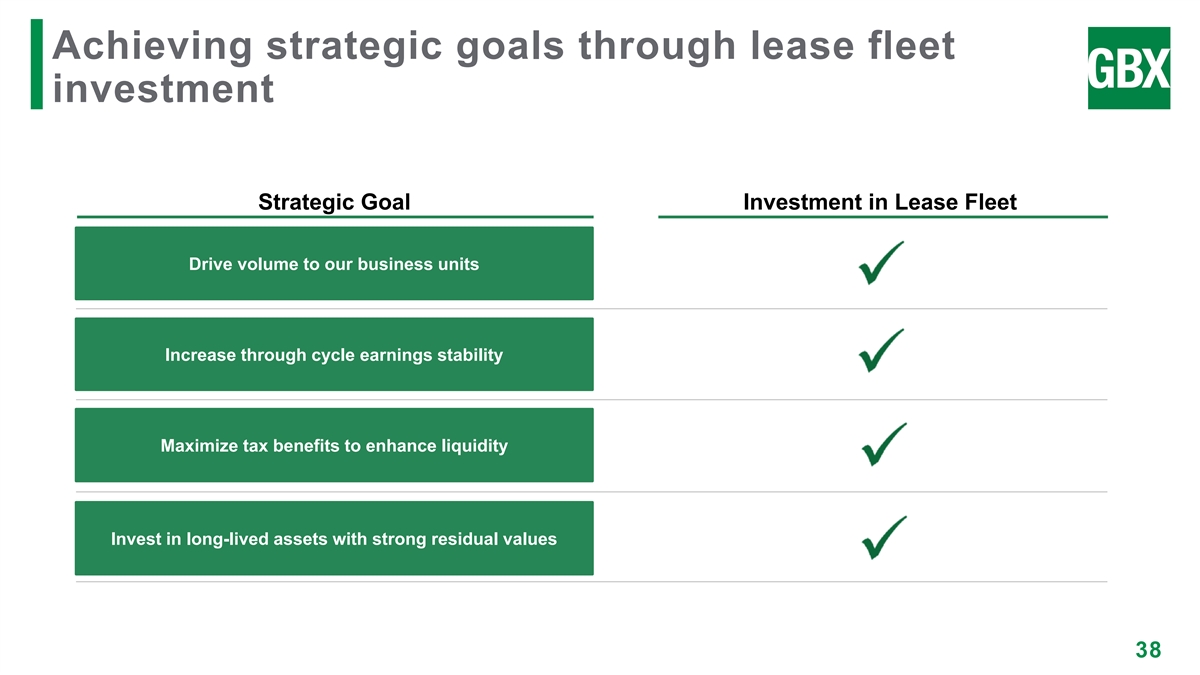
Achieving strategic goals through lease fleet investment Strategic Goal Investment in Lease Fleet Drive volume to our business units Increase through cycle earnings stability Maximize tax benefits to enhance liquidity Invest in long-lived assets with strong residual values 38

Disciplined approach to capital allocation • Preserve strong liquidity position Maintain Strong • Structure debt facilities to align with 1 Balance Sheet business • Investing in our long-term lease fleet to Drive Through Cycle increase recurring revenue and smooth 2 Earnings cyclicality • Continued dividend growth over time Return Capital to 3 Shareholders • Repurchase shares opportunistically 39
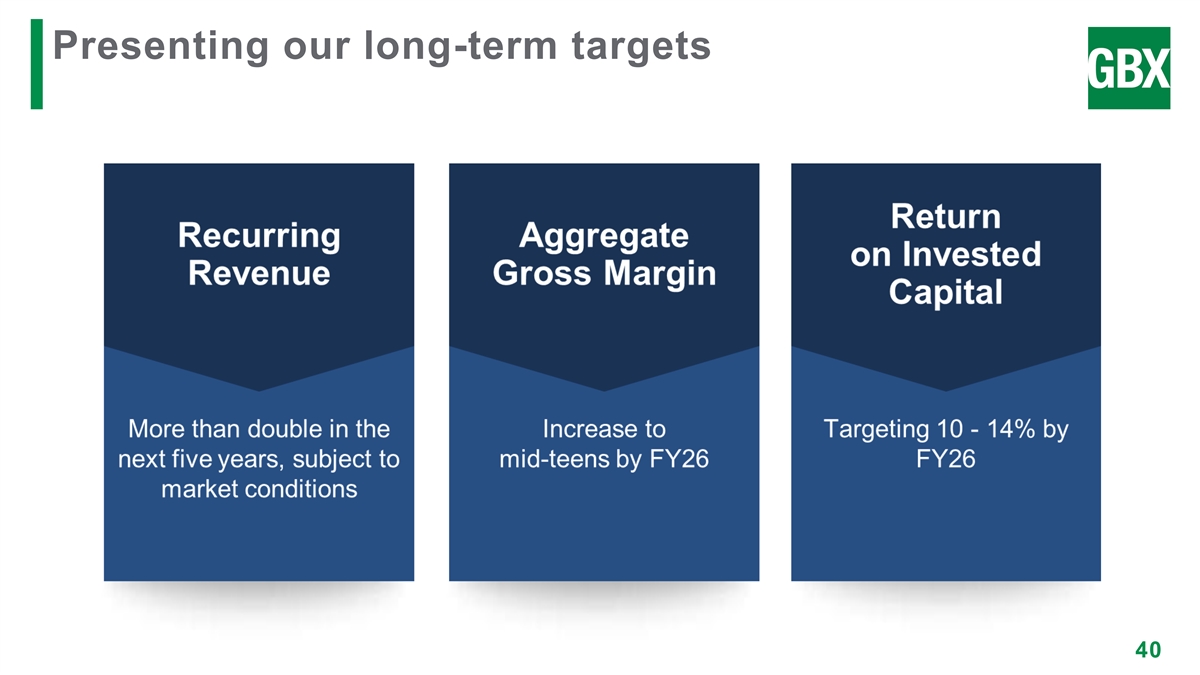
Presenting our long-term targets 40
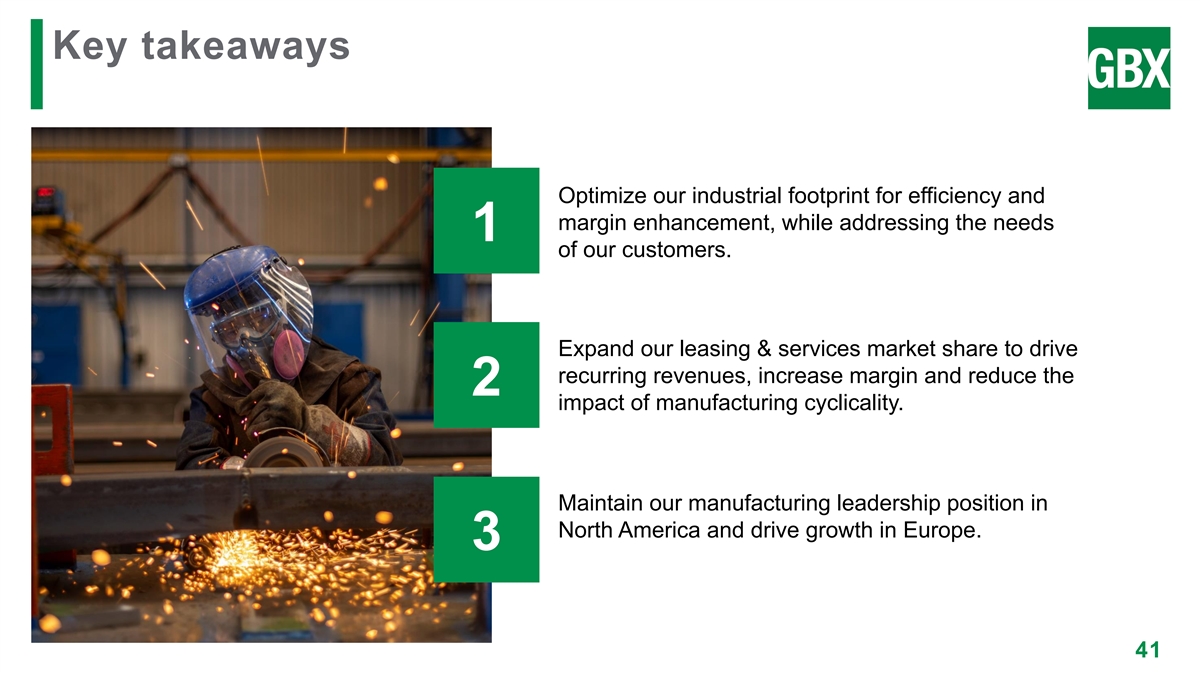
Key takeaways Optimize our industrial footprint for efficiency and margin enhancement, while addressing the needs 1 of our customers. Expand our leasing & services market share to drive recurring revenues, increase margin and reduce the 2 impact of manufacturing cyclicality. Maintain our manufacturing leadership position in North America and drive growth in Europe. 3 41
Pursuing Excellence in North America Bill Krueger President, Greenbrier Manufacturing Operations

Leading Position & Supportive Backdrop Effectively Managing Production Capacity Optimizing Production to Enhance Profitability

Greenbrier has maintained a significant share of North American new railcar orders North American New Railcar Orders 9% 11% 12% 13% 13% 17% 2% 21% 22% 24% 25% 7% 5% 6% 32% 9% 5% 5% 4% 3% 5% 3% 38% 27% 45% 60% 41% 49% 43% 37% 35% 33% 34% 5% 7% 7% 15% 16% 7% 13% 47% 45% 38% 32% 29% 29% 28% 24% 22% 21% 19% 2012 2013 2014 2015 2016 2017 2018 2019 2020 2021 2022 GBX ARI TRN FCA OTHER 44 Source: ARCI (as of December 31, 2022); public company filings

Consolidation has shifted the competitive landscape and reduced capacity Backlog Market Share 19 Active Production Plants in 2000 11 Active Production Plans Today 8% 8% 5% 4% 7% 25% 54% 18% 10% 12% 34% 15% 2022 2000 45 GBX ARI NSC Thrall TRN UTLX Other RAIL

Greenbrier has a leadership position across all major product types Description GBX RAIL TRN NSC UTLX Auto Rack Boxcar Refrigerated Flatcar Covered Hopper Gondola Intermodal Open-Top Hopper Tank Car 46 Primary Position Secondary Position

Diverse manufacturing capabilities are vital as our customer requirements change North American Railcar Deliveries 2011 2012 2013 2014 2015 2016 2017 2018 2019 2020 2021 2022 Tank Cars Covered Hoppers Gondolas Boxcars Flat Cars Open-Top Hoppers 47 Source: ARCI

Greenbrier North American manufacturing has transformed over the last decade ~10+ Years Ago Now Outcomes Expanding into hoppers Reducing production costs High-quality, premium and tanks from intermodal in a rapidly changing supply product that is cost Focus and forest product railcars chain environment competitive Lower cost footprint with Building facilities in Flexible footprint that can U.S. presence to Mexico that are lower effectively build all railcar Footprint safeguard against cost with flexible footprint types political / country risk Ability to efficiently adjust Capacity constrained by Balancing capacity and production rates while Capacity existing locations and flexibility with ensuring maintaining capability to labor availability labor stability build all car types 48

Long track record of manufacturing innovation to meet our customers’ needs Solving customer problems is in Greenbrier’s DNA Tsunami Double-stack Tank Car of Hatch™ Intermodal the Future & Tsunami Well (DOT 117) Gate™ Multi-Max™ & Virtual Sample High-Strength Multi-Max Railcar™ Steel Plus™ Gondola™ 49

Railcar demand is expected to approximate replacement demand over the next several years North American Railcar Deliveries 49,465 42,500 40,950 40,735 40,575 36,750 33,417 29,280 2020 2021 2022 2023F 2024F 2025F 2026F 2027F Tanks Covered Hoppers Other Conversions 50 Source: FTR, RSI, GBX Marketing February 2023 | NOTE: conversions estimated, as FTR does not forecast this activity
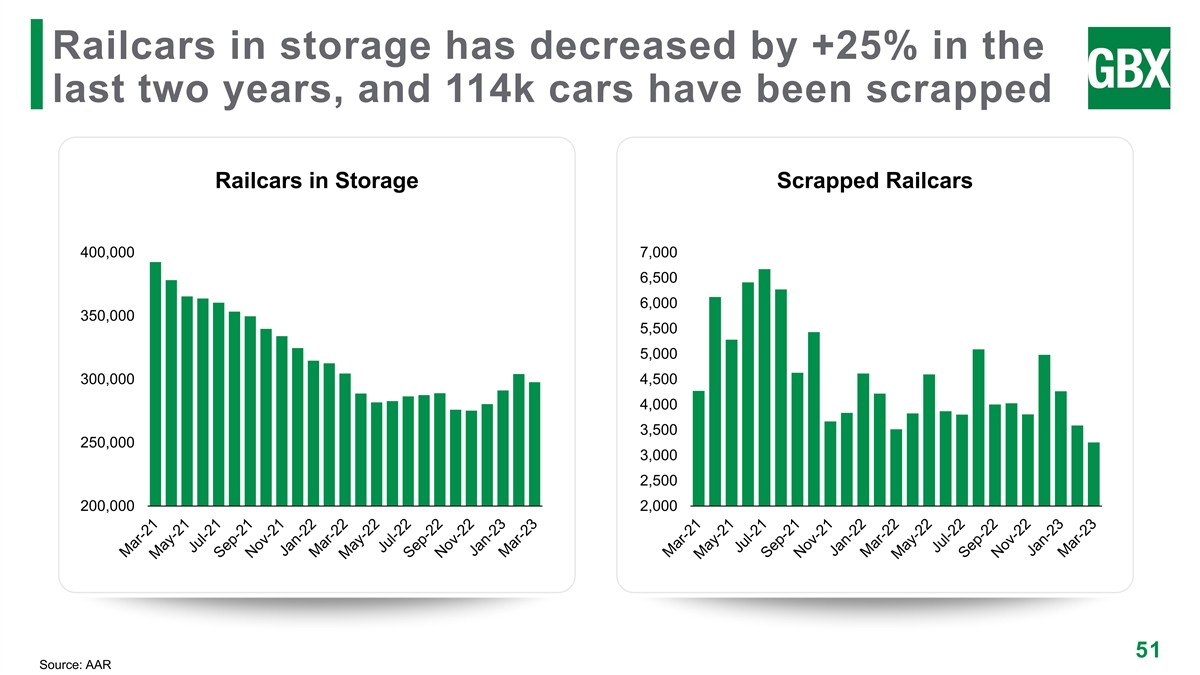
Railcars in storage has decreased by +25% in the last two years, and 114k cars have been scrapped Railcars in Storage Scrapped Railcars 400,000 7,000 6,500 6,000 350,000 5,500 5,000 300,000 4,500 4,000 3,500 250,000 3,000 2,500 200,000 2,000 51 Source: AAR

Leading Position & Supportive Backdrop Effectively Managing Production Capacity Optimizing Production to Enhance Profitability

Railcar backlog has historically provided strong visibility into capacity requirements Greenbrier New Railcar Backlog $5.0 $160 $4.5 $160 $4.7 $4.0 $160 $3.5 $159 $3.5 $3.0 $3.3 $3.3 $3.2 $3.1 $2.5 $159 $2.8 $2.8 $2.7 $2.0 $2.4 $159 $1.5 $159 $1.5 $1.0 $1.2 $159 $0.5 $0.0 $158 2012 2013 2014 2015 2016 2017 2018 2019 2020 2021 2022 2Q23 Backlog Value ($ billions) Units in Backlog 10,700 14,400 31,500 41,300 27,500 28,600 27,400 30,300 24,600 26,600 29,500 25,900 53

Manufacturing capacity was rapidly downsized as the COVID-19 pandemic impacted market demand Over the course of 6 months, we dramatically Greenbrier Railcar Deliveries downsized our manufacturing capacity ✓ Reduced headcount by over 6,500 employees, or 23,400 ~40%, in FY2020 21,700 ✓ Slowed production rates to preserve backlog and bridge the downturn ✓ Shut 13 production lines across 6 facilities 13,000 ✓ Eliminated all non-essential Capex ✓ Worked to mitigate impact of supply chain issues ✓ Incurred ~$9 million of COVID-19 related expenses We did this without impacting quality of production 2019 2020 2021 or our ability to deliver against our backlog. 54

We have ramped up capacity significantly since 2021 as demand has recovered We increased capacity by +80% over 18 months in Greenbrier Railcar Deliveries 2021 and 2022 ✓ Safely increased headcount by nearly 5,400 23,400 employees, or by ~108% 19,900 ✓ Restarted 13 production lines across six facilities ✓ Addressed the impact of supply chain issues ✓ Significant working capital ramp supported by 13,000 strong liquidity We have navigated many exogenous challenges and have a proven ability to manage complexity. 2021 2022 LTM 2/28/23 55

Leading Position & Supportive Backdrop Effectively Managing Production Capacity Optimizing Production to Enhance Profitability
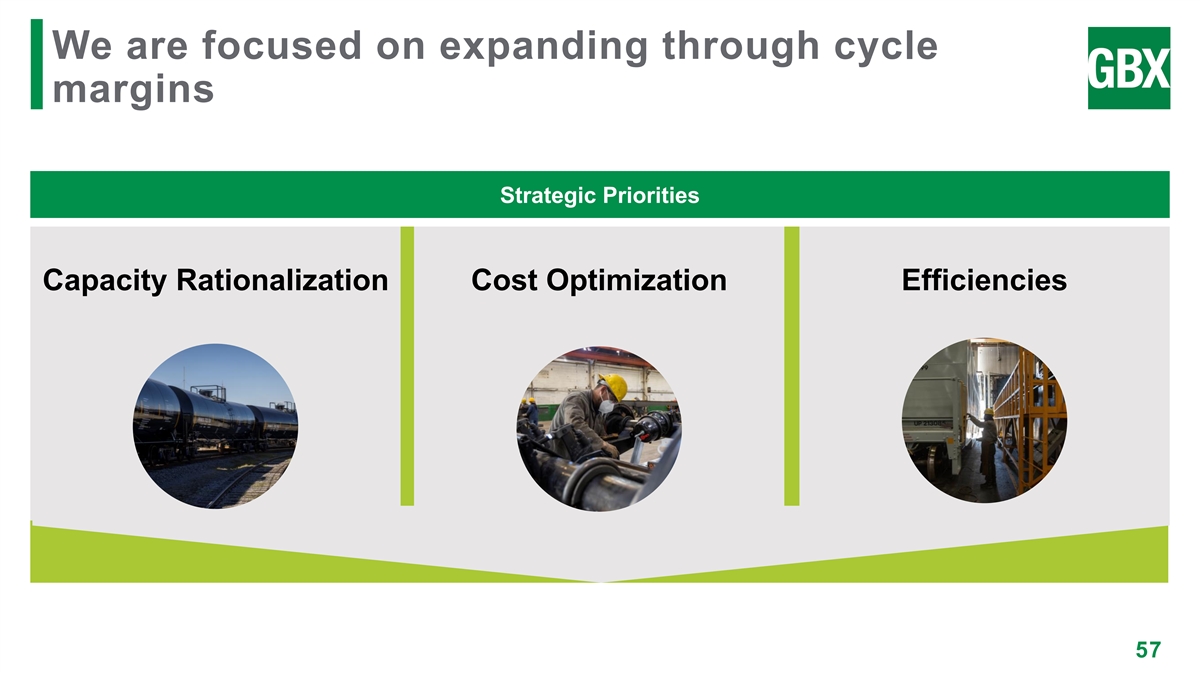
We are focused on expanding through cycle margins Strategic Priorities Capacity Rationalization Cost Optimization Efficiencies 57

Capacity rationalization creates $15 - $20 million in annual savings on an ongoing basis We are taking steps to optimize our manufacturing footprint. Ongoing annual savings of $15 - • Production footprint and capacity optimization $20 million for more stable demand environment • Will evaluate additional activity as demand environment clarifies over the next few years Equates to ~50 – 70 bps • Established ability to manage capacity of margin improvement on efficiently through cycles a $3 billion revenue base 58
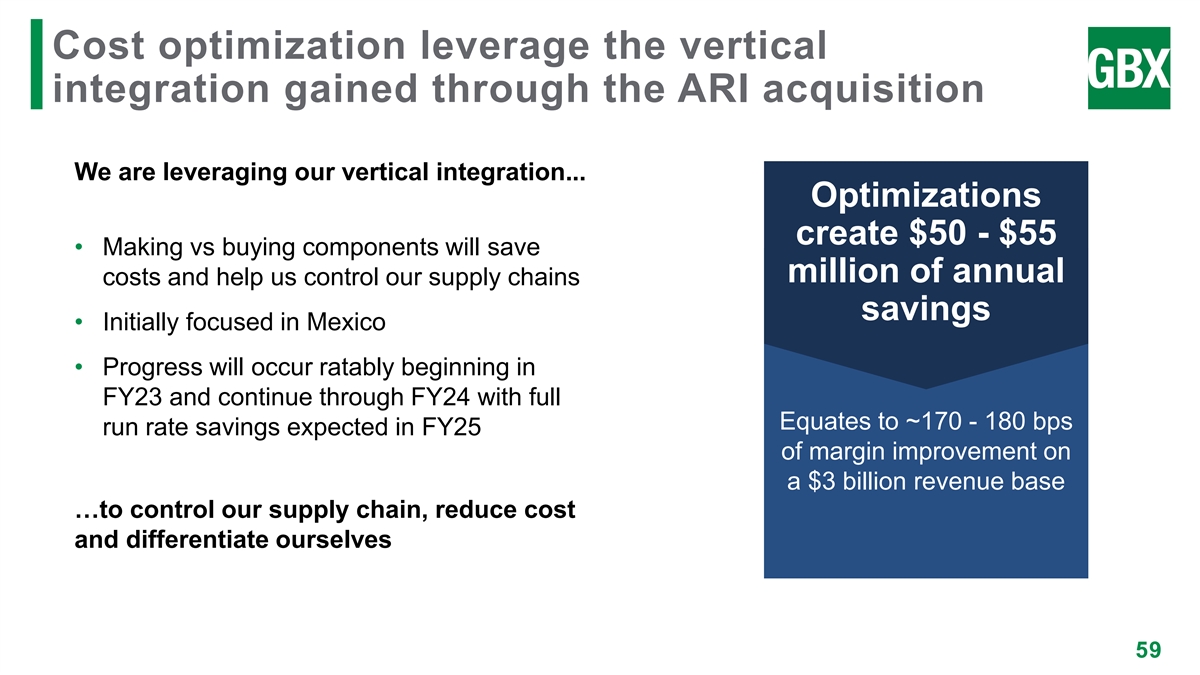
Cost optimization leverage the vertical integration gained through the ARI acquisition We are leveraging our vertical integration... Optimizations create $50 - $55 • Making vs buying components will save million of annual costs and help us control our supply chains savings • Initially focused in Mexico • Progress will occur ratably beginning in FY23 and continue through FY24 with full Equates to ~170 - 180 bps run rate savings expected in FY25 of margin improvement on a $3 billion revenue base …to control our supply chain, reduce cost and differentiate ourselves 59 59

Illustrative insourcing example 60

Taking additional actions to further enhance manufacturing efficiency Tactic Time Horizon Progress Benchmarking of plant labor <1 year efficiencies Implement system-wide best 3 years practices Railcar design optimization 4 years Product engineering to reduce 5 years material usage / weight 61
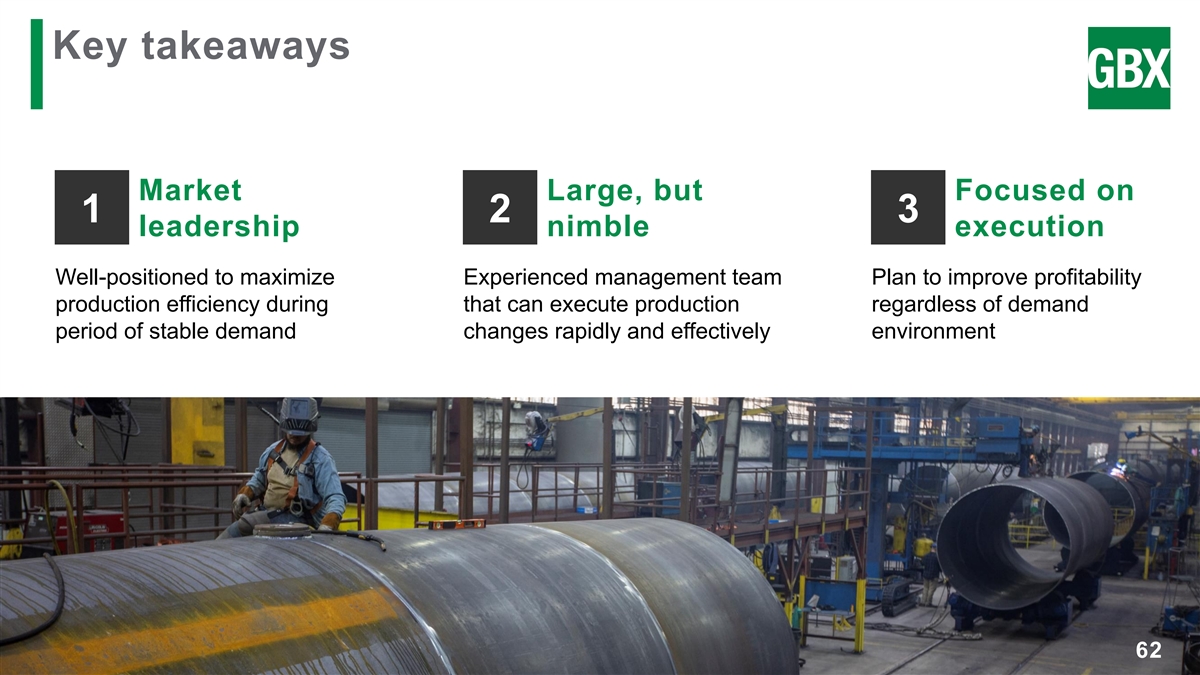
Key takeaways Market Large, but Focused on 1 2 3 leadership nimble execution Well-positioned to maximize Experienced management team Plan to improve profitability production efficiency during that can execute production regardless of demand period of stable demand changes rapidly and effectively environment 62 62
The European Opportunity William Glenn Chair of The Management Board, Greenbrier Astra Rail B.V.

Key differences between European and North American rail freight Rail Freight Market USA Europe* Rail Freight Deregulated 1988 Completed 2016 Rail share of freight 40% 19% Primary power source Diesel Electric Primary Traffic Freight Passenger Track Ownership Private Government – open access Regulation Private - AAR Government - ERA Fleet Size 1,600,000 678,000 64 * EU + UK, Switzerland, Norway, Baltics, Turkey

Deregulation drives competition & consolidation Impact of Deregulation Operating Lessors in Europe ▪ Open access allows efficient, low-cost private operators to compete with high-cost state incumbents Others (10+ players), 15% ▪ Incumbents lose market share and incur TOUAX, 5% huge financial losses. VTG, 39% Wascosa, ▪ Incumbents unable to purchase wagons 6% and turn to operating lessors for wagon supply GATX, 11% ▪ Competition drives consolidation in wagon TWA (50% leasing and manufacturing sectors ERMEWA, Owned), 6% 19% 65 Source: Company estimates
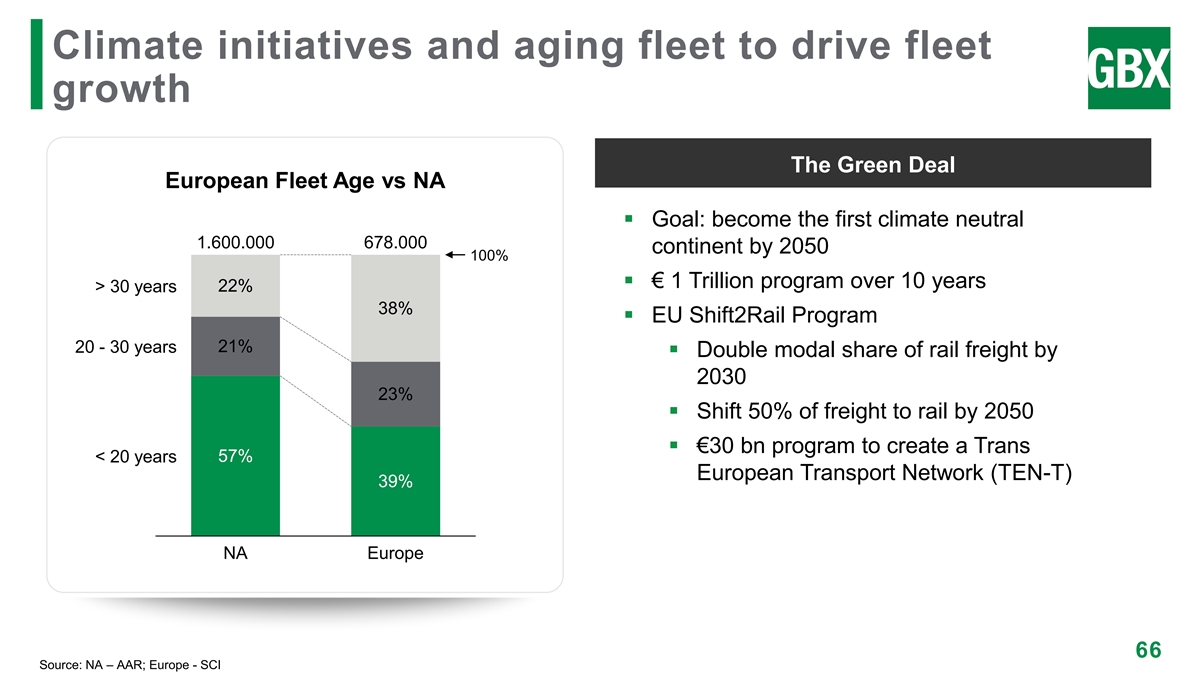
Climate initiatives and aging fleet to drive fleet growth The Green Deal European Fleet Age vs NA ▪ Goal: become the first climate neutral 1.600.000 678.000 continent by 2050 100% ▪ € 1 Trillion program over 10 years > 30 years 22% 38% ▪ EU Shift2Rail Program 20 - 30 years 21% ▪ Double modal share of rail freight by 2030 23% ▪ Shift 50% of freight to rail by 2050 ▪ €30 bn program to create a Trans < 20 years 57% European Transport Network (TEN-T) 39% NA Europe 66 Source: NA – AAR; Europe - SCI
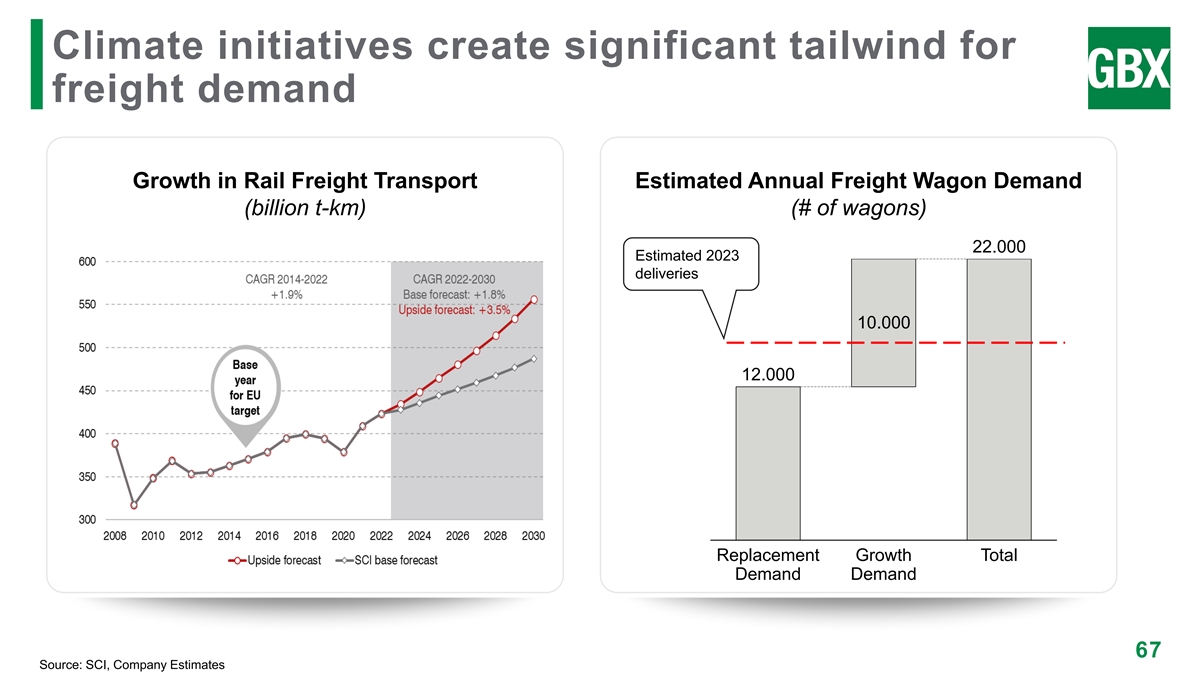
Climate initiatives create significant tailwind for freight demand Growth in Rail Freight Transport Estimated Annual Freight Wagon Demand (billion t-km) (# of wagons) 22.000 Estimated 2023 deliveries 10.000 12.000 Replacement Growth Total Demand Demand 67 Source: SCI, Company Estimates
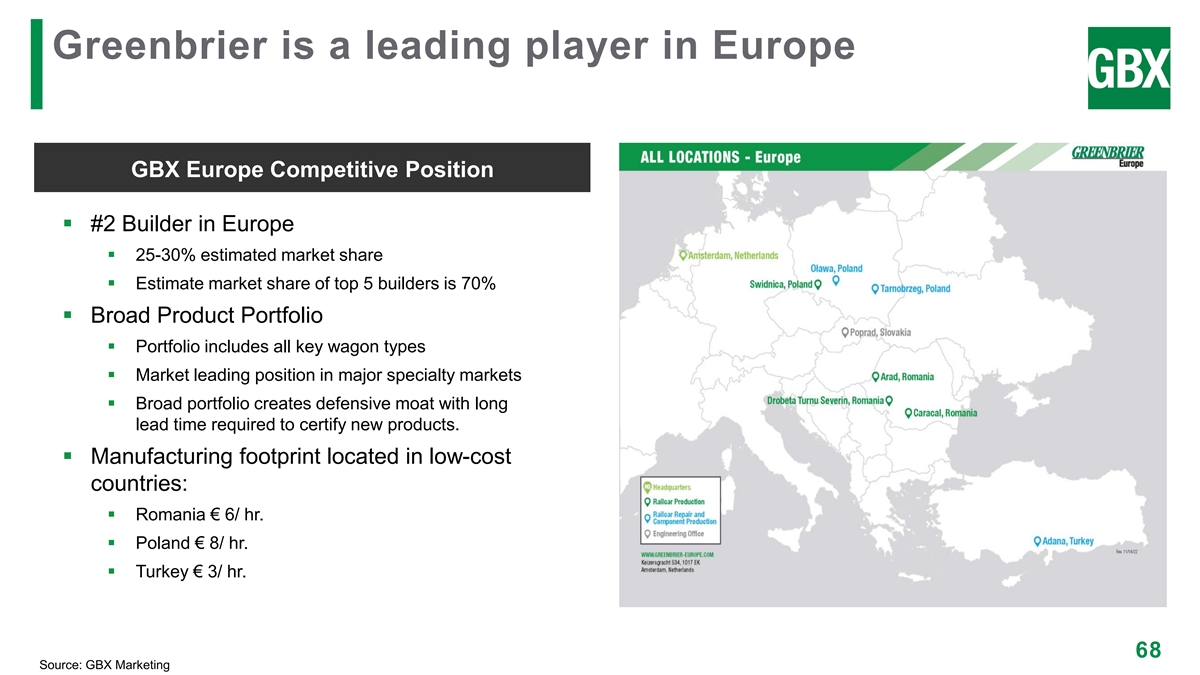
Greenbrier is a leading player in Europe GBX Europe Competitive Position ▪ #2 Builder in Europe ▪ 25-30% estimated market share ▪ Estimate market share of top 5 builders is 70% ▪ Broad Product Portfolio ▪ Portfolio includes all key wagon types ▪ Market leading position in major specialty markets ▪ Broad portfolio creates defensive moat with long lead time required to certify new products. ▪ Manufacturing footprint located in low-cost countries: ▪ Romania € 6/ hr. ▪ Poland € 8/ hr. ▪ Turkey € 3/ hr. 68 Source: GBX Marketing
Upside from operational improvement & leasing Margin Expansion from Operational Improvements Leverage Leasing Distribution Channel ▪ Streamline manufacturing footprint▪ Replicate successful NA syndication model − Produce more wagons in less facilities ▪ Leasing distribution channel improves manufacturing efficiency by facilitating ▪ Improve productivity longer production runs − Transfer of best practices ▪ Allows greater control over market share by ▪ Streamline and simplify product range going direct to shippers − Modular wagon families ▪ Margin expansion from syndication) − Standardized designs ▪ Leverage Purchasing Economies − Consolidate supplier network ▪ Systems upgrades − Cloud based ERP systems improve operating efficiency and reduce overhead 69

Growth potential for Greenbrier in Europe European market set for growth 1 • Fully deregulated market improves rail competitiveness • Replacement demand from ageing fleet • Growth in modal share driven by EU climate policy objectives Competitively positioned with strong fundamentals 2 • Operating at scale • Manufacturing in low-cost locations • Broad portfolio covering all key markets Strong Earnings Growth Potential 3 • Upside from streamlined manufacturing footprint • Productivity gains by transferring best practice • Leasing distribution channel enhances efficiency and margin expansion 70 70

Growth in Less Cyclical, Higher Margin Segments Brian Comstock Chief Commercial & Leasing Officer

Unlocking value in Greenbrier’s business model Strong building blocks for growth Smoothing performance across the cycle

Delivering value to our customers throughout railcar life cycle Railcar Railcar Manufacturing Leasing Maintenance Railcar Services Management 73
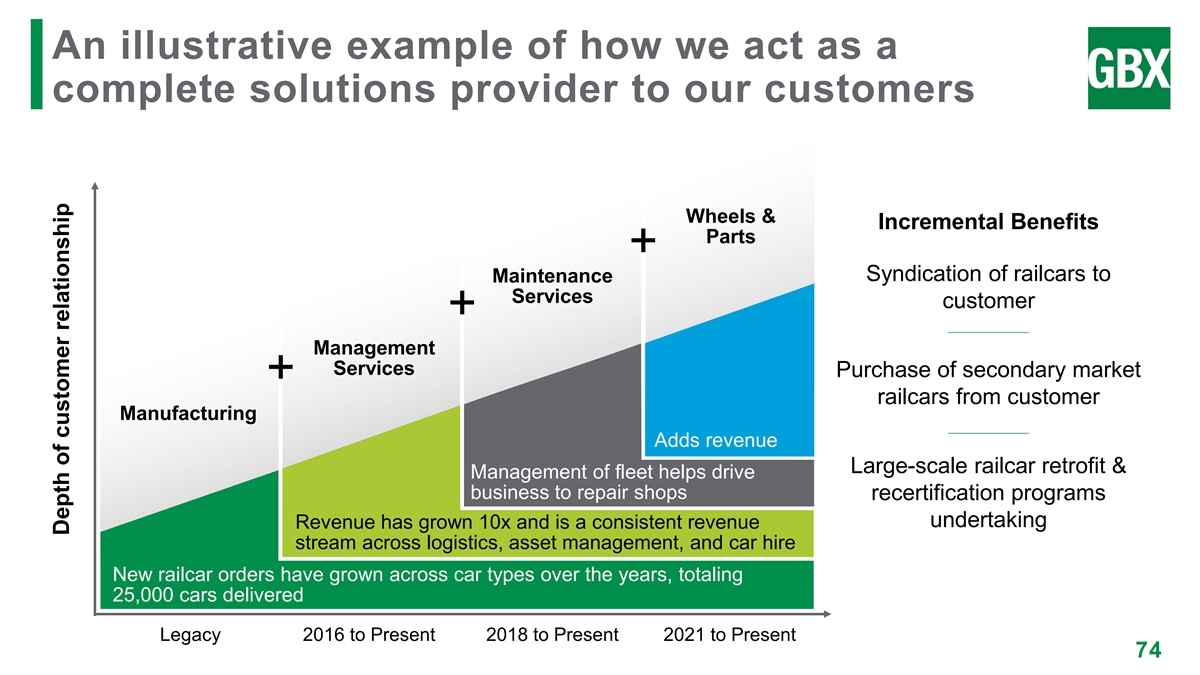
An illustrative example of how we act as a complete solutions provider to our customers Wheels & Incremental Benefits Parts + Syndication of railcars to Maintenance Services customer + Management Services Purchase of secondary market + railcars from customer Manufacturing Adds revenue Large-scale railcar retrofit & Management of fleet helps drive business to repair shops recertification programs undertaking Revenue has grown 10x and is a consistent revenue stream across logistics, asset management, and car hire New railcar orders have grown across car types over the years, totaling 25,000 cars delivered Legacy 2016 to Present 2018 to Present 2021 to Present 74 Depth of customer relationship

Our Management Services business delivers comprehensive service to lessor customers (1) ~450,000 assets currently under management Customers include railroads, industrial shippers, investors, operating lessors Keep asset within repair & maintenance rules and fit for service Manages railcar Manages the per diem administration, rent paid and received for contracts, registration railcars and taxes Training and program design targeting full Moves railcars compliance with from point A to B tank car rules and regs 75 (1) As of March 31, 2023

Strategically located aftermarket service network serves a broad range of customers Key customers served: Greenbrier, Trinity Rail, Wells Fargo Rail, CIT, SMBC, Union Tank, GATX Corporation, Martin Marietta, Canadian, Port Terminal, Standard Steel, Mountaineer, TSI, Santee Cooper, Rocky Mountain, Procor, AITX, Lineage/Cryo-Trans, NS, BNSF, CP, CN, UP, TTX Company 76
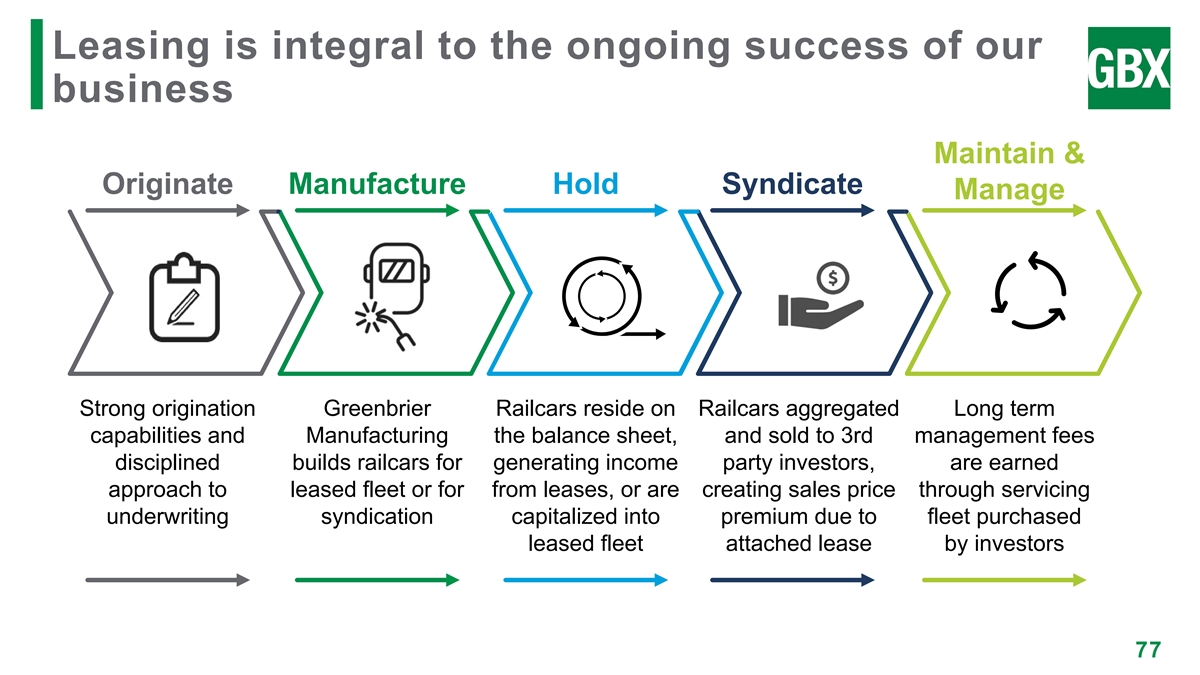
Leasing is integral to the ongoing success of our business Maintain & Originate Manufacture Hold Syndicate Manage Strong origination Greenbrier Railcars reside on Railcars aggregated Long term capabilities and Manufacturing the balance sheet, and sold to 3rd management fees disciplined builds railcars for generating income party investors, are earned approach to leased fleet or for from leases, or are creating sales price through servicing underwriting syndication capitalized into premium due to fleet purchased leased fleet attached lease by investors 77

Strong lease origination capabilities & disciplined approach to underwriting Counterparty Considerations Expected Outcomes ✓ Consistent high utilization rate Longstanding customer ✓ Diversification across lessees Investment grade credits ✓ Appropriate concentrations Clean payment history ✓ Low bankruptcy/workouts Leader within growing industry ✓ Good payment histories Operational success ✓ Few customer service issues ✓ Returning satisfied customers Stable country economy 78

Lease fleet development is based on internal manufacturing & external asset sourcing Counterparty Considerations Expected Outcomes ✓ Consistent high utilization rate GBX manufactured equipment ✓ Lease rate stability Other reputable manufacturers ✓ Diversification across car types High demand cars ✓ Appropriate concentrations Multiple commodity / industry usage ✓ Avoid over builds Large customer base ✓ Historical success remarketing ✓ Liquid asset for salability Low maintenance/mileage 79

Syndication drives liquidity and supports our broader capital allocation strategy Activities Impacts Syndication activity generates liquidity, premium returns and fee $2.2 billion in proceeds generated since FY18 income Accessing more efficient third- Helps to do more business with individual (1) customers (+18,500 railcars syndicated) and party capital maintains critical allows for more efficient manufacturing product runs market and customer presence Mitigates credit, duration and Enhances leasing platforms’ ability to optimize equipment risks owned fleet construction 80 (1) Represents railcars syndicated from FY2018 to Feb. 28, 2023

Syndication drives liquidity in support of our broader capital allocation strategy Railcars Syndicated Syndication Revenue ($ millions) $617 $580 4,800 4,600 $511 4,200 3,175 $367 2,550 $253 $193 1,500 2018 2019 2020 2021 2022 LTM 2018 2019 2020 2021 2022 LTM 2/28/23 2/28/23 81

Leasing supports baseline manufacturing capacity & fills gaps in production North American Manufacturing Orders by Quarter Leasing strategy launched Q1 Q2 Q3 Q4 Q1 Q2 Q3 Q4 Q1 Q2 Q3 Q4 Q1 Q2 2020 2021 2022 2023 Direct Sale Lease Avg. Quarterly Total 82
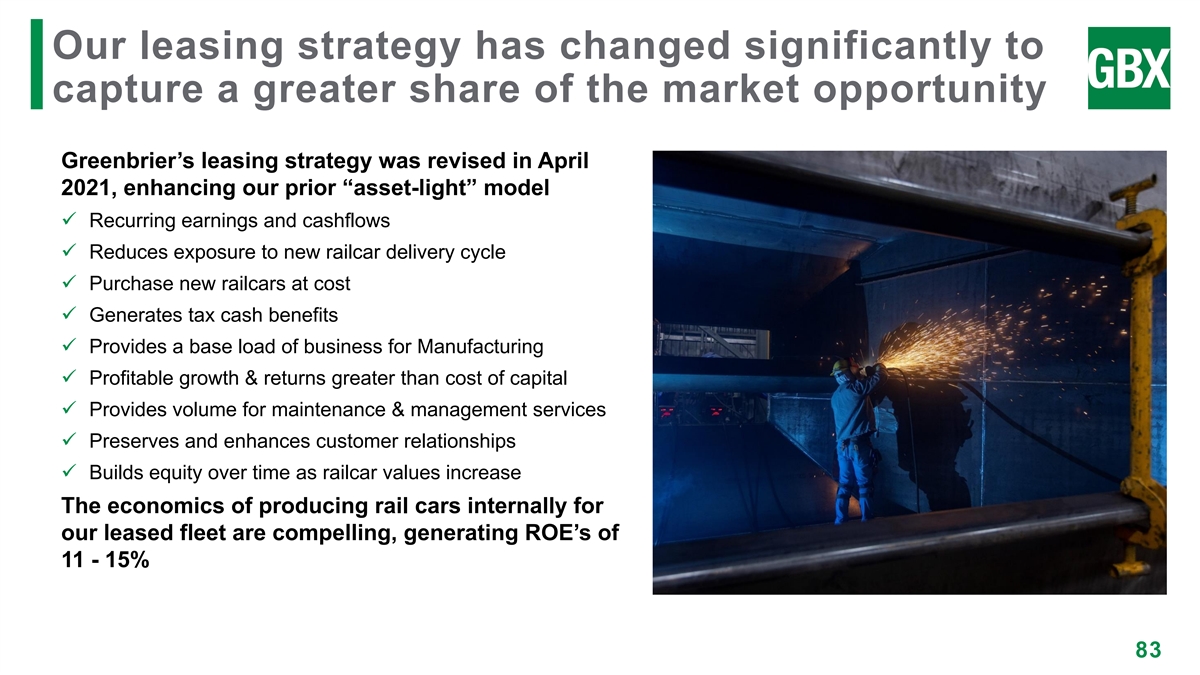
Our leasing strategy has changed significantly to capture a greater share of the market opportunity Greenbrier’s leasing strategy was revised in April 2021, enhancing our prior “asset-light” model ✓ Recurring earnings and cashflows ✓ Reduces exposure to new railcar delivery cycle ✓ Purchase new railcars at cost ✓ Generates tax cash benefits ✓ Provides a base load of business for Manufacturing ✓ Profitable growth & returns greater than cost of capital ✓ Provides volume for maintenance & management services ✓ Preserves and enhances customer relationships ✓ Builds equity over time as railcar values increase The economics of producing rail cars internally for our leased fleet are compelling, generating ROE’s of 11 - 15% 83

Our business strategy aligns well with the evolving nature of railcar ownership 25% 16% 47% 57% 19% 17% 9% 10% (2012) (2022) (2012) (2022) (2012) (2022) (2012) (2022) RAILROADS LESSORS SHIPPERS TTX POOL • Overall ownership continues • Shift from RR and shipper- • Shipper ownership share • Overall market share has to decline owned railcars to lessors has declined slightly remained steady • Virtually no tank car • Lessors dominate tank car • Railcar maintenance and • RR-owned pool focuses on ownership ownership due to complex management not a core box, flat, intermodal, and regulations competency gondola railcars • Focuses capital investment on infrastructure 84

Unlocking value in Greenbrier’s business model Strong building blocks for growth Smoothing performance across the cycle

Strong foundation is in place for the next stage (1) of Greenbrier’s evolution Lease Types 12,300 4.1 Yrs railcars avg. remaining term 1% 22% ~$1.0Bn 122 net book value # of customers 76% 8.5 Yrs 98.7% avg. railcar age fleet utilization (LTM) Full service Net lease Offlease 86 (1) As of February 28, 2023

A high-quality portfolio of railcars with diversification across car types and commodities (1) (1) Lease Fleet Railcars by Age Lease Fleet Railcar Types OTH/Gondola, 7.8k 12% Tank, 25% 12,300 Box/Flat/Auto, railcars 26% 1.5k 1.3k 0.6k 0.5k 0.3k 0.2k Covered Hopper, 0.1k 37% 0-5 6-10 11-15 16-20 21-25 26-30 31-35 >35 Years 87 (1) As of February 28, 2023
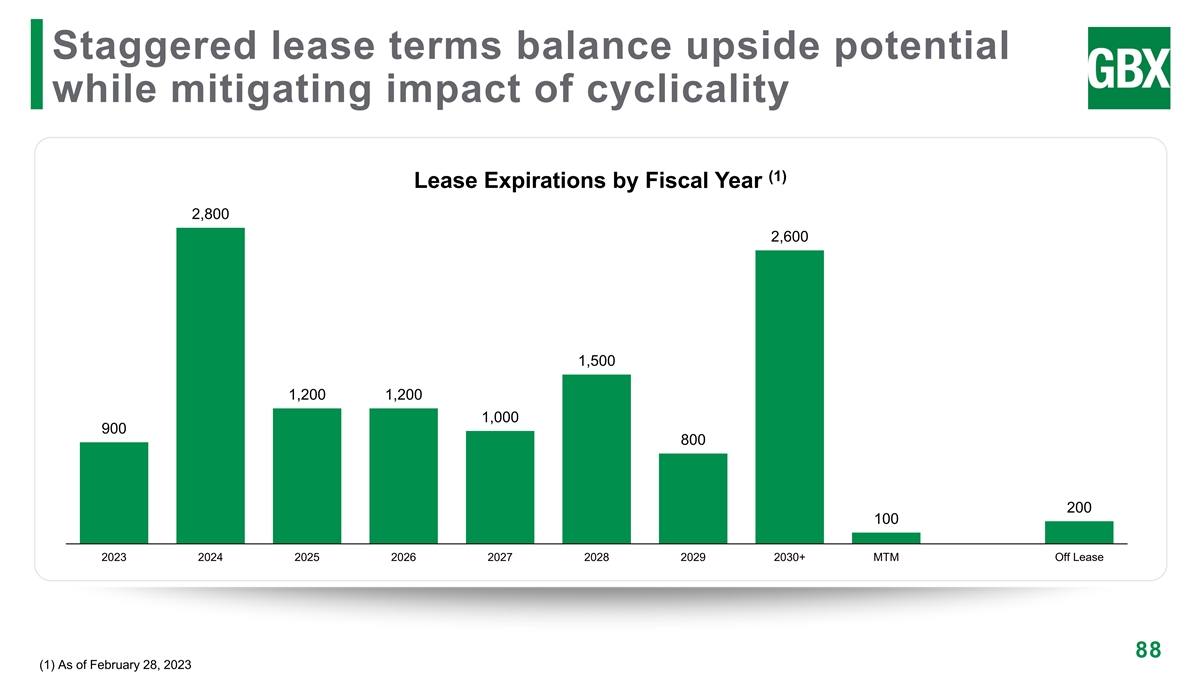
Staggered lease terms balance upside potential while mitigating impact of cyclicality (1) Lease Expirations by Fiscal Year 2,800 2,600 1,500 1,200 1,200 1,000 900 800 200 100 2023 2024 2025 2026 2027 2028 2029 2030+ MTM Off Lease 88 (1) As of February 28, 2023
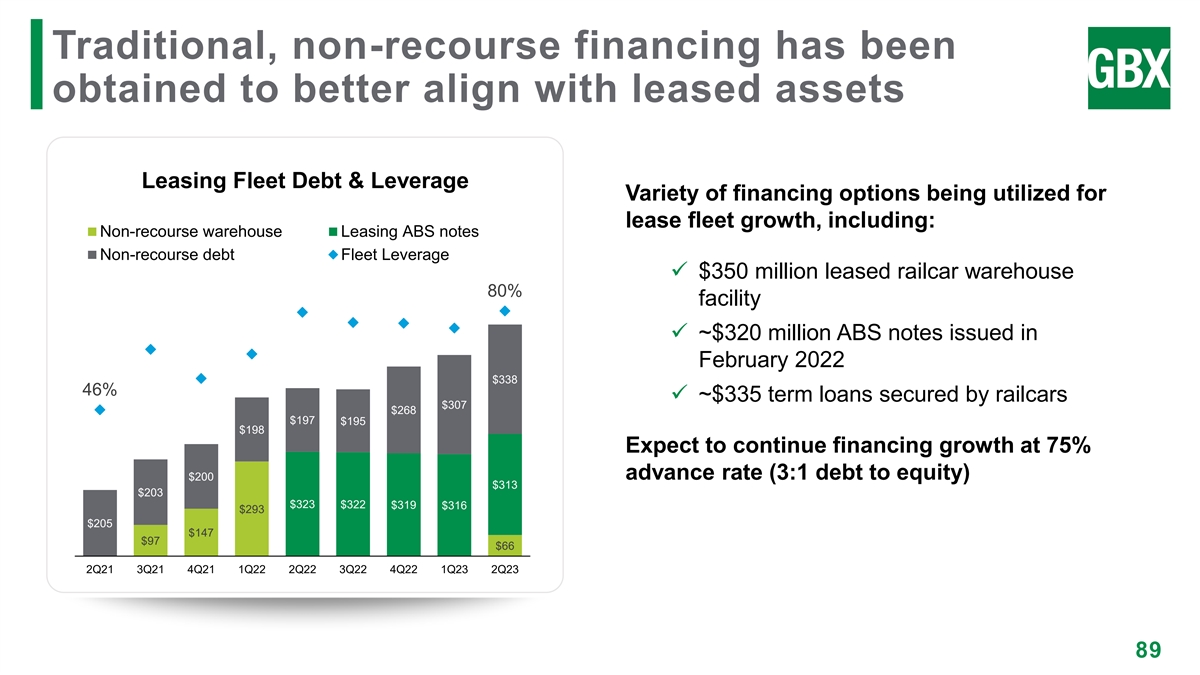
Traditional, non-recourse financing has been obtained to better align with leased assets Leasing Fleet Debt & Leverage Variety of financing options being utilized for lease fleet growth, including: Non-recourse warehouse Leasing ABS notes Non-recourse debt Fleet Leverage ✓ $350 million leased railcar warehouse 80% 800 ,000 85% facility 75% 700 ,000 ✓ ~$320 million ABS notes issued in 65% 600 ,000 February 2022 $338 55% 500 ,000 46% ✓ ~$335 term loans secured by railcars $307 $268 45% $197 $195 400 ,000 $198 35% Expect to continue financing growth at 75% 300 ,000 25% advance rate (3:1 debt to equity) $200 $313 200 ,000 $203 15% $323 $322 $319 $316 $293 100 ,000 $205 5% $147 $97 $66 - -5% 2Q21 3Q21 4Q21 1Q22 2Q22 3Q22 4Q22 1Q23 2Q23 89

Utilization has increased and stabilized as the leased fleet begins to achieve scale Lease Fleet Utilization 99% 98% 98% 98% 98% 97% 97% 97% Leasing strategy launched 95% 95% 94% 94% 93% 93% 92% 90% 90% 89% 1Q 19 2Q 19 3Q 19 4Q 19 1Q 20 2Q 20 3Q 20 4Q 20 1Q 21 2Q 21 3Q 21 4Q 21 1Q 22 2Q 22 3Q 22 4Q 22 1Q 23 2Q 23 90

Leasing & Management Services achieving consistently improving financial performance Segment Margin Segment Margin % 69% 68% $123 66% $105 55% $92 $86 31% $49 2019 2020 2021 2022 LTM 2/28/23 2019 2020 2021 2022 LTM 2/28/23 91

Recurring revenue has grown by ~35% (1) (2) Owned Fleet Managed Fleet Recurring Revenue ($Mn) ~ 450,000 12,300 $113 390,000 9,400 $83 2019 Current 2019 Current 2019 LTM 2/28/2023 (1) As of February 28, 2023 92 (2) As of March 31, 2023

Unlocking value in Greenbrier’s business model Strong building blocks for growth Smoothing performance across the cycle

We have established a holistic plan to optimize our Leasing & Services businesses Action Expected Outcome Increase in recurring revenue smoothes consolidated Expanded commitment Lease Fleet performance across the cycle Increased overhead absorption, improved system-wide Enhanced integration Capacity load factor, and greater labor productivity Elimination of redundant processes and systems drive Optimize internal platform Efficiency savings over time Leverage processes and shared knowledge to grow new Meet customer needs Agility capabilities to deliver value to our customers 94

Strategically committed to increasing a profitable, durable revenue stream Increasing net • Drives manufacturing volume Annual Margin investment in • Drives repair / management volume $15 - 20M owned fleet to: • Expanded market share • Strengthens customer >$300M / year relations for the next 5 • Reduces volatility in market and asset cycles Targeted Returns years on a cost • Builds equity over time and basis enhance potential for future 11-15% 8-11% gains ROE ROIC 95

Diverse, flexible funding with minimal covenants to ensure consistent through-cycle liquidity • Low cost of capital results in attractive lease rates for customers Pricing and desired economics for Greenbrier • ABS: Low fixed rate capital, longer maturities, secondary market liquidity Non-recourse • Term Loan: Fixed or floating rate, medium term maturities, Structures minimal covenants 75% - 80% • Warehouse: Floating rate, short term, revolving facility target borrowing based on • Match lease terms and funding maturities cumulative asset • Ensure consistent available liquidity with varying facility terms Term value • Stagger facility maturities throughout economic cycle • Navigate rate cycles with fixed or floating rate facilities - Mix of fixed and floating in stable or decreasing rate Fixed vs. environment Floating - Move to more fixed rates, as appropriate in an increasing rate environment 96

Actions we have undertaken to improve performance of maintenance services Maintenance Services Margin % ✓ Rationalizing network capacity to eliminate underperformers 9% ✓ Standardizing operating processes 7% ✓ Investing in training and workforce 7% development 6% 5% ✓ Investing in locations to minimize downtime and maximize throughput / efficiency ✓ Centralizing functions / shared services to remove duplication of people & processes ✓ Changing and collaborating commercial 2019 2020 2021 2022 LTM 2/28/23 approach to customers & suppliers 97

We are building a significant stream of recurring revenue through leasing & management Indicative growth in recurring revenue from leasing & management services ($ millions) $260 $113 Impact of $99 $83 $82 targeted $74 $73 investment 2018 2019 2020 2021 2022 LTM 2/28/2023 Target 98

Strong growth drivers & internal synergies to execute our strategy Opportunity Customers Lease Fleet Synergies Utilization Significant opportunity Origination of leases Greenbrier will Consistently strong Unlocking revenue to grow services and access to continue to invest in leased fleet utilization and cost synergies business, particularly industrial shippers has our portfolio, which has and leasing market across the leasing grown through ARI grown by over 40% dynamics support organization acquisition since 2021 strategy 99

Disciplined Growth & Margin Expansion Adrian Downes Chief Financial Officer

Performance Highlights Disciplined Capital Allocation Recapping Our Targets

Consistently strong revenue generation, with revenues returning to pre-pandemic levels Consolidated Revenue ($ millions) $3,633 $3,034 $2,978 $2,792 $1,748 2019 2020 2021 2022 LTM 2/28/23 Consolidated Revenue 10-year Average 102

Historical gross margin dollars highlight potential for significant cash flow generation Consolidated Margin ($ millions) $390 $366 $353 $306 $232 2019 2020 2021 2022 LTM 2/28/2023 Consolidated Margin 10-year Average 103

Proven history of growing EBITDA through cycles; current trough is 3.1x prior trough average Adjusted EBITDA ($ millions) 3.1x higher than $474 ’09 – ’10 trough $434 average EBITDA $317 $318 $310 $291 $284 $254 $231 $163 $161 $145 $129 $112 $113 $103 $90 $76 $64 2005 2006 2007 2008 2009 2010 2011 2012 2013 2014 2015 2016 2017 2018 2019 2020 2021 2022 LTM Average: $111 Average: $70 Average: $142 Average: $387 Average: $309 Average: $220 Peak Trough Transition (1) See Appendix for Reconciliation 104 Note: LTM data as of February 28, 2023
Performance Highlights Disciplined Capital Allocation Recapping Our Targets

Key elements of our disciplined, well-defined capital allocation policy 1 2 3 Maintain a Strong Drive Through Return Capital to Balance Sheet Cycle Earnings Shareholders • Maintain strong • Grow leasing fleet • 36 consecutive liquidity position through investment quarters of dividends • Have capacity for • Improve cost structure • Increase dividend accretive M&A & competitiveness regularly • Manage debt prudently • Improve ROIC through • Repurchase shares better earnings & opportunistically • Reduce non-leasing reducing footprint of debt underperforming ops 106
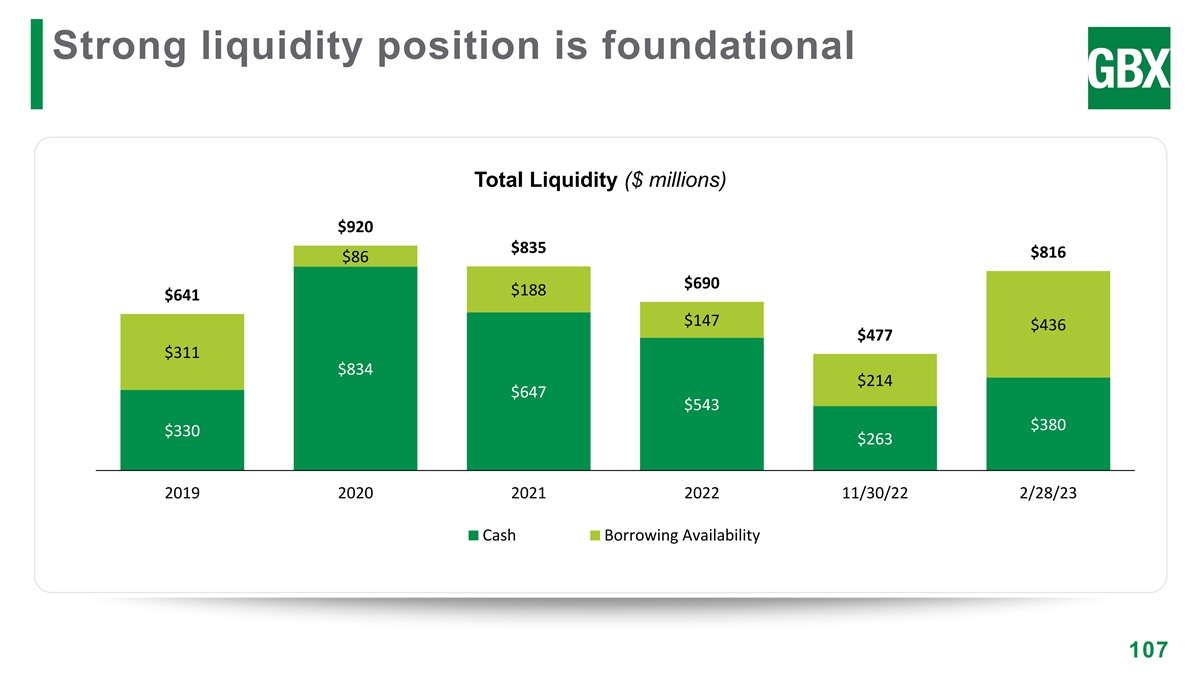
Strong liquidity position is foundational Total Liquidity ($ millions) $920 $835 $816 $86 $690 $188 $641 $147 $436 $477 $311 $834 $214 $647 $543 $380 $330 $263 2019 2020 2021 2022 11/30/22 2/28/23 Cash Borrowing Availability 107

Leasing drives liquidity in support of our broader capital allocation strategy Fleet Proceeds & Syndication Liquidity ($ millions) ✓ Syndication creates the opportunity to hold originated railcars in our fleet $703 $680 $666 or sell them to support liquidity ✓ Regular rebalancing and $448 $404 optimization of the lease fleet through asset sales provides liquidity $208 2018 2019 2020 2021 2022 LTM 2/28/23 Syndication Fleet Proceeds 108
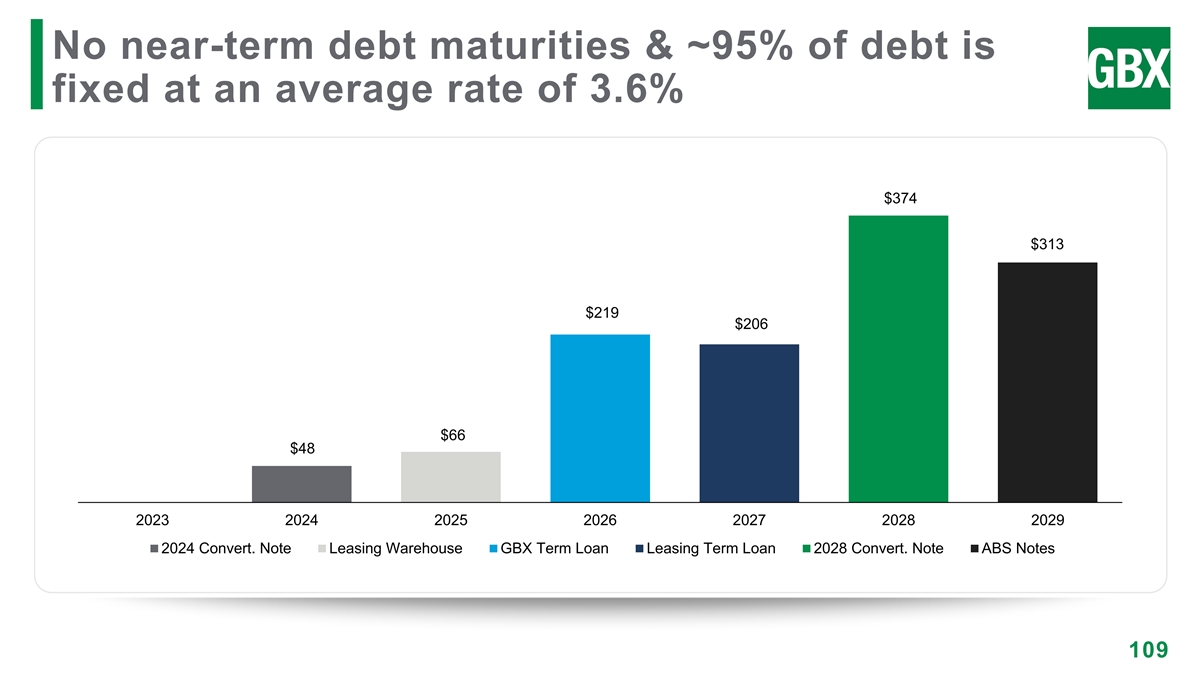
No near-term debt maturities & ~95% of debt is fixed at an average rate of 3.6% $374 $313 $219 $206 $66 $48 2023 2024 2025 2026 2027 2028 2029 2024 Convert. Note Leasing Warehouse GBX Term Loan Leasing Term Loan 2028 Convert. Note ABS Notes 109

Corporate recourse debt will be materially reduced over the next several years Recourse vs. Non-Recourse Debt ($ millions) Net Funded Debt to Adjusted EBITDA 4.4x 4.4x $1,000 $976 $941 $941 3.8x $717 $671 $587 2.0x 1.8x $347 1.0x $217 $209 2019 2020 2021 2022 2/28/2023 2019 2020 2021 2022 LTM Target 2/28/23 Leasing - Non-Recourse Corporate Recourse 110

Increasing our investment in our lease fleet to deliver through cycle performance Annual Investment in Lease Fleet ($ millions) $300M annually $100M $100M $100M $100M $100M $200M $200M $200M $200M $200M $170M $90M 2021 2022 2023F 2024F 2025F 2026F 2027F Net Investment Prior Commitment Incremental Commitment 111

Committed to returning value through dividends & share repurchases Dividends by Year ($ millions) ✓ Over $247 million paid in dividends since 2014 ✓ Dividend has grown by 80% $35.8 $35.8 $35.6 $35.2 since 2014 $33.2 ✓ Committed to regularly growing the dividend $29.9 ✓ $17 million purchased in Q2 under stock buyback program ✓ $75 million remaining under current share authorization after 2018 2019 2020 2021 2022 LTM 2/28/23 March 2023 activity 112

Performance Highlights Disciplined Capital Allocation Recapping Our Targets

Growth in recurring revenue in higher margin segment Indicative Growth in Recurring Revenue from Leasing & Management Services ($ millions) $260 $113 Impact of $103 $99 $83 targeted $75 $73 investment 2018 2019 2020 2021 2022 LTM 2/28/23 Target 114

We have already identified between $65 – 75 million of margin dollars with other plans underway Action North America Europe Capacity rationalization Cost optimization Additional manufacturing efficiencies Leverage purchasing economics Streamline & simplify product range Systems upgrades Transfer best practices 115

Summarizing our long-term targets 116

Key takeaways Well positioned to generate strong cash flow to deleverage the Balance Sheet and invest in the 1 business Management team focused on improving operating performance from existing footprint 2 Capital allocation policy that will generate robust returns for shareholders 3 117

APPENDIX SLIDES

Annual Adjusted EBITDA Reconciliation Reconciliation of Net Earnings (loss) to Adjusted EBITDA (In millions) Year Ending August 31, LTM 2005 2006 2007 2008 2009 2010 2011 2012 2013 2014 2015 2016 2017 2018 2019 2020 2021 2022 2/28/2023 $29.8 $39.0 $18.5 $14.2 ($57.9) $8.3 $8.4 $61.2 ($5.4) $149.8 $265.3 $284.8 $160.5 $172.1 $105.8 $87.6 $35.1 $53.8 56.5 Net earnings (loss) Interest and foreign 14.8 26.3 43.2 44.3 45.9 45.2 37.0 24.8 22.2 18.7 11.2 13.5 24.2 29.3 31.0 43.6 43.3 57.4 74.2 exchange Income tax expense 19.9 21.3 12.4 17.2 (16.9) (0.9) 3.5 32.4 25.1 72.4 112.2 112.3 64.0 32.9 41.6 40.2 (40.2) 18.1 24.4 (benefit) Depreciation and 22.9 25.3 32.8 35.1 37.7 37.5 38.3 42.4 41.4 40.4 45.1 63.4 65.1 74.4 83.7 109.9 100.7 102.0 104.0 amortization ARI acquisition and - - - - - - - - - - - - - - 18.8 7.8 - - - integration costs Severance expense - - - - - - - - - - - - - - - 21.2 - - - (1) Goodwill impairment - - - - - - - - 76.9 - - - 3.5 9.5 10.0 - - - - Gain on contribution to - - - - - - - - - (29.0) - - - - - - - - - GBW Loss (gain) on debt 2.9 - - - - (2.1) 15.7 - - - - - - - - - 6.3 - - extinguishment Impairment of long-lived - - - - - - - - - - - - - - - - - - 24.9 assets and other exit cost Special items - - 21.9 2.3 55.7 (11.9) - - 2.7 1.5 - - - - - - - - - Adjusted EBITDA $90.3 $111.9 $128.8 $113.1 $64.5 $76.1 $102.9 $160.8 $162.9 $253.8 $433.8 $474.0 $317.3 $318.2 $290.9 $310.3 $145.2 $231.3 $284.0 (1) 2013 and 2019 Goodwill impairment relates to our Wheels, Repair and Parts segment. 2017 and 2018 Goodwill impairment reflects our portion of a Goodwill impairment change recorded 119 by GBW.

Quarterly Adjusted EBITDA Reconciliation Supplemental Disclosure Reconciliation of Net Earnings (Loss) to Adjusted EBITDA (In millions, unaudited) Quarter Ending Feb. 28, May 31, Aug. 31, Nov. 30, Feb. 28, 2022 2022 2022 2022 2023 Net earnings (loss) $11.2 $7.6 $29.4 ($17.3) $36.8 Interest and foreign exchange 11.8 14.9 18.1 19.6 21.6 Income tax expense (benefit) 3.2 1.1 15.2 (3.8) 11.9 Depreciation and amortization 25.5 25.0 26.1 26.0 26.9 Impairment of long-lived assets - - - 24.2 0.7 and other exit related cost Adjusted EBITDA $51.7 $48.6 $88.8 $48.7 $97.9 120

Quarterly Adjusted Diluted EPS Reconciliation Supplemental Disclosure Reconciliation of Net Earnings (Loss) Attributable to Greenbrier to Adjusted Net Earnings (In millions, except per share amounts, unaudited) Quarter Ending Feb. 28, May 31, Aug. 31, Nov. 30, Feb. 28, 2022 2022 2022 2022 2023 Net earnings (loss) attributable $12.8 $3.1 $20.2 ($16.7) $33.1 to Greenbrier Impairment of long-lived assets - - - 18.3 0.7 and other exit related costs, net of tax $12.8 $3.1 $20.2 $1.6 $33.8 Adjusted net earnings Weighted average diluted shares 34.5 33.7 34.5 33.7 34.4 outstanding $0.38 $0.09 $0.60 $0.05 $0.99 Adjusted diluted EPS 121