Exhibit 99.1
| 3Q21 Earnings Conference Call October 27, 2021 |

| Safe Harbor Statement 2 “Safe Harbor” Statement under the Private Securities Litigation Reform Act of 1995: Statements in this Presentation relating to plans, strategies, economic performance and trends, projections of results of specific activities or investments and other statements that are not descriptions of historical facts may be forward-looking statements within the meaning of the Private Securities Litigation Reform Act of 1995, Section 27A of the Securities Act of 1933 and Section 21E of the Securities Exchange Act of 1934. Forward-looking information is inherently subject to risks and uncertainties, and actual results could differ materially from those currently anticipated due to a number of factors, which include, but are not limited to, risk factors discussed in the Company’s Annual Report on Form 10-K for the fiscal year ended December 31, 2020 and in other documents filed by the Company with the Securities and Exchange Commission from time to time. Forward-looking statements may be identified by terms such as “may”, “will”, “should”, “could”, “expects”, “plans”, “intends”, “anticipates”, “believes”, “estimates”, “predicts”, “forecasts”, “goals”, “potential” or “continue” or similar terms or the negative of these terms. Although we believe that the expectations reflected in the forward-looking statements are reasonable, we cannot guarantee future results, levels of activity, performance or achievements. The Company has no obligation to update these forward-looking statements. |
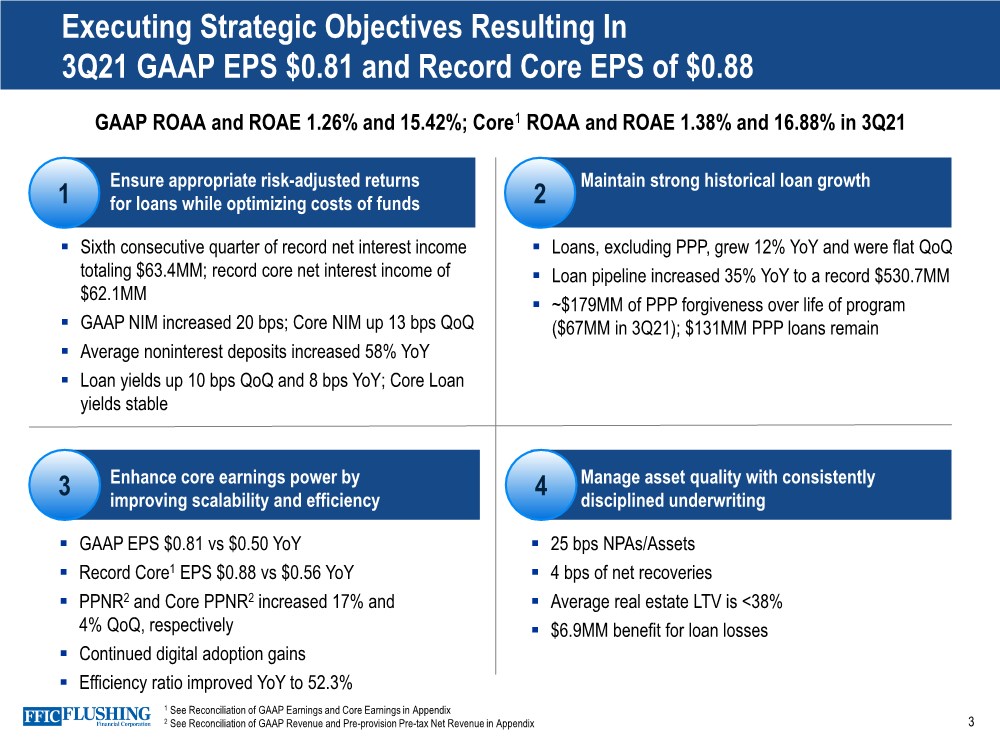
| 3 4 1 2 Ensure appropriate risk-adjusted returns for loans while optimizing costs of funds Maintain strong historical loan growth .. Sixth consecutive quarter of record net interest income totaling $63.4MM; record core net interest income of $62.1MM .. GAAP NIM increased 20 bps; Core NIM up 13 bps QoQ .. Average noninterest deposits increased 58% YoY .. Loan yields up 10 bps QoQ and 8 bps YoY; Core Loan yields stable .. Loans, excluding PPP, grew 12% YoY and were flat QoQ .. Loan pipeline increased 35% YoY to a record $530.7MM .. ~$179MM of PPP forgiveness over life of program ($67MM in 3Q21); $131MM PPP loans remain Enhance core earnings power by improving scalability and efficiency Manage asset quality with consistently disciplined underwriting .. GAAP EPS $0.81 vs $0.50 YoY .. Record Core1 EPS $0.88 vs $0.56 YoY .. PPNR2 and Core PPNR2 increased 17% and 4% QoQ, respectively .. Continued digital adoption gains .. Efficiency ratio improved YoY to 52.3% .. 25 bps NPAs/Assets .. 4 bps of net recoveries .. Average real estate LTV is <38% .. $6.9MM benefit for loan losses Executing Strategic Objectives Resulting In 3Q21 GAAP EPS $0.81 and Record Core EPS of $0.88 3 GAAP ROAA and ROAE 1.26% and 15.42%; Core1 ROAA and ROAE 1.38% and 16.88% in 3Q21 1 See Reconciliation of GAAP Earnings and Core Earnings in Appendix 2 See Reconciliation of GAAP Revenue and Pre-provision Pre-tax Net Revenue in Appendix |
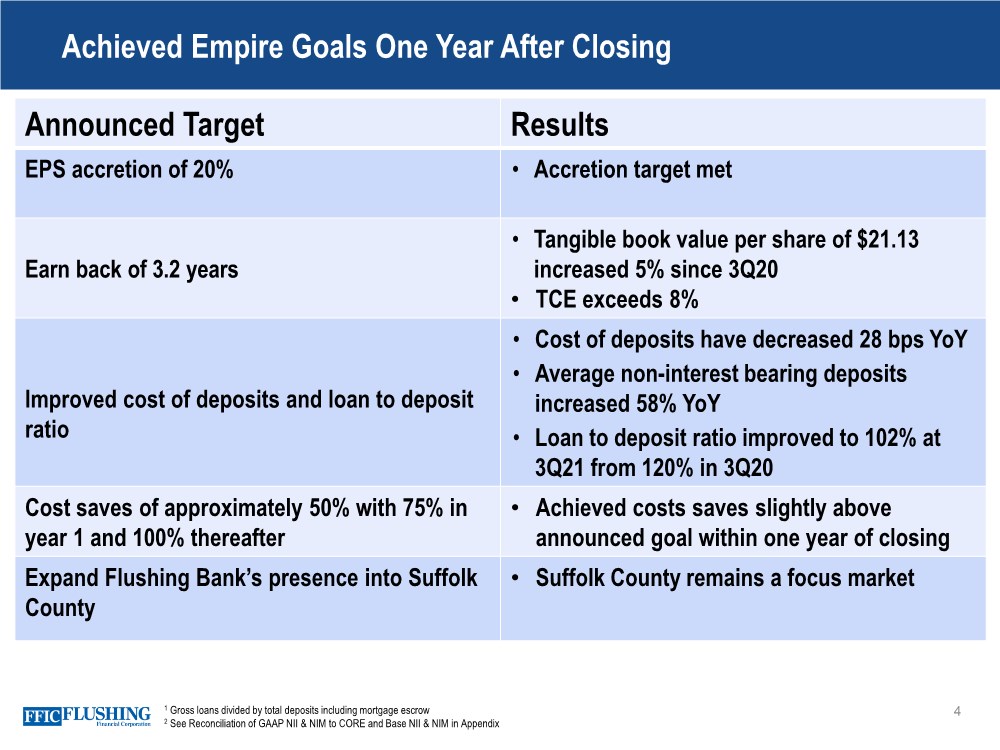
| 4 1 Gross loans divided by total deposits including mortgage escrow 2 See Reconciliation of GAAP NII & NIM to CORE and Base NII & NIM in Appendix Announced Target Results EPS accretion of 20% • Accretion target met Earn back of 3.2 years • Tangible book value per share of $21.13 increased 5% since 3Q20 • TCE exceeds 8% Improved cost of deposits and loan to deposit ratio • Cost of deposits have decreased 28 bps YoY • Average non-interest bearing deposits increased 58% YoY • Loan to deposit ratio improved to 102% at 3Q21 from 120% in 3Q20 Cost saves of approximately 50% with 75% in year 1 and 100% thereafter • Achieved costs saves slightly above announced goal within one year of closing Expand Flushing Bank’s presence into Suffolk County • Suffolk County remains a focus market Achieved Empire Goals One Year After Closing |
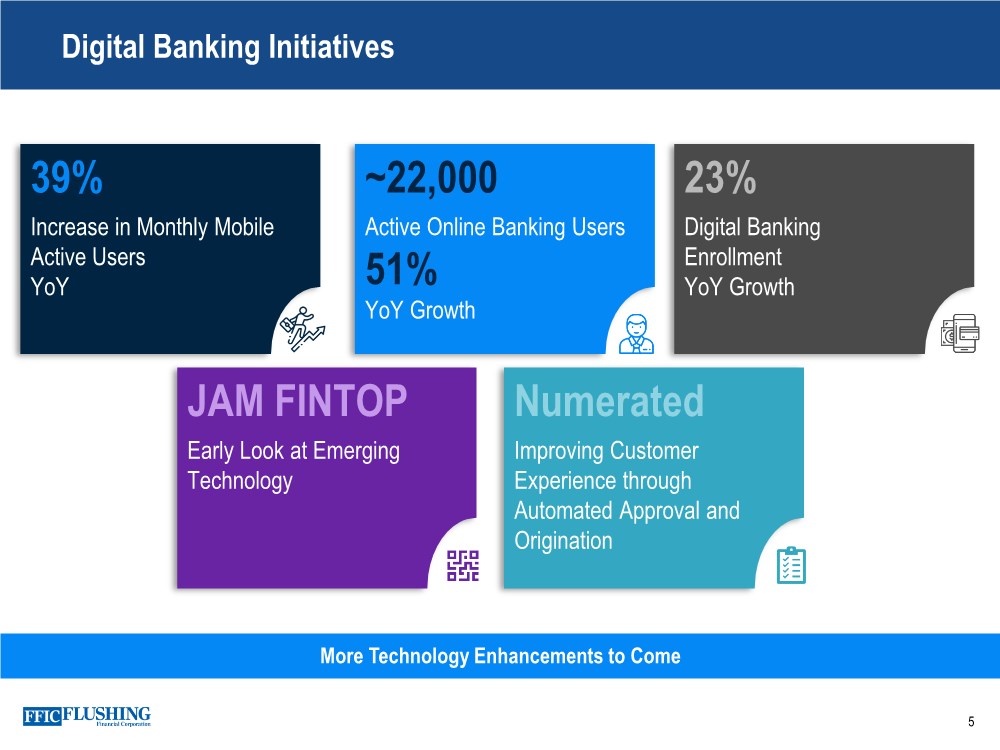
| Digital Banking Initiatives 5 More Technology Enhancements to Come 39% Increase in Monthly Mobile Active Users YoY ~22,000 Active Online Banking Users 51% YoY Growth 23% Digital Banking Enrollment YoY Growth Numerated Improving Customer Experience through Automated Approval and Origination JAM FINTOP Early Look at Emerging Technology |
| 6 Well-positioned to Benefit from Industry Merger Disruption • 8 bank mergers have been announced or closed involving Long Island area Banks2 • Out of the $328B of total industry deposits in Nassau, Queens, Kings, and Suffolk Counties, $60B or 18% involve a merger participant3 • 93% of FFIC’s deposits are in the Long Island market. Flushing Financial (FFIC)1 Elmhurst Branch (FFIC) to open by year end Webster Financial (WBS)/ Sterling Bancorp (STL) Valley National Bancorp (VLY)/ The Westchester Bank/Bank Leumi USA New York Community Bancorp (NYCB)/ Flagstar Bancorp (FBC) Citizens Financial Group (CFG)/ HSBC/Investors Bancorp (ISBC) M&T Bank (MTB)/ People’s United Financial (PBCT) Dime Community Bancshares (DCOM) Current Pro Forma U.S. Branches 1 22 FFIC branches shown, for illustrative purposes only, Port Jefferson Station, NY and Shirley, NY locations not pictured 2 Includes DCOM, MTB/PBCT, NYCB/FBC, CGF/ISBC/HSBC, VLY/The Westchester Bank/Bank Leumi USA, and WBS/STL 3 Based on most recent (June 30, 2021) S&P Global data |

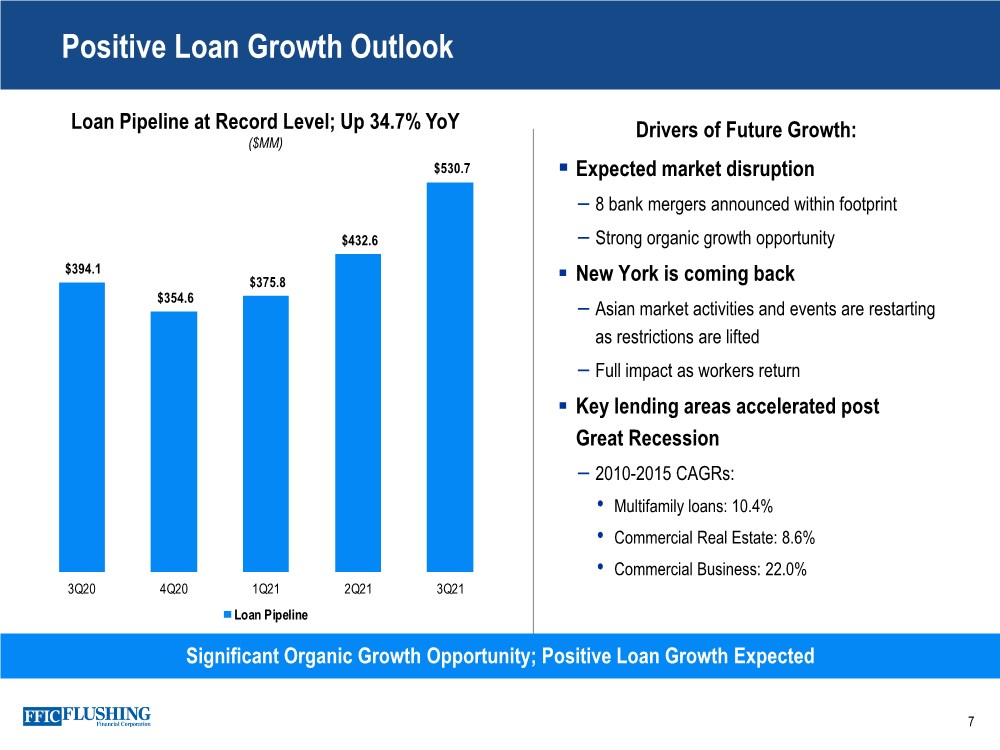
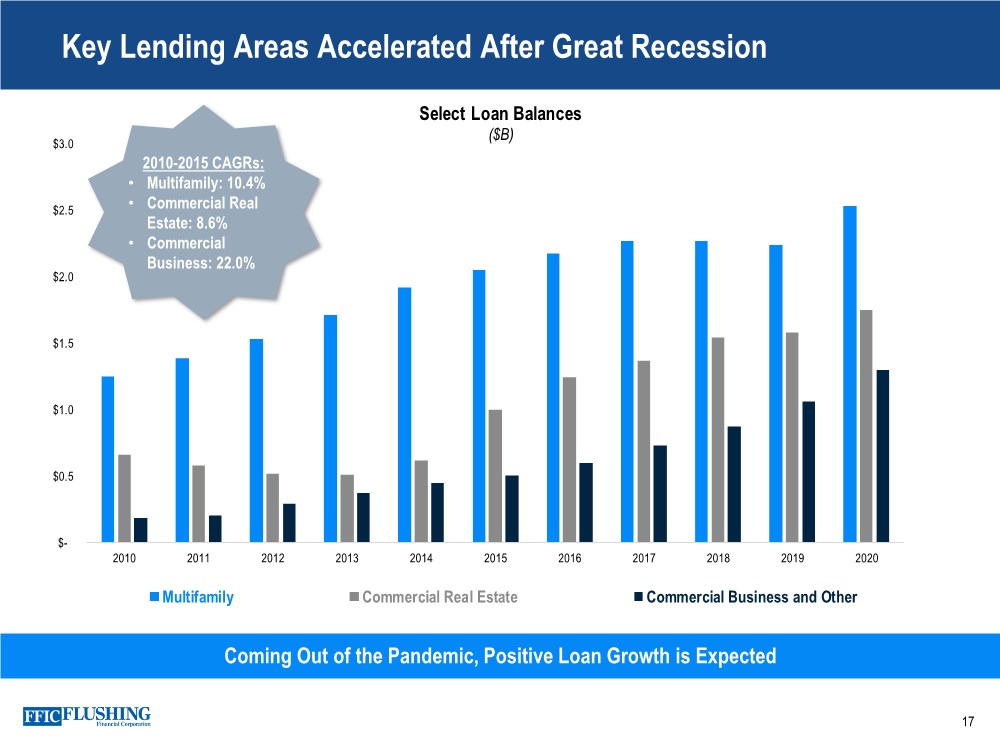
| Positive Loan Growth Outlook 7 .. Expected market disruption – 8 bank mergers announced within footprint – Strong organic growth opportunity .. New York is coming back – Asian market activities and events are restarting as restrictions are lifted – Full impact as workers return .. Key lending areas accelerated post Great Recession – 2010-2015 CAGRs: • Multifamily loans: 10.4% • Commercial Real Estate: 8.6% • Commercial Business: 22.0% Significant Organic Growth Opportunity; Positive Loan Growth Expected Loan Pipeline at Record Level; Up 34.7% YoY ($MM) $394.1 $354.6 $375.8 $432.6 $530.7 $- $100. 0 $200. 0 $300. 0 $400. 0 $500. 0 3Q20 4Q20 1Q21 2Q21 3Q21 Loan Pipeline Drivers of Future Growth: |
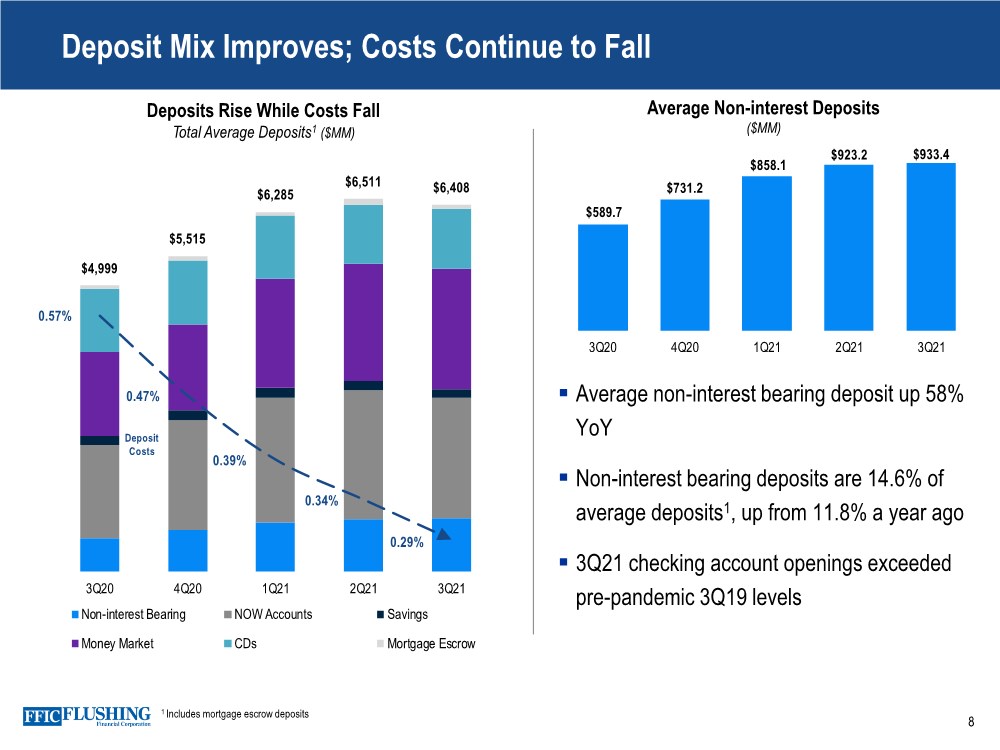
| Deposit Mix Improves; Costs Continue to Fall 8 Deposits Rise While Costs Fall Total Average Deposits1 ($MM) 1 Includes mortgage escrow deposits .. Average non-interest bearing deposit up 58% YoY .. Non-interest bearing deposits are 14.6% of average deposits1, up from 11.8% a year ago .. 3Q21 checking account openings exceeded pre-pandemic 3Q19 levels $4,999 $5,515 $6,285 $6,511 $6,408 0.57% 0.47% 0.39% 0.34% 0.29% 0% 0% 0% 1% 1% 1% 0 1000 2000 3000 4000 5000 6000 7000 3Q20 4Q20 1Q21 2Q21 3Q21 Non-interest Bearing NOW Accounts Savings Money Market CDs Mortgage Escrow Deposit Costs Average Non-interest Deposits ($MM) $589.7 $731.2 $858.1 $923.2 $933.4 0 100 200 300 400 500 600 700 800 900 1000 3Q20 4Q20 1Q21 2Q21 3Q21 |
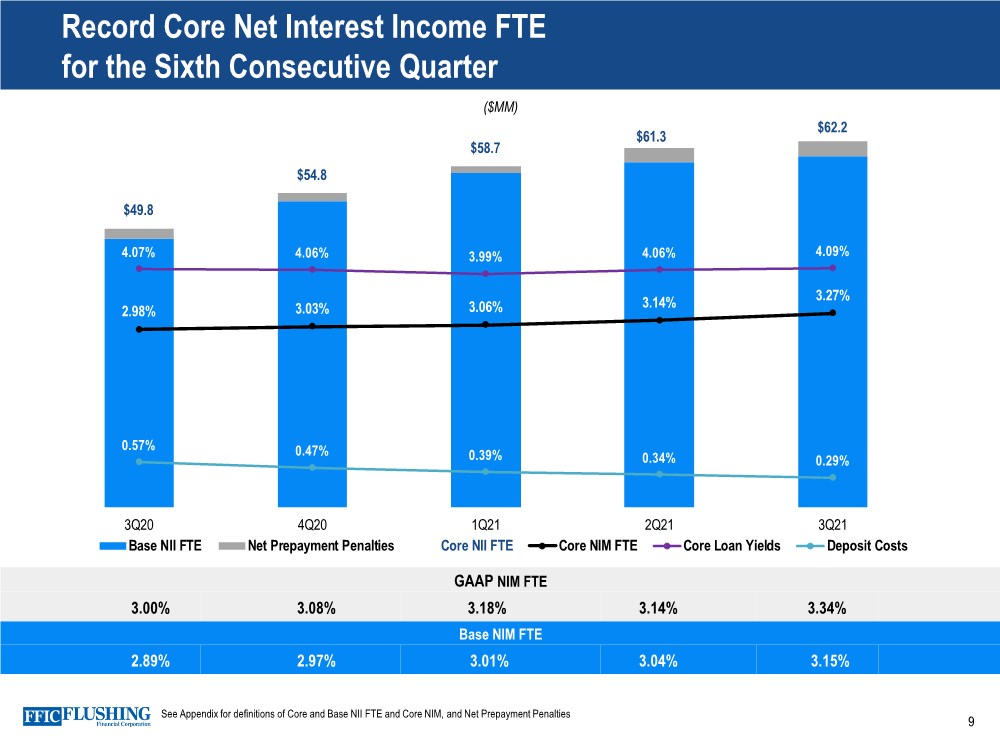
| Record Core Net Interest Income FTE for the Sixth Consecutive Quarter 9 Base NIM FTE 2.89% 2.97% 3.01% 3.04% 3.15% GAAP NIM FTE 3.00% 3.08% 3.18% 3.14% 3.34% $49.8 $54.8 $58.7 $61.3 $62.2 2.98% 3.03% 3.06% 3.14% 3.27% 4.07% 4.06% 3.99% 4.06% 4.09% 0.57% 0.47% 0.39% 0.34% 0.29% -0.25% 0.75% 1.75% 2.75% 3.75% 4.75% 5.75% 6.75% $10.0 $20.0 $30.0 $40.0 $50.0 $60.0 3Q20 4Q20 1Q21 2Q21 3Q21 Base NII FTE Net Prepayment Penalties Core NII FTE Core NIM FTE Core Loan Yields Deposit Costs ($MM) See Appendix for definitions of Core and Base NII FTE and Core NIM, and Net Prepayment Penalties |
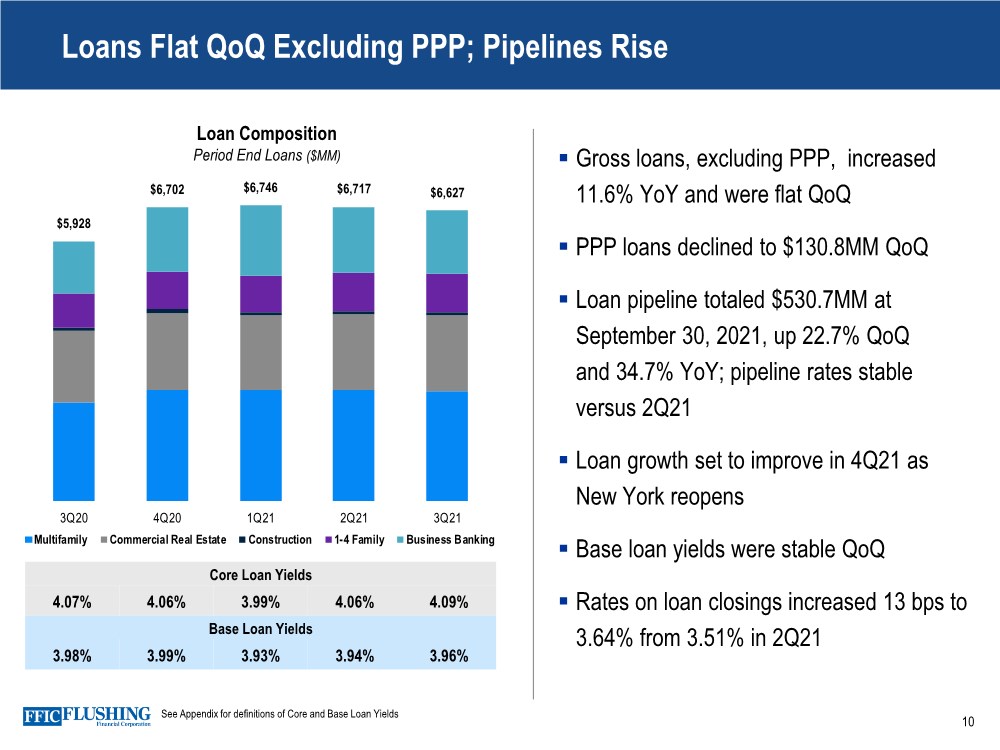
| $5,928 $6,702 $6,746 $6,717 $6,627 - 1,000 2,000 3,000 4,000 5,000 6,000 7,000 8,000 3Q20 4Q20 1Q21 2Q21 3Q21 Multifamily Commercial Real Estate Construction 1-4 Family Business Banking Loans Flat QoQ Excluding PPP; Pipelines Rise 10 Core Loan Yields 4.07% 4.06% 3.99% 4.06% 4.09% Loan Composition Period End Loans ($MM) Base Loan Yields 3.98% 3.99% 3.93% 3.94% 3.96% .. Gross loans, excluding PPP, increased 11.6% YoY and were flat QoQ .. PPP loans declined to $130.8MM QoQ .. Loan pipeline totaled $530.7MM at September 30, 2021, up 22.7% QoQ and 34.7% YoY; pipeline rates stable versus 2Q21 .. Loan growth set to improve in 4Q21 as New York reopens .. Base loan yields were stable QoQ .. Rates on loan closings increased 13 bps to 3.64% from 3.51% in 2Q21 See Appendix for definitions of Core and Base Loan Yields |
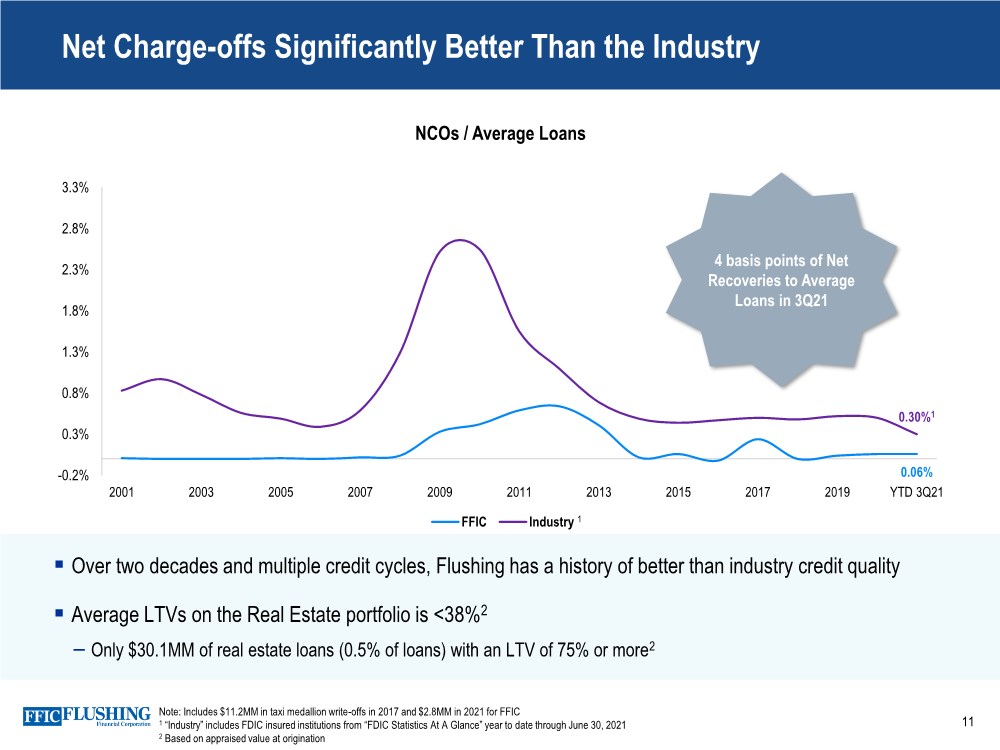
| Net Charge-offs Significantly Better Than the Industry 11 NCOs / Average Loans 0.06% 0.30%1 -0.2% 0.3% 0.8% 1.3% 1.8% 2.3% 2.8% 3.3% 2001 2003 2005 2007 2009 2011 2013 2015 2017 2019 YTD 3Q21 FFIC Industry 4 basis points of Net Recoveries to Average Loans in 3Q21 1 Note: Includes $11.2MM in taxi medallion write-offs in 2017 and $2.8MM in 2021 for FFIC 1 “Industry” includes FDIC insured institutions from “FDIC Statistics At A Glance” year to date through June 30, 2021 2 Based on appraised value at origination .. Over two decades and multiple credit cycles, Flushing has a history of better than industry credit quality .. Average LTVs on the Real Estate portfolio is <38%2 – Only $30.1MM of real estate loans (0.5% of loans) with an LTV of 75% or more2 |
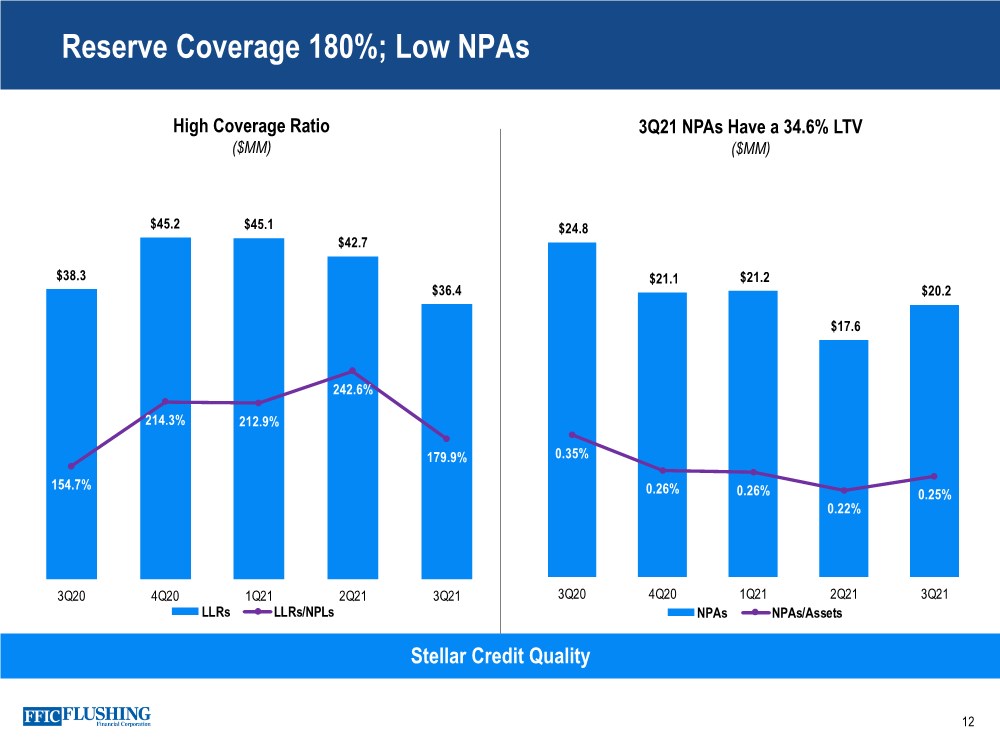
| $38.3 $45.2 $45.1 $42.7 $36.4 154.7% 214.3% 212.9% 242.6% 179.9% 0.5 1 1.5 2 2.5 3 3.5 4 $0.0 $5.0 $10.0 $15.0 $20.0 $25.0 $30.0 $35.0 $40.0 $45.0 $50.0 3Q20 4Q20 1Q21 2Q21 3Q21 LLRs LLRs/NPLs Reserve Coverage 180%; Low NPAs 12 Stellar Credit Quality High Coverage Ratio ($MM) 3Q21 NPAs Have a 34.6% LTV ($MM) $24.8 $21.1 $21.2 $17.6 $20.2 0.35% 0.26% 0.26% 0.22% 0.25% 0.00% 0.10% 0.20% 0.30% 0.40% 0.50% 0.60% 0.70% 0.80% 0.90% 1.00% $- $5.0 $10.0 $15.0 $20.0 $25.0 $30.0 3Q20 4Q20 1Q21 2Q21 3Q21 NPAs NPAs/Assets |
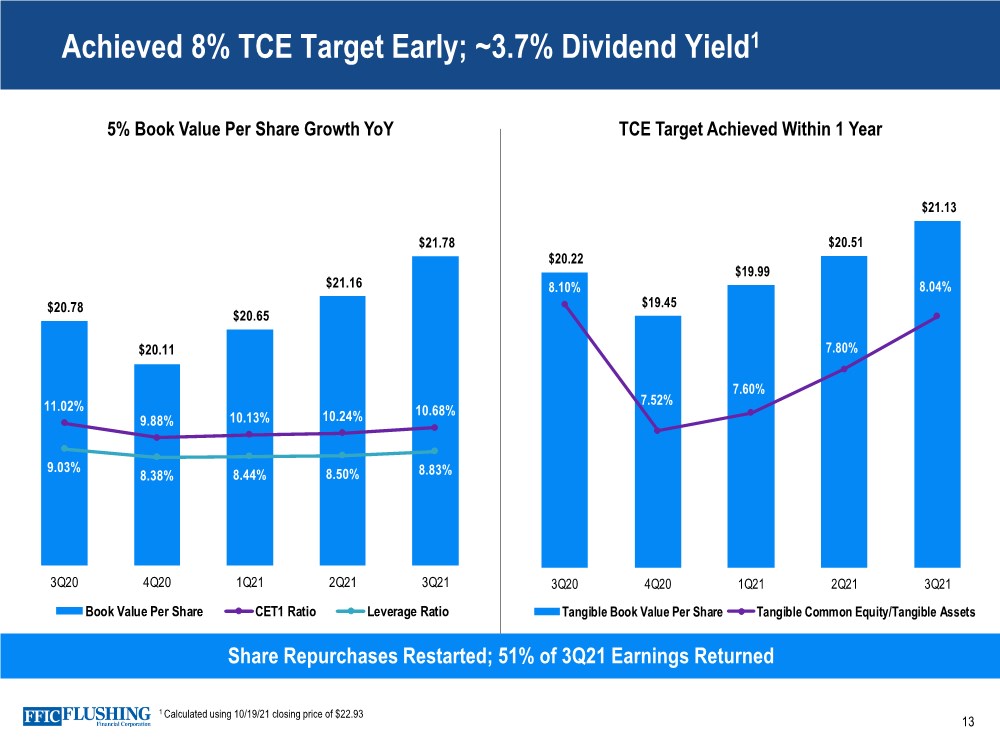
| Achieved 8% TCE Target Early; ~3.7% Dividend Yield1 13 Share Repurchases Restarted; 51% of 3Q21 Earnings Returned 5% Book Value Per Share Growth YoY TCE Target Achieved Within 1 Year 1 Calculated using 10/19/21 closing price of $22.93 $20.22 $19.45 $19.99 $20.51 $21.13 8.10% 7.52% 7.60% 7.80% 8.04% 6.90% 7.10% 7.30% 7.50% 7.70% 7.90% 8.10% 8.30% 8.50% 8.70% $15. 00 $16. 00 $17. 00 $18. 00 $19. 00 $20. 00 $21. 00 $22. 00 3Q20 4Q20 1Q21 2Q21 3Q21 Tangible Book Value Per Share Tangible Common Equity/Tangible Assets $20.78 $20.11 $20.65 $21.16 $21.78 11.02% 9.88% 10.13% 10.24% 10.68% 9.03% 8.38% 8.44% 8.50% 8.83% 0.00% 5.00% 10.00% 15.00% 20.00% 25.00% 30.00% $17. 00 $18. 00 $19. 00 $20. 00 $21. 00 $22. 00 $23. 00 3Q20 4Q20 1Q21 2Q21 3Q21 Book Value Per Share CET1 Ratio Leverage Ratio |
| 14 .. Tangible common equity reached 8% target – Capital priorities remain: • Profitably grow the balance sheet • Return dividends to shareholders • Opportunistically repurchase shares .. Low risk business model; 3.7%1 dividend yield – Average LTV on real estate loans totals <38% – Historical strong credit metrics – No changes to underwriting process .. Exceeded through-the-cycle goals (ROAA ≥1% and ROAE ≥10%) – GAAP and Core basis returns were above through- the-cycle goals without the benefit for credit losses .. Anticipated benefit from merger activity in market – Approximately 18% of industry deposits are in our Long Island market – Opportunity to obtain lending business – Availability of lending teams and staff .. Positive loan growth, excluding PPP, expected in 4Q21 and into 2022 – Loan pipeline at record levels – New York economy continues to normalize .. Core Net Interest Income driven more by volume than rate – Expect positive loan growth into 2022 – Continue to manage cost of funds – Stable loan yields Outlook and Key Messages 1 Calculated using 10/19/21 closing price of $22.93 |

| Appendix 15 |

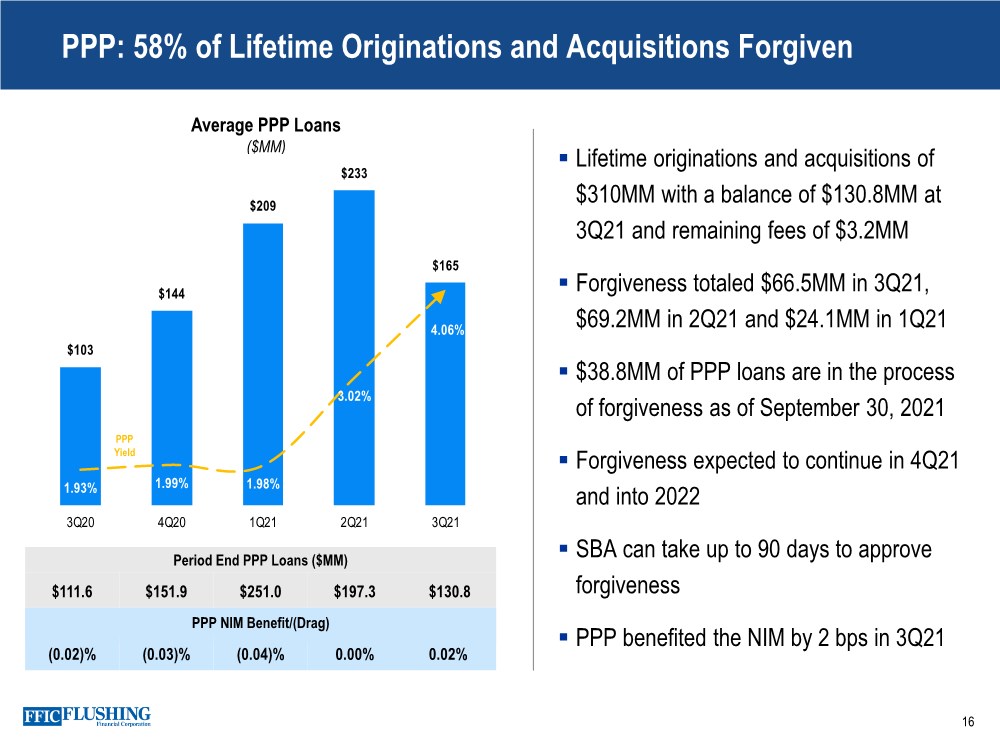
| PPP: 58% of Lifetime Originations and Acquisitions Forgiven 16 Period End PPP Loans ($MM) $111.6 $151.9 $251.0 $197.3 $130.8 Average PPP Loans ($MM) PPP NIM Benefit/(Drag) (0.02)% (0.03)% (0.04)% 0.00% 0.02% .. Lifetime originations and acquisitions of $310MM with a balance of $130.8MM at 3Q21 and remaining fees of $3.2MM .. Forgiveness totaled $66.5MM in 3Q21, $69.2MM in 2Q21 and $24.1MM in 1Q21 .. $38.8MM of PPP loans are in the process of forgiveness as of September 30, 2021 .. Forgiveness expected to continue in 4Q21 and into 2022 .. SBA can take up to 90 days to approve forgiveness .. PPP benefited the NIM by 2 bps in 3Q21 $103 $144 $209 $233 $165 1.93% 1.99% 1.98% 3.02% 4.06% 0 50 100 150 200 250 3Q20 4Q20 1Q21 2Q21 3Q21 PPP Yield |
| 17 Coming Out of the Pandemic, Positive Loan Growth is Expected Commercial Business Growth Accelerated After the Great Recession Key Lending Areas Accelerated After Great Recession $- $0.5 $1.0 $1.5 $2.0 $2.5 $3.0 2010 2011 2012 2013 2014 2015 2016 2017 2018 2019 2020 Select Loan Balances ($B) Multifamily Commercial Real Estate Commercial Business and Other 2010-2015 CAGRs: • Multifamily: 10.4% • Commercial Real Estate: 8.6% • Commercial Business: 22.0% |
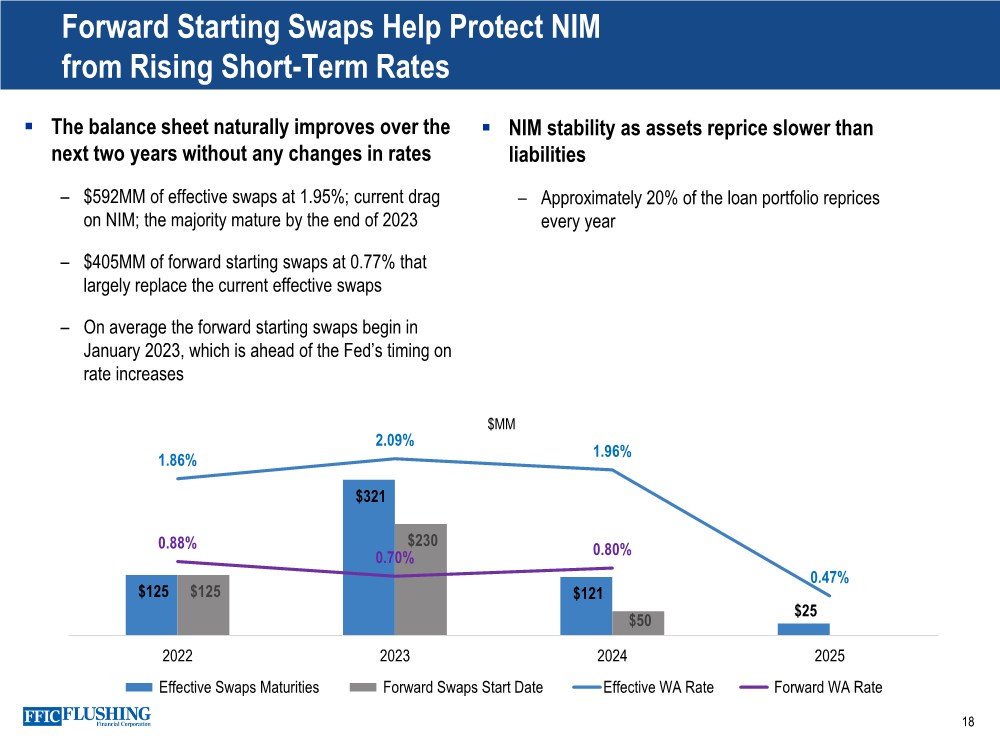
| . The balance sheet naturally improves over the next two years without any changes in rates – $592MM of effective swaps at 1.95%; current drag on NIM; the majority mature by the end of 2023 – $405MM of forward starting swaps at 0.77% that largely replace the current effective swaps – On average the forward starting swaps begin in January 2023, which is ahead of the Fed’s timing on rate increases 18 Forward Starting Swaps Help Protect NIM from Rising Short-Term Rates .. NIM stability as assets reprice slower than liabilities – Approximately 20% of the loan portfolio reprices every year $125 $321 $121 $25 $125 $230 $50 1.86% 2.09% 1.96% 0.47% 0.88% 0.70% 0.80% 2022 2023 2024 2025 Effective Swaps Maturities Forward Swaps Start Date Effective WA Rate Forward WA Rate $MM |
| Reconciliation of GAAP Earnings and Core Earnings 19 Non-cash Fair Value Adjustments to GAAP Earnings The variance in GAAP and core earnings is partly driven by the impact of non-cash net gains and losses from fair value adjustments. These fair value adjustments relate primarily to swaps designated to protect against rising rates and borrowing carried at fair value under the fair value option. As the swaps get closer to maturity, the volatility in fair value adjustments will dissipate. In a declining interest rate environment, the movement in the curve exaggerates our mark-to-market loss position. In a rising interest rate environment or a steepening of the yield curve, the loss position would experience an improvement. Core Net Income, Core Diluted EPS, Core ROAE, Core ROAA, Pre-provision, Pre-tax Net Revenue, Core Net Interest Income FTE, Core Net Interest Margin FTE, Base Net Interest Income FTE, Base Net Interest Margin FTE, Core Interest Income and Yield on Total Loans, Base Interest Income and Yield on Total Loans, Core Non-interest Income, Core Non-interest Expense and Tangible Book Value per common share are each non-GAAP measures used in this presentation.A reconciliation to the most directly comparable GAAP financial measures appears below in tabular form. The Company believes that these measures are useful for both investors and management to understand the effects of certain interest and non-interest items and provide an alternative view of the Company's performance over time and in comparison to the Company's competitors. These measures should not be viewed as a substitute for net income. The Company believes that tangible book value per common share is useful for both investors and management as these are measures commonly used by financial institutions, regulators and investors to measure the capital adequacy of financial institutions. The Company believes these measures facilitate comparison of the quality and composition of the Company's capital over time and in comparison to its competitors. These measures should not be viewed as a substitute for total shareholders' equity. These non-GAAP measures have inherent limitations, are not required to be uniformly applied and are not audited. They should not be considered in isolation or as a substitute for analysis of results reported under GAAP. These non-GAAP measures may not be comparable to similarly titled measures reported by other companies. |
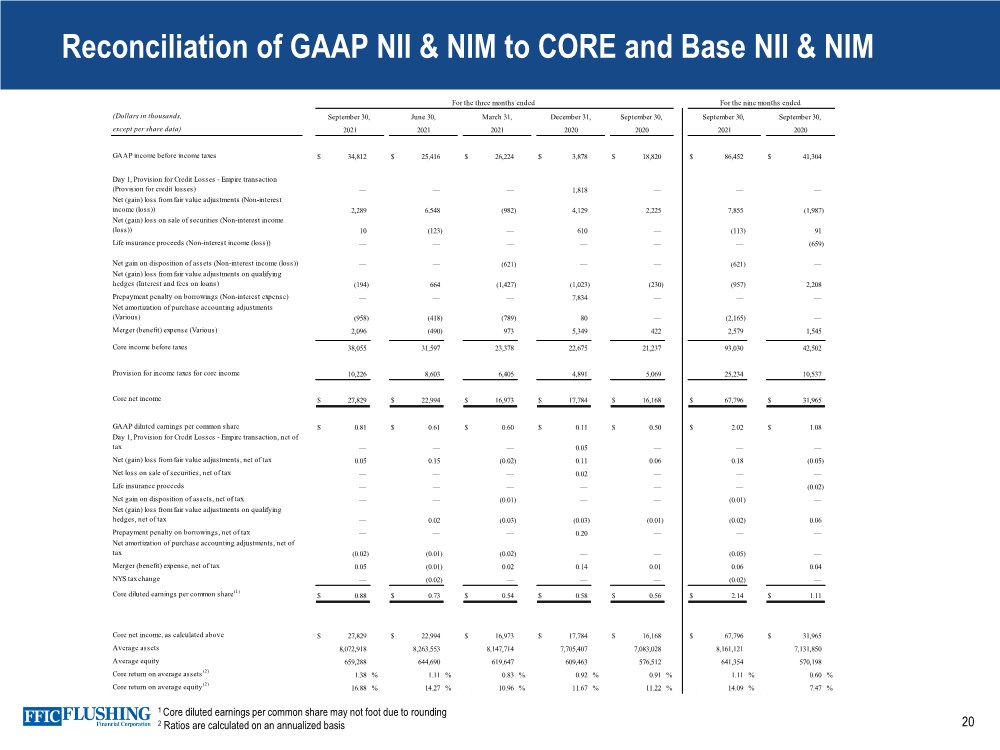
| 20 (Dollars in thousands, except per share data) GAAP income before income taxes $ 34,812 $ 25,416 $ 26,224 $ 3,878 $ 18,820 $ 86,452 $ 41,304 Day 1, Provision for Credit Losses - Empire transaction (Provision for credit losses) — — — 1,818 — — — Net (gain) loss from fair value adjustments (Non-interest income (loss)) 2,289 6,548 (982) 4,129 2,225 7,855 (1,987) Net (gain) loss on sale of securities (Non-interest income (loss)) 10 (123) — 610 — (113) 91 Life insurance proceeds (Non-interest income (loss)) — — — — — — (659) Net gain on disposition of assets (Non-interest income (loss)) — — (621) — — (621) — Net (gain) loss from fair value adjustments on qualifying hedges (Interest and fees on loans) (194) 664 (1,427) (1,023) (230) (957) 2,208 Prepayment penalty on borrowings (Non-interest expense) — — — 7,834 — — — Net amortization of purchase accounting adjustments (Various) (958) (418) (789) 80 — (2,165) — Merger (benefit) expense (Various) 2,096 (490) 973 5,349 422 2,579 1,545 Core income before taxes 38,055 31,597 23,378 22,675 21,237 93,030 42,502 Provision for income taxes for core income 10,226 8,603 6,405 4,891 5,069 25,234 10,537 Core net income $ 27,829 $ 22,994 $ 16,973 $ 17,784 $ 16,168 $ 67,796 $ 31,965 GAAP diluted earnings per common share $ 0.81 $ 0.61 $ 0.60 $ 0.11 $ 0.50 $ 2.02 $ 1.08 Day 1, Provision for Credit Losses - Empire transaction, net of tax — — — 0.05 — — — Net (gain) loss from fair value adjustments, net of tax 0.05 0.15 (0.02) 0.11 0.06 0.18 (0.05) Net loss on sale of securities, net of tax — — — 0.02 — — — Life insurance proceeds — — — — — — (0.02) Net gain on disposition of assets, net of tax — — (0.01) — — (0.01) — Net (gain) loss from fair value adjustments on qualifying hedges, net of tax — 0.02 (0.03) (0.03) (0.01) (0.02) 0.06 Prepayment penalty on borrowings, net of tax — — — 0.20 — — — Net amortization of purchase accounting adjustments, net of tax (0.02) (0.01) (0.02) — — (0.05) — Merger (benefit) expense, net of tax 0.05 (0.01) 0.02 0.14 0.01 0.06 0.04 NYS tax change — (0.02) — — — (0.02) — Core diluted earnings per common share(1) $ 0.88 $ 0.73 $ 0.54 $ 0.58 $ 0.56 $ 2.14 $ 1.11 Core net income, as calculated above $ 27,829 $ 22,994 $ 16,973 $ 17,784 $ 16,168 $ 67,796 $ 31,965 Average assets 8,072,918 8,263,553 8,147,714 7,705,407 7,083,028 8,161,121 7,131,850 Average equity 659,288 644,690 619,647 609,463 576,512 641,354 570,198 Core return on average assets(2) 1.38 % 1.11 % 0.83 % 0.92 % 0.91 % 1.11 % 0.60 % Core return on average equity(2) 16.88 % 14.27 % 10.96 % 11.67 % 11.22 % 14.09 % 7.47 % For the three months ended For the nine months ended September 30, 2021 2020 September 30, March 31, December 31, 2020 2020 September 30, 2021 September 30, June 30, 2021 2021 1 Core diluted earnings per common share may not foot due to rounding 2 Ratios are calculated on an annualized basis Reconciliation of GAAP NII & NIM to CORE and Base NII & NIM |
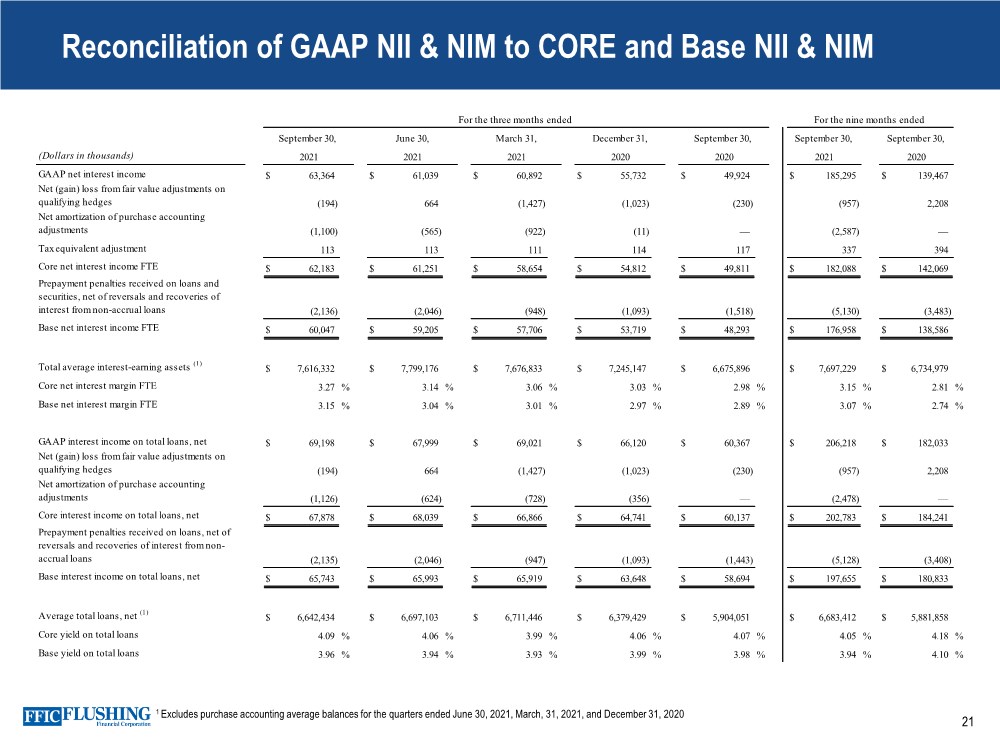
| 21 (Dollars in thousands) GAAP net interest income $ 63,364 $ 61,039 $ 60,892 $ 55,732 $ 49,924 $ 185,295 $ 139,467 Net (gain) loss from fair value adjustments on qualifying hedges (194) 664 (1,427) (1,023) (230) (957) 2,208 Net amortization of purchase accounting adjustments (1,100) (565) (922) (11) — (2,587) — Tax equivalent adjustment 113 113 111 114 117 337 394 Core net interest income FTE $ 62,183 $ 61,251 $ 58,654 $ 54,812 $ 49,811 $ 182,088 $ 142,069 Prepayment penalties received on loans and securities, net of reversals and recoveries of interest from non-accrual loans (2,136) (2,046) (948) (1,093) (1,518) (5,130) (3,483) Base net interest income FTE $ 60,047 $ 59,205 $ 57,706 $ 53,719 $ 48,293 $ 176,958 $ 138,586 Total average interest-earning assets (1) $ 7,616,332 $ 7,799,176 $ 7,676,833 $ 7,245,147 $ 6,675,896 $ 7,697,229 $ 6,734,979 Core net interest margin FTE 3.27 % 3.14 % 3.06 % 3.03 % 2.98 % 3.15 % 2.81 % Base net interest margin FTE 3.15 % 3.04 % 3.01 % 2.97 % 2.89 % 3.07 % 2.74 % GAAP interest income on total loans, net $ 69,198 $ 67,999 $ 69,021 $ 66,120 $ 60,367 $ 206,218 $ 182,033 Net (gain) loss from fair value adjustments on qualifying hedges (194) 664 (1,427) (1,023) (230) (957) 2,208 Net amortization of purchase accounting adjustments (1,126) (624) (728) (356) — (2,478) — Core interest income on total loans, net $ 67,878 $ 68,039 $ 66,866 $ 64,741 $ 60,137 $ 202,783 $ 184,241 Prepayment penalties received on loans, net of reversals and recoveries of interest from non- accrual loans (2,135) (2,046) (947) (1,093) (1,443) (5,128) (3,408) Base interest income on total loans, net $ 65,743 $ 65,993 $ 65,919 $ 63,648 $ 58,694 $ 197,655 $ 180,833 Average total loans, net (1) $ 6,642,434 $ 6,697,103 $ 6,711,446 $ 6,379,429 $ 5,904,051 $ 6,683,412 $ 5,881,858 Core yield on total loans 4.09 % 4.06 % 3.99 % 4.06 % 4.07 % 4.05 % 4.18 % Base yield on total loans 3.96 % 3.94 % 3.93 % 3.99 % 3.98 % 3.94 % 4.10 % For the nine months ended September 30, September 30, 2021 2020 2021 2021 2021 2020 2020 For the three months ended September 30, June 30, March 31, December 31, September 30, 1 Excludes purchase accounting average balances for the quarters ended June 30, 2021, March, 31, 2021, and December 31, 2020 Reconciliation of GAAP NII & NIM to CORE and Base NII & NIM |
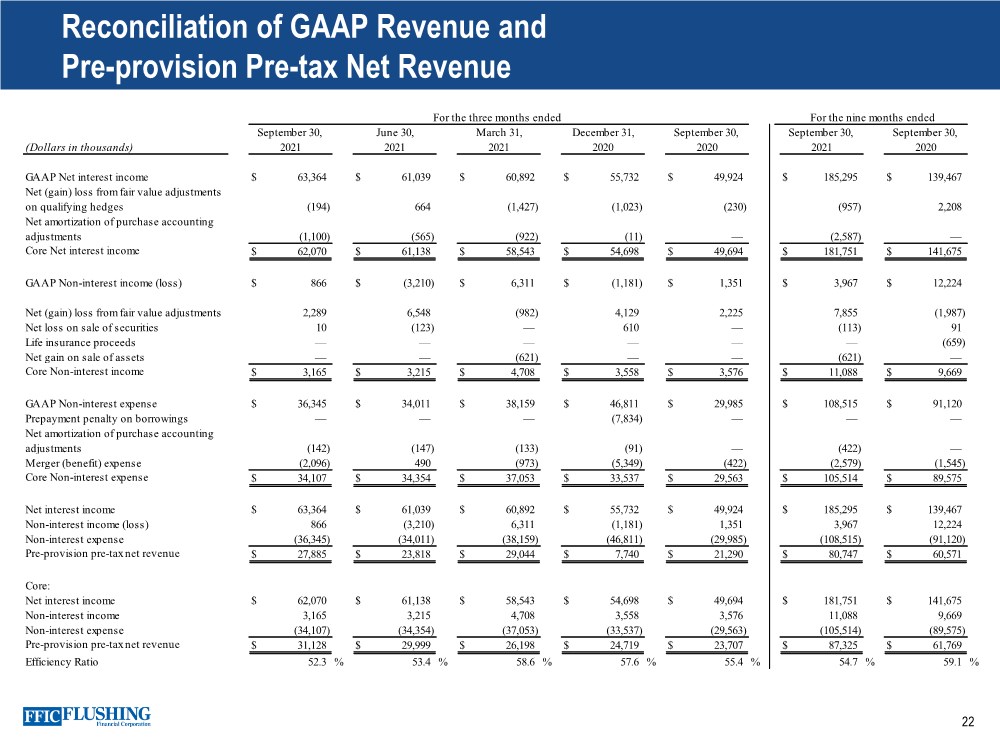
| 22 Reconciliation of GAAP Revenue and Pre-provision Pre-tax Net Revenue (Dollars in thousands) GAAP Net interest income $ 63,364 $ 61,039 $ 60,892 $ 55,732 $ 49,924 $ 185,295 $ 139,467 Net (gain) loss from fair value adjustments on qualifying hedges (194) 664 (1,427) (1,023) (230) (957) 2,208 Net amortization of purchase accounting adjustments (1,100) (565) (922) (11) — (2,587) — Core Net interest income $ 62,070 $ 61,138 $ 58,543 $ 54,698 $ 49,694 $ 181,751 $ 141,675 GAAP Non-interest income (loss) $ 866 $ (3,210) $ 6,311 $ (1,181) $ 1,351 $ 3,967 $ 12,224 Net (gain) loss from fair value adjustments 2,289 6,548 (982) 4,129 2,225 7,855 (1,987) Net loss on sale of securities 10 (123) — 610 — (113) 91 Life insurance proceeds — — — — — — (659) Net gain on sale of assets — — (621) — — (621) — Core Non-interest income $ 3,165 $ 3,215 $ 4,708 $ 3,558 $ 3,576 $ 11,088 $ 9,669 GAAP Non-interest expense $ 36,345 $ 34,011 $ 38,159 $ 46,811 $ 29,985 $ 108,515 $ 91,120 Prepayment penalty on borrowings — — — (7,834) — — — Net amortization of purchase accounting adjustments (142) (147) (133) (91) — (422) — Merger (benefit) expense (2,096) 490 (973) (5,349) (422) (2,579) (1,545) Core Non-interest expense $ 34,107 $ 34,354 $ 37,053 $ 33,537 $ 29,563 $ 105,514 $ 89,575 Net interest income $ 63,364 $ 61,039 $ 60,892 $ 55,732 $ 49,924 $ 185,295 $ 139,467 Non-interest income (loss) 866 (3,210) 6,311 (1,181) 1,351 3,967 12,224 Non-interest expense (36,345) (34,011) (38,159) (46,811) (29,985) (108,515) (91,120) Pre-provision pre-tax net revenue $ 27,885 $ 23,818 $ 29,044 $ 7,740 $ 21,290 $ 80,747 $ 60,571 Core: Net interest income $ 62,070 $ 61,138 $ 58,543 $ 54,698 $ 49,694 $ 181,751 $ 141,675 Non-interest income 3,165 3,215 4,708 3,558 3,576 11,088 9,669 Non-interest expense (34,107) (34,354) (37,053) (33,537) (29,563) (105,514) (89,575) Pre-provision pre-tax net revenue $ 31,128 $ 29,999 $ 26,198 $ 24,719 $ 23,707 $ 87,325 $ 61,769 Efficiency Ratio 52.3 % 53.4 % 58.6 % 57.6 % 55.4 % 54.7 % 59.1 % For the three months ended For the nine months ended September 30, June 30, March 31, December 31, September 30, September 30, September 30, 2020 2021 2021 2021 2020 2020 2021 |
| 23 Contact Details Susan K. Cullen SEVP, CFO & Treasurer Phone: (718) 961-5400 Email: scullen@flushingbank.com Al Savastano, CFA Director of Investor Relations Phone: (516) 820-1146 Email: asavastano@flushingbank.com |

|