| 2 Q22 Earnings Conference Call July 27, 2022 |

| Safe Harbor Statement 2 “Safe Harbor” Statement under the Private Securities Litigation Reform Act of 1995 : Statements in this Presentation relating to plans, strategies, economic performance and trends, projections of results of specific activities or investments and other statements that are not descriptions of historical facts may be forward - looking statements within the meaning of the Private Securities Litigation Reform Act of 1995 , Section 27 A of the Securities Act of 1933 and Section 21 E of the Securities Exchange Act of 1934 .. Forward - looking information is inherently subject to risks and uncertainties, and actual results could differ materially from those currently anticipated due to a number of factors, which include, but are not limited to, risk factors discussed in the Company’s Annual Report on Form 10 - K for the fiscal year ended December 31 , 2021 and in other documents filed by the Company with the Securities and Exchange Commission from time to time .. Forward - looking statements may be identified by terms such as “may”, “will”, “should”, “could”, “expects”, “plans”, “intends”, “anticipates”, “believes”, “estimates”, “predicts”, “forecasts”, “goals”, “potential” or “continue” or similar terms or the negative of these terms .. Although we believe that the expectations reflected in the forward - looking statements are reasonable, we cannot guarantee future results, levels of activity, performance or achievements .. The Company has no obligation to update these forward - looking statements .. |
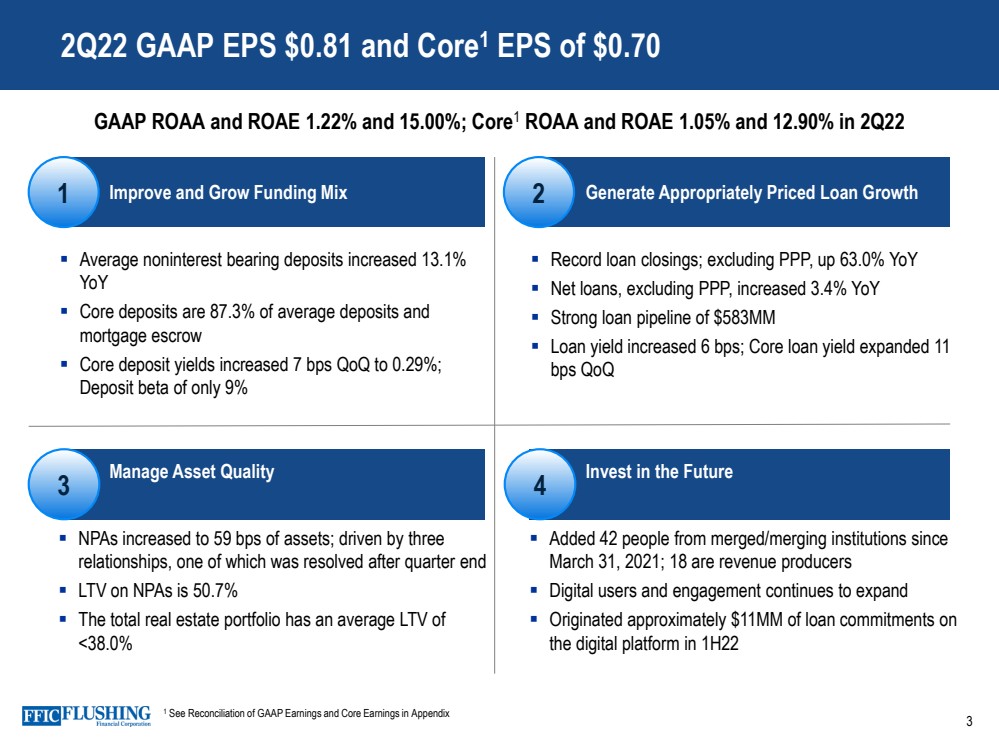
| 3 4 1 2 Improve and Grow Funding Mix Generate Appropriately Priced Loan Growth Average noninterest bearing deposits increased 13.1% YoY Core deposits are 87.3% of average deposits and mortgage escrow Core deposit yields increased 7 bps QoQ to 0.29%; Deposit beta of only 9% Record loan closings; excluding PPP, up 63.0% YoY Net loans , excluding PPP, increased 3.4 % YoY Strong loan pipeline of $583MM Loan yield increased 6 bps; Core loan yield expanded 11 bps QoQ Manage Asset Quality Invest in the Future NPAs increased to 59 bps of assets; driven by three relationships, one of which was resolved after quarter end LTV on NPAs is 50.7% The total real estate portfolio has an average LTV of <38.0% Added 42 people from merged/merging institutions since March 31, 2021; 18 are revenue producers Digital users and engagement continues to expand Originated approximately $11MM of loan commitments on the digital platform in 1H22 2Q22 GAAP EPS $ 0.81 and Core 1 EPS of $ 0.70 3 GAAP ROAA and ROAE 1.22% and 15.00%; Core 1 ROAA and ROAE 1.05% and 12.90% in 2Q22 1 See Reconciliation of GAAP Earnings and Core Earnings in Appendix |
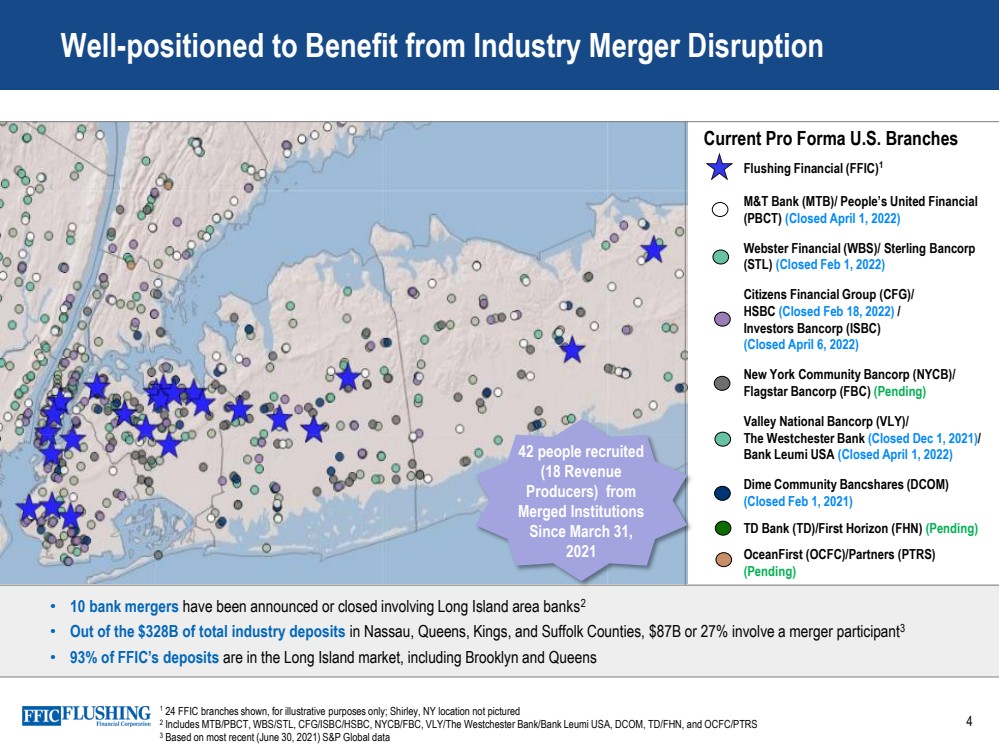
| 4 Well - positioned to Benefit from Industry Merger Disruption • 10 bank mergers have been announced or closed involving Long Island area banks 2 • Out of the $328B of total industry deposits in Nassau, Queens, Kings, and Suffolk Counties, $87B or 27% involve a merger participant 3 • 93% of FFIC’s deposits are in the Long Island market, including Brooklyn and Queens Flushing Financial (FFIC) 1 M&T Bank (MTB )/ People’s United Financial (PBCT ) (Closed April 1, 2022) Webster Financial (WBS )/ Sterling Bancorp (STL ) (Closed Feb 1, 2022) Citizens Financial Group (CFG)/ HSBC (Closed Feb 18, 2022) / Investors Bancorp (ISBC ) ( Closed April 6, 2022) New York Community Bancorp (NYCB)/ Flagstar Bancorp (FBC ) (Pending) Valley National Bancorp (VLY)/ The Westchester Bank ( Closed Dec 1, 2021) / Bank Leumi USA (Closed April 1, 2022) Dime Community Bancshares (DCOM) (Closed Feb 1, 2021) TD Bank (TD)/First Horizon (FHN) (Pending) OceanFirst (OCFC)/Partners (PTRS) (Pending) Current Pro Forma U.S. Branches 1 24 FFIC branches shown, for illustrative purposes only; Shirley , NY location not pictured 2 Includes MTB/PBCT, WBS/STL, CFG/ISBC/HSBC, NYCB/FBC, VLY/The Westchester Bank/Bank Leumi USA, DCOM, TD/FHN, and OCFC/PTRS 3 Based on most recent (June 30, 2021) S&P Global data 42 people recruited ( 18 Revenue Producers) from Merged Institutions Since March 31, 2021 |
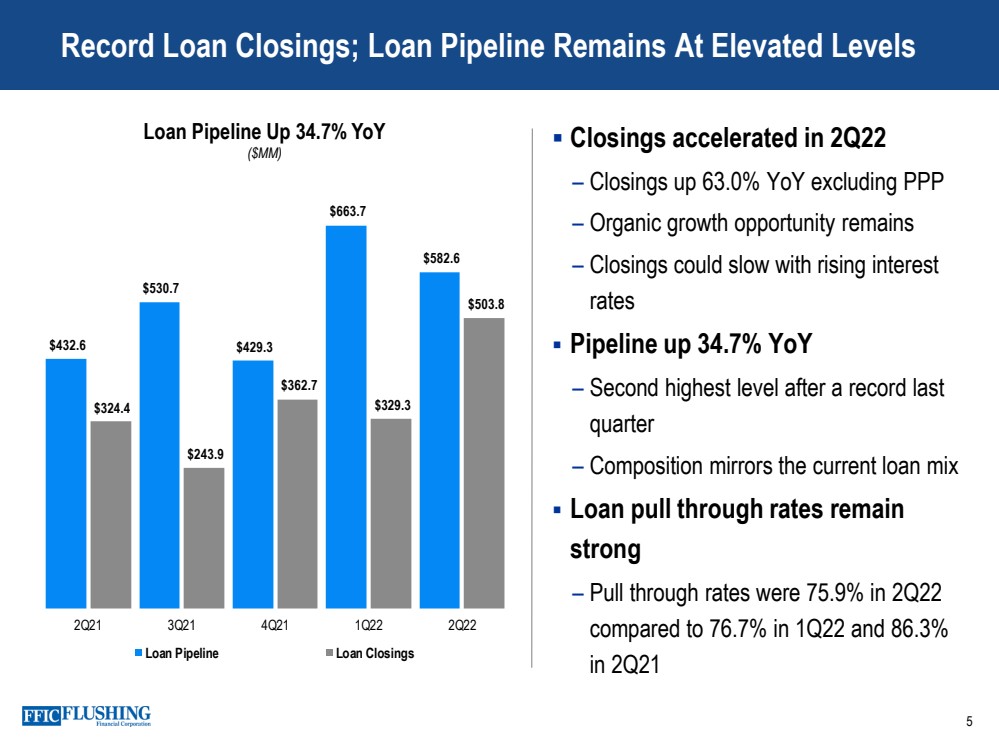
| Record Loan Closings; Loan Pipeline Remains At Elevated Levels 5 Closings accelerated in 2Q22 – Closings up 63.0% YoY excluding PPP – Organic growth opportunity remains – Closings could slow with rising interest rates Pipeline up 34.7% YoY – Second highest level after a record last quarter – Composition mirrors the current loan mix Loan pull through rates remain strong – Pull through rates were 75.9% in 2Q22 compared to 76.7% in 1Q22 and 86.3% in 2Q21 Loan Pipeline Up 34.7% YoY ($MM) $432.6 $530.7 $429.3 $663.7 $582.6 $324.4 $243.9 $362.7 $329.3 $503.8 $- $100.0 $200.0 $300.0 $400.0 $500.0 $600.0 $700.0 2Q21 3Q21 4Q21 1Q22 2Q22 Loan Pipeline Loan Closings |
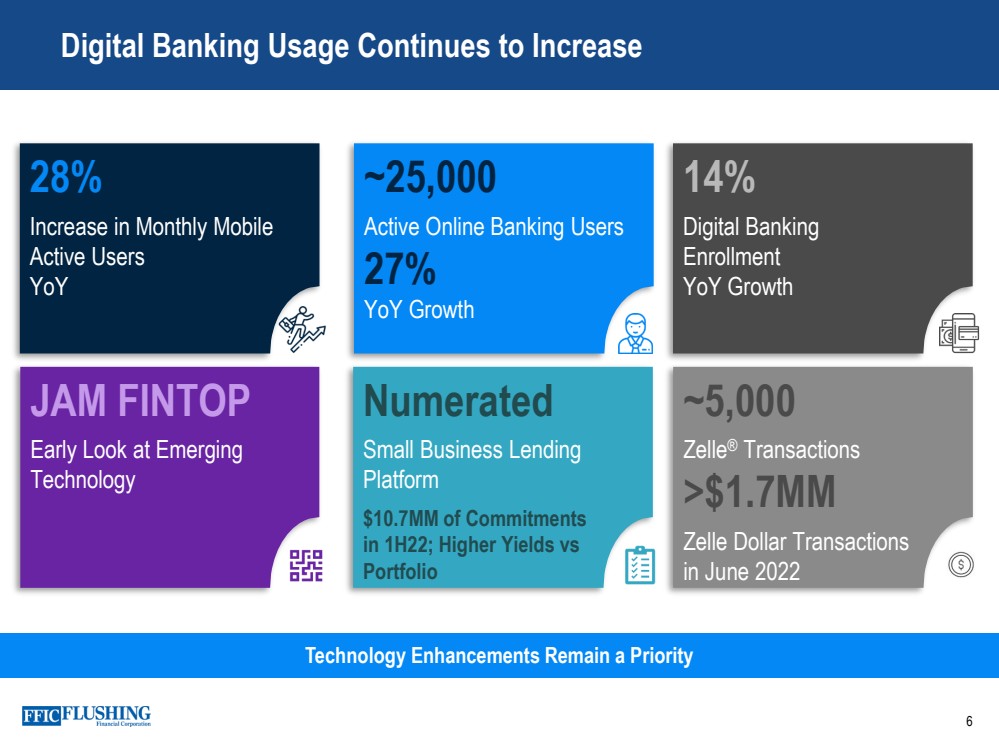
| Digital Banking Usage Continues to Increase 6 Technology Enhancements Remain a Priority 28% Increase in Monthly Mobile Active Users YoY ~ 25,000 Active Online Banking Users 27% YoY Growth 14% Digital Banking Enrollment YoY Growth Numerated Small Business Lending Platform $10.7MM of Commitments in 1H22; Higher Yields vs Portfolio JAM FINTOP Early Look at Emerging Technology ~5,000 Zelle ® Transactions >$1.7MM Zelle Dollar Transactions in June 2022 |
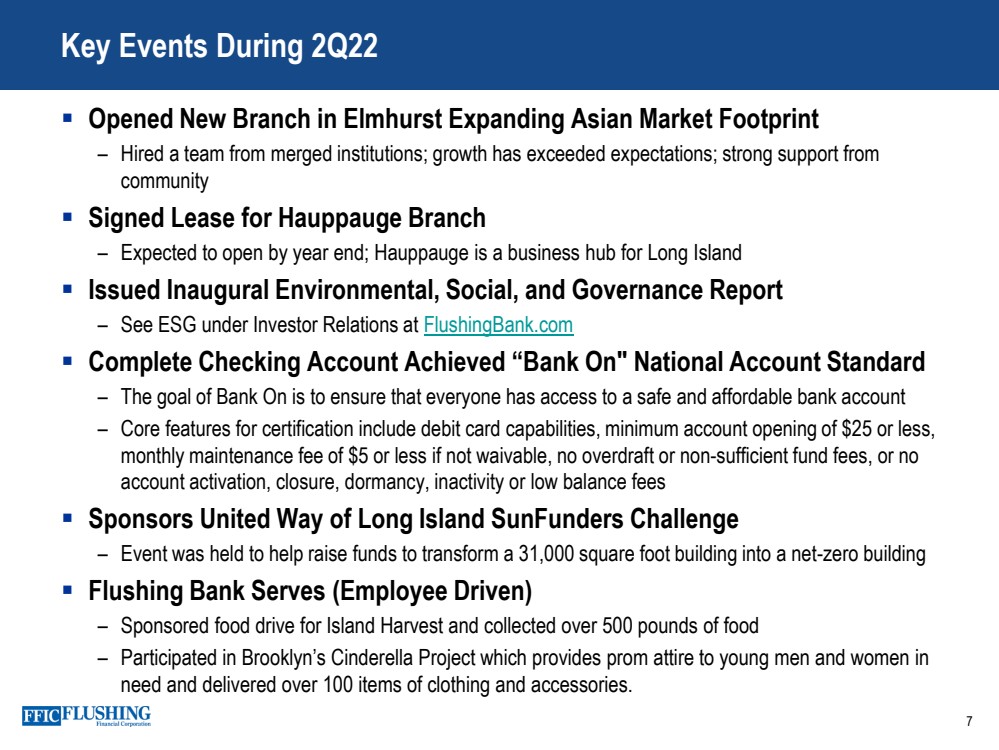
| Opened New Branch in Elmhurst Expanding Asian Market Footprint – Hired a team from merged institutions; growth has exceeded expectations; strong support from community Signed Lease for Hauppauge Branch – Expected to open by year end; Hauppauge is a business hub for Long Island Issued Inaugural Environmental, Social, and Governance Report – See ESG under Investor Relations at FlushingBank.com Complete Checking Account Achieved “Bank On" National Account Standard – The goal of Bank On is to ensure that everyone has access to a safe and affordable bank account – Core features for certification include debit card capabilities, minimum account opening of $25 or less, monthly maintenance fee of $5 or less if not waivable, no overdraft or non - sufficient fund fees, or no account activation, closure, dormancy, inactivity or low balance fees Sponsors United Way of Long Island SunFunders Challenge – Event was held to help raise funds to transform a 31,000 square foot building into a net - zero building Flushing Bank Serves (Employee Driven) – Sponsored food drive for Island Harvest and collected over 500 pounds of food – Participated in Brooklyn’s Cinderella Project which provides prom attire to young men and women in need and delivered over 100 items of clothing and accessories. 7 Key Events During 2Q22 |
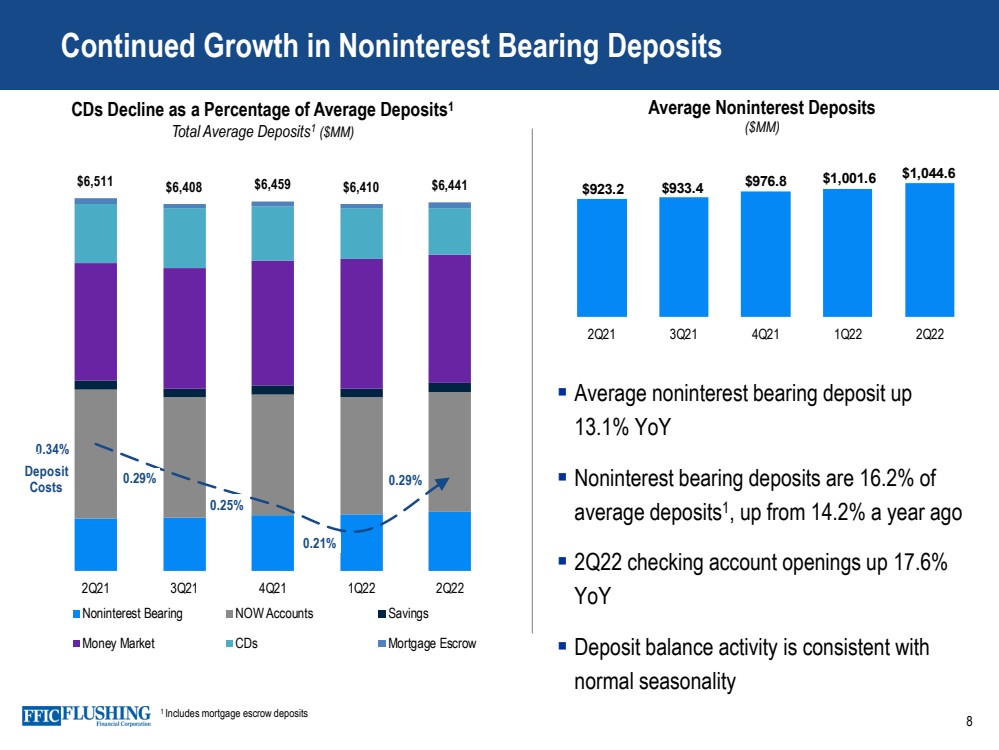
| Continued Growth in Noninterest Bearing Deposits 8 CDs Decline as a Percentage of Average Deposits 1 Total Average Deposits 1 ($MM) 1 Includes mortgage escrow deposits Average noninterest bearing deposit up 13.1% YoY Noninterest bearing deposits are 16.2% of average deposits 1 , up from 14.2% a year ago 2Q22 checking account openings up 17.6% YoY Deposit balance activity is consistent with normal seasonality $6,511 $6,408 $6,459 $6,410 $6,441 0.34% 0.29% 0.25% 0.21% 0.29% 0% 0% 0% 0% 1% 1% 1% 0 1000 2000 3000 4000 5000 6000 7000 2Q21 3Q21 4Q21 1Q22 2Q22 Noninterest Bearing NOW Accounts Savings Money Market CDs Mortgage Escrow Deposit Costs Average Noninterest Deposits ($MM) $923.2 $933.4 $976.8 $1,001.6 $1,044.6 -100 100 300 500 700 900 1100 1300 2Q21 3Q21 4Q21 1Q22 2Q22 |
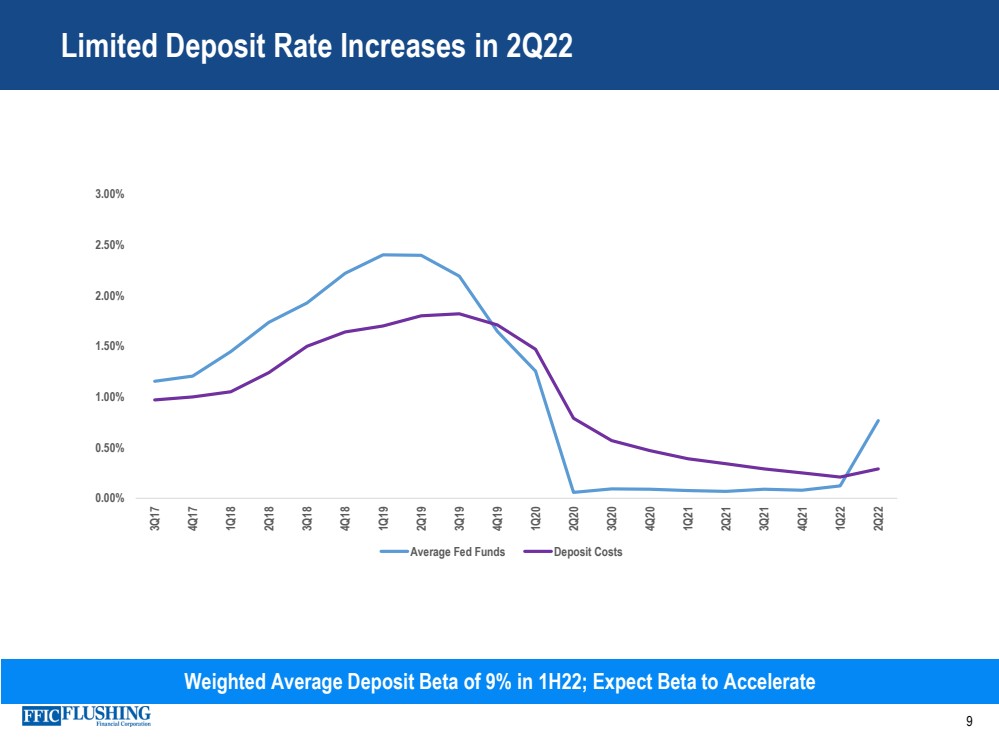
| Limited Deposit Rate Increases in 2Q22 9 Weighted Average Deposit Beta of 9% in 1H22; Expect Beta to Accelerate 0.00% 0.50% 1.00% 1.50% 2.00% 2.50% 3.00% 3Q17 4Q17 1Q18 2Q18 3Q18 4Q18 1Q19 2Q19 3Q19 4Q19 1Q20 2Q20 3Q20 4Q20 1Q21 2Q21 3Q21 4Q21 1Q22 2Q22 Average Fed Funds Deposit Costs |
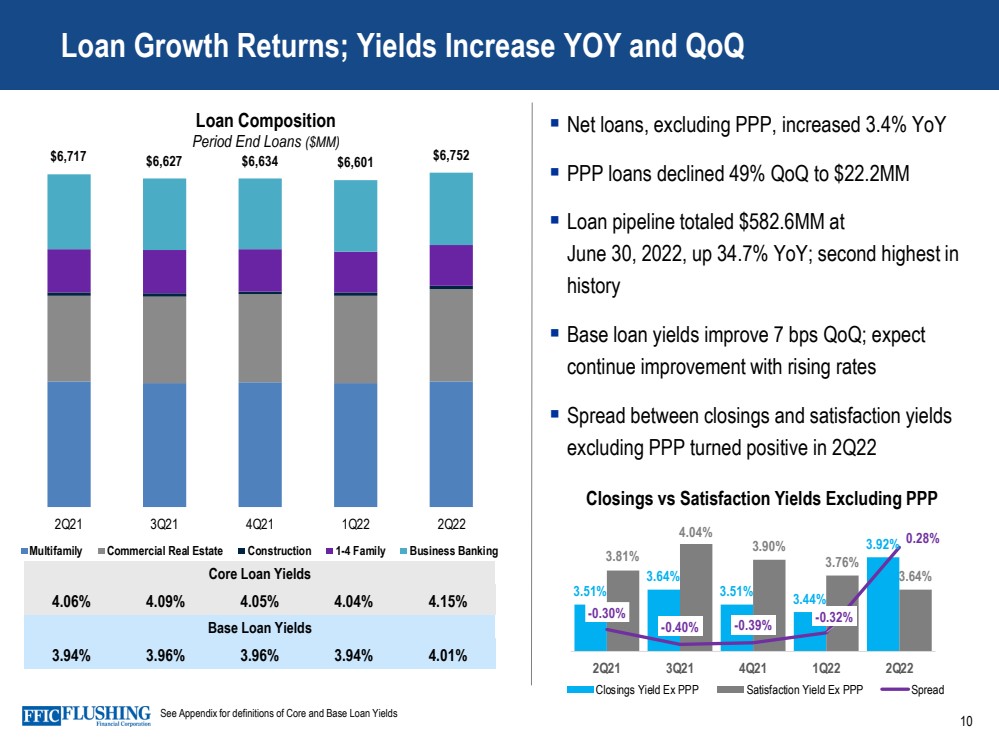
| $6,717 $6,627 $6,634 $6,601 $6,752 - 1,000 2,000 3,000 4,000 5,000 6,000 7,000 8,000 2Q21 3Q21 4Q21 1Q22 2Q22 Multifamily Commercial Real Estate Construction 1-4 Family Business Banking Loan Growth Returns; Yields Increase YOY and QoQ 10 Core Loan Yields 4.06% 4.09% 4.05% 4.04% 4.15% Loan Composition Period End Loans ($MM) Base Loan Yields 3.94% 3.96% 3.96% 3.94% 4.01% Net loans, excluding PPP, increased 3.4% YoY PPP loans declined 49% QoQ to $22.2MM Loan pipeline totaled $582.6MM at June 30, 2022, up 34.7% YoY; second highest in history Base loan yields improve 7 bps QoQ; expect continue improvement with rising rates Spread between closings and satisfaction yields excluding PPP turned positive in 2Q22 See Appendix for definitions of Core and Base Loan Yields Closings vs Satisfaction Yields Excluding PPP 3.51% 3.64% 3.51% 3.44% 3.92% 3.81% 4.04% 3.90% 3.76% 3.64% - 0.30% - 0.40% - 0.39% - 0.32% 0.28% -0.45% -0.35% -0.25% -0.15% -0.05% 0.05% 0.15% 0.25% 0.35% 3.10% 3.20% 3.30% 3.40% 3.50% 3.60% 3.70% 3.80% 3.90% 4.00% 4.10% 2Q21 3Q21 4Q21 1Q22 2Q22 Closings Yield Ex PPP Satisfaction Yield Ex PPP Spread |
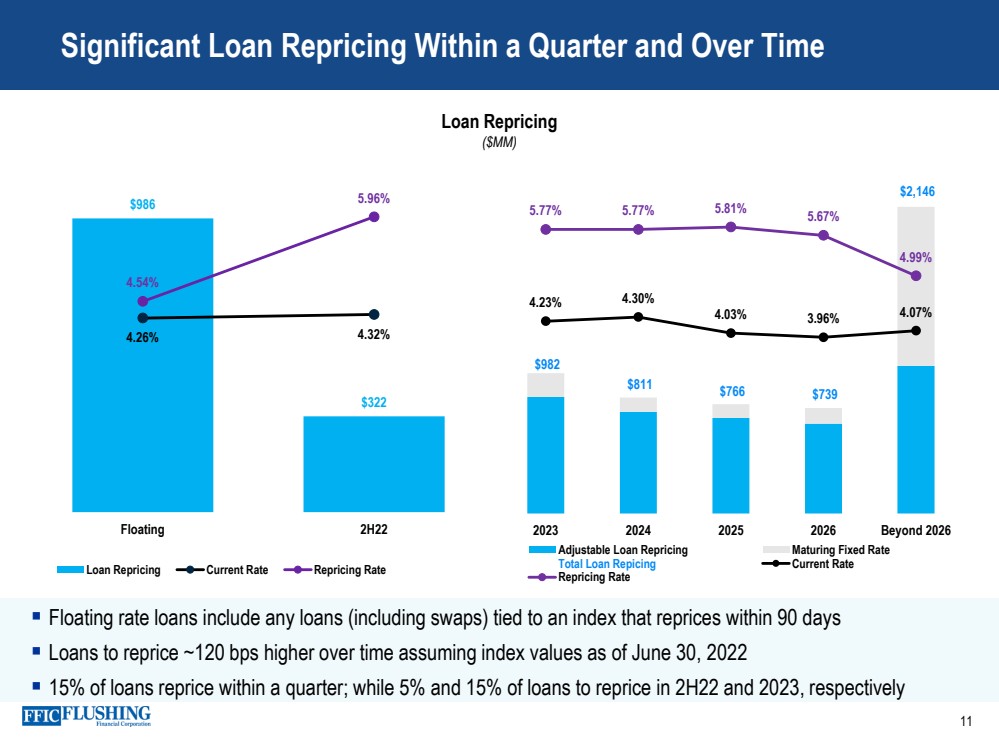
| Significant Loan Repricing Within a Quarter and Over Time 11 Floating rate loans include any loans (including swaps) tied to an index that reprices within 90 days Loans to reprice ~120 bps higher over time assuming index values as of June 30, 2022 15% of loans reprice within a q uarter ; while 5% and 15% of loans to reprice in 2H22 and 2023, respectively Loan Repricing ($MM) $986 $322 4.26% 4.32% 4.54% 5.96% - 200 400 600 800 1,000 1,200 Floating 2H22 Loan Repricing Current Rate Repricing Rate $982 $811 $766 $739 $2,146 4.23% 4.30% 4.03% 3.96% 4.07% 5.77% 5.77% 5.81% 5.67% 4.99% - 500 1,000 1,500 2,000 2,500 2023 2024 2025 2026 Beyond 2026 Adjustable Loan Repricing Maturing Fixed Rate Total Loan Repicing Current Rate Repricing Rate |
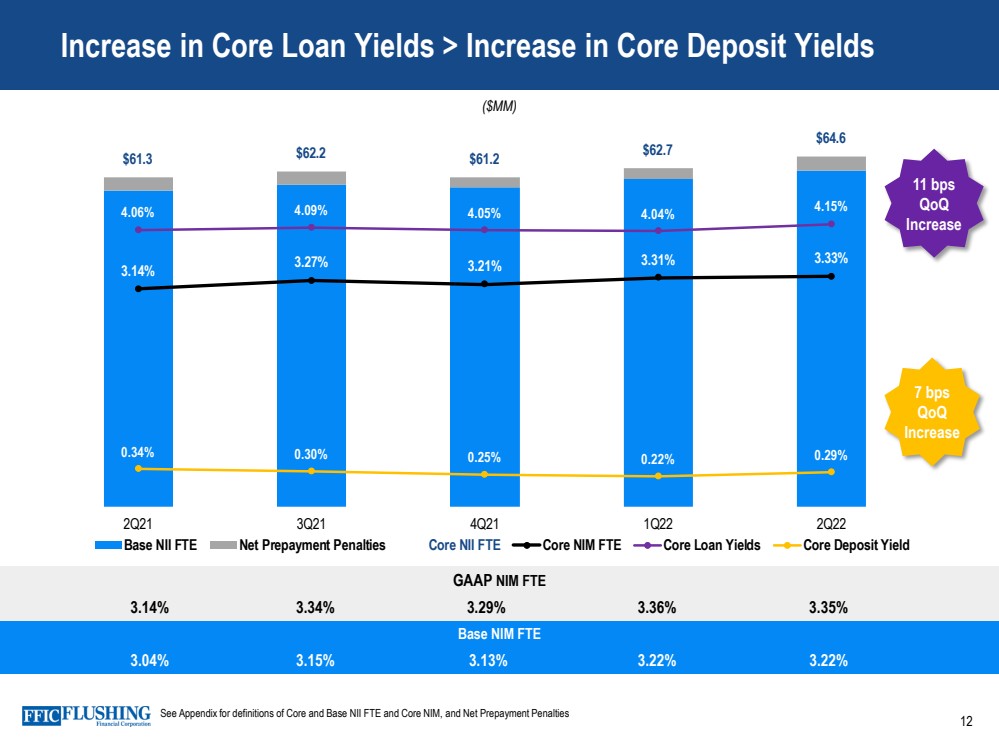
| Increase in Core Loan Yields > Increase in Core Deposit Yields 12 Base NIM FTE 3.04% 3.15% 3.13% 3.22% 3.22% GAAP NIM FTE 3.14% 3.34% 3.29% 3.36% 3.35% $61.3 $62.2 $61.2 $62.7 $64.6 3.14% 3.27% 3.21% 3.31% 3.33% 4.06% 4.09% 4.05% 4.04% 4.15% 0.34% 0.30% 0.25% 0.22% 0.29% -0.25% 0.75% 1.75% 2.75% 3.75% 4.75% 5.75% $10.0 $20.0 $30.0 $40.0 $50.0 $60.0 $70.0 2Q21 3Q21 4Q21 1Q22 2Q22 Base NII FTE Net Prepayment Penalties Core NII FTE Core NIM FTE Core Loan Yields Core Deposit Yield ($MM) See Appendix for definitions of Core and Base NII FTE and Core NIM, and Net Prepayment Penalties 11 bps QoQ Increase 7 bps QoQ Increase |
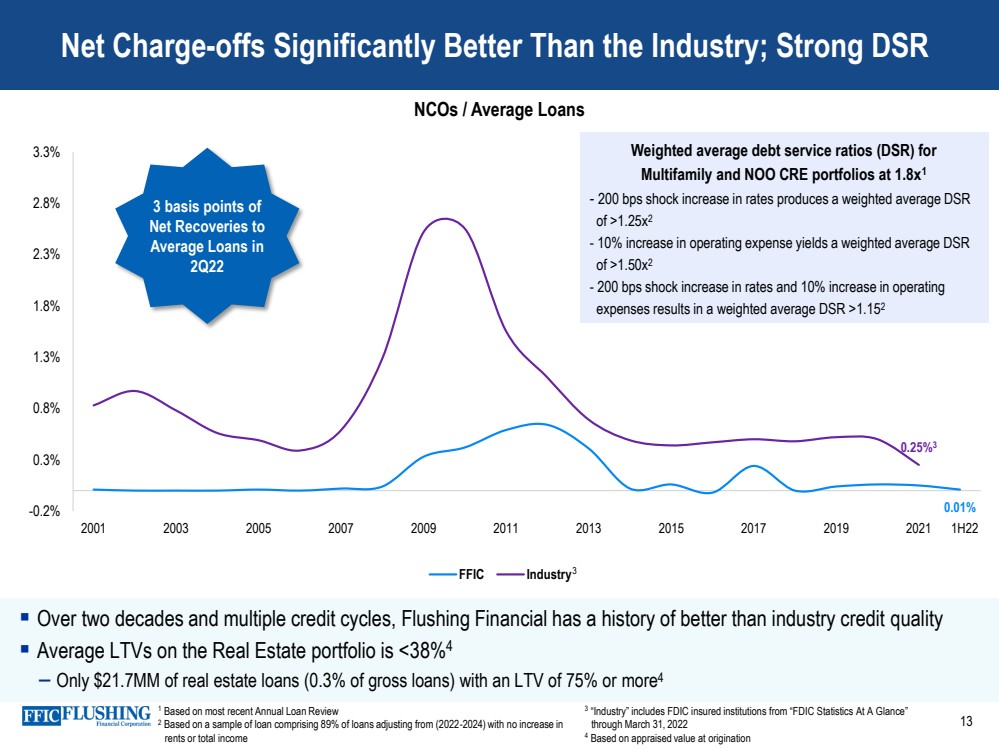
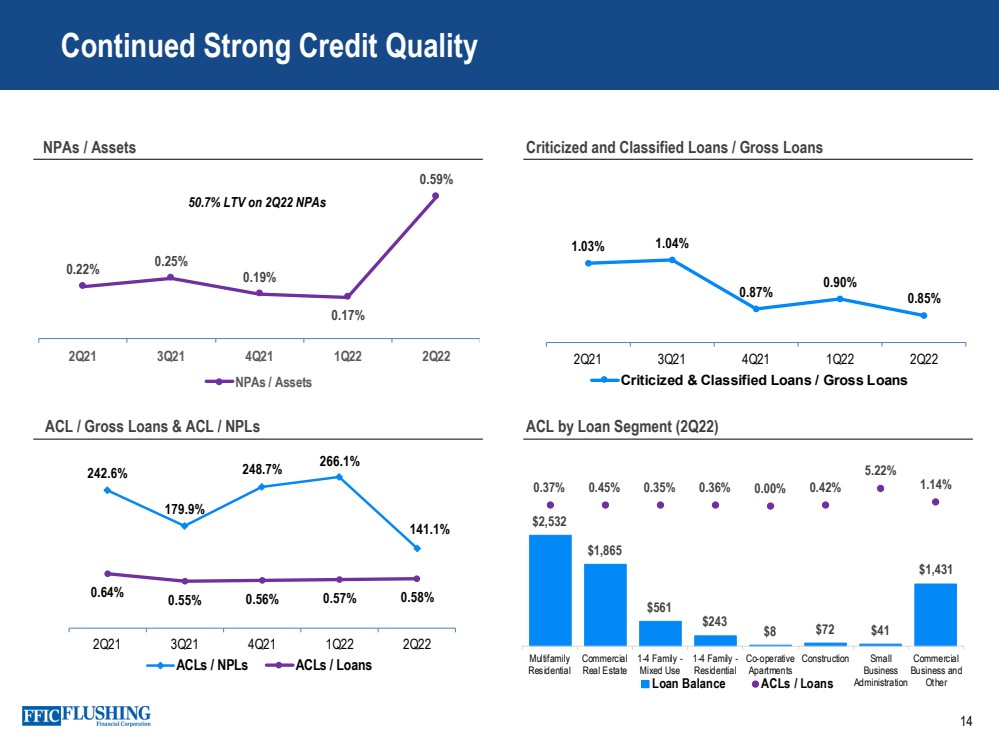
| Over two decades and multiple credit cycles, Flushing Financial has a history of better than industry credit quality Average LTVs on the Real Estate portfolio is < 38% 4 – Only $21.7MM of real estate loans (0.3% of gross loans) with an LTV of 75% or more 4 Net Charge - offs Significantly Better Than the Industry; Strong DSR 13 NCOs / Average Loans 0.01% 0.25% 3 -0.2% 0.3% 0.8% 1.3% 1.8% 2.3% 2.8% 3.3% 2001 2003 2005 2007 2009 2011 2013 2015 2017 2019 2021 FFIC Industry 3 basis points of Net Recoveries to Average Loans in 2 Q22 1H22 Weighted average debt service ratios (DSR) for Multifamily and NOO CRE portfolios at 1.8x 1 - 200 bps shock increase in rates produces a weighted average DSR of >1.25x 2 - 10% increase in operating expense yields a weighted average DSR of >1.50x 2 - 200 bps shock increase in rates and 10% increase in operating expenses results in a weighted average DSR > 1.15 2 3 1 Based on most recent Annual Loan Review 2 Based on a sample of loan comprising 89% of loans adjusting from (2022 - 2024) with no increase in rents or total income 3 “Industry” includes FDIC insured institutions from “FDIC Statistics At A Glance” through March 31, 2022 4 Based on appraised value at origination |
| 0.22% 0.25% 0.19% 0.17% 0.59% 2Q21 3Q21 4Q21 1Q22 2Q22 NPAs / Assets 14 Continued Strong Credit Quality NPAs / Assets Criticized and Classified Loans / Gross Loans ACL / Gross Loans & ACL / NPLs ACL by Loan Segment (2Q22) 50.7% LTV on 2 Q22 NPAs 1.03% 1.04% 0.87% 0.90% 0.85% 0.75% 0.85% 0.95% 1.05% 1.15% 1.25% 1.35% 2Q21 3Q21 4Q21 1Q22 2Q22 Criticized & Classified Loans / Gross Loans $2,532 $1,865 $561 $243 $8 $72 $41 $1,431 0.37% 0.45% 0.35% 0.36% 0.00% 0.42% 5.22% 1.14% -40.00% -35.00% -30.00% -25.00% -20.00% -15.00% -10.00% -5.00% 0.00% 5.00% 10.00% Multifamily Residential Commercial Real Estate 1-4 Family - Mixed Use 1-4 Family - Residential Co-operative Apartments Construction Small Business Administration Commercial Business and Other Loan Balance ACLs / Loans 242.6% 179.9% 248.7% 266.1% 141.1% 0.64% 0.55% 0.56% 0.57% 0.58% 0% 0% 0% 1% 1% 1% 1% 1% 2% 2% 2% 0% 50% 100% 150% 200% 250% 300% 2Q21 3Q21 4Q21 1Q22 2Q22 ACLs / NPLs ACLs / Loans |
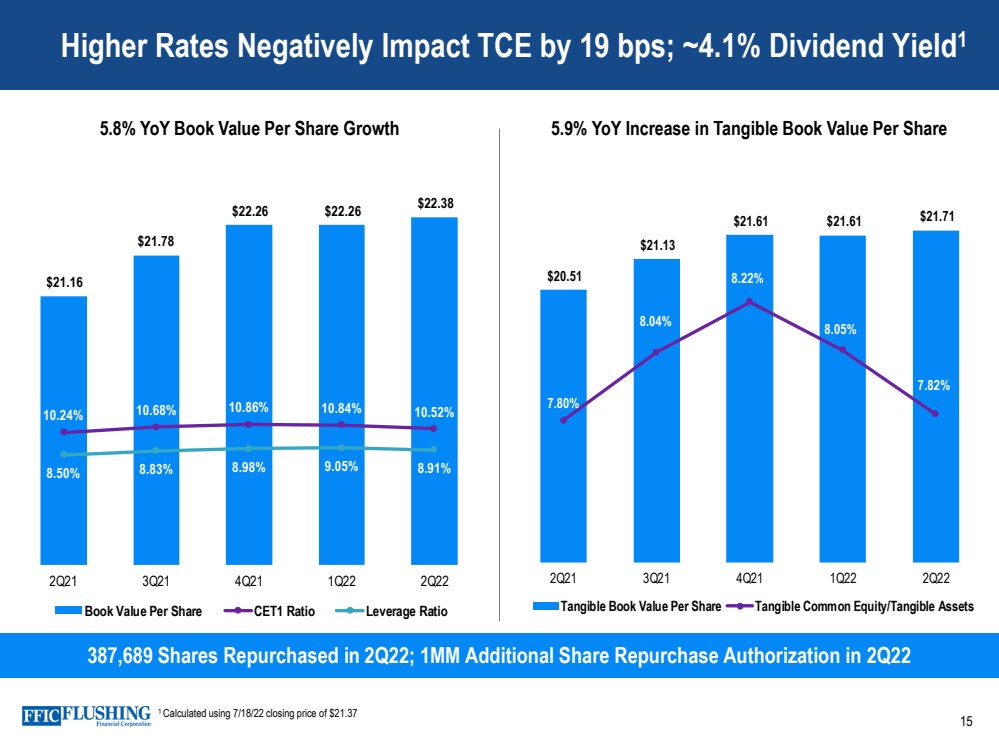
| Higher Rates Negatively Impact TCE by 19 bps; ~4.1% Dividend Yield 1 15 387,689 Shares Repurchased in 2Q22; 1MM Additional Share Repurchase Authorization in 2Q22 5.8% YoY Book Value Per Share Growth 5.9 % YoY Increase in Tangible Book Value Per Share 1 Calculated using 7/18/22 closing price of $ 21.37 $20.51 $21.13 $21.61 $21.61 $21.71 7.80% 8.04% 8.22% 8.05% 7.82% 7.30% 7.50% 7.70% 7.90% 8.10% 8.30% 8.50% 8.70% $15.00 $16.00 $17.00 $18.00 $19.00 $20.00 $21.00 $22.00 $23.00 2Q21 3Q21 4Q21 1Q22 2Q22 Tangible Book Value Per Share Tangible Common Equity/Tangible Assets $21.16 $21.78 $22.26 $22.26 $22.38 10.24% 10.68% 10.86% 10.84% 10.52% 8.50% 8.83% 8.98% 9.05% 8.91% 0.00% 5.00% 10.00% 15.00% 20.00% 25.00% 30.00% $17.00 $18.00 $19.00 $20.00 $21.00 $22.00 $23.00 2Q21 3Q21 4Q21 1Q22 2Q22 Book Value Per Share CET1 Ratio Leverage Ratio |
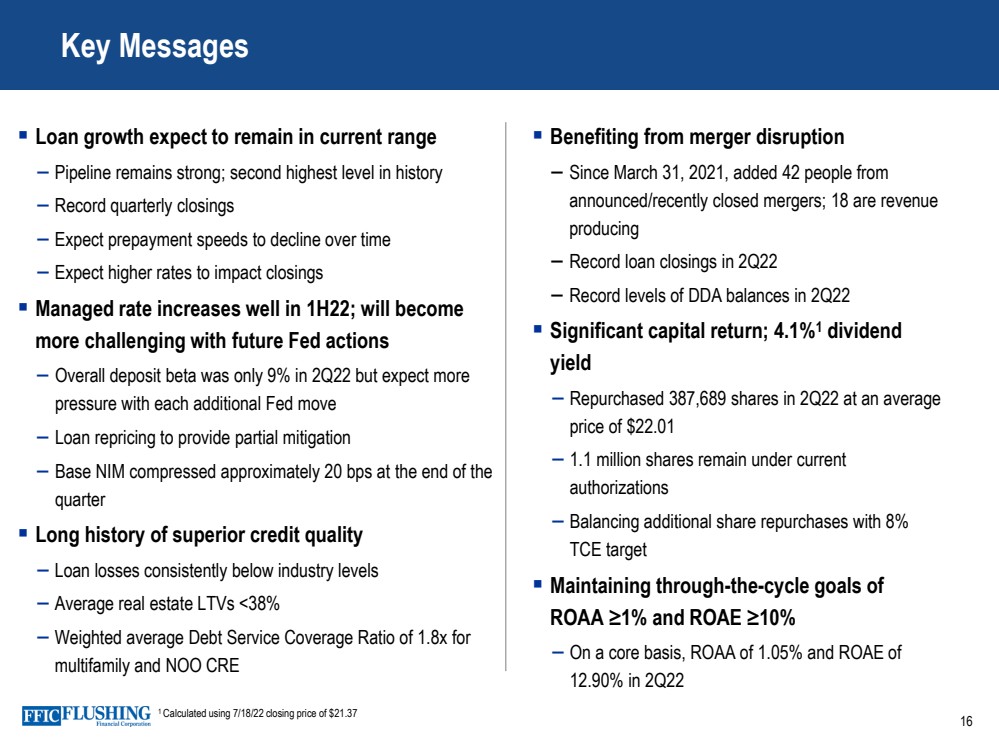
| 16 Benefiting from merger disruption – Since March 31, 2021, added 42 people from announced/recently closed mergers; 18 are revenue producing – Record loan closings in 2Q22 – Record levels of DDA balances in 2Q22 Significant capital return; 4.1% 1 dividend yield – Repurchased 387,689 shares in 2Q22 at an average price of $22.01 – 1.1 million shares remain under current authorizations – Balancing additional share repurchases with 8% TCE target Maintaining through - the - cycle goals of ROAA ≥1% and ROAE ≥10% – On a core basis, ROAA of 1.05% and ROAE of 12.90% in 2Q22 Loan growth expect to remain in current range – Pipeline remains strong; second highest level in history – Record quarterly closings – Expect prepayment speeds to decline over time – Expect higher rates to impact closings Managed rate increases well in 1H22 ; will become more challenging with future Fed actions – Overall deposit beta was only 9% in 2Q22 but expect more pressure with each additional Fed move – Loan repricing to provide partial mitigation – Base NIM compressed approximately 20 bps at the end of the quarter Long history of superior credit quality – Loan losses consistently below industry levels – Average real estate LTVs <38% – Weighted average Debt Service Coverage Ratio of 1.8x for multifamily and NOO CRE Key Messages 1 Calculated using 7/18/22 closing price of $21.37 |
| Appendix 17 |

| Reconciliation of GAAP Earnings and Core Earnings 18 Non - cash Fair Value Adjustments to GAAP Earnings The variance in GAAP and core earnings is partly driven by the impact of non - cash net gains and losses from fair value adjustments .. These fair value adjustments relate primarily to swaps designated to protect against rising rates and borrowing carried at fair value under the fair value option .. As the swaps get closer to maturity, the volatility in fair value adjustments will dissipate .. In a declining interest rate environment, the movement in the curve exaggerates our mark - to - market loss position .. In a rising interest rate environment or a steepening of the yield curve, the loss position would experience an improvement .. Core Net Income, Core Diluted EPS, Core ROAE, Core ROAA, Pre - provision, Pre - tax Net Revenue, Core Net Interest Income FTE, Core Net Interest Margin FTE, Base Net Interest Income FTE, Base Net Interest Margin FTE, Core Interest Income and Yield on Total Loans, Base Interest Income and Yield on Total Loans, Core Noninterest Income, Core Noninterest Expense and Tangible Book Value per common share are each non - GAAP measures used in this presentation .. A reconciliation to the most directly comparable GAAP financial measures appears below in tabular form .. The Company believes that these measures are useful for both investors and management to understand the effects of certain interest and noninterest items and provide an alternative view of the Company's performance over time and in comparison to the Company's competitors .. These measures should not be viewed as a substitute for net income .. The Company believes that tangible book value per common share is useful for both investors and management as these are measures commonly used by financial institutions, regulators and investors to measure the capital adequacy of financial institutions .. The Company believes these measures facilitate comparison of the quality and composition of the Company's capital over time and in comparison to its competitors .. These measures should not be viewed as a substitute for total shareholders' equity .. These non - GAAP measures have inherent limitations, are not required to be uniformly applied and are not audited .. They should not be considered in isolation or as a substitute for analysis of results reported under GAAP .. These non - GAAP measures may not be comparable to similarly titled measures reported by other companies .. |
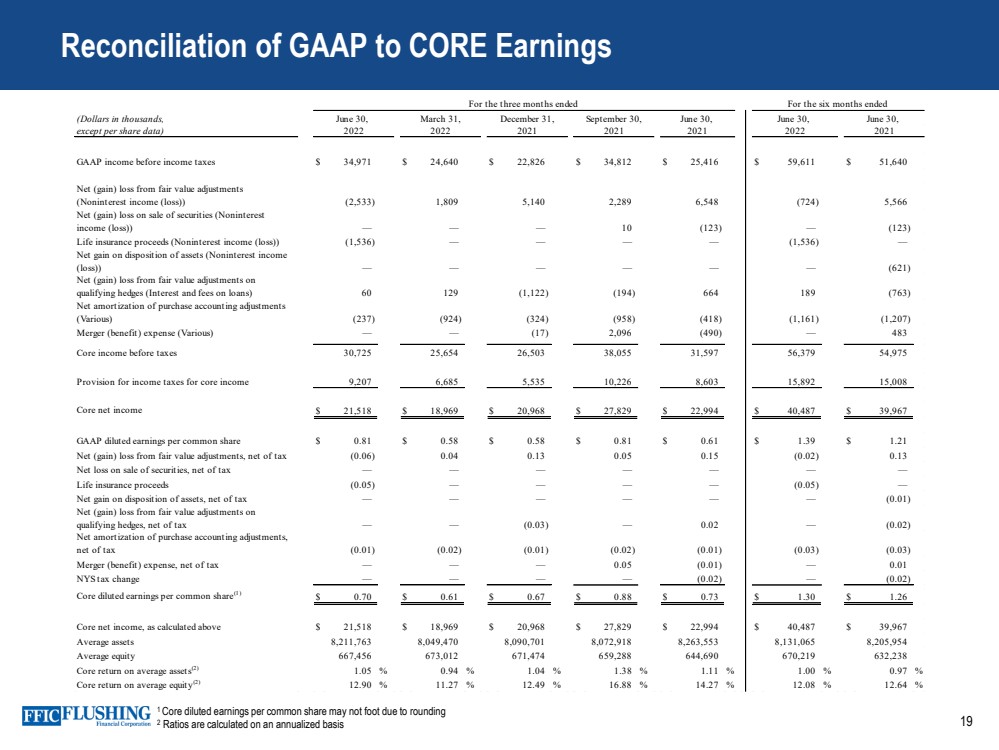
| 19 1 Core diluted earnings per common share may not foot due to rounding 2 Ratios are calculated on an annualized basis Reconciliation of GAAP to CORE Earnings (Dollars in thousands, except per share data) GAAP income before income taxes $ 34,971 $ 24,640 $ 22,826 $ 34,812 $ 25,416 $ 59,611 $ 51,640 Net (gain) loss from fair value adjustments (Noninterest income (loss)) (2,533) 1,809 5,140 2,289 6,548 (724) 5,566 Net (gain) loss on sale of securities (Noninterest income (loss)) — — — 10 (123) — (123) Life insurance proceeds (Noninterest income (loss)) (1,536) — — — — (1,536) — Net gain on disposition of assets (Noninterest income (loss)) — — — — — — (621) Net (gain) loss from fair value adjustments on qualifying hedges (Interest and fees on loans) 60 129 (1,122) (194) 664 189 (763) Net amortization of purchase accounting adjustments (Various) (237) (924) (324) (958) (418) (1,161) (1,207) Merger (benefit) expense (Various) — — (17) 2,096 (490) — 483 Core income before taxes 30,725 25,654 26,503 38,055 31,597 56,379 54,975 Provision for income taxes for core income 9,207 6,685 5,535 10,226 8,603 15,892 15,008 Core net income $ 21,518 $ 18,969 $ 20,968 $ 27,829 $ 22,994 $ 40,487 $ 39,967 GAAP diluted earnings per common share $ 0.81 $ 0.58 $ 0.58 $ 0.81 $ 0.61 $ 1.39 $ 1.21 Net (gain) loss from fair value adjustments, net of tax (0.06) 0.04 0.13 0.05 0.15 (0.02) 0.13 Net loss on sale of securities, net of tax — — — — — — — Life insurance proceeds (0.05) — — — — (0.05) — Net gain on disposition of assets, net of tax — — — — — — (0.01) Net (gain) loss from fair value adjustments on qualifying hedges, net of tax — — (0.03) — 0.02 — (0.02) Net amortization of purchase accounting adjustments, net of tax (0.01) (0.02) (0.01) (0.02) (0.01) (0.03) (0.03) Merger (benefit) expense, net of tax — — — 0.05 (0.01) — 0.01 NYS tax change — — — — (0.02) — (0.02) Core diluted earnings per common share (1) $ 0.70 $ 0.61 $ 0.67 $ 0.88 $ 0.73 $ 1.30 $ 1.26 Core net income, as calculated above $ 21,518 $ 18,969 $ 20,968 $ 27,829 $ 22,994 $ 40,487 $ 39,967 Average assets 8,211,763 8,049,470 8,090,701 8,072,918 8,263,553 8,131,065 8,205,954 Average equity 667,456 673,012 671,474 659,288 644,690 670,219 632,238 Core return on average assets (2) 1.05 % 0.94 % 1.04 % 1.38 % 1.11 % 1.00 % 0.97 % Core return on average equity (2) 12.90 % 11.27 % 12.49 % 16.88 % 14.27 % 12.08 % 12.64 % 2022 June 30, March 31, 2022 2021 June 30, 2022 2021 June 30, December 31, September 30, 2021 2021 June 30, For the three months ended For the six months ended |
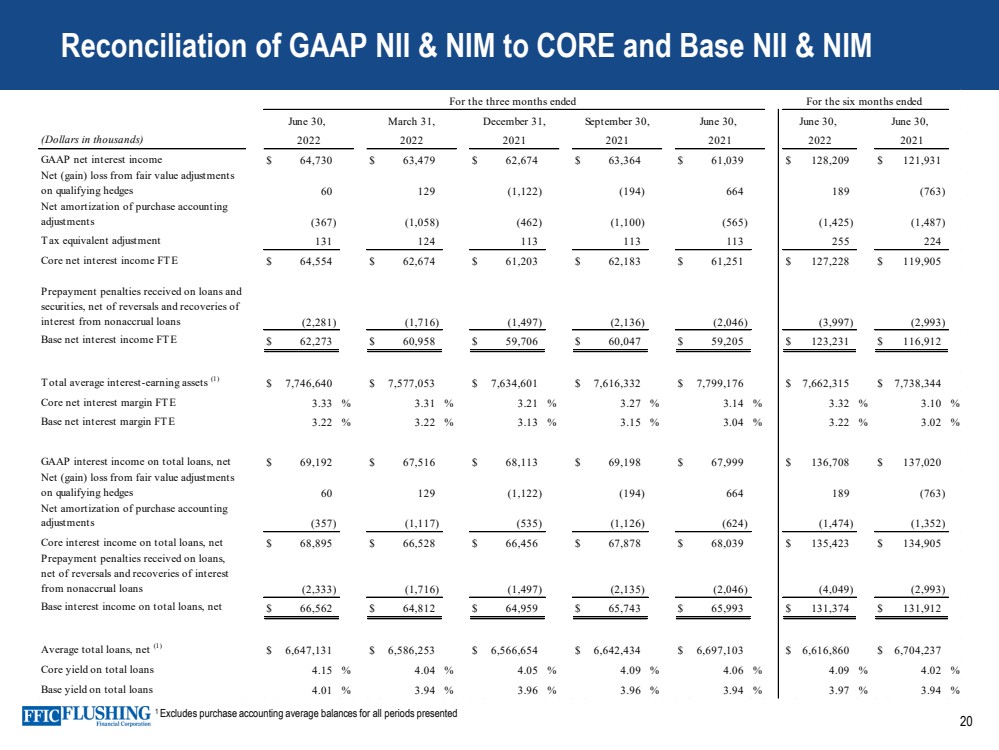
| 20 1 Excludes purchase accounting average balances for all periods presented Reconciliation of GAAP NII & NIM to CORE and Base NII & NIM (Dollars in thousands) GAAP net interest income $ 64,730 $ 63,479 $ 62,674 $ 63,364 $ 61,039 $ 128,209 $ 121,931 Net (gain) loss from fair value adjustments on qualifying hedges 60 129 (1,122) (194) 664 189 (763) Net amortization of purchase accounting adjustments (367) (1,058) (462) (1,100) (565) (1,425) (1,487) Tax equivalent adjustment 131 124 113 113 113 255 224 Core net interest income FTE $ 64,554 $ 62,674 $ 61,203 $ 62,183 $ 61,251 $ 127,228 $ 119,905 Prepayment penalties received on loans and securities, net of reversals and recoveries of interest from nonaccrual loans (2,281) (1,716) (1,497) (2,136) (2,046) (3,997) (2,993) Base net interest income FTE $ 62,273 $ 60,958 $ 59,706 $ 60,047 $ 59,205 $ 123,231 $ 116,912 Total average interest-earning assets (1) $ 7,746,640 $ 7,577,053 $ 7,634,601 $ 7,616,332 $ 7,799,176 $ 7,662,315 $ 7,738,344 Core net interest margin FTE 3.33 % 3.31 % 3.21 % 3.27 % 3.14 % 3.32 % 3.10 % Base net interest margin FTE 3.22 % 3.22 % 3.13 % 3.15 % 3.04 % 3.22 % 3.02 % GAAP interest income on total loans, net $ 69,192 $ 67,516 $ 68,113 $ 69,198 $ 67,999 $ 136,708 $ 137,020 Net (gain) loss from fair value adjustments on qualifying hedges 60 129 (1,122) (194) 664 189 (763) Net amortization of purchase accounting adjustments (357) (1,117) (535) (1,126) (624) (1,474) (1,352) Core interest income on total loans, net $ 68,895 $ 66,528 $ 66,456 $ 67,878 $ 68,039 $ 135,423 $ 134,905 Prepayment penalties received on loans, net of reversals and recoveries of interest from nonaccrual loans (2,333) (1,716) (1,497) (2,135) (2,046) (4,049) (2,993) Base interest income on total loans, net $ 66,562 $ 64,812 $ 64,959 $ 65,743 $ 65,993 $ 131,374 $ 131,912 Average total loans, net (1) $ 6,647,131 $ 6,586,253 $ 6,566,654 $ 6,642,434 $ 6,697,103 $ 6,616,860 $ 6,704,237 Core yield on total loans 4.15 % 4.04 % 4.05 % 4.09 % 4.06 % 4.09 % 4.02 % Base yield on total loans 4.01 % 3.94 % 3.96 % 3.96 % 3.94 % 3.97 % 3.94 % For the three months ended June 30, March 31, December 31, September 30, June 30, June 30, June 30, 2022 2021 2022 2022 2021 2021 2021 For the six months ended |
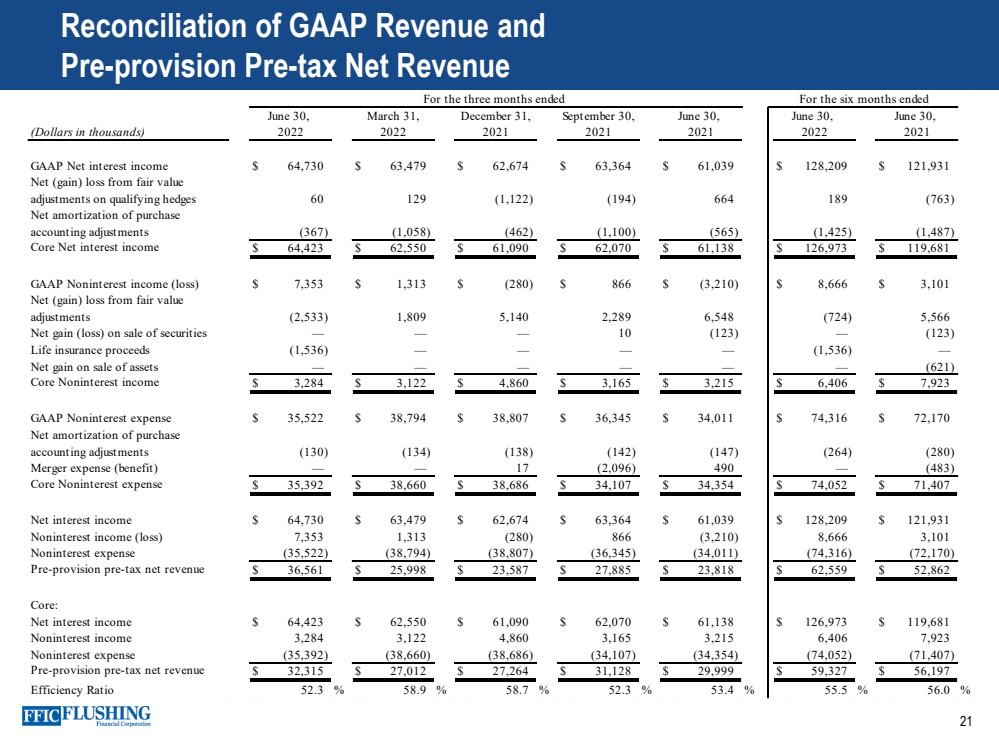
| 21 Reconciliation of GAAP Revenue and Pre - provision Pre - tax Net Revenue (Dollars in thousands) GAAP Net interest income $ 64,730 $ 63,479 $ 62,674 $ 63,364 $ 61,039 $ 128,209 $ 121,931 Net (gain) loss from fair value adjustments on qualifying hedges 60 129 (1,122) (194) 664 189 (763) Net amortization of purchase accounting adjustments (367) (1,058) (462) (1,100) (565) (1,425) (1,487) Core Net interest income $ 64,423 $ 62,550 $ 61,090 $ 62,070 $ 61,138 $ 126,973 $ 119,681 GAAP Noninterest income (loss) $ 7,353 $ 1,313 $ (280) $ 866 $ (3,210) $ 8,666 $ 3,101 Net (gain) loss from fair value adjustments (2,533) 1,809 5,140 2,289 6,548 (724) 5,566 Net gain (loss) on sale of securities — — — 10 (123) — (123) Life insurance proceeds (1,536) — — — — (1,536) — Net gain on sale of assets — — — — — — (621) Core Noninterest income $ 3,284 $ 3,122 $ 4,860 $ 3,165 $ 3,215 $ 6,406 $ 7,923 GAAP Noninterest expense $ 35,522 $ 38,794 $ 38,807 $ 36,345 $ 34,011 $ 74,316 $ 72,170 Net amortization of purchase accounting adjustments (130) (134) (138) (142) (147) (264) (280) Merger expense (benefit) — — 17 (2,096) 490 — (483) Core Noninterest expense $ 35,392 $ 38,660 $ 38,686 $ 34,107 $ 34,354 $ 74,052 $ 71,407 Net interest income $ 64,730 $ 63,479 $ 62,674 $ 63,364 $ 61,039 $ 128,209 $ 121,931 Noninterest income (loss) 7,353 1,313 (280) 866 (3,210) 8,666 3,101 Noninterest expense (35,522) (38,794) (38,807) (36,345) (34,011) (74,316) (72,170) Pre-provision pre-tax net revenue $ 36,561 $ 25,998 $ 23,587 $ 27,885 $ 23,818 $ 62,559 $ 52,862 Core: Net interest income $ 64,423 $ 62,550 $ 61,090 $ 62,070 $ 61,138 $ 126,973 $ 119,681 Noninterest income 3,284 3,122 4,860 3,165 3,215 6,406 7,923 Noninterest expense (35,392) (38,660) (38,686) (34,107) (34,354) (74,052) (71,407) Pre-provision pre-tax net revenue $ 32,315 $ 27,012 $ 27,264 $ 31,128 $ 29,999 $ 59,327 $ 56,197 Efficiency Ratio 52.3 % 58.9 % 58.7 % 52.3 % 53.4 % 55.5 % 56.0 % For the three months ended For the six months ended June 30, March 31, December 31, September 30, June 30, June 30, June 30, 2021 2022 2022 2021 2021 2021 2022 |
| 22 Contact Details Susan K. Cullen SEVP, CFO & Treasurer Phone: (718) 961 - 5400 Email: scullen@flushingbank.com Al Savastano, CFA Director of Investor Relations Phone: (516) 820 - 1146 Email: asavastano@flushingbank.com |

|
