| Investor Meetings November 2022 |

| Safe Harbor Statement 2 “Safe Harbor” Statement under the Private Securities Litigation Reform Act of 1995 : Statements in this Presentation relating to plans, strategies, economic performance and trends, projections of results of specific activities or investments and other statements that are not descriptions of historical facts may be forward - looking statements within the meaning of the Private Securities Litigation Reform Act of 1995 , Section 27 A of the Securities Act of 1933 and Section 21 E of the Securities Exchange Act of 1934 .. Forward - looking information is inherently subject to risks and uncertainties, and actual results could differ materially from those currently anticipated due to a number of factors, which include, but are not limited to, risk factors discussed in the Company’s Annual Report on Form 10 - K for the fiscal year ended December 31 , 2021 and in other documents filed by the Company with the Securities and Exchange Commission from time to time .. Forward - looking statements may be identified by terms such as “may”, “will”, “should”, “could”, “expects”, “plans”, “intends”, “anticipates”, “believes”, “estimates”, “predicts”, “forecasts”, “goals”, “potential” or “continue” or similar terms or the negative of these terms .. Although we believe that the expectations reflected in the forward - looking statements are reasonable, we cannot guarantee future results, levels of activity, performance or achievements .. The Company has no obligation to update these forward - looking statements .. |
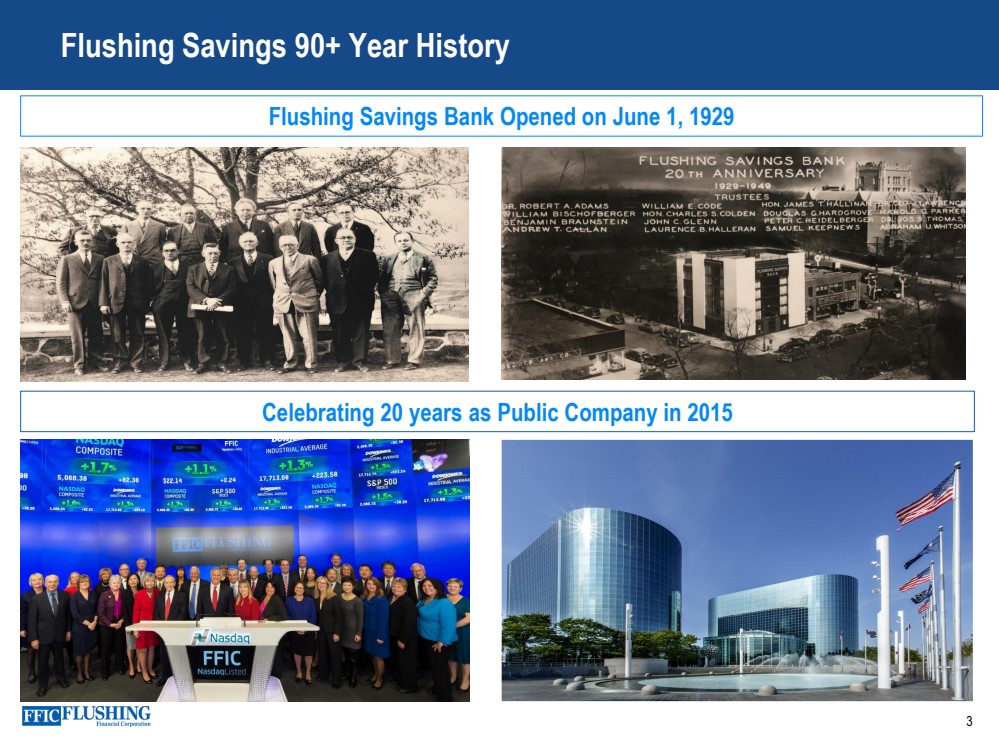
| Flushing Savings 90+ Year History Celebrating 20 years as Public Company in 2015 Flushing Savings Bank Opened on June 1, 1929 3 |
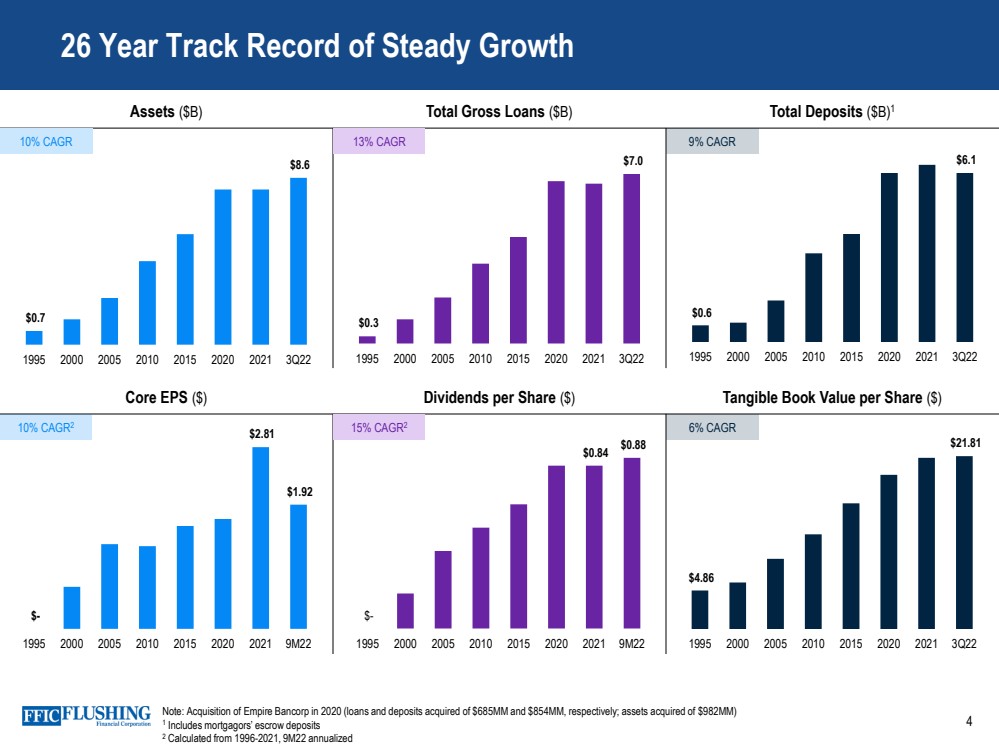
| 4 26 Year Track Record of Steady Growth Core EPS ($) Dividends per Share ($) Tangible Book Value per Share ($) Assets ($B) Total Gross Loans ($B) Total Deposits ($B) 1 $ - $0.84 $0.88 1995 2000 2005 2010 2015 2020 2021 9M22 $ - $2.81 $1.92 1995 2000 2005 2010 2015 2020 2021 9M22 $0.6 $6.1 1995 2000 2005 2010 2015 2020 2021 3Q22 $0.3 $7.0 1995 2000 2005 2010 2015 2020 2021 3Q22 $0.7 $8.6 1995 2000 2005 2010 2015 2020 2021 3Q22 10% CAGR 9% CAGR 13% CAGR 10% CAGR 2 15% CAGR 2 $4.86 $21.81 1995 2000 2005 2010 2015 2020 2021 3Q22 6% CAGR Note: Acquisition of Empire Bancorp in 2020 (loans and deposits acquired of $685MM and $854MM, respectively; assets acquired of $982MM) 1 Includes mortgagors’ escrow deposits 2 Calculated from 1996 - 2021, 9M22 annualized |
| 5 Flushing Financial Snapshot (NASDAQ: FFIC) Key Messages Balance Sheet Assets $ 8.6B Loans, net $ 6.9B Deposits $ 6.1B 1 Equity $ 0.7B Performance GAAP/Core ROAA 1.11%/0.90% 2 GAAP/Core ROAE 13.91%/11.24% 2 GAAP/Core Exp/Avg Assets 1.69%/1.68% 2 Tangible Book Value $ 21.81 Dividend Yield 4.3% 3 3 Q22 Key Statistics Footprint Deposits primarily from 25 branches in multicultural neighborhoods and our online division, consisting of iGObanking ® and BankPurely ® • Leading Community Bank in the Attractive Greater NYC Area • Well Diversified and Low Risk Loan Portfolio • History of Sound Credit Quality • Asian Banking Niche • Well Positioned to Capture Market Share Through In - Market Merger Disruption 1 Includes mortgagors’ escrow deposits 2 See Reconciliation of GAAP Revenue & Pre - Provision Pre - Tax Net Revenue and Reconciliation of GAAP Revenue and Pre - Provision Pre - Tax Net Revenue for calculation 3 Calculated using 10/21/22 closing price of $ 20.25 Brand Promise Nurturing Relationships and Rewarding Customers, Employees, and Shareholders |

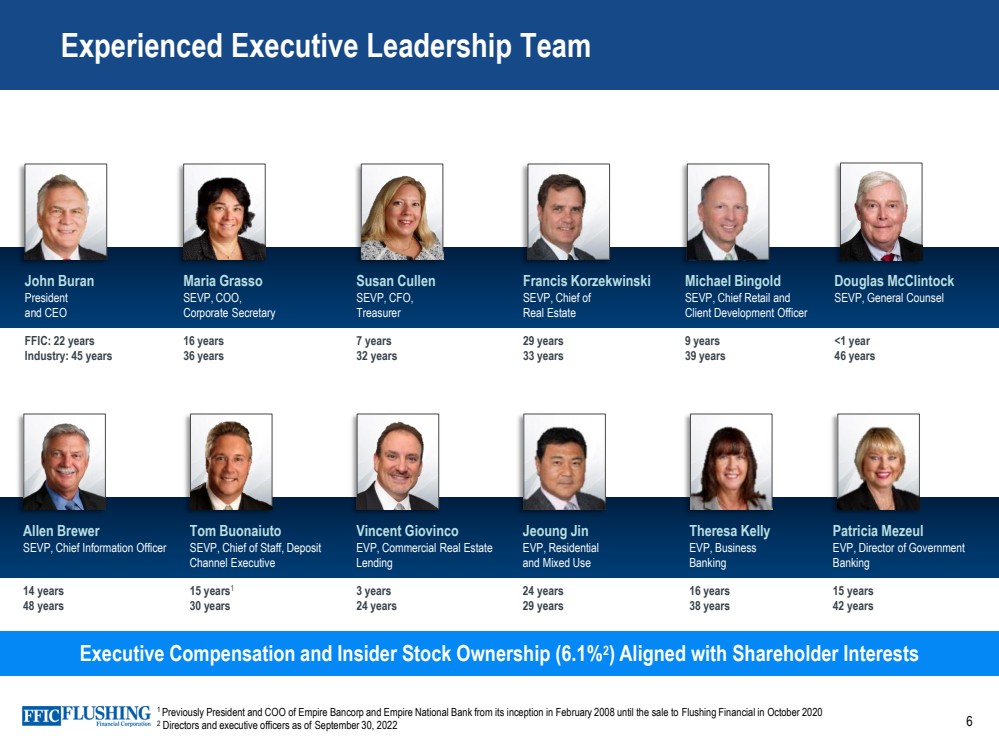
| 6 Experienced Executive Leadership Team Executive Compensation and Insider Stock Ownership (6.1% 2 ) Aligned with Shareholder Interests John Buran President and CEO Maria Grasso SEVP, COO, Corporate Secretary Susan Cullen SEVP, CFO, Treasurer Francis Korzekwinski SEVP, Chief of Real Estate Michael Bingold SEVP, Chief Retail and Client Development Officer Douglas McClintock SEVP, General Counsel FFIC: 22 years Industry: 45 years 16 years 36 years 7 years 32 years 29 years 33 years 9 years 39 years <1 year 46 years Allen Brewer SEVP, Chief Information Officer Tom Buonaiuto SEVP, Chief of Staff, Deposit Channel Executive Vincent Giovinco EVP, Commercial Real Estate Lending Jeoung Jin EVP, Residential and Mixed Use Theresa Kelly EVP, Business Banking Patricia Mezeul EVP, Director of Government Banking 14 years 48 years 15 years 1 30 years 3 years 24 years 24 years 29 years 16 years 38 years 15 years 42 years 1 Previously President and COO of Empire Bancorp and Empire National Bank from its inception in February 2008 until the sale to Fl ushing Financial in October 2020 2 Directors and executive officers as of September 30 , 2022 |
| Delivering Rewarding Relationships 7 Building Relationships Across All Stakeholders |

| Long - standing History of Giving Back to the Communities Our Asian Bank Supports Business Growth 8 |

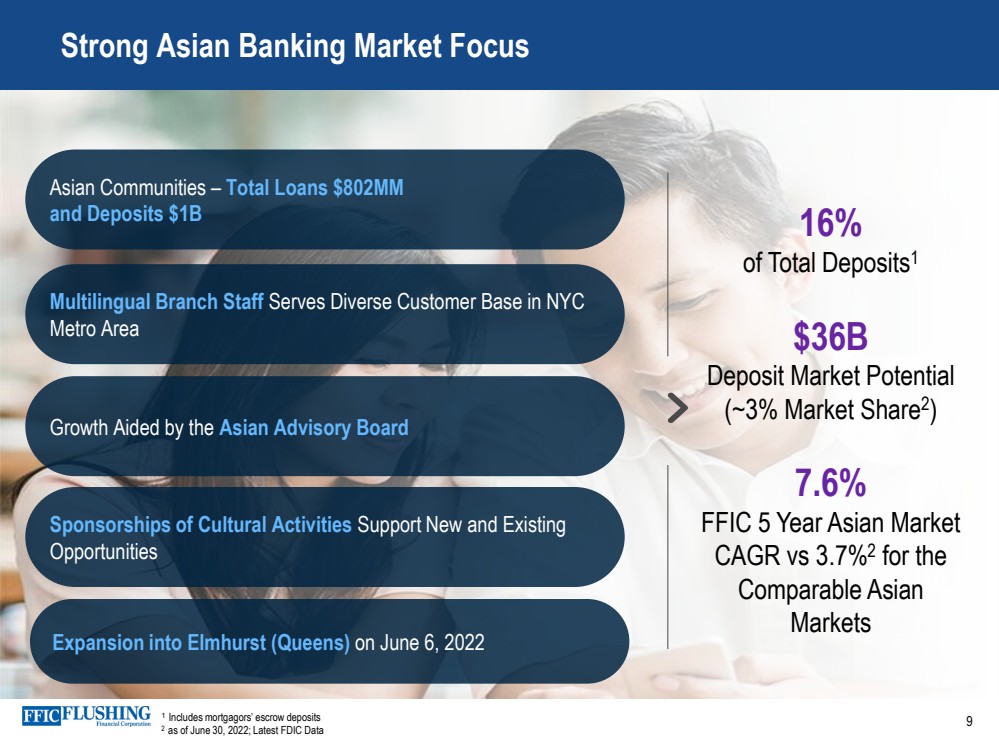
| 9 Strong Asian Banking Market Focus 16% of Total Deposits 1 $ 36B Deposit Market Potential (~3% Market Share 2 ) 7.6% FFIC 5 Year Asian Market CAGR vs 3.7% 2 for the Comparable Asian Markets Asian Communities – Total Loans $802MM and Deposits $1B Multilingual Branch Staff Serves Diverse Customer Base in NYC Metro Area Growth Aided by the Asian Advisory Board Sponsorships of Cultural Activities Support New and Existing Opportunities 1 Includes mortgagors’ escrow deposits 2 as of June 30, 2022; Latest FDIC Data Expansion into Elmhurst (Queens) on June 6, 2022 |
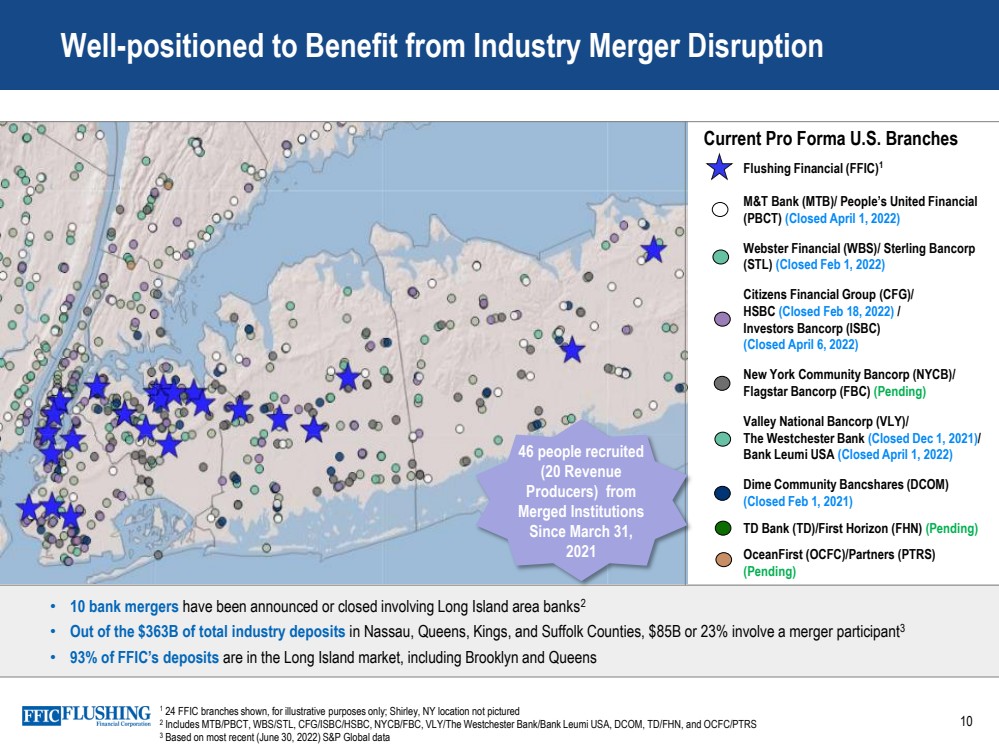
| 10 Well - positioned to Benefit from Industry Merger Disruption • 10 bank mergers have been announced or closed involving Long Island area banks 2 • Out of the $ 363B of total industry deposits in Nassau, Queens, Kings, and Suffolk Counties, $ 85B or 23% involve a merger participant 3 • 93% of FFIC’s deposits are in the Long Island market, including Brooklyn and Queens Flushing Financial (FFIC) 1 M&T Bank (MTB)/ People’s United Financial (PBCT) (Closed April 1, 2022) Webster Financial (WBS)/ Sterling Bancorp (STL) (Closed Feb 1, 2022) Citizens Financial Group (CFG)/ HSBC (Closed Feb 18, 2022) / Investors Bancorp (ISBC) (Closed April 6, 2022) New York Community Bancorp (NYCB)/ Flagstar Bancorp (FBC) (Pending) Valley National Bancorp (VLY)/ The Westchester Bank (Closed Dec 1, 2021) / Bank Leumi USA (Closed April 1, 2022) Dime Community Bancshares (DCOM) (Closed Feb 1, 2021) TD Bank (TD)/First Horizon (FHN) (Pending) OceanFirst (OCFC)/Partners (PTRS) (Pending) Current Pro Forma U.S. Branches 1 24 FFIC branches shown, for illustrative purposes only; Shirley, NY location not pictured 2 Includes MTB/PBCT, WBS/STL, CFG/ISBC/HSBC, NYCB/FBC, VLY/The Westchester Bank/Bank Leumi USA, DCOM, TD/FHN, and OCFC/PTRS 3 Based on most recent (June 30, 2022) S&P Global data 46 people recruited (20 Revenue Producers) from Merged Institutions Since March 31, 2021 |
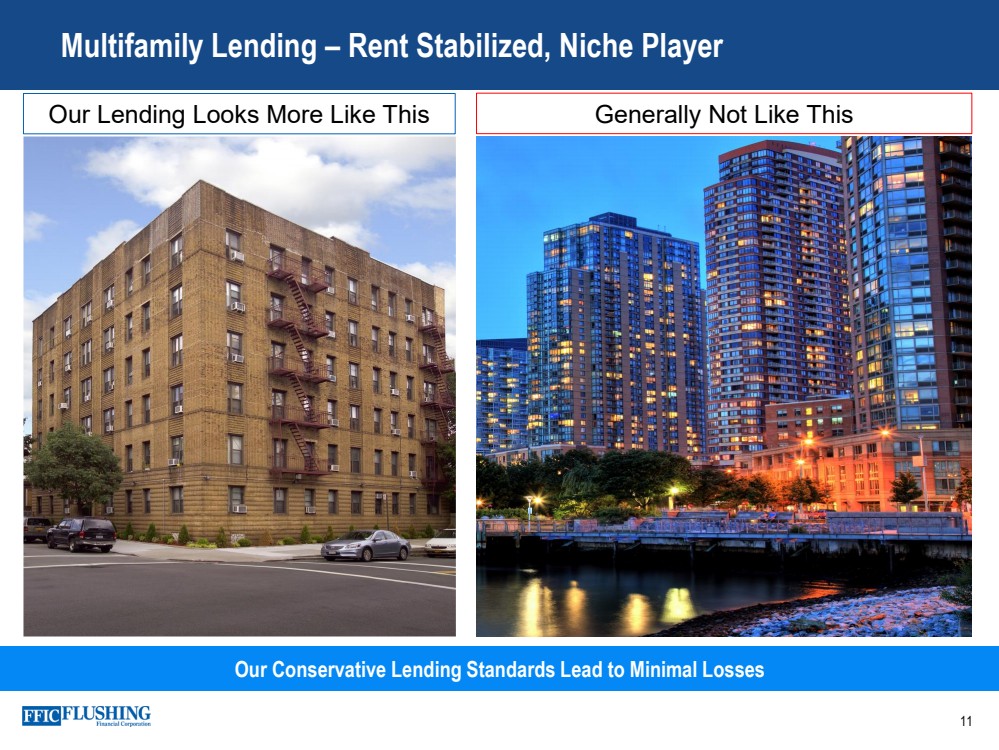
| Multifamily Lending – Rent Stabilized, Niche Player Our Conservative Lending Standards Lead to Minimal Losses Generally Not Like This Our Lending Looks More Like This 11 |
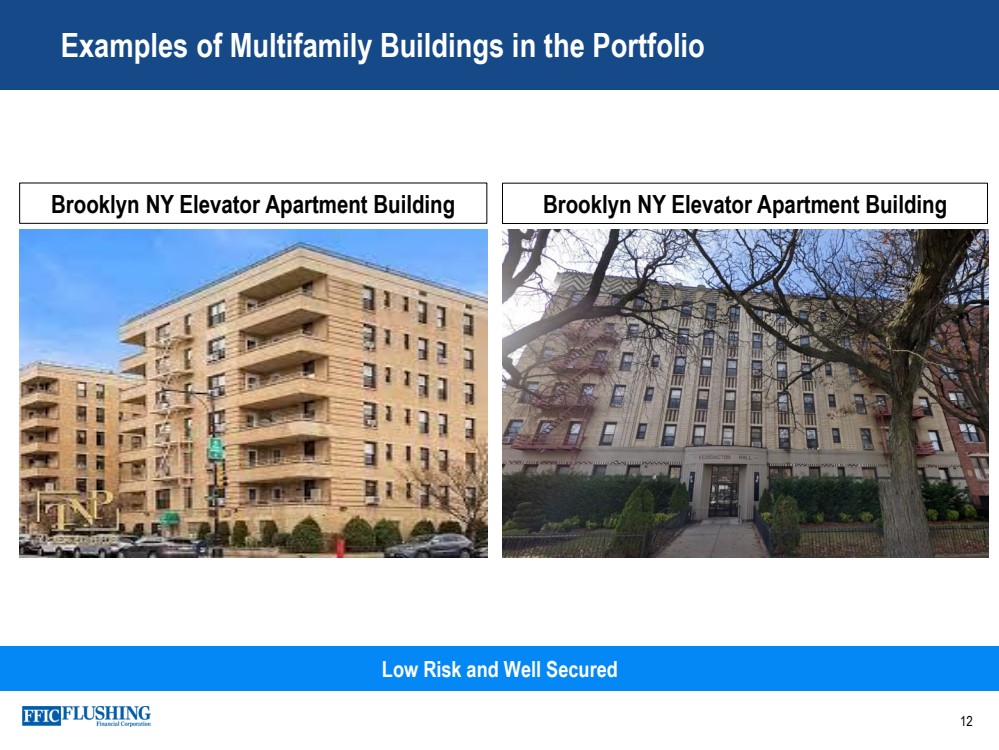
| Examples of Multifamily Buildings in the Portfolio 12 Low Risk and Well Secured Brooklyn NY Elevator Apartment Building Brooklyn NY Elevator Apartment Building |
| Non - Owner Occupied Commercial Real Estate – Strong Equity on Local Properties Community Properties with an Average Loan Size of $2.1MM 13 |

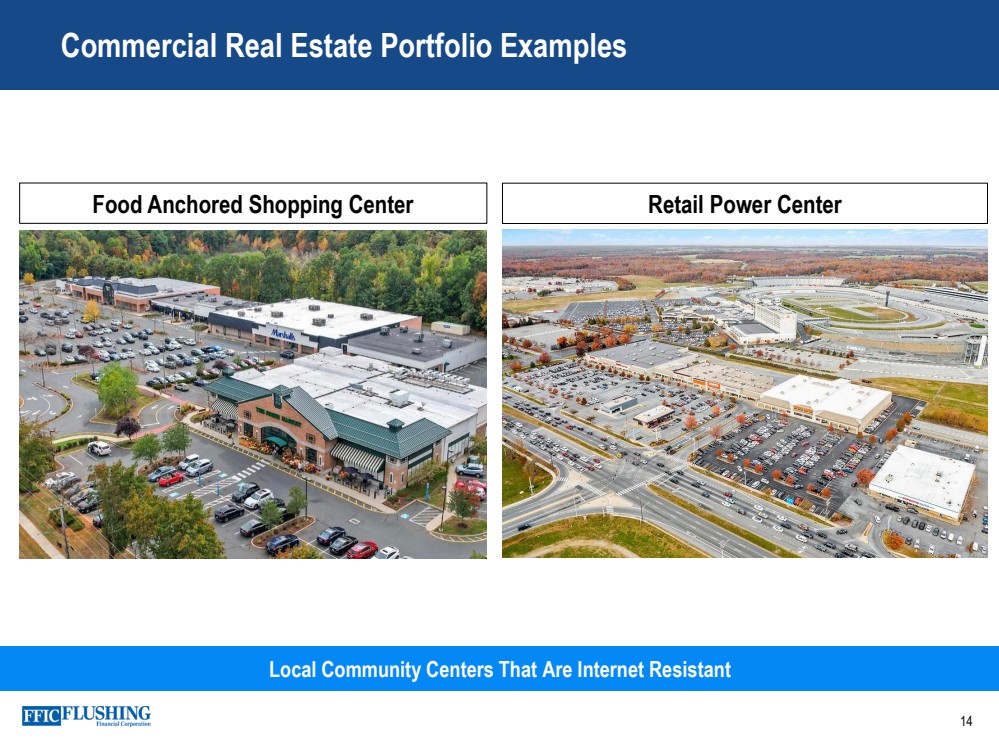
| Commercial Real Estate Portfolio Examples 14 Local Community Centers That Are Internet Resistant Food Anchored Shopping Center Retail Power Center |
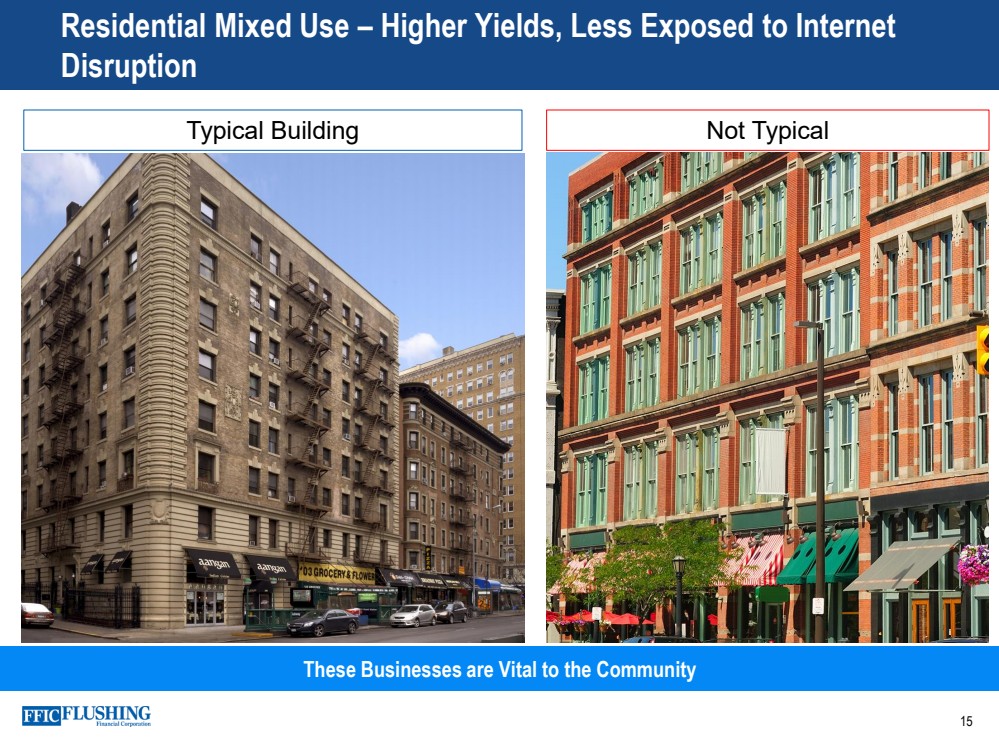
| Residential Mixed Use – Higher Yields, Less Exposed to Internet Disruption These Businesses are Vital to the Community Typical Building Not Typical 15 |
| Business Banking – Supporting Customers Well Diversified Business Portfolio 16 |

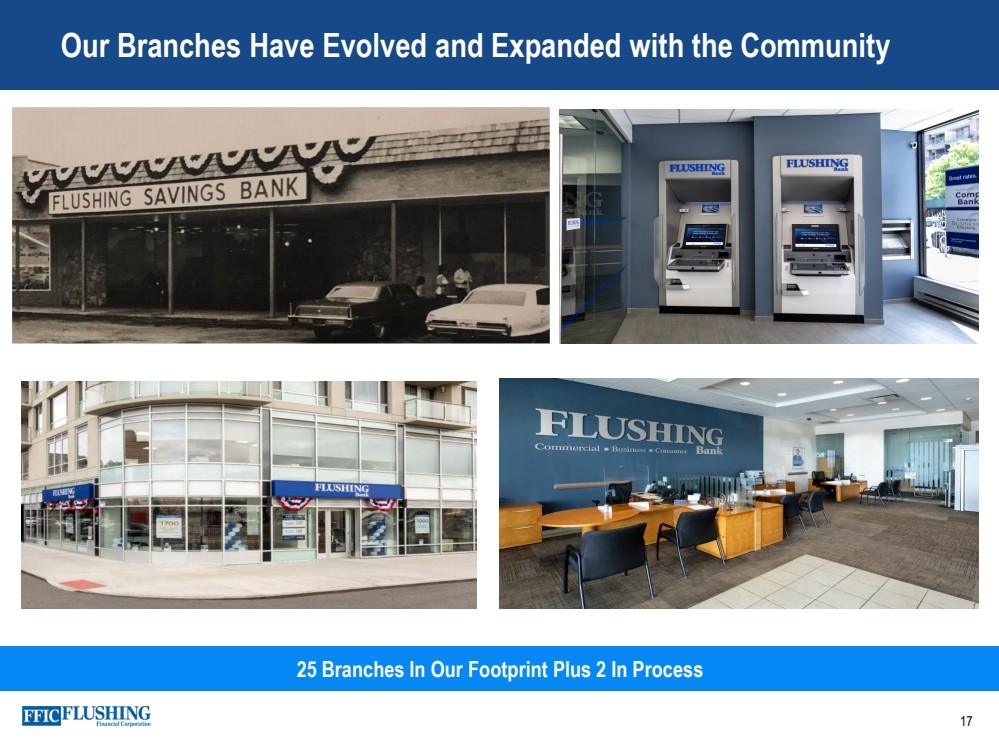
| Our Branches Have Evolved and Expanded with the Community 25 Branches In Our Footprint Plus 2 In Process 17 |
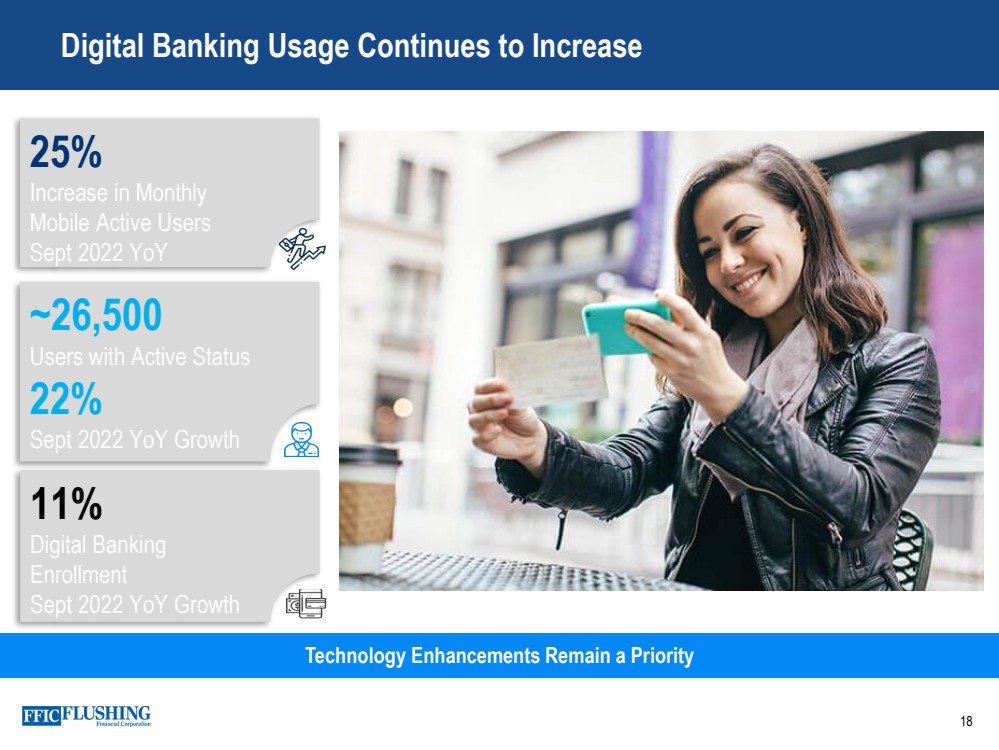
| Digital Banking Usage Continues to Increase 18 Technology Enhancements Remain a Priority 25% Increase in Monthly Mobile Active Users Sept 2022 YoY ~ 26,500 Users with Active Status 22% Sept 2022 YoY Growth 11% Digital Banking Enrollment Sept 2022 YoY Growth |
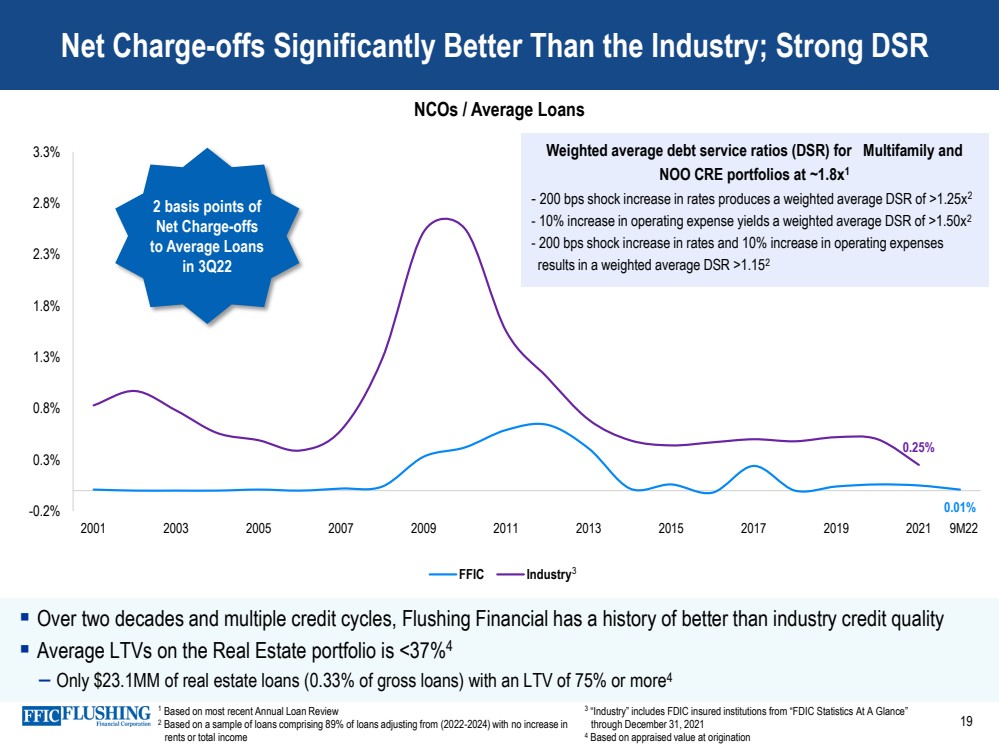
| Over two decades and multiple credit cycles, Flushing Financial has a history of better than industry credit quality Average LTVs on the Real Estate portfolio is < 37% 4 – Only $23.1MM of real estate loans ( 0.33% of gross loans) with an LTV of 75% or more 4 Net Charge - offs Significantly Better Than the Industry; Strong DSR 19 NCOs / Average Loans 0.01% 0.25% -0.2% 0.3% 0.8% 1.3% 1.8% 2.3% 2.8% 3.3% 2001 2003 2005 2007 2009 2011 2013 2015 2017 2019 2021 FFIC Industry 2 basis points of Net Charge - offs to Average Loans in 3Q22 9M22 Weighted average debt service ratios (DSR) for Multifamily and NOO CRE portfolios at ~1.8x 1 - 200 bps shock increase in rates produces a weighted average DSR of >1.25x 2 - 10% increase in operating expense yields a weighted average DSR of >1.50x 2 - 200 bps shock increase in rates and 10% increase in operating expenses results in a weighted average DSR >1.15 2 3 1 Based on most recent Annual Loan Review 2 Based on a sample of loans comprising 89% of loans adjusting from (2022 - 2024) with no increase in rents or total income 3 “Industry” includes FDIC insured institutions from “FDIC Statistics At A Glance” through December 31, 2021 4 Based on appraised value at origination |
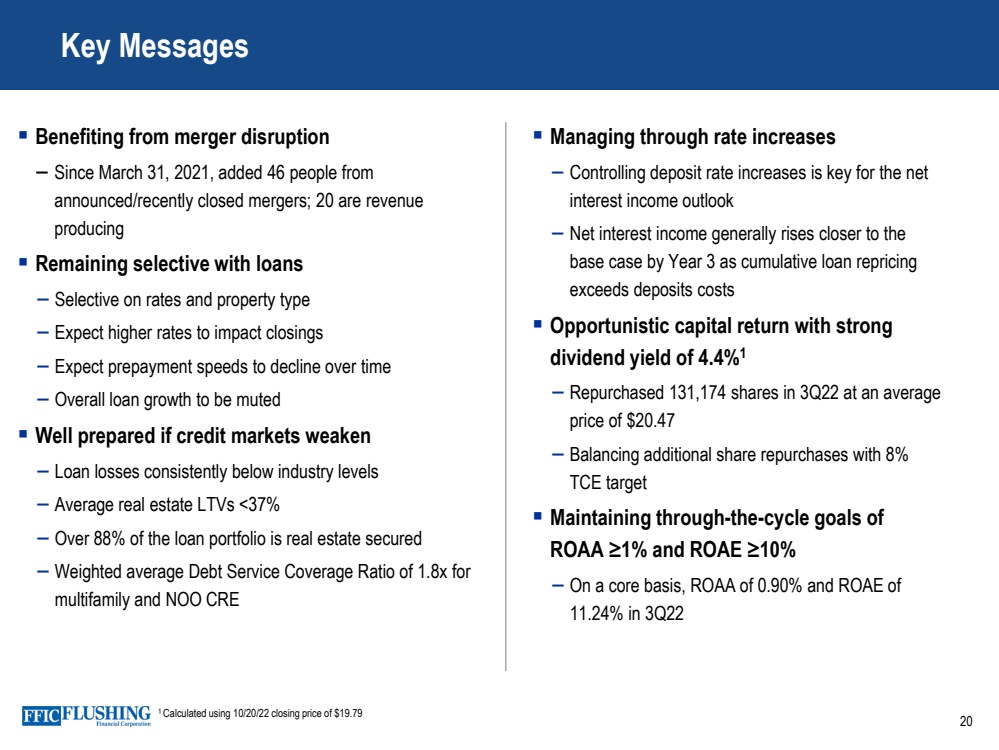
| 20 Managing through rate increases – Controlling deposit rate increases is key for the net interest income outlook – Net interest income generally rises closer to the base case by Year 3 as cumulative loan repricing exceeds deposits costs Opportunistic capital return with strong dividend yield of 4.4% 1 – Repurchased 131,174 shares in 3Q22 at an average price of $20.47 – Balancing additional share repurchases with 8% TCE target Maintaining through - the - cycle goals of ROAA ≥1% and ROAE ≥10% – On a core basis, ROAA of 0.90% and ROAE of 11.24% in 3Q22 Benefiting from merger disruption – Since March 31, 2021, added 46 people from announced/recently closed mergers; 20 are revenue producing Remaining selective with loans – Selective on rates and property type – Expect higher rates to impact closings – Expect prepayment speeds to decline over time – Overall loan growth to be muted Well prepared if credit markets weaken – Loan losses consistently below industry levels – Average real estate LTVs <37% – Over 88% of the loan portfolio is real estate secured – Weighted average Debt Service Coverage Ratio of 1.8x for multifamily and NOO CRE Key Messages 1 Calculated using 10/20/22 closing price of $19.79 |
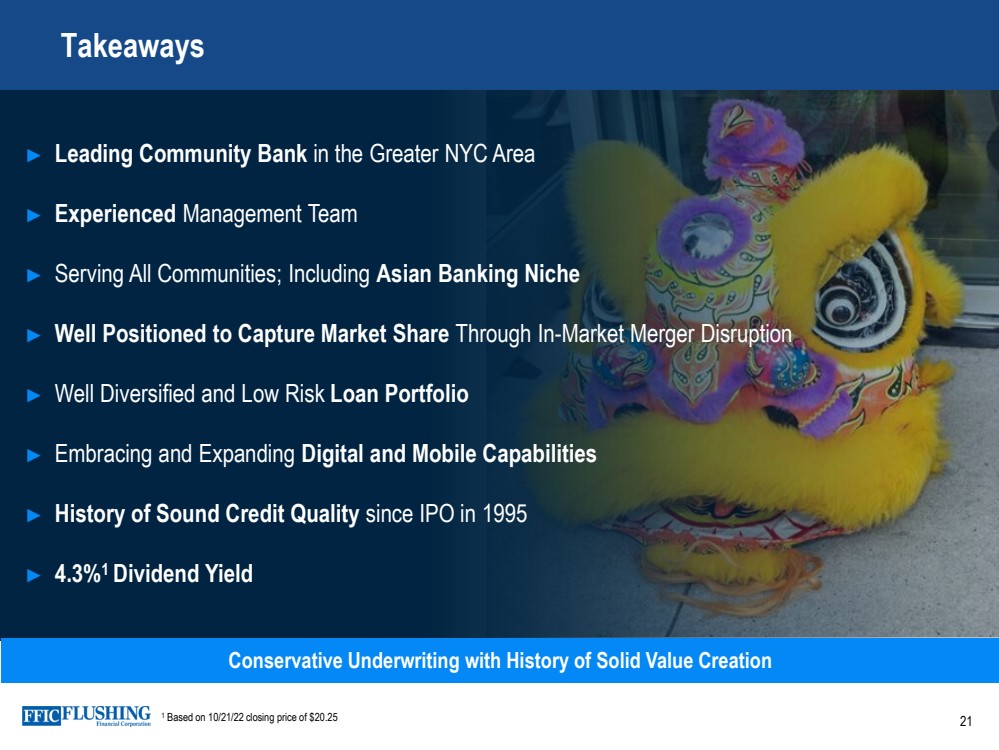
| Takeaways Conservative Underwriting with History of Solid Value Creation ► Leading Community Bank in the Greater NYC Area ► Experienced Management Team ► Serving All Communities; Including Asian Banking Niche ► Well Positioned to Capture Market Share Through In - Market Merger Disruption ► Well Diversified and Low Risk Loan Portfolio ► Embracing and Expanding Digital and Mobile Capabilities ► History of Sound Credit Quality since IPO in 1995 ► 4.3% 1 Dividend Yield 1 Based on 10 /21/22 closing price of $ 20.25 21 |
| Appendix 22 |

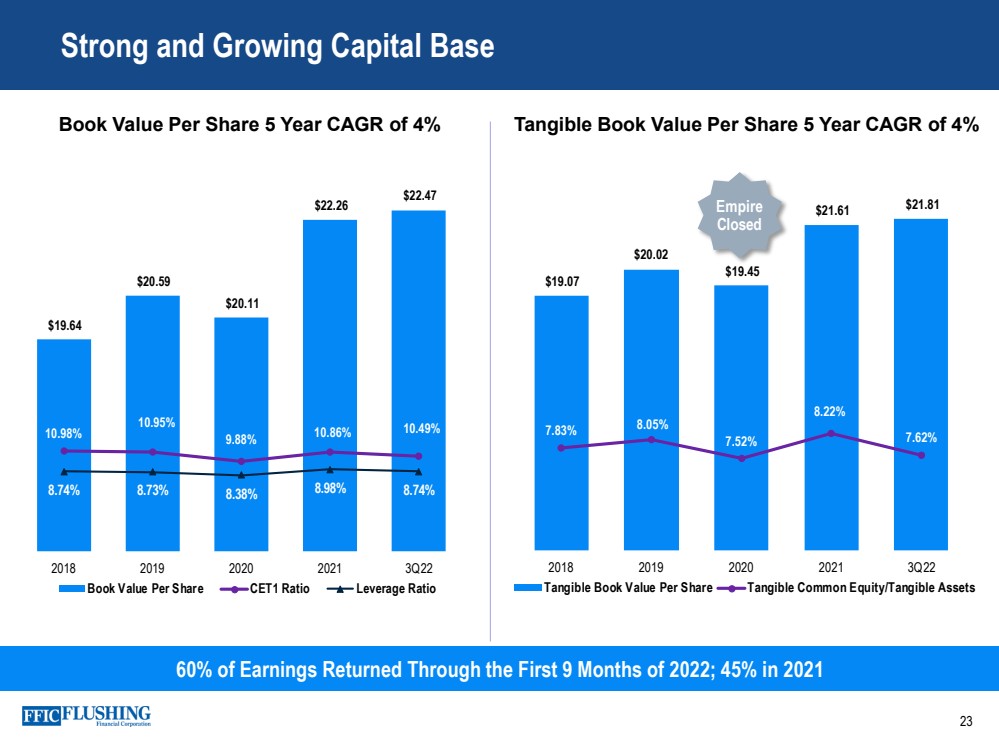
| Strong and Growing Capital Base 23 60% of Earnings Returned Through the First 9 Months of 2022; 45% in 2021 Book Value Per Share 5 Year CAGR of 4% Tangible Book Value Per Share 5 Year CAGR of 4% $19.64 $20.59 $20.11 $22.26 $22.47 10.98% 10.95% 9.88% 10.86% 10.49% 8.74% 8.73% 8.38% 8.98% 8.74% 0.00% 5.00% 10.00% 15.00% 20.00% 25.00% 30.00% 35.00% 40.00% $15.00 $16.00 $17.00 $18.00 $19.00 $20.00 $21.00 $22.00 $23.00 2018 2019 2020 2021 3Q22 Book Value Per Share CET1 Ratio Leverage Ratio $19.07 $20.02 $19.45 $21.61 $21.81 7.83% 8.05% 7.52% 8.22% 7.62% 5.00% 6.00% 7.00% 8.00% 9.00% 10.00% 11.00% 12.00% 13.00% 14.00% 15.00% $10.00 $12.00 $14.00 $16.00 $18.00 $20.00 $22.00 2018 2019 2020 2021 3Q22 Tangible Book Value Per Share Tangible Common Equity/Tangible Assets Empire Closed |
| Reconciliation of GAAP Earnings and Core Earnings 24 Non - cash Fair Value Adjustments to GAAP Earnings The variance in GAAP and core earnings is partly driven by the impact of non - cash net gains and losses from fair value adjustments .. These fair value adjustments relate primarily to borrowing carried at fair value under the fair value option a nd swaps designated to protect against rising rates .. As the swaps get closer to maturity, the volatility in fair value adjustments will dissipate .. In a rising interest rate environment or a steepening of the yield curve, the loss position would experience an improvement .. In a declining interest rate environment, the movement in the curve exaggerates our mark - to - market loss position .. Core Net Income, Core Diluted EPS, Core ROAE, Core ROAA, Pre - provision, Pre - tax Net Revenue, Core Net Interest Income FTE, Core Net Interest Margin FTE , Core Interest Income and Yield on Total Loans , Core Noninterest Income, Core Noninterest Expense and Tangible Book Value per common share are each non - GAAP measures used in this presentation .. A reconciliation to the most directly comparable GAAP financial measures appears below in tabular form .. The Company believes that these measures are useful for both investors and management to understand the effects of certain interest and noninterest items and provide an alternative view of the Company's performance over time and in comparison to the Company's competitors .. These measures should not be viewed as a substitute for net income .. The Company believes that tangible book value per common share is useful for both investors and management as these are measures commonly used by financial institutions, regulators and investors to measure the capital adequacy of financial institutions .. The Company believes these measures facilitate comparison of the quality and composition of the Company's capital over time and in comparison to its competitors .. These measures should not be viewed as a substitute for total shareholders' equity .. These non - GAAP measures have inherent limitations, are not required to be uniformly applied and are not audited .. They should not be considered in isolation or as a substitute for analysis of results reported under GAAP .. These non - GAAP measures may not be comparable to similarly titled measures reported by other companies .. |
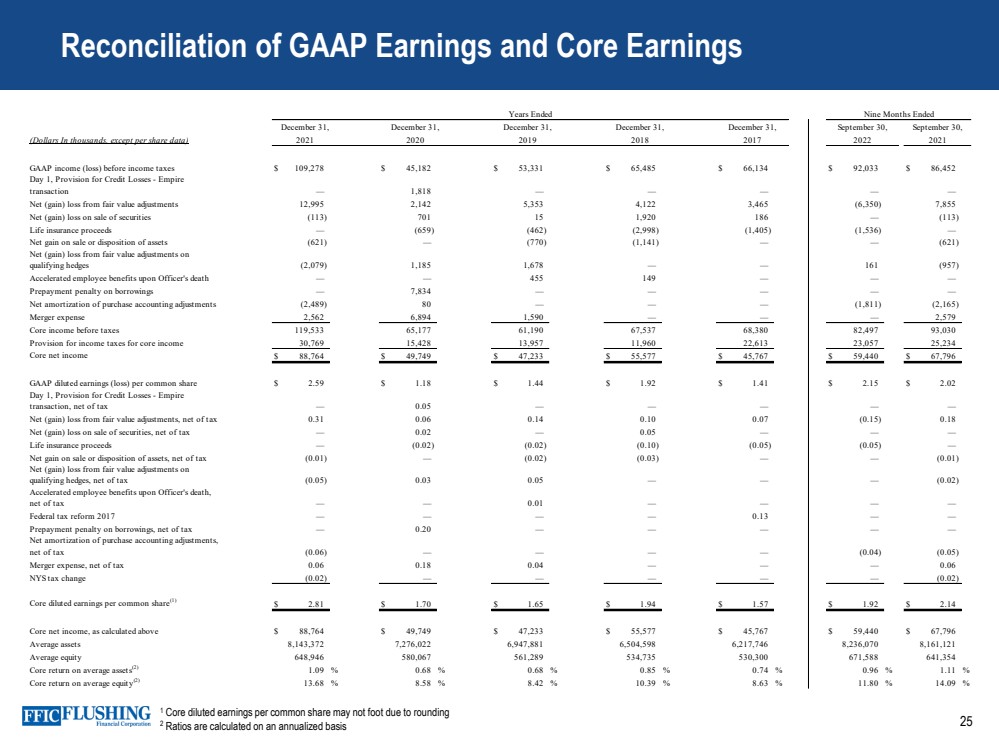
| 25 Reconciliation of GAAP Earnings and Core Earnings 1 Core diluted earnings per common share may not foot due to rounding 2 Ratios are calculated on an annualized basis (Dollars In thousands, except per share data) GAAP income (loss) before income taxes $ 109,278 $ 45,182 $ 53,331 $ 65,485 $ 66,134 $ 92,033 $ 86,452 Day 1, Provision for Credit Losses - Empire transaction — 1,818 — — — — — Net (gain) loss from fair value adjustments 12,995 2,142 5,353 4,122 3,465 (6,350) 7,855 Net (gain) loss on sale of securities (113) 701 15 1,920 186 — (113) Life insurance proceeds — (659) (462) (2,998) (1,405) (1,536) — Net gain on sale or disposition of assets (621) — (770) (1,141) — — (621) Net (gain) loss from fair value adjustments on qualifying hedges (2,079) 1,185 1,678 — — 161 (957) Accelerated employee benefits upon Officer's death — — 455 149 — — — Prepayment penalty on borrowings — 7,834 — — — — — Net amortization of purchase accounting adjustments (2,489) 80 — — — (1,811) (2,165) Merger expense 2,562 6,894 1,590 — — — 2,579 Core income before taxes 119,533 65,177 61,190 67,537 68,380 82,497 93,030 Provision for income taxes for core income 30,769 15,428 13,957 11,960 22,613 23,057 25,234 Core net income $ 88,764 $ 49,749 $ 47,233 $ 55,577 $ 45,767 $ 59,440 $ 67,796 GAAP diluted earnings (loss) per common share $ 2.59 $ 1.18 $ 1.44 $ 1.92 $ 1.41 $ 2.15 $ 2.02 Day 1, Provision for Credit Losses - Empire transaction, net of tax — 0.05 — — — — — Net (gain) loss from fair value adjustments, net of tax 0.31 0.06 0.14 0.10 0.07 (0.15) 0.18 Net (gain) loss on sale of securities, net of tax — 0.02 — 0.05 — — — Life insurance proceeds — (0.02) (0.02) (0.10) (0.05) (0.05) — Net gain on sale or disposition of assets, net of tax (0.01) — (0.02) (0.03) — — (0.01) Net (gain) loss from fair value adjustments on qualifying hedges, net of tax (0.05) 0.03 0.05 — — — (0.02) Accelerated employee benefits upon Officer's death, net of tax — — 0.01 — — — — Federal tax reform 2017 — — — — 0.13 — — Prepayment penalty on borrowings, net of tax — 0.20 — — — — — Net amortization of purchase accounting adjustments, net of tax (0.06) — — — — (0.04) (0.05) Merger expense, net of tax 0.06 0.18 0.04 — — — 0.06 NYS tax change (0.02) — — — — — (0.02) Core diluted earnings per common share (1) $ 2.81 $ 1.70 $ 1.65 $ 1.94 $ 1.57 $ 1.92 $ 2.14 Core net income, as calculated above $ 88,764 $ 49,749 $ 47,233 $ 55,577 $ 45,767 $ 59,440 $ 67,796 Average assets 8,143,372 7,276,022 6,947,881 6,504,598 6,217,746 8,236,070 8,161,121 Average equity 648,946 580,067 561,289 534,735 530,300 671,588 641,354 Core return on average assets (2) 1.09 % 0.68 % 0.68 % 0.85 % 0.74 % 0.96 % 1.11 % Core return on average equity (2) 13.68 % 8.58 % 8.42 % 10.39 % 8.63 % 11.80 % 14.09 % December 31, 2018 Years Ended December 31, 2021 December 31, 2020 December 31, 2019 2017 2021 2022 Nine Months Ended December 31, September 30, September 30, |
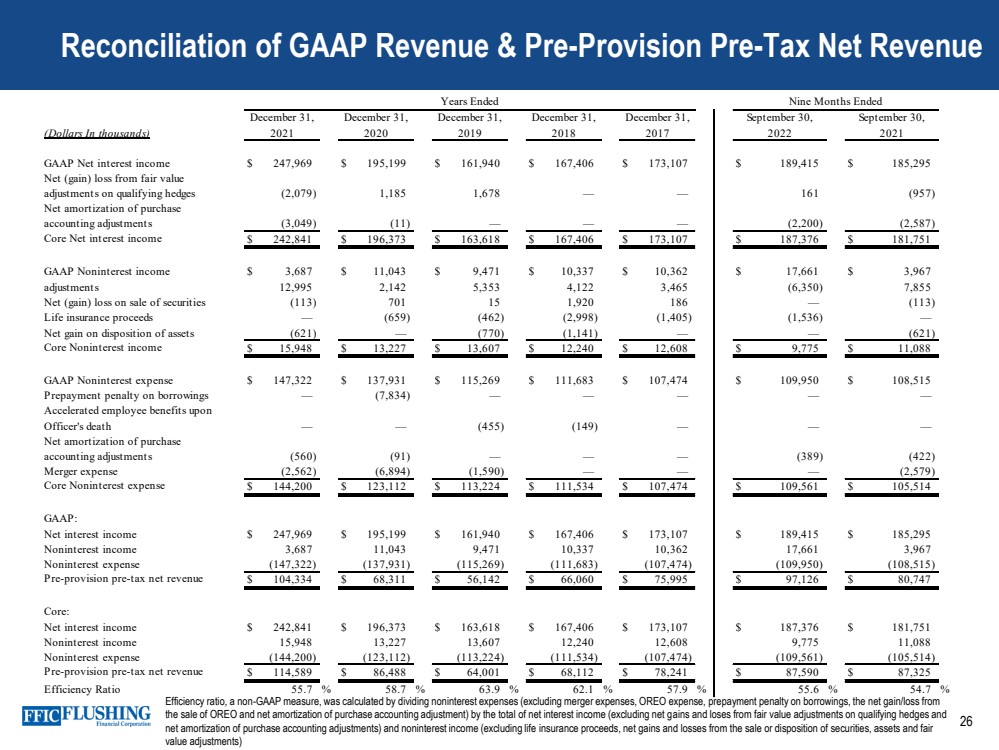
| 26 Reconciliation of GAAP Revenue & Pre - Provision Pre - Tax Net Revenue Efficiency ratio, a non - GAAP measure, was calculated by dividing noninterest expenses (excluding merger expenses, OREO expense, prepayment penalty on borrowings, the net gain/loss from the sale of OREO and net amortization of purchase accounting adjustment) by the total of net interest income (excluding net g ain s and loses from fair value adjustments on qualifying hedges and net amortization of purchase accounting adjustments) and noninterest income (excluding life insurance proceeds, net gains and lo sses from the sale or disposition of securities, assets and fair value adjustments) (Dollars In thousands) GAAP Net interest income $ 247,969 $ 195,199 $ 161,940 $ 167,406 $ 173,107 $ 189,415 $ 185,295 Net (gain) loss from fair value adjustments on qualifying hedges (2,079) 1,185 1,678 — — 161 (957) Net amortization of purchase accounting adjustments (3,049) (11) — — — (2,200) (2,587) Core Net interest income $ 242,841 $ 196,373 $ 163,618 $ 167,406 $ 173,107 $ 187,376 $ 181,751 GAAP Noninterest income $ 3,687 $ 11,043 $ 9,471 $ 10,337 $ 10,362 $ 17,661 $ 3,967 Net (gain) loss from fair value adjustments 12,995 2,142 5,353 4,122 3,465 (6,350) 7,855 Net (gain) loss on sale of securities (113) 701 15 1,920 186 — (113) Life insurance proceeds — (659) (462) (2,998) (1,405) (1,536) — Net gain on disposition of assets (621) — (770) (1,141) — — (621) Core Noninterest income $ 15,948 $ 13,227 $ 13,607 $ 12,240 $ 12,608 $ 9,775 $ 11,088 GAAP Noninterest expense $ 147,322 $ 137,931 $ 115,269 $ 111,683 $ 107,474 $ 109,950 $ 108,515 Prepayment penalty on borrowings — (7,834) — — — — — Accelerated employee benefits upon Officer's death — — (455) (149) — — — Net amortization of purchase accounting adjustments (560) (91) — — — (389) (422) Merger expense (2,562) (6,894) (1,590) — — — (2,579) Core Noninterest expense $ 144,200 $ 123,112 $ 113,224 $ 111,534 $ 107,474 $ 109,561 $ 105,514 GAAP: Net interest income $ 247,969 $ 195,199 $ 161,940 $ 167,406 $ 173,107 $ 189,415 $ 185,295 Noninterest income 3,687 11,043 9,471 10,337 10,362 17,661 3,967 Noninterest expense (147,322) (137,931) (115,269) (111,683) (107,474) (109,950) (108,515) Pre-provision pre-tax net revenue $ 104,334 $ 68,311 $ 56,142 $ 66,060 $ 75,995 $ 97,126 $ 80,747 Core: Net interest income $ 242,841 $ 196,373 $ 163,618 $ 167,406 $ 173,107 $ 187,376 $ 181,751 Noninterest income 15,948 13,227 13,607 12,240 12,608 9,775 11,088 Noninterest expense (144,200) (123,112) (113,224) (111,534) (107,474) (109,561) (105,514) Pre-provision pre-tax net revenue $ 114,589 $ 86,488 $ 64,001 $ 68,112 $ 78,241 $ 87,590 $ 87,325 Efficiency Ratio 55.7 % 58.7 % 63.9 % 62.1 % 57.9 % 55.6 % 54.7 % September 30, 2021 September 30, 2022 Nine Months Ended December 31, 2018 Years Ended December 31, 2021 December 31, 2020 December 31, 2019 December 31, 2017 |
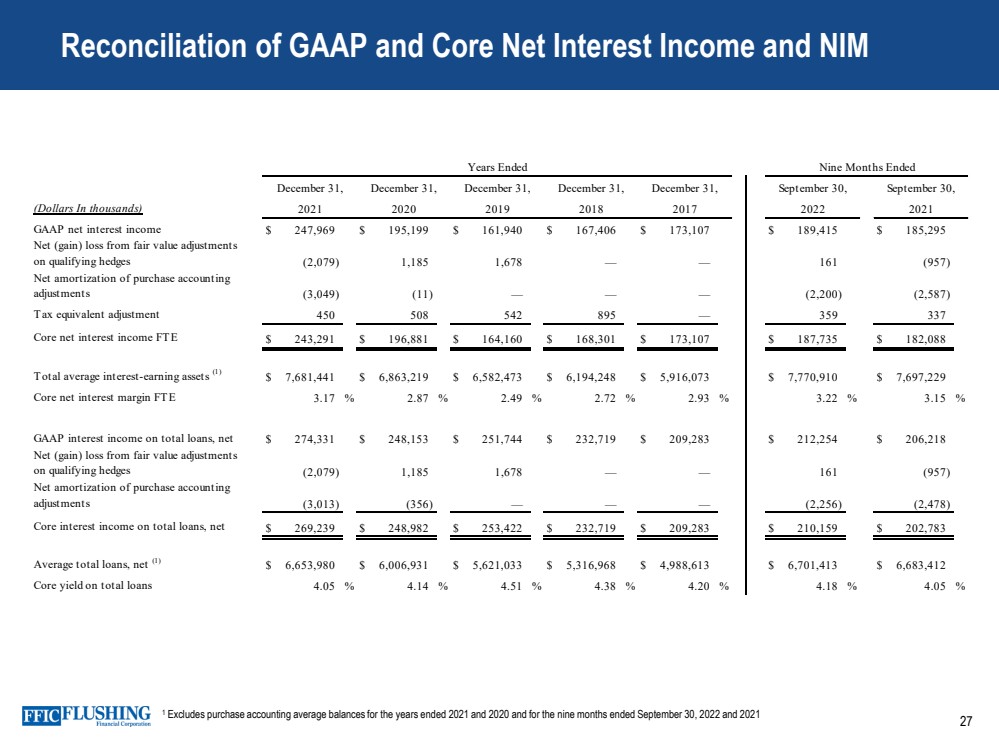
| 27 Reconciliation of GAAP and Core Net Interest Income and NIM 1 Excludes purchase accounting average balances for the years ended 2021 and 2020 and for the nine months ended September 30, 2022 and 2021 (Dollars In thousands) GAAP net interest income $ 247,969 $ 195,199 $ 161,940 $ 167,406 $ 173,107 $ 189,415 $ 185,295 Net (gain) loss from fair value adjustments on qualifying hedges (2,079) 1,185 1,678 — — 161 (957) Net amortization of purchase accounting adjustments (3,049) (11) — — — (2,200) (2,587) Tax equivalent adjustment 450 508 542 895 — 359 337 Core net interest income FTE $ 243,291 $ 196,881 $ 164,160 $ 168,301 $ 173,107 $ 187,735 $ 182,088 Total average interest-earning assets (1) $ 7,681,441 $ 6,863,219 $ 6,582,473 $ 6,194,248 $ 5,916,073 $ 7,770,910 $ 7,697,229 Core net interest margin FTE 3.17 % 2.87 % 2.49 % 2.72 % 2.93 % 3.22 % 3.15 % GAAP interest income on total loans, net $ 274,331 $ 248,153 $ 251,744 $ 232,719 $ 209,283 $ 212,254 $ 206,218 Net (gain) loss from fair value adjustments on qualifying hedges (2,079) 1,185 1,678 — — 161 (957) Net amortization of purchase accounting adjustments (3,013) (356) — — — (2,256) (2,478) Core interest income on total loans, net $ 269,239 $ 248,982 $ 253,422 $ 232,719 $ 209,283 $ 210,159 $ 202,783 Average total loans, net (1) $ 6,653,980 $ 6,006,931 $ 5,621,033 $ 5,316,968 $ 4,988,613 $ 6,701,413 $ 6,683,412 Core yield on total loans 4.05 % 4.14 % 4.51 % 4.38 % 4.20 % 4.18 % 4.05 % September 30, 2021 Nine Months Ended 2017 September 30, 2022 December 31, December 31, 2018 Years Ended December 31, 2021 December 31, 2020 December 31, 2019 |
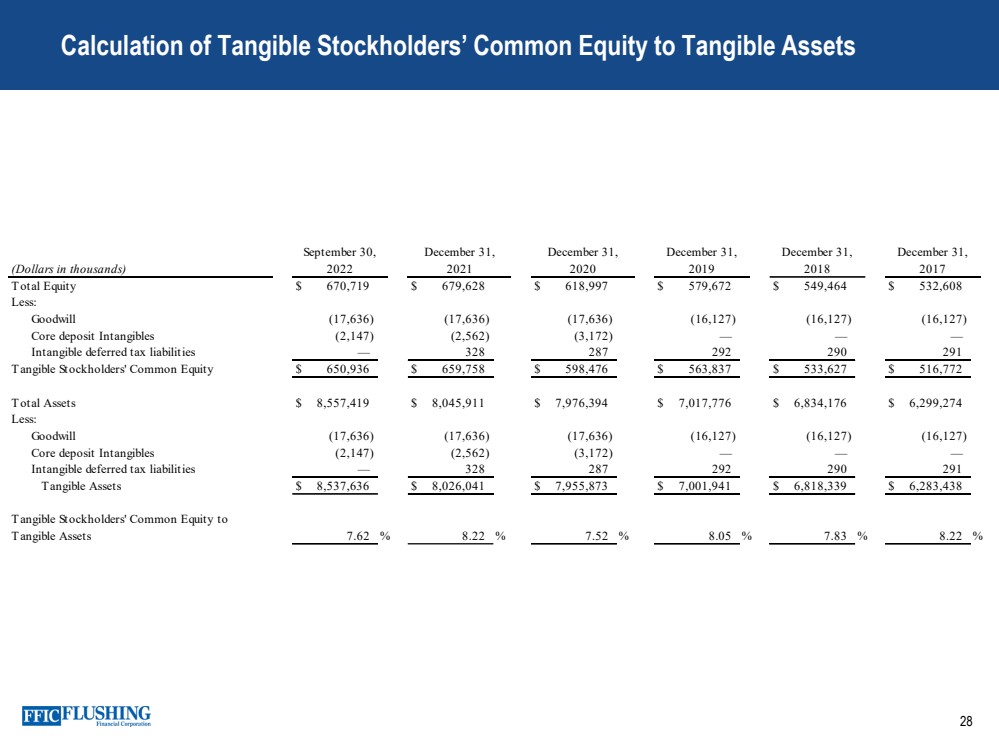
| 28 Calculation of Tangible Stockholders’ Common Equity to Tangible Assets (Dollars in thousands) Total Equity $ 670,719 $ 679,628 $ 618,997 $ 579,672 $ 549,464 $ 532,608 Less: Goodwill (17,636) (17,636) (17,636) (16,127) (16,127) (16,127) Core deposit Intangibles (2,147) (2,562) (3,172) — — — Intangible deferred tax liabilities — 328 287 292 290 291 Tangible Stockholders' Common Equity $ 650,936 $ 659,758 $ 598,476 $ 563,837 $ 533,627 $ 516,772 Total Assets $ 8,557,419 $ 8,045,911 $ 7,976,394 $ 7,017,776 $ 6,834,176 $ 6,299,274 Less: Goodwill (17,636) (17,636) (17,636) (16,127) (16,127) (16,127) Core deposit Intangibles (2,147) (2,562) (3,172) — — — Intangible deferred tax liabilities — 328 287 292 290 291 Tangible Assets $ 8,537,636 $ 8,026,041 $ 7,955,873 $ 7,001,941 $ 6,818,339 $ 6,283,438 Tangible Stockholders' Common Equity to Tangible Assets 7.62 % 8.22 % 7.52 % 8.05 % 7.83 % 8.22 % September 30, 2022 December 31, 2021 December 31, December 31, December 31, December 31, 2017 2018 2019 2020 |
| Contact Details Susan K. Cullen SEVP, CFO & Treasurer Phone: (718) 961 - 5400 Email: scullen@flushingbank.com Al Savastano, CFA Director of Investor Relations Phone: (516) 820 - 1146 Email: asavastano@flushingbank.com 29 |