| Borex Capital Investor Meetings February 7 - 9, 2023 |

| Safe Harbor Statement “Safe Harbor” Statement under the Private Securities Litigation Reform Act of 1995 : Statements in this Presentation relating to plans, strategies, economic performance and trends, projections of results of specific activities or investments and other statements that are not descriptions of historical facts may be forward - looking statements within the meaning of the Private Securities Litigation Reform Act of 1995 , Section 27 A of the Securities Act of 1933 and Section 21 E of the Securities Exchange Act of 1934 .. Forward - looking information is inherently subject to risks and uncertainties, and actual results could differ materially from those currently anticipated due to a number of factors, which include, but are not limited to, risk factors discussed in the Company’s Annual Report on Form 10 - K for the fiscal year ended December 31 , 2021 and in other documents filed by the Company with the Securities and Exchange Commission from time to time .. Forward - looking statements may be identified by terms such as “may”, “will”, “should”, “could”, “expects”, “plans”, “intends”, “anticipates”, “believes”, “estimates”, “predicts”, “forecasts”, “goals”, “potential” or “continue” or similar terms or the negative of these terms .. Although we believe that the expectations reflected in the forward - looking statements are reasonable, we cannot guarantee future results, levels of activity, performance or achievements .. The Company has no obligation to update these forward - looking statements .. 2 |
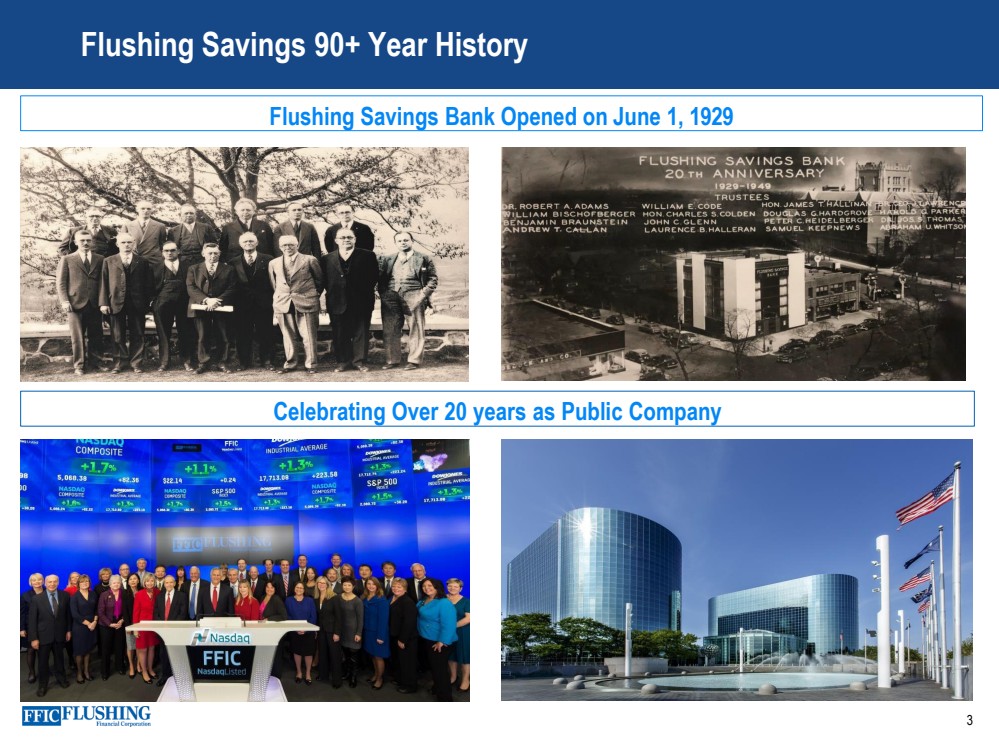
| Flushing Savings 90+ Year History Celebrating Over 20 years as Public Company Flushing Savings Bank Opened on June 1, 1929 3 |
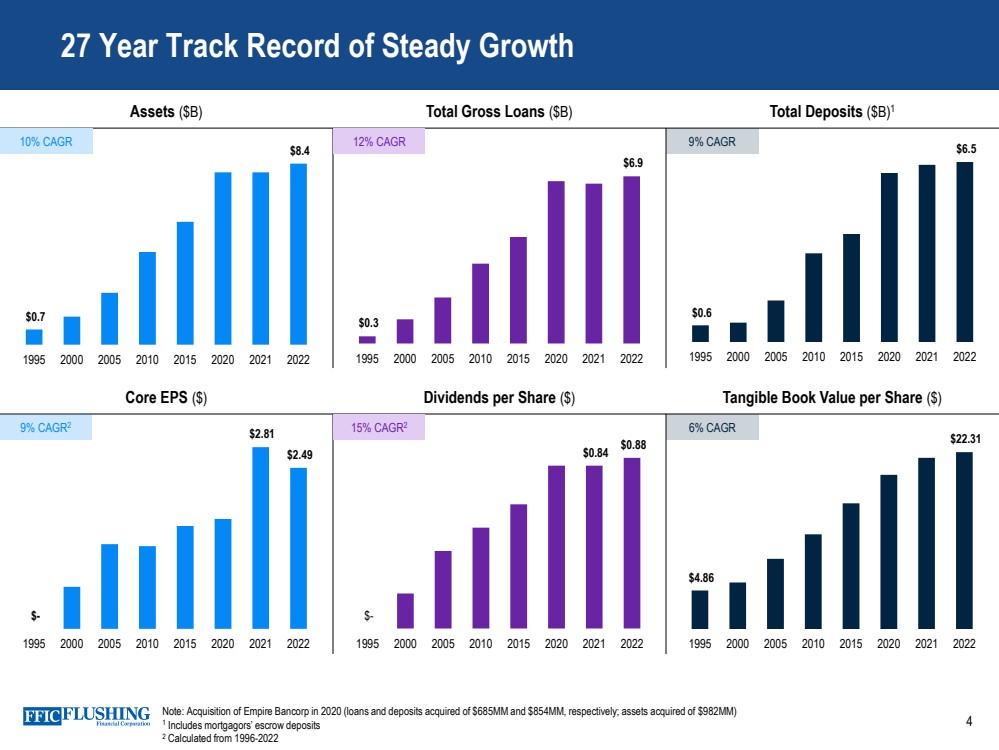
| 27 Year Track Record of Steady Growth Core EPS ($) Dividends per Share ($) Tangible Book Value per Share ($) Assets ($B) Total Gross Loans ($B) Total Deposits ($B) 1 $ - $0.84 $0.88 1995 2000 2005 2010 2015 2020 2021 2022 $ - $2.81 $2.49 1995 2000 2005 2010 2015 2020 2021 2022 $0.6 $6.5 1995 2000 2005 2010 2015 2020 2021 2022 $0.3 $6.9 1995 2000 2005 2010 2015 2020 2021 2022 $0.7 $8.4 1995 2000 2005 2010 2015 2020 2021 2022 10% CAGR 9% CAGR 12% CAGR 9% CAGR 2 15% CAGR 2 $4.86 $22.31 1995 2000 2005 2010 2015 2020 2021 2022 6% CAGR Note: Acquisition of Empire Bancorp in 2020 (loans and deposits acquired of $685MM and $854MM, respectively; assets acquired of $982MM) 1 Includes mortgagors’ escrow deposits 2 Calculated from 1996 - 2022 4 |
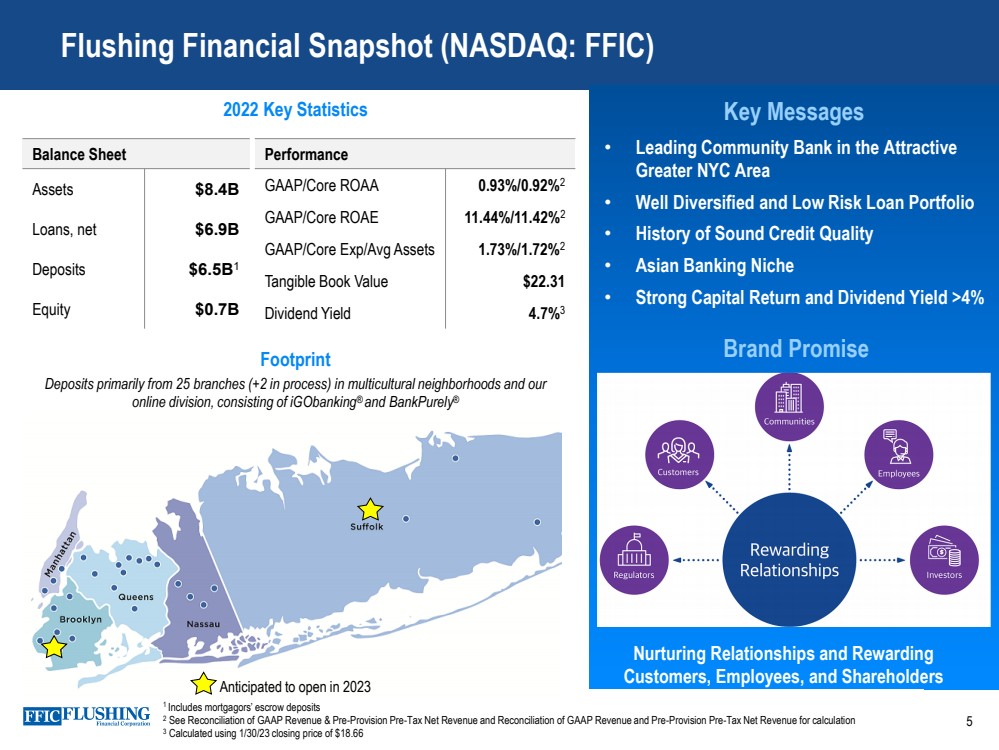
| Flushing Financial Snapshot (NASDAQ: FFIC) Key Messages Balance Sheet Assets $8.4B Loans, net $6.9B Deposits $6.5B 1 Equity $0.7B Performance GAAP/Core ROAA 0.93%/0.92% 2 GAAP/Core ROAE 11.44%/11.42% 2 GAAP/Core Exp/Avg Assets 1.73%/1.72% 2 Tangible Book Value $22.31 Dividend Yield 4.7% 3 2022 Key Statistics Footprint Deposits primarily from 25 branches (+2 in process) in multicultural neighborhoods and our online division, consisting of iGObanking ® and BankPurely ® • Leading Community Bank in the Attractive Greater NYC Area • Well Diversified and Low Risk Loan Portfolio • History of Sound Credit Quality • Asian Banking Niche • Strong Capital Return and Dividend Yield >4% 1 Includes mortgagors’ escrow deposits 2 See Reconciliation of GAAP Revenue & Pre - Provision Pre - Tax Net Revenue and Reconciliation of GAAP Revenue and Pre - Provision Pre - Tax Net Revenue for calculation 3 Calculated using 1/30/23 closing price of $18.66 Brand Promise Nurturing Relationships and Rewarding Customers, Employees, and Shareholders Anticipated to open in 2023 5 |
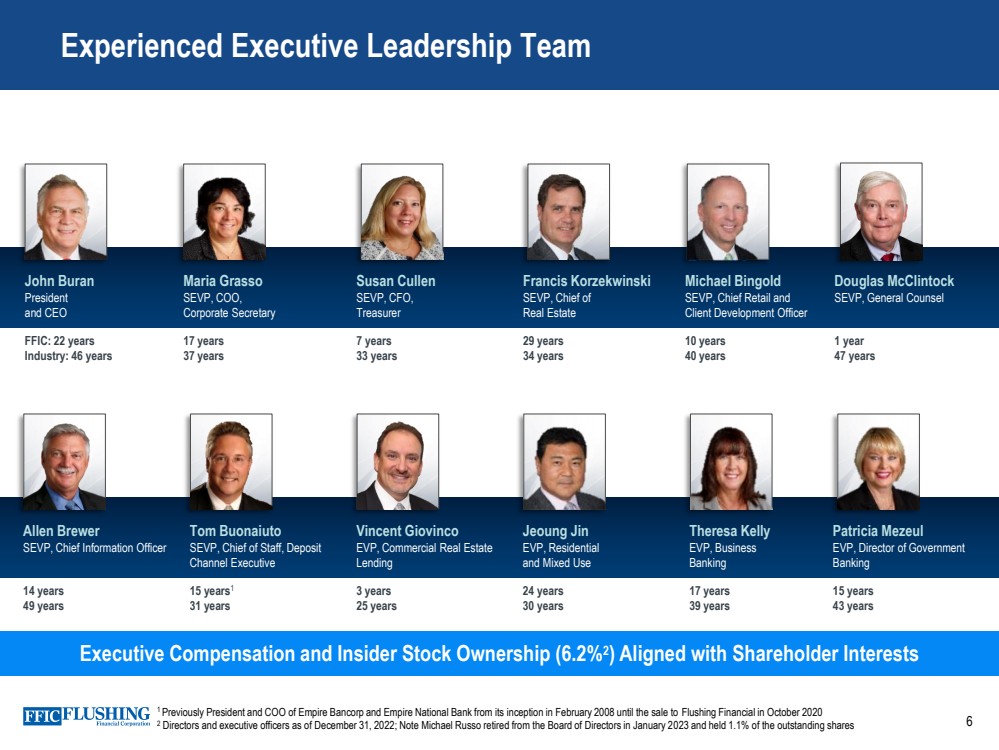
| Experienced Executive Leadership Team Executive Compensation and Insider Stock Ownership (6.2% 2 ) Aligned with Shareholder Interests John Buran President and CEO Maria Grasso SEVP, COO, Corporate Secretary Susan Cullen SEVP, CFO, Treasurer Francis Korzekwinski SEVP, Chief of Real Estate Michael Bingold SEVP, Chief Retail and Client Development Officer Douglas McClintock SEVP, General Counsel FFIC: 22 years Industry: 46 years 17 years 37 years 7 years 33 years 29 years 34 years 10 years 40 years 1 year 47 years Allen Brewer SEVP, Chief Information Officer Tom Buonaiuto SEVP, Chief of Staff, Deposit Channel Executive Vincent Giovinco EVP, Commercial Real Estate Lending Jeoung Jin EVP, Residential and Mixed Use Theresa Kelly EVP, Business Banking Patricia Mezeul EVP, Director of Government Banking 14 years 49 years 15 years 1 31 years 3 years 25 years 24 years 30 years 17 years 39 years 15 years 43 years 1 Previously President and COO of Empire Bancorp and Empire National Bank from its inception in February 2008 until the sale to Fl ushing Financial in October 2020 2 Directors and executive officers as of December 31, 2022; Note Michael Russo retired from the Board of Directors in January 2 02 3 and held 1.1% of the outstanding shares 6 |
| Delivering Rewarding Relationships Building Relationships Across All Stakeholders 7 |

| Long - standing History of Giving Back to the Communities Our Asian Bank Supports Business Growth 8 |

| ▪ Signed Lease for Bensonhurst Branch Expanding our Asian Banking Footprint ▪ Maintained Investment Grade Rating by Kroll Bond Rating Agency, Inc. ▪ Presented Sponsorship Check to Queens Borough President Tech + Innovation Challenge ▪ Assisting to help transform Queens into a leading hub of innovation and technology ▪ Attended Ribbon Cutting Ceremony for Charles B. Wang Community Health Center ▪ Flushing Bank was a significant participant in the financing of the health center Key Events During 4Q22 9 |

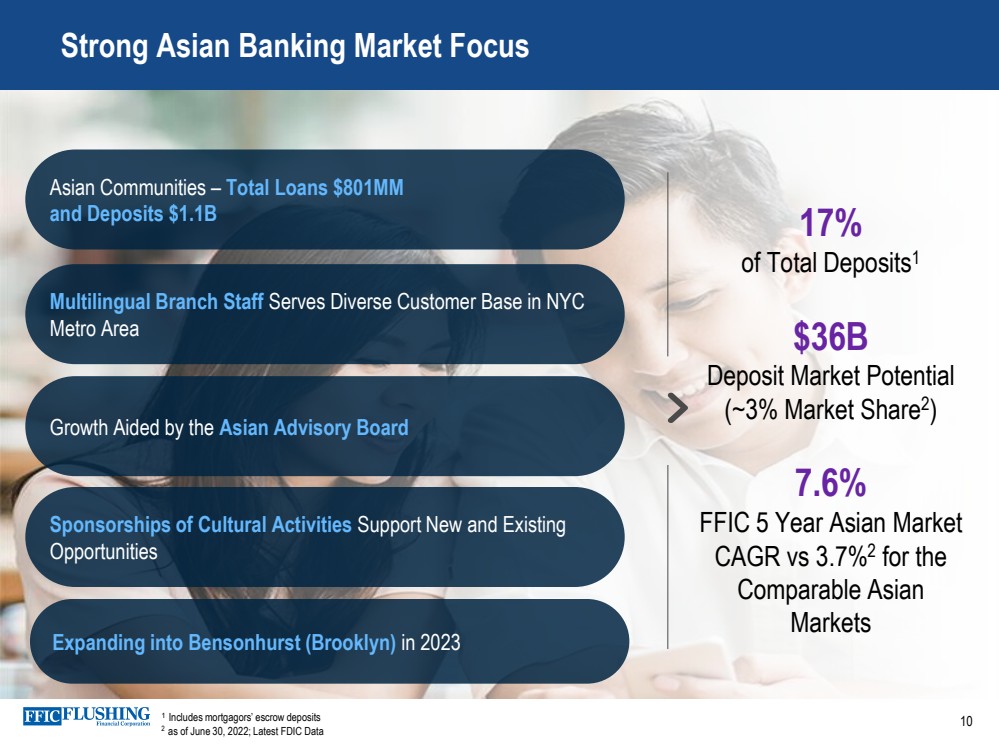
| Strong Asian Banking Market Focus 17% of Total Deposits 1 $36B Deposit Market Potential (~3% Market Share 2 ) 7.6% FFIC 5 Year Asian Market CAGR vs 3.7% 2 for the Comparable Asian Markets Asian Communities – Total Loans $801MM and Deposits $1.1B Multilingual Branch Staff Serves Diverse Customer Base in NYC Metro Area Growth Aided by the Asian Advisory Board Sponsorships of Cultural Activities Support New and Existing Opportunities 1 Includes mortgagors’ escrow deposits 2 as of June 30, 2022; Latest FDIC Data Expanding into Bensonhurst (Brooklyn) in 2023 10 |
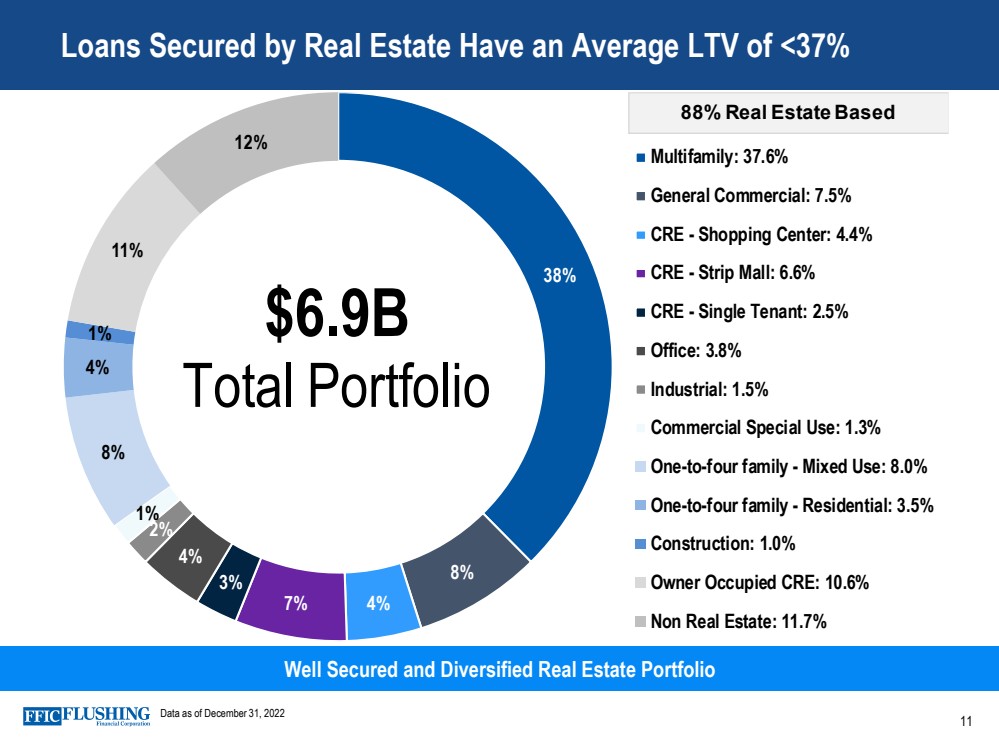
| Loans Secured by Real Estate Have an Average LTV of <37% Well Secured and Diversified Real Estate Portfolio Data as of December 31, 2022 38% 8% 4% 7% 3% 4% 2% 1% 8% 4% 1% 11% 12% Multifamily: 37.6% General Commercial: 7.5% CRE - Shopping Center: 4.4% CRE - Strip Mall: 6.6% CRE - Single Tenant: 2.5% Office: 3.8% Industrial: 1.5% Commercial Special Use: 1.3% One-to-four family - Mixed Use: 8.0% One-to-four family - Residential: 3.5% Construction: 1.0% Owner Occupied CRE: 10.6% Non Real Estate: 11.7% $6.9B Total Portfolio 88% Real Estate Based 11 |
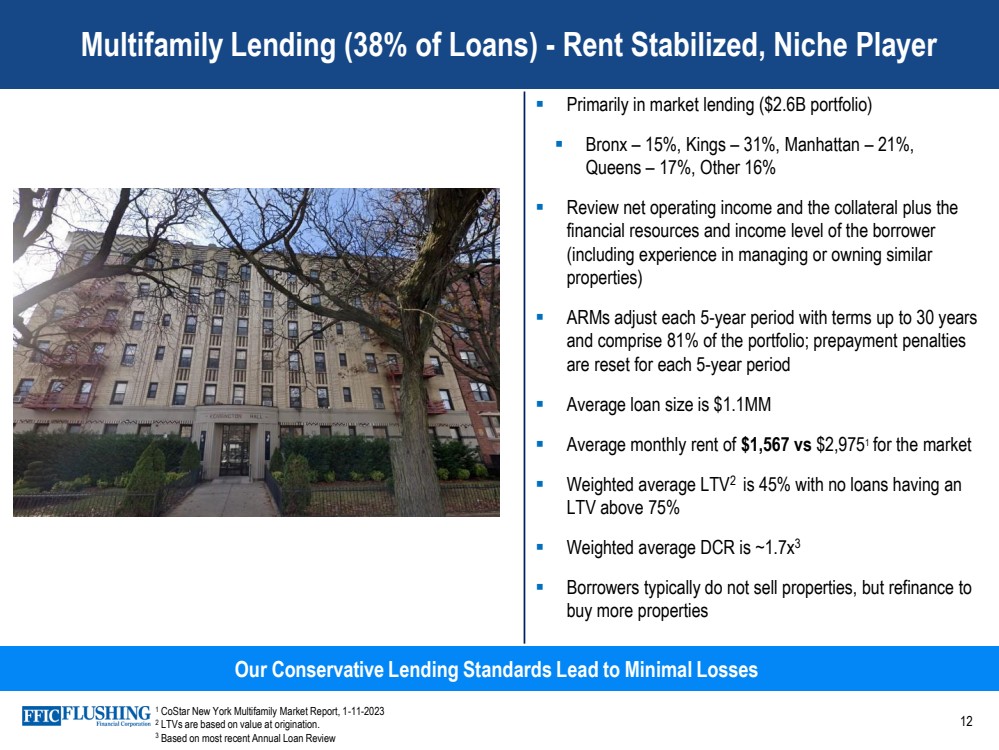
| Multifamily Lending ( 38% of Loans) - Rent Stabilized, Niche Player Our Conservative Lending Standards Lead to Minimal Losses ▪ Primarily in market lending ($2.6B portfolio) ▪ Bronx – 15%, Kings – 31%, Manhattan – 21%, Queens – 17%, Other 16% ▪ Review net operating income and the collateral plus the financial resources and income level of the borrower (including experience in managing or owning similar properties) ▪ ARMs adjust each 5 - year period with terms up to 30 years and comprise 81% of the portfolio; prepayment penalties are reset for each 5 - year period ▪ Average loan size is $1.1MM ▪ Average monthly rent of $1,567 vs $2,975 1 for the market ▪ Weighted average LTV 2 is 45% with no loans having an LTV above 75% ▪ Weighted average DCR is ~1.7x 3 ▪ Borrowers typically do not sell properties, but refinance to buy more properties 1 CoStar New York Multifamily Market Report, 1 - 11 - 2023 2 LTVs are based on value at origination. 3 Based on most recent Annual Loan Review 12 |
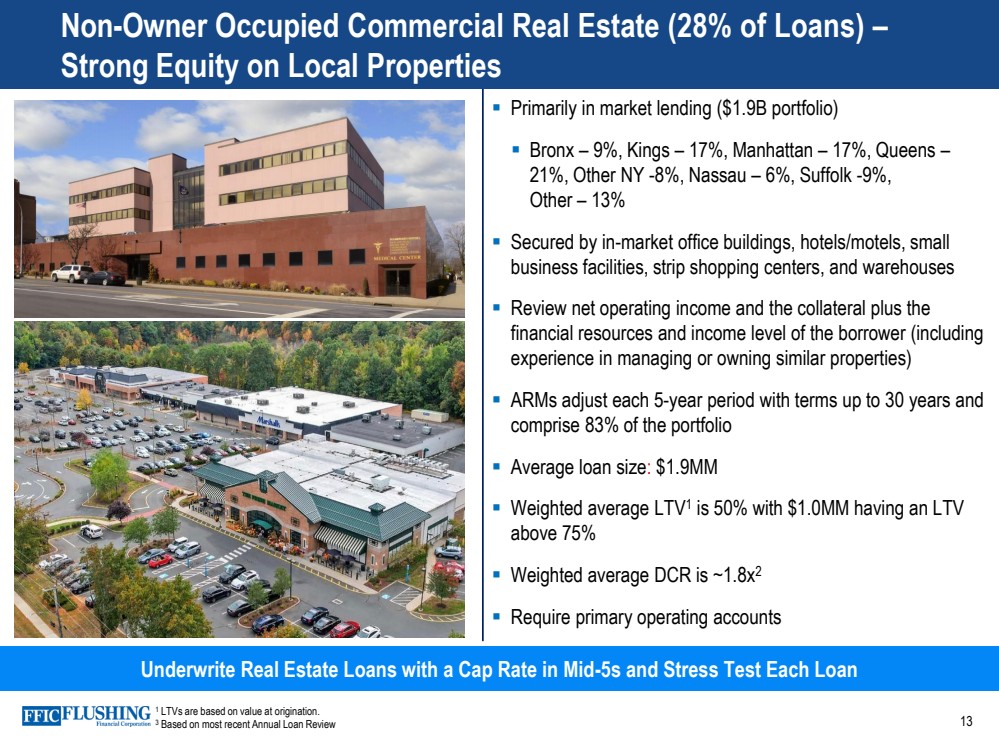
| Non - Owner Occupied Commercial Real Estate (28% of Loans) – Strong Equity on Local Properties Underwrite Real Estate Loans with a Cap Rate in Mid - 5s and Stress Test Each Loan ▪ Primarily in market lending ($1.9B portfolio) ▪ Bronx – 9%, Kings – 17%, Manhattan – 17%, Queens – 21%, Other NY - 8%, Nassau – 6%, Suffolk - 9%, Other – 13% ▪ Secured by in - market office buildings, hotels/motels, small business facilities, strip shopping centers, and warehouses ▪ Review net operating income and the collateral plus the financial resources and income level of the borrower (including experience in managing or owning similar properties) ▪ ARMs adjust each 5 - year period with terms up to 30 years and comprise 83% of the portfolio ▪ Average loan size : $1.9MM ▪ Weighted average LTV 1 is 50% with $1.0MM having an LTV above 75% ▪ Weighted average DCR is ~1.8x 2 ▪ Require primary operating accounts 1 LTVs are based on value at origination. 3 Based on most recent Annual Loan Review 13 |
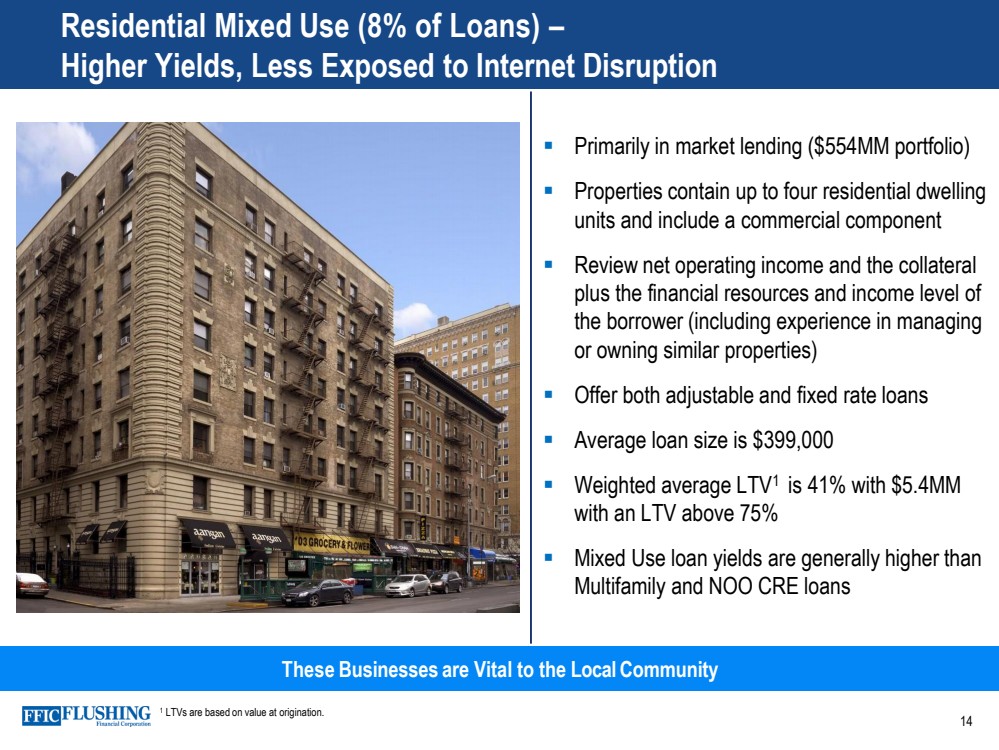
| Residential Mixed Use (8% of Loans) – Higher Yields, Less Exposed to Internet Disruption These Businesses are Vital to the Local Community ▪ Primarily in market lending ($554MM portfolio) ▪ Properties contain up to four residential dwelling units and include a commercial component ▪ Review net operating income and the collateral plus the financial resources and income level of the borrower (including experience in managing or owning similar properties) ▪ Offer both adjustable and fixed rate loans ▪ Average loan size is $399,000 ▪ Weighted average LTV 1 is 41% with $5.4MM with an LTV above 75% ▪ Mixed Use loan yields are generally higher than Multifamily and NOO CRE loans 1 LTVs are based on value at origination. 14 |
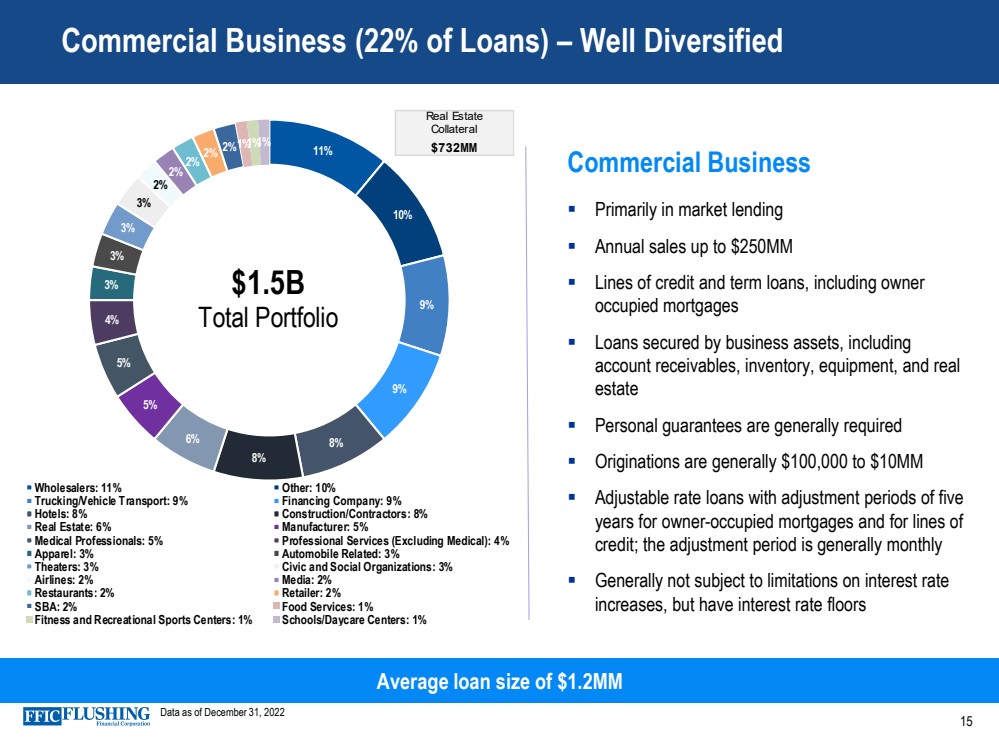
| Commercial Business (22% of Loans) – Well Diversified Commercial Business ▪ Primarily in market lending ▪ Annual sales up to $250MM ▪ Lines of credit and term loans, including owner occupied mortgages ▪ Loans secured by business assets, including account receivables, inventory, equipment, and real estate ▪ Personal guarantees are generally required ▪ Originations are generally $100,000 to $10MM ▪ Adjustable rate loans with adjustment periods of five years for owner - occupied mortgages and for lines of credit; the adjustment period is generally monthly ▪ Generally not subject to limitations on interest rate increases, but have interest rate floors Average loan size of $1.2MM Data as of December 31, 2022 11% 10% 9% 9% 8% 8% 6% 5% 5% 4% 3% 3% 3% 3% 2% 2% 2% 2% 2% 1% 1% 1% Wholesalers: 11% Other: 10% Trucking/Vehicle Transport: 9% Financing Company: 9% Hotels: 8% Construction/Contractors: 8% Real Estate: 6% Manufacturer: 5% Medical Professionals: 5% Professional Services (Excluding Medical): 4% Apparel: 3% Automobile Related: 3% Theaters: 3% Civic and Social Organizations: 3% Airlines: 2% Media: 2% Restaurants: 2% Retailer: 2% SBA: 2% Food Services: 1% Fitness and Recreational Sports Centers: 1% Schools/Daycare Centers: 1% $1.5B Total Portfolio Real Estate Collateral $732 MM 15 |
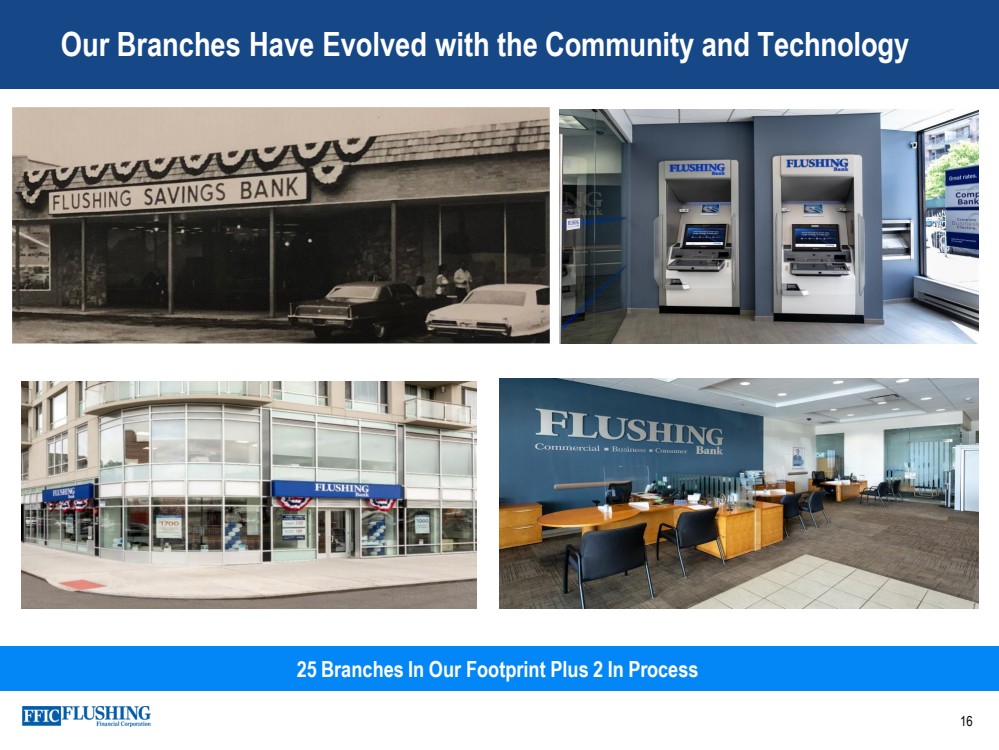
| Our Branches Have Evolved with the Community and Technology 25 Branches In Our Footprint Plus 2 In Process 16 |
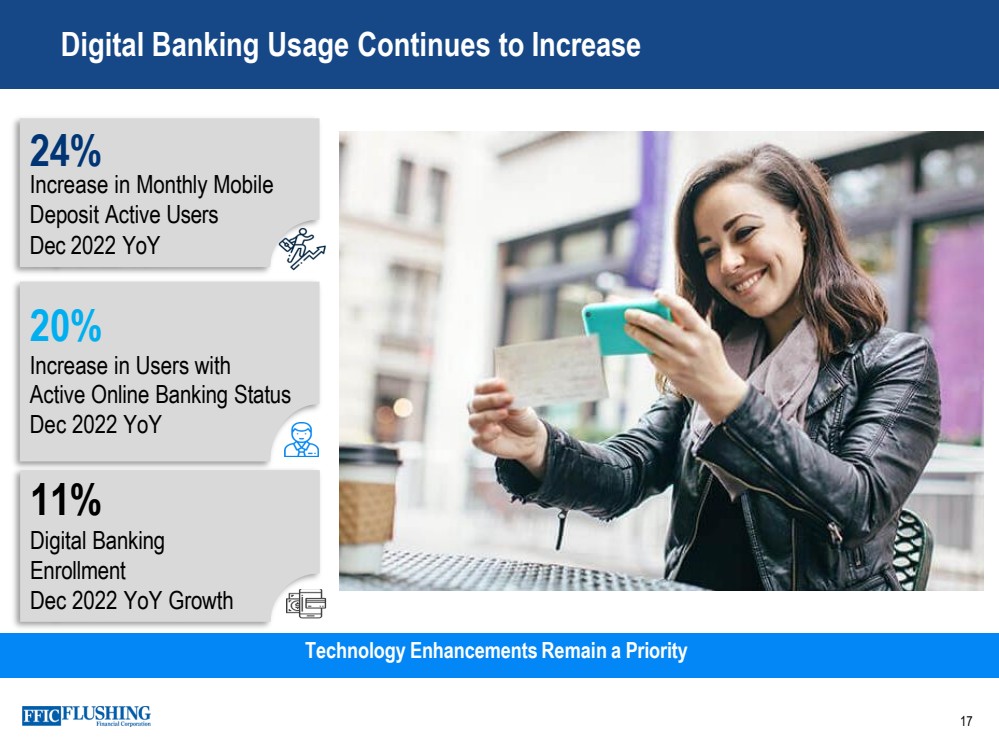
| Digital Banking Usage Continues to Increase 2 4 % Increase in Monthly Mobile Deposit Active Users Dec 2022 YoY 20% Increase in Users with Active Online Banking Status Dec 2022 YoY 11% Digital Banking Enrollment Dec 2022 YoY Growth Technology Enhancements Remain a Priority 17 |
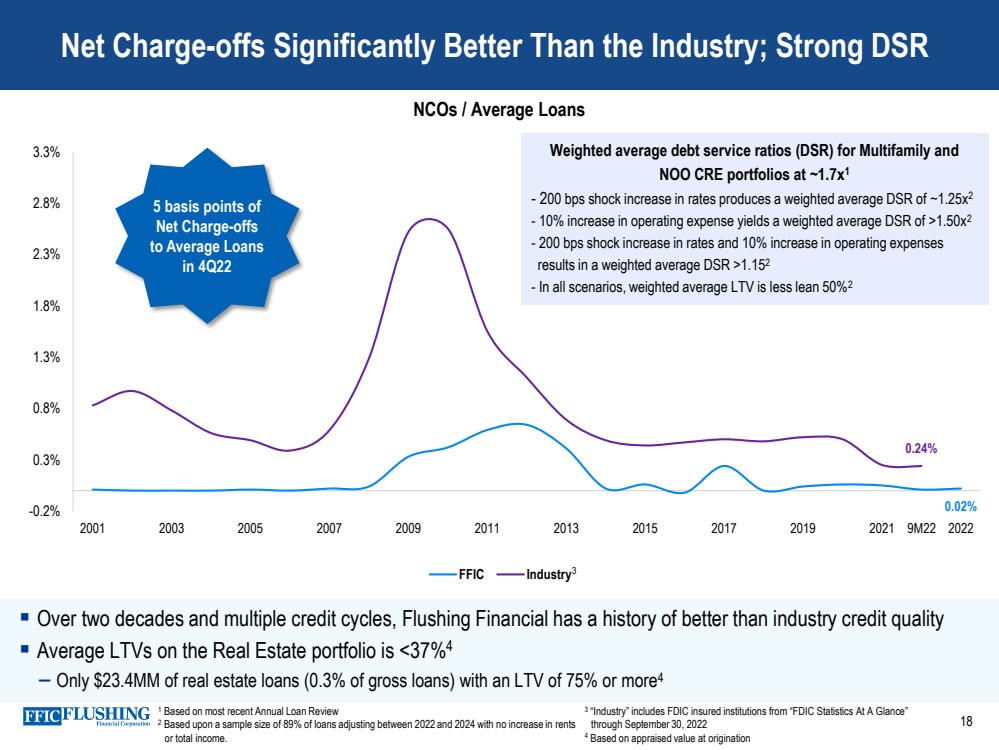
| ▪ Over two decades and multiple credit cycles, Flushing Financial has a history of better than industry credit quality ▪ Average LTVs on the Real Estate portfolio is <37% 4 – Only $23.4MM of real estate loans (0.3% of gross loans) with an LTV of 75% or more 4 Net Charge - offs Significantly Better Than the Industry; Strong DSR NCOs / Average Loans 0.02% 0.24% -0.2% 0.3% 0.8% 1.3% 1.8% 2.3% 2.8% 3.3% 2001 2003 2005 2007 2009 2011 2013 2015 2017 2019 2021 2022 FFIC Industry 5 basis points of Net Charge - offs to Average Loans in 4Q22 9M22 Weighted average debt service ratios (DSR) for Multifamily and NOO CRE portfolios at ~1.7x 1 - 2 00 bps shock increase in rates produces a weighted average DSR of ~1.25x 2 - 10% increase in operating expense yields a weighted average DSR of >1.50x 2 - 200 bps shock increase in rates and 10% increase in operating expenses results in a weighted average DSR >1.15 2 - In all scenarios, weighted average LTV is less lean 50% 2 3 1 Based on most recent Annual Loan Review 2 Based upon a sample size of 89% of loans adjusting between 2022 and 2024 with no increase in rents or total income. 3 “Industry” includes FDIC insured institutions from “FDIC Statistics At A Glance” through September 30, 2022 4 Based on appraised value at origination 18 |
| Takeaways Conservative Underwriting with History of Solid Value Creation ► Leading Community Bank in the Greater NYC Area ► Experienced Management Team ► Serving All Communities; Including Asian Banking Niche ► Well Diversified and Low Risk Loan Portfolio ► Embracing and Expanding Digital and Mobile Capabilities ► History of Sound Credit Quality since IPO in 1995 ► 4. 7 % 1 Dividend Yield 1 Based on 1/ 30 /2 3 closing price of $ 18.66 19 |
| Appendix 20 |

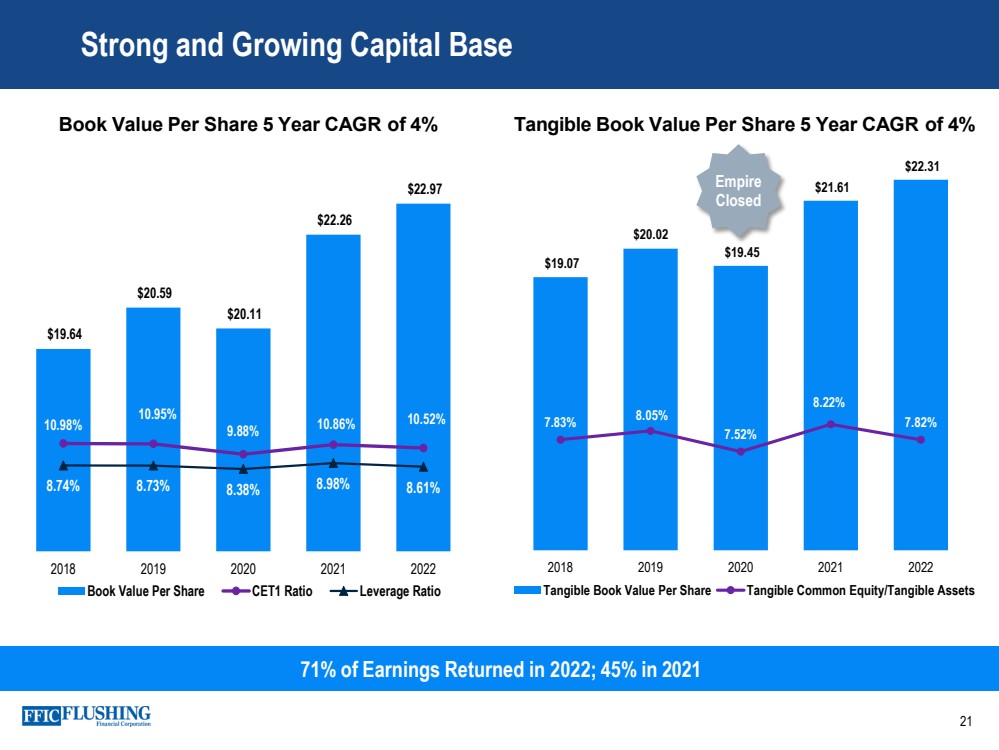
| Strong and Growing Capital Base 71 % of Earnings Returned in 2022; 45% in 2021 Book Value Per Share 5 Year CAGR of 4% Tangible Book Value Per Share 5 Year CAGR of 4% $19.64 $20.59 $20.11 $22.26 $22.97 10.98% 10.95% 9.88% 10.86% 10.52% 8.74% 8.73% 8.38% 8.98% 8.61% 0.00% 5.00% 10.00% 15.00% 20.00% 25.00% 30.00% 35.00% 40.00% $15.00 $16.00 $17.00 $18.00 $19.00 $20.00 $21.00 $22.00 $23.00 $24.00 2018 2019 2020 2021 2022 Book Value Per Share CET1 Ratio Leverage Ratio $19.07 $20.02 $19.45 $21.61 $22.31 7.83% 8.05% 7.52% 8.22% 7.82% 5.00% 6.00% 7.00% 8.00% 9.00% 10.00% 11.00% 12.00% 13.00% 14.00% 15.00% $10.00 $12.00 $14.00 $16.00 $18.00 $20.00 $22.00 2018 2019 2020 2021 2022 Tangible Book Value Per Share Tangible Common Equity/Tangible Assets Empire Closed 21 |
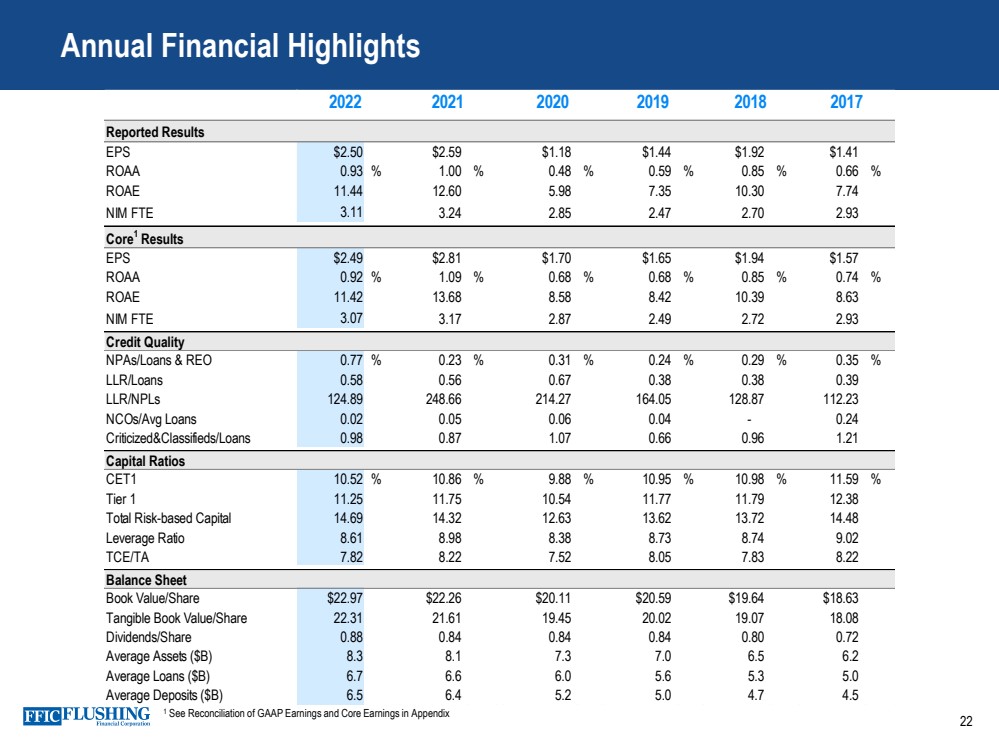
| Annual Financial Highlights Reported Results EPS $2.50 $2.59 $1.18 $1.44 $1.92 $1.41 ROAA 0.93 % 1.00 % 0.48 % 0.59 % 0.85 % 0.66 % ROAE 11.44 12.60 5.98 7.35 10.30 7.74 NIM FTE 3.11 3.24 2.85 2.47 2.70 2.93 Core 1 Results EPS $2.49 $2.81 $1.70 $1.65 $1.94 $1.57 ROAA 0.92 % 1.09 % 0.68 % 0.68 % 0.85 % 0.74 % ROAE 11.42 13.68 8.58 8.42 10.39 8.63 NIM FTE 3.07 3.17 2.87 2.49 2.72 2.93 Credit Quality NPAs/Loans & REO 0.77 % 0.23 % 0.31 % 0.24 % 0.29 % 0.35 % LLR/Loans 0.58 0.56 0.67 0.38 0.38 0.39 LLR/NPLs 124.89 248.66 214.27 164.05 128.87 112.23 NCOs/Avg Loans 0.02 0.05 0.06 0.04 - 0.24 Criticized&Classifieds/Loans 0.98 0.87 1.07 0.66 0.96 1.21 Capital Ratios CET1 10.52 % 10.86 % 9.88 % 10.95 % 10.98 % 11.59 % Tier 1 11.25 11.75 10.54 11.77 11.79 12.38 Total Risk-based Capital 14.69 14.32 12.63 13.62 13.72 14.48 Leverage Ratio 8.61 8.98 8.38 8.73 8.74 9.02 TCE/TA 7.82 8.22 7.52 8.05 7.83 8.22 Balance Sheet Book Value/Share $22.97 $22.26 $20.11 $20.59 $19.64 $18.63 Tangible Book Value/Share 22.31 21.61 19.45 20.02 19.07 18.08 Dividends/Share 0.88 0.84 0.84 0.84 0.80 0.72 Average Assets ($B) 8.3 8.1 7.3 7.0 6.5 6.2 Average Loans ($B) 6.7 6.6 6.0 5.6 5.3 5.0 Average Deposits ($B) 6.5 6.4 5.2 5.0 4.7 4.5 2017 2021 2018 2022 2020 2019 1 See Reconciliation of GAAP Earnings and Core Earnings in Appendix 22 |
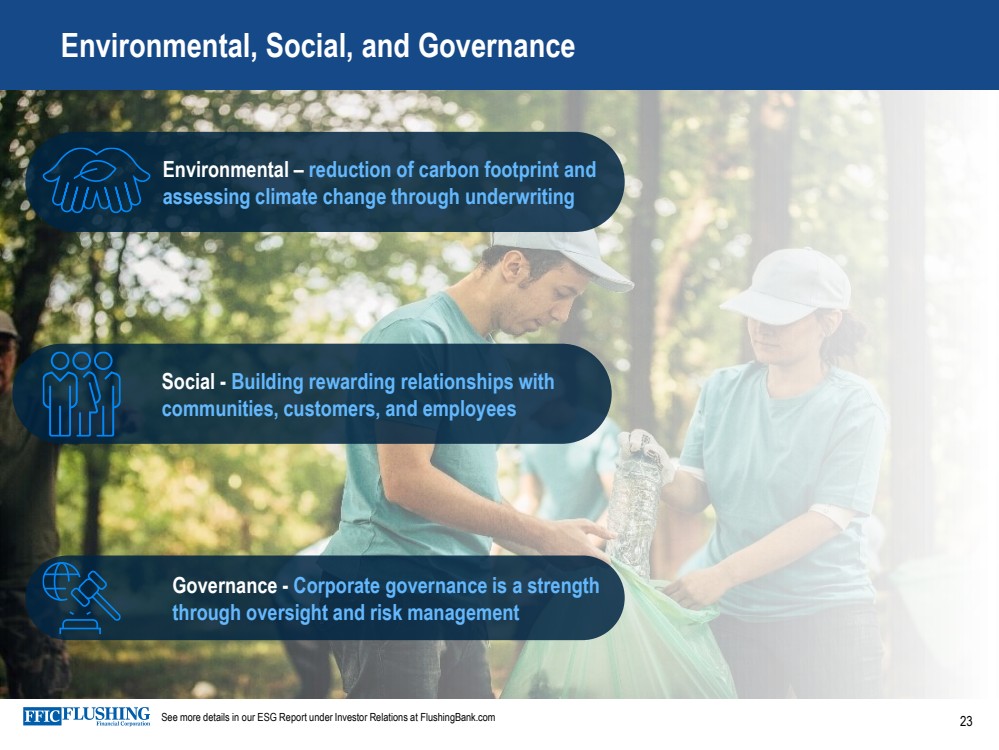
| Environmental, Social, and Governance Environmental – reduction of carbon footprint and assessing climate change through underwriting Social - Building rewarding relationships with communities, customers, and employees See more details in our ESG Report under Investor Relations at FlushingBank.com Governance - Corporate governance is a strength through oversight and risk management 23 |
| Reconciliation of GAAP Earnings and Core Earnings Non - cash Fair Value Adjustments to GAAP Earnings The variance in GAAP and core earnings is partly driven by the impact of non - cash net gains and losses from fair value adjustments .. These fair value adjustments relate primarily to borrowing carried at fair value under the fair value option and swaps designated to protect against rising rates .. As the swaps get closer to maturity, the volatility in fair value adjustments will dissipate .. In a rising interest rate environment or a steepening of the yield curve, the loss position would experience an improvement .. In a declining interest rate environment, the movement in the curve exaggerates our mark - to - market loss position .. Core Net Income, Core Diluted EPS, Core ROAE, Core ROAA, Pre - provision, Pre - tax Net Revenue, Core Net Interest Income FTE, Core Net Interest Margin FTE, Core Interest Income and Yield on Total Loans, Core Noninterest Income, Core Noninterest Expense and Tangible Book Value per common share are each non - GAAP measures used in this presentation .. A reconciliation to the most directly comparable GAAP financial measures appears below in tabular form .. The Company believes that these measures are useful for both investors and management to understand the effects of certain interest and noninterest items and provide an alternative view of the Company's performance over time and in comparison to the Company's competitors .. These measures should not be viewed as a substitute for net income .. The Company believes that tangible book value per common share is useful for both investors and management as these are measures commonly used by financial institutions, regulators and investors to measure the capital adequacy of financial institutions .. The Company believes these measures facilitate comparison of the quality and composition of the Company's capital over time and in comparison to its competitors .. These measures should not be viewed as a substitute for total shareholders' equity .. These non - GAAP measures have inherent limitations, are not required to be uniformly applied and are not audited .. They should not be considered in isolation or as a substitute for analysis of results reported under GAAP .. These non - GAAP measures may not be comparable to similarly titled measures reported by other companies .. 24 |
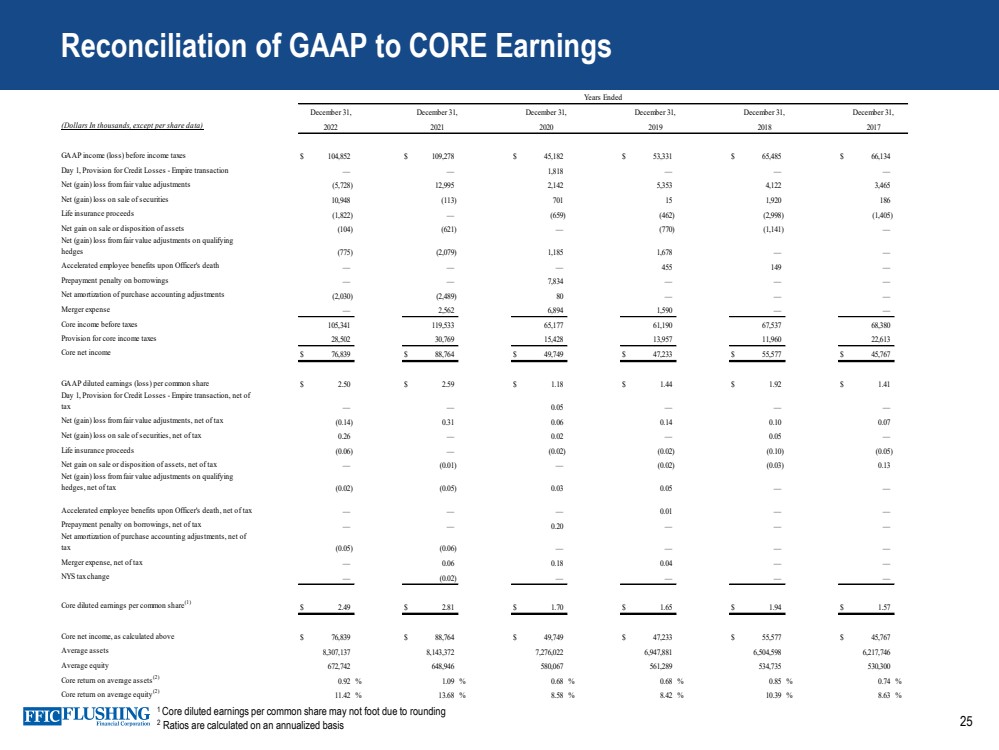
| Reconciliation of GAAP to CORE Earnings (Dollars In thousands, except per share data) GAAP income (loss) before income taxes $ 104,852 $ 109,278 $ 45,182 $ 53,331 $ 65,485 $ 66,134 Day 1, Provision for Credit Losses - Empire transaction — — 1,818 — — — Net (gain) loss from fair value adjustments (5,728) 12,995 2,142 5,353 4,122 3,465 Net (gain) loss on sale of securities 10,948 (113) 701 15 1,920 186 Life insurance proceeds (1,822) — (659) (462) (2,998) (1,405) Net gain on sale or disposition of assets (104) (621) — (770) (1,141) — Net (gain) loss from fair value adjustments on qualifying hedges (775) (2,079) 1,185 1,678 — — Accelerated employee benefits upon Officer's death — — — 455 149 — Prepayment penalty on borrowings — — 7,834 — — — Net amortization of purchase accounting adjustments (2,030) (2,489) 80 — — — Merger expense — 2,562 6,894 1,590 — — Core income before taxes 105,341 119,533 65,177 61,190 67,537 68,380 Provision for core income taxes 28,502 30,769 15,428 13,957 11,960 22,613 Core net income $ 76,839 $ 88,764 $ 49,749 $ 47,233 $ 55,577 $ 45,767 GAAP diluted earnings (loss) per common share $ 2.50 $ 2.59 $ 1.18 $ 1.44 $ 1.92 $ 1.41 Day 1, Provision for Credit Losses - Empire transaction, net of tax — — 0.05 — — — Net (gain) loss from fair value adjustments, net of tax (0.14) 0.31 0.06 0.14 0.10 0.07 Net (gain) loss on sale of securities, net of tax 0.26 — 0.02 — 0.05 — Life insurance proceeds (0.06) — (0.02) (0.02) (0.10) (0.05) Net gain on sale or disposition of assets, net of tax — (0.01) — (0.02) (0.03) 0.13 Net (gain) loss from fair value adjustments on qualifying hedges, net of tax (0.02) (0.05) 0.03 0.05 — — Accelerated employee benefits upon Officer's death, net of tax — — — 0.01 — — Prepayment penalty on borrowings, net of tax — — 0.20 — — — Net amortization of purchase accounting adjustments, net of tax (0.05) (0.06) — — — — Merger expense, net of tax — 0.06 0.18 0.04 — — NYS tax change — (0.02) — — — — Core diluted earnings per common share (1) $ 2.49 $ 2.81 $ 1.70 $ 1.65 $ 1.94 $ 1.57 Core net income, as calculated above $ 76,839 $ 88,764 $ 49,749 $ 47,233 $ 55,577 $ 45,767 Average assets 8,307,137 8,143,372 7,276,022 6,947,881 6,504,598 6,217,746 Average equity 672,742 648,946 580,067 561,289 534,735 530,300 Core return on average assets (2) 0.92 % 1.09 % 0.68 % 0.68 % 0.85 % 0.74 % Core return on average equity (2) 11.42 % 13.68 % 8.58 % 8.42 % 10.39 % 8.63 % Years Ended December 31, 2019 December 31, 2022 December 31, 2021 December 31, 2020 2018 December 31, December 31, 2017 1 Core diluted earnings per common share may not foot due to rounding 2 Ratios are calculated on an annualized basis 25 |
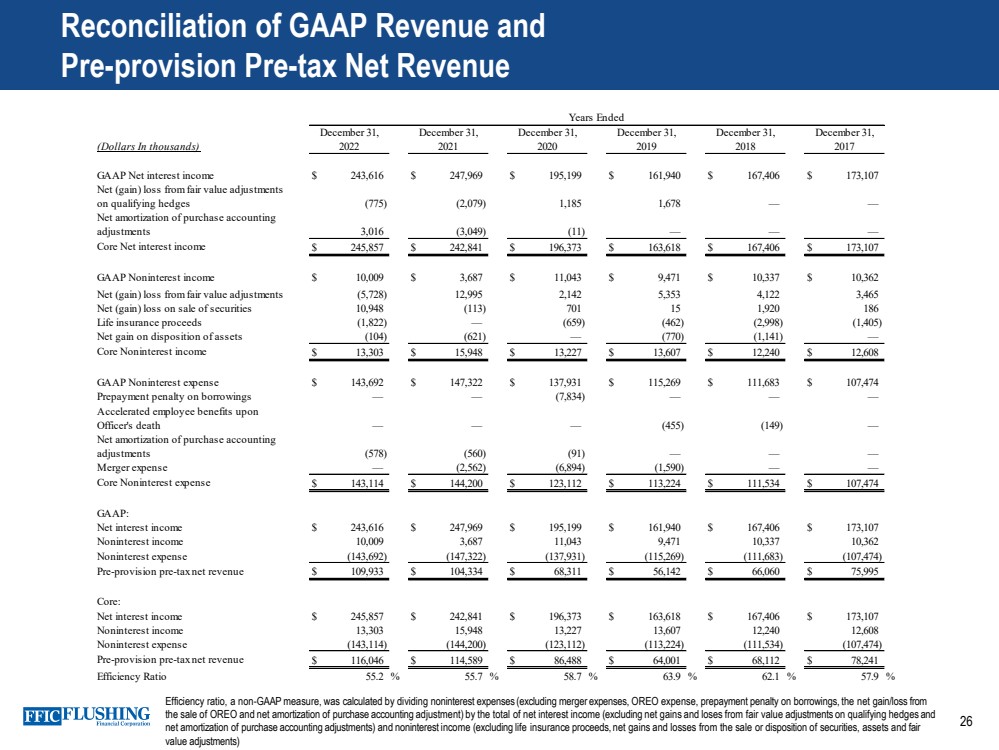
| Reconciliation of GAAP Revenue and Pre - provision Pre - tax Net Revenue (Dollars In thousands) GAAP Net interest income $ 243,616 $ 247,969 $ 195,199 $ 161,940 $ 167,406 $ 173,107 Net (gain) loss from fair value adjustments on qualifying hedges (775) (2,079) 1,185 1,678 — — Net amortization of purchase accounting adjustments 3,016 (3,049) (11) — — — Core Net interest income $ 245,857 $ 242,841 $ 196,373 $ 163,618 $ 167,406 $ 173,107 GAAP Noninterest income $ 10,009 $ 3,687 $ 11,043 $ 9,471 $ 10,337 $ 10,362 Net (gain) loss from fair value adjustments (5,728) 12,995 2,142 5,353 4,122 3,465 Net (gain) loss on sale of securities 10,948 (113) 701 15 1,920 186 Life insurance proceeds (1,822) — (659) (462) (2,998) (1,405) Net gain on disposition of assets (104) (621) — (770) (1,141) — Core Noninterest income $ 13,303 $ 15,948 $ 13,227 $ 13,607 $ 12,240 $ 12,608 GAAP Noninterest expense $ 143,692 $ 147,322 $ 137,931 $ 115,269 $ 111,683 $ 107,474 Prepayment penalty on borrowings — — (7,834) — — — Accelerated employee benefits upon Officer's death — — — (455) (149) — Net amortization of purchase accounting adjustments (578) (560) (91) — — — Merger expense — (2,562) (6,894) (1,590) — — Core Noninterest expense $ 143,114 $ 144,200 $ 123,112 $ 113,224 $ 111,534 $ 107,474 GAAP: Net interest income $ 243,616 $ 247,969 $ 195,199 $ 161,940 $ 167,406 $ 173,107 Noninterest income 10,009 3,687 11,043 9,471 10,337 10,362 Noninterest expense (143,692) (147,322) (137,931) (115,269) (111,683) (107,474) Pre-provision pre-tax net revenue $ 109,933 $ 104,334 $ 68,311 $ 56,142 $ 66,060 $ 75,995 Core: Net interest income $ 245,857 $ 242,841 $ 196,373 $ 163,618 $ 167,406 $ 173,107 Noninterest income 13,303 15,948 13,227 13,607 12,240 12,608 Noninterest expense (143,114) (144,200) (123,112) (113,224) (111,534) (107,474) Pre-provision pre-tax net revenue $ 116,046 $ 114,589 $ 86,488 $ 64,001 $ 68,112 $ 78,241 Efficiency Ratio 55.2 % 55.7 % 58.7 % 63.9 % 62.1 % 57.9 % December 31, 2017 Years Ended December 31, 2019 December 31, 2022 December 31, 2021 December 31, 2020 December 31, 2018 Efficiency ratio, a non - GAAP measure, was calculated by dividing noninterest expenses (excluding merger expenses, OREO expense, prepayment penalty on borrowings, the net gain/loss from the sale of OREO and net amortization of purchase accounting adjustment) by the total of net interest income (excluding net gains and loses from fair value adjustments on qualifying hedges and net amortization of purchase accounting adjustments) and noninterest income (excluding life insurance proceeds, net gains and losses from the sale or disposition of securities, assets and fair value adjustments) 26 |
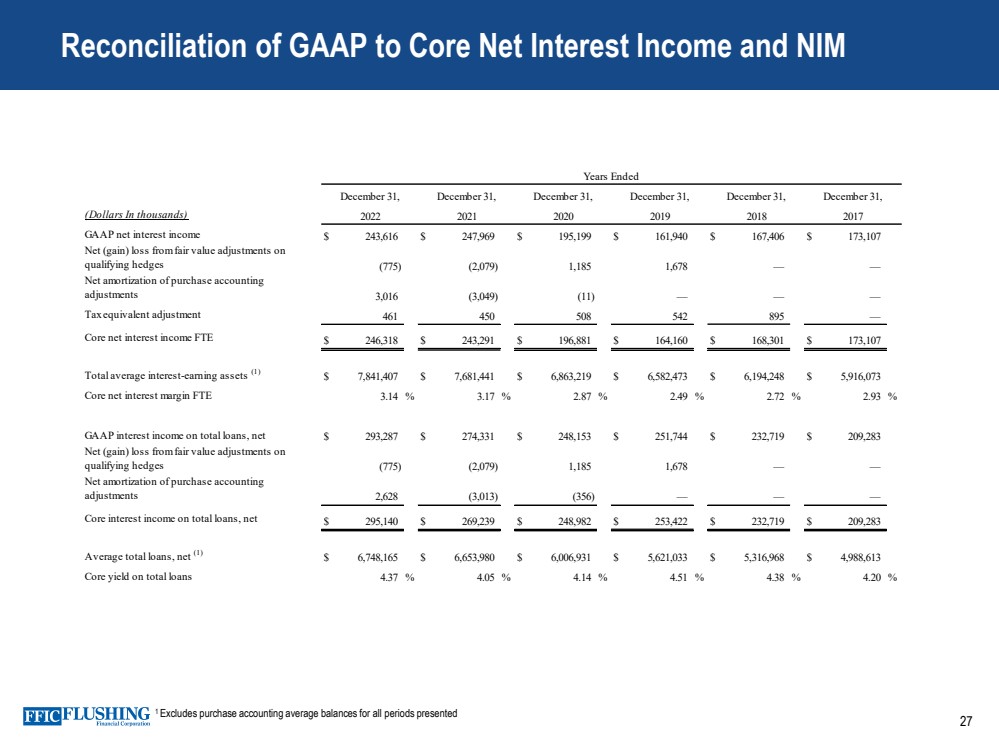
| 1 Excludes purchase accounting average balances for all periods presented Reconciliation of GAAP to Core Net Interest Income and NIM (Dollars In thousands) GAAP net interest income $ 243,616 $ 247,969 $ 195,199 $ 161,940 $ 167,406 $ 173,107 Net (gain) loss from fair value adjustments on qualifying hedges (775) (2,079) 1,185 1,678 — — Net amortization of purchase accounting adjustments 3,016 (3,049) (11) — — — Tax equivalent adjustment 461 450 508 542 895 — Core net interest income FTE $ 246,318 $ 243,291 $ 196,881 $ 164,160 $ 168,301 $ 173,107 Total average interest-earning assets (1) $ 7,841,407 $ 7,681,441 $ 6,863,219 $ 6,582,473 $ 6,194,248 $ 5,916,073 Core net interest margin FTE 3.14 % 3.17 % 2.87 % 2.49 % 2.72 % 2.93 % GAAP interest income on total loans, net $ 293,287 $ 274,331 $ 248,153 $ 251,744 $ 232,719 $ 209,283 Net (gain) loss from fair value adjustments on qualifying hedges (775) (2,079) 1,185 1,678 — — Net amortization of purchase accounting adjustments 2,628 (3,013) (356) — — — Core interest income on total loans, net $ 295,140 $ 269,239 $ 248,982 $ 253,422 $ 232,719 $ 209,283 Average total loans, net (1) $ 6,748,165 $ 6,653,980 $ 6,006,931 $ 5,621,033 $ 5,316,968 $ 4,988,613 Core yield on total loans 4.37 % 4.05 % 4.14 % 4.51 % 4.38 % 4.20 % 2018 December 31, December 31, 2019 December 31, 2022 December 31, 2021 December 31, 2020 December 31, 2017 Years Ended 27 |
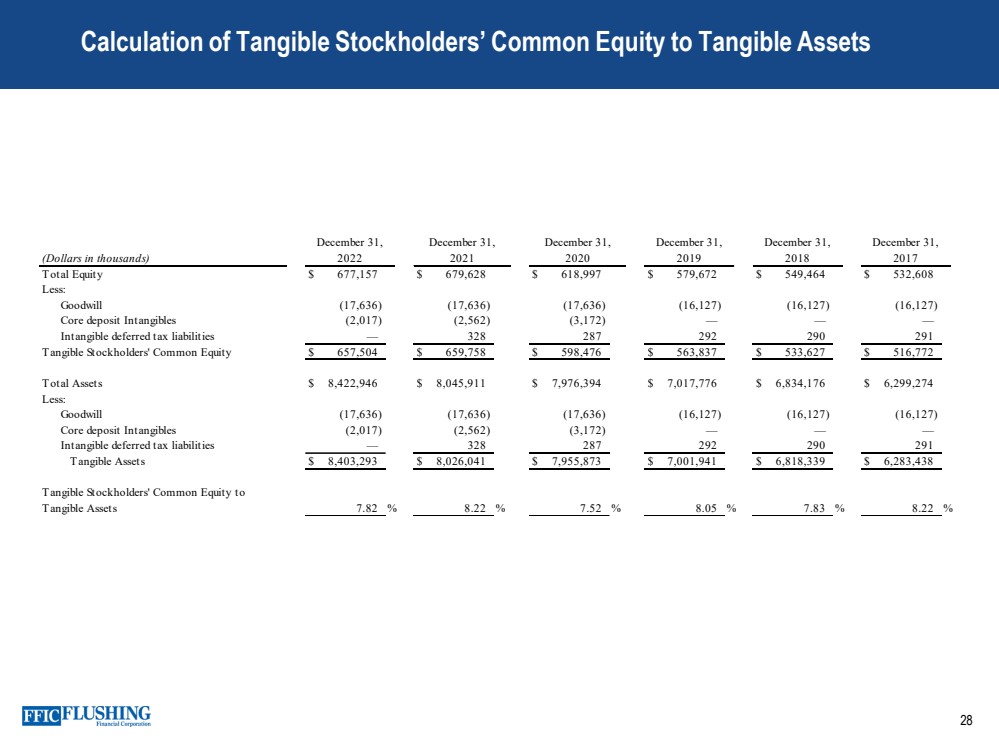
| 28 Calculation of Tangible Stockholders’ Common Equity to Tangible Assets (Dollars in thousands) Total Equity $ 677,157 $ 679,628 $ 618,997 $ 579,672 $ 549,464 $ 532,608 Less: Goodwill (17,636) (17,636) (17,636) (16,127) (16,127) (16,127) Core deposit Intangibles (2,017) (2,562) (3,172) — — — Intangible deferred tax liabilities — 328 287 292 290 291 Tangible Stockholders' Common Equity $ 657,504 $ 659,758 $ 598,476 $ 563,837 $ 533,627 $ 516,772 Total Assets $ 8,422,946 $ 8,045,911 $ 7,976,394 $ 7,017,776 $ 6,834,176 $ 6,299,274 Less: Goodwill (17,636) (17,636) (17,636) (16,127) (16,127) (16,127) Core deposit Intangibles (2,017) (2,562) (3,172) — — — Intangible deferred tax liabilities — 328 287 292 290 291 Tangible Assets $ 8,403,293 $ 8,026,041 $ 7,955,873 $ 7,001,941 $ 6,818,339 $ 6,283,438 Tangible Stockholders' Common Equity to Tangible Assets 7.82 % 8.22 % 7.52 % 8.05 % 7.83 % 8.22 % December 31, 2022 December 31, 2021 December 31, December 31, December 31, December 31, 2017 2018 2019 2020 |
| Contact Details Susan K. Cullen SEVP, CFO & Treasurer Phone: (718) 961 - 5400 Email: scullen@flushingbank.com Al Savastano, CFA Director of Investor Relations Phone: (516) 820 - 1146 Email: asavastano@flushingbank.com 29 |